Article

Fracture Toughness Analysis of Aluminum (Al) Foil and Its Adhesion with Low-Density Polyethylene (LPDE) in the Packing Industry

1
School of Mechanical Engineering, Southeast University, Nanjing 211189, China
2
Department of Mechanical Engineering, Blekinge Institute of Technology, 37179 Karlskrona, Sweden
3
Department of Chemistry, The Government Sadiq College Women University, Bahawalpur 63100, Pakistan
4
Department of Chemistry, College of Science, Taif University, P.O. Box 11099, Taif 21944, Saudi Arabia
5
Department of Chemistry, Faculty of Science, Al-Azhar University, Nasr City, Cairo 11884, Egypt
*
Authors to whom correspondence should be addressed.
Coatings 2021, 11(9), 1079; https://doi.org/10.3390/coatings11091079
Submission received: 31 July 2021 / Revised: 2 September 2021 / Accepted: 2 September 2021 / Published: 6 September 2021

Abstract

:
Liquid food packages consist of various polymers films, which are bonded together with Aluminum foil (Al-foil) using adhesion or by direct heat. The main aim of this research was to define important material properties such as fracture toughness and some FE-simulation material model parameters such as damage initiation, damage evolution, and the adhesion between Al-foil and low-density polyethylene (LDPE) film. This investigation is based on both physical experiments and FE simulations in ABAQUS with and without initial cracks of different lengths for comparison purposes. The final FE model in ABAQUS was used to compare the numerical input parameters in an extensive study with the ambition to investigate the materials’ parameters in cases with or without adhesion between laminates. Finally, the relation between the theoretical and experimental results for Al-foil using linear elastic fracture mechanics and modified strip yield model were shown, and the fracture toughness was calculated for two different thicknesses of Al-foil.

1. Introduction

Due to the continuous development of packaging industries, it has become possible to buy well-stored food distributed from far away locations [1]. An important step is to understand the mechanical and fracture properties of the packaging material. Packaging materials generally comprise various layers of paperboard, polymers and aluminum foil (Al-foil) [2]. Al-foil and the low-density polyethylene (LDPE) film are studied in this paper. Paperboard together with these materials is broadly utilized as a material structure in aseptic food packages. The Al-foil is utilized as a proficient barrier against oxygen and light in food packages [3,4].
The final packaging material is exposed to diverse loading conditions during its lifetime: forming, folding, filling, distribution, storage, handling, and eventually opening, wasting and recycling by the consumer [5]. Al-foil is incapable of withstanding high local strains like polymer film and the paper layers. Pre-cracks in the Al-foil can subsequently spread into the polymer and the paper layers. Therefore, it is important to recognize the individual and combined fracture behaviors of the Al-foil as well as its adhesion with LDPE layers and their roles as contributors towards the laminated structure when creating an opening device mechanism [6,7]. In order to predict the impairment evolution within the laminate, the fracture performance of the Al-foil and the LDPE are first studied distinctly. Numerous studies of the fracture performance of specific packaging material layers, for example, paperboard, are presented in [8,9,10]. To present the foundation for the study of Al-foil and LDPE, pre-center cracked panels were exposed to in-plane tensile mode I loading for further examination in this study. The bonds amongst the distinctive layers are allocated similar strengths as the induced traction forces generated when the distinctive material layers contract due to stress localization in the tensile tests, therefore leading to separation of the two material layers locally. De-lamination and the level of adhesion are interesting topics [11,12,13,14,15,16], which must be reviewed in the future. As pointed out in [17], mechanical modeling of polymer materials is still in a relatively premature phase when compared with the advances in metallic materials. A cell model has been developed and applied to study the effect of voids on matrix yielding and localized plastic deformation [18,19]. The modified Dugdale model approach was developed to investigate the localized plastic deformation of the single layer in addition to the laminate. The fracture behavior of the Al-foil and LDPE laminate has also been reviewed in previous work in [11,12,20,21,22]. A common opinion is the huge diversity of failure mechanisms in laminates of distinctive structures. Diverse loading happens at the time during transportation that triggers the opening phenomena of food packages [23]. Linear elastic fracture mechanics (LEFM), Elastic Plastic Fracture mechanics (EPFM) and modified strip yield model theories were used in the investigation of outcomes whilst loading components, response and fracture of material [24].
The purpose of this work was to present the results of the mechanical and fracture behaviors of the Al-foil and its adhesion with LDPE. These results will be used as input to virtual material modeling for calculation of the different package properties. The aim of the discussed approaches should be utilized to create a capable and potential tool for decision making and package improvement with practical and analytical simulation models. This article has three parts: a theoretical part, description of the fracture toughness methods and established practices. It explains important fracture mechanics parameters such as stress intensity factor K, J-integral, from the essential conception and meaning to experimental assessment and test approaches. In Section 3, the material properties are discussed. Experimental setup and experimental results are also presented in this section. Section 4 describes the mechanical behavior of the pre-cracked material and laminates. Analytical models were used to examine the experimental data in this section. The study will hopefully lead to further understanding of each of the laminate parts and how they contribute to crack development in the laminate. The differences in material behavior between adhesion and cohesion will also be investigated to gain further understanding.

2. Theoretical Model

2.1. Fracture Mechanics

Some theoretical models of fracture mechanics from the literature were used to study the breakage behavior of different materials. There are three different basic modes of loading on a crack tip [25,26]. All the three modes have different stress intensity factors at the crack, which is required to propagate the crack [27,28]. The stress intensity factors describing different modes of fracture, KI, KII and KIII, are given by Equations (1)–(3), respectively, while σy is the stress caused by normal force, τxy and τyz are the shear forces along xy and yz planes, respectively.
k I = l i m x 0   σ y x , 0 2 π x
k I I = l i m x 0   τ x y x , 0 2 π x
k I I I = l i m x 0   τ y z x , 0 2 π x
The materials’ physical properties often depend on their direction or plane. In the case of Al and LDPE, both materials are assumed to be isotropic because their properties remain the same in all directions. The laminate in this work consists of Al-foil/Adhesive/LDPE. LDPE is, in reality, not linear, but under small strains it can be approximated by a linear elastic material. It can also be considered to be isotropic. The adhesive layer is assumed to have the same mechanical properties as LDPE [29].
By the theory of elasticity, the stress field near the crack tip is a function of the geometry of the specimen location and loading. LEFM explains the stresses surrounding a crack tip, which are given as follows [30]:
σ i j = K 2 π r f i j θ a s r 0
Here, “r” is the distance from the crack tip, “θ” is the angle of the crack plane and “K” is the stress intensity factor, where “i” and “j” are indices values 1 and 2 referring to the Cartesian axes X1 and X2, and are known as angular functions [30]. The stress intensity factor “K” becomes equal to the fracture toughness at the start of crack growth. The LEFM limiting stress can be mathematically expressed as:
σ c = K c π a ×
Here, the above notation is described as: a = half of crack length, σ = stress at crack growth (obtained from experiments), and Kc = fracture toughness. When inelastic deformation n is small compared to the crack size, the LEFM theory is valid, which is called small scale yielding (SSY) [31].

2.2. Model of Modified Strip Yield

The model of strip yield for a crack, using two elastic solutions given below, defines the elastic plastic behavior, crack under remote tension and crack with closure stress at the tip.
The discontinuous displacement segment was assumed to model the strip yield plastic zone. The initial crack length including the discontinuous displacement segment length is 2(a + l), where “l” is the length at each end of the discontinuity, which are under equal stress σb, and 2a is the crack length and length “l” is the plastic zone represented by nonlinear behavior of materials shown in Figure 1 [32,33]. For calculating the yielding, in thin steel sheets, Dugdale suggested the strip yield model, and later this model was used for a variety of materials. The strip yield model is applicable to polymer materials.
The relation between applied stress and crack length can be derived, as written below
σ c σ b = 2 π a r c   cos   exp π K c 2 8 a σ b 2
Equation (6) is derived for infinite plates. To obtain reasonable results for the finite plate, the correction factor Ø from (9) is used to redefine (6), when aW, is given by
σ c σ b = 2 π a r c   cos   exp π K c 2 8 a 2 σ b 2

2.3. Fracture Toughness

Fracture toughness and the behavior of crack propagation mainly depend on the material’s thickness [30,31]. The different values of KI will be produced for specimens with different absolute sizes and standard proportions. This happens because the stress on specimen thickness varies and it continues until the thickness exceeds some critical dimension. After this, KI becomes relatively constant and this material property is known as the plane-strain fracture toughness “KIC” [34]. The load corresponding to defined unstable crack propagation helps to compute fracture toughness. The stress intensity factor, K, equals the fracture toughness during crack propagation. The stress for LEFM is given by [30].
k c = σ 0 π a × a w
In the above expression, “σ0” represents remote applied stress, “Ø” represents correction factor for center cracked specimen, “a” represents half the crack length, and “w” represents half width of specimen. The geometric correction factor Ø for the center crack specimen is
a w = 1 0.0025 a 2 w + 0.006   a w 4 cos 1 2 π a a 2
Analytical relations for experimental stress vs. crack length are given by Equation below.
σ e x p = P a 2 B w
In Equation (10), “P” represents the applied force and “a” represents half of the crack length. The specimen configuration used in Equation (10) are presented in Figure 2.

2.4. Adhesion Behavior

The maximum force required to break the bond is defined as a measure of adhesion. The measure of the strength of an adhesive bond across an interface is the amount of energy needed to break it, i.e., to separate two surfaces. Such a separation may involve the breakage of chemical or van der Waals bonds, and the plastic deformation of one or both of the materials on either side of the interface. The fraction of energy required to break the bonds at the interface is a very small fraction of the total energy necessary for the separation of the two surfaces in all cases where good adhesion is present [36,37]. Most of the mechanical work is used to deform, under stress, the material adjacent to the interface. Therefore, the measured energy of adhesion will be dependent on the ability of the interfacial bonds to sustain stress, as well as on the amount of plastic deformation caused by the above-mentioned stress [38]. In many structures, the use of adhesives is common. To explain the adhesive behavior, separation law can be used. τ max is the maximum stress (damage Initiation in ABAQUS) that the adhesive can take and δmax (damage Evolution in ABAQUS) is the maximum separation of the bulk material before the adhesive breaks and the bulk material is fully separated [27].

3. Experimental Study

The tensile tests were performed using an MTS Qtest100 machine with appropriate clamps manufactured by MTS system corporation, Minneapolis, MN, USA presented in Figure 3. The lower clamp is stationary and the upper one moves up to load the specimen by prescribed displacement. A 2.5 KN load cell was used due to the weight of the clamper. The specimen was placed between the grips and secured properly. The clamped specimen was loaded and extended until it broke or reached a desired displacement. The test speed was adjusted to 10 mm/min. The initial distance between grips was 230 mm.

3.1. Material Preparation

The LET/LDPE laminate was manufactured by spraying melted LDPE onto a PET layer. The LDPE layer was extracted from PET with the help of an extruder, as shown in Figure 4. Al foil, Al/LDPE (without adhesion) and Al/Adh/LDPE (with adhesion) were prepared. A simple paper laminating machine was used to make Al bonded with LDPE. The manual was studied, and it was observed that the machine operated at 120 centigrade. Paper was placed on both sides of the lamina to protect the lamina from having direct contact with the heated roller while laminating. A pre-center crack was introduced after the layers had been laminated. The same procedure was followed for the preparation of Al foil/Adh/LDPE, except that paper gum was used as an adhesive between the layers and then a pre-center crack was introduced after laminating the layers. In all cases for Al and LDPE, Al served as the master layer and LDPE as the slave layer. Both LDPE and Al were assumed to have isotropic behavior in this work, although in practice the materials are anisotropic.

3.2. Design of Experiment

Sample Preparation: Half width W and height h from the center were measured with the help of a scale. For each material, Al foil and laminated Al foil, at least five test specimens of 95 mm × 230 mm size were prepared, as shown in Figure 5. The width of the specimen (2 W equals 95 mm) was assumed to be infinite in comparison with the crack length in order to remove the effect of finite size. A steel ruler and knife were utilized to make the specimens and cracks. Taking the gripper of the MTS machine into consideration, a height size greater than 230 mm specimen was used. Half crack length was made from the center to both directions in order to ensure similar pre-crack tip shapes. While making the specimen of Al foil, it should be taken into account that no pre-crack was introduced, as Al foil is very sensitive to handle.

3.3. Experimental Testing for Data Collection

As the test began, the force vs. displacement graph was displayed continually. When there was no pre-crack, the Al foil, Al/LDPE, and Al/Adh/LDPE tear around the lower gripper or fail abruptly from the center; however, when there was a pre-crack, the crack advanced down the width in all circumstances, following the centerline. To investigate the influence of adhesion and crack propagation behavior through the lamina, Al/LDPE and Al/Adh/LDPE specimens with initial cracks of various lengths were manually halted at various displacements. The Al-foil utilized had a thickness of 9 microns, while the test specimens were made of a 27-micron thick LDPE. The test cases are presented in Table 1.

3.4. Experimental Results and Discussion

3.4.1. Case 1: Aluminum Foil

Both materials responded similarly in MD and CD because they are both isotropic. If there was no crack in the aluminum foil, it suddenly failed or tore away from the bottom clamp. As a result, LDPE behaved similarly. When both had pre-cracks, the crack spread along the width of the crack, following the centerline. In the case of no crack, more force was required to induce the fracture. As the length of the initial fracture grew longer, the force required to propagate the crack decreased. At least five test samples of each case were generated and tested, as discussed in Section 3.2. Only the greater displacement and force findings are shown in the main text; the remaining results are presented in Appendix A. The cumulative results of all specimens for Al foil with a crack length of 0 to 45 mm are shown in Figure 6.
As previously stated, for the calculation of mechanical characteristics and numerical analysis of materials, only higher force and displacement values were taken into account in all circumstances. With no crack, the highest displacement measured in Al-foil was 3.218 mm when the applied load reached 61.45 N. In the case of a 45 mm fracture length case with a load of 14.47 N, the minimum extension was 0.16 mm. The findings reveal that a greater force is required to propagate the crack when the crack length is shorter, and that this force reduces as the crack length increases. For fracture lengths ranging from 0 to 45 mm, the results are reported in Figure 7 and Table 2. Experimental results for all the specimens are presented in Appendix A, Figure A1.

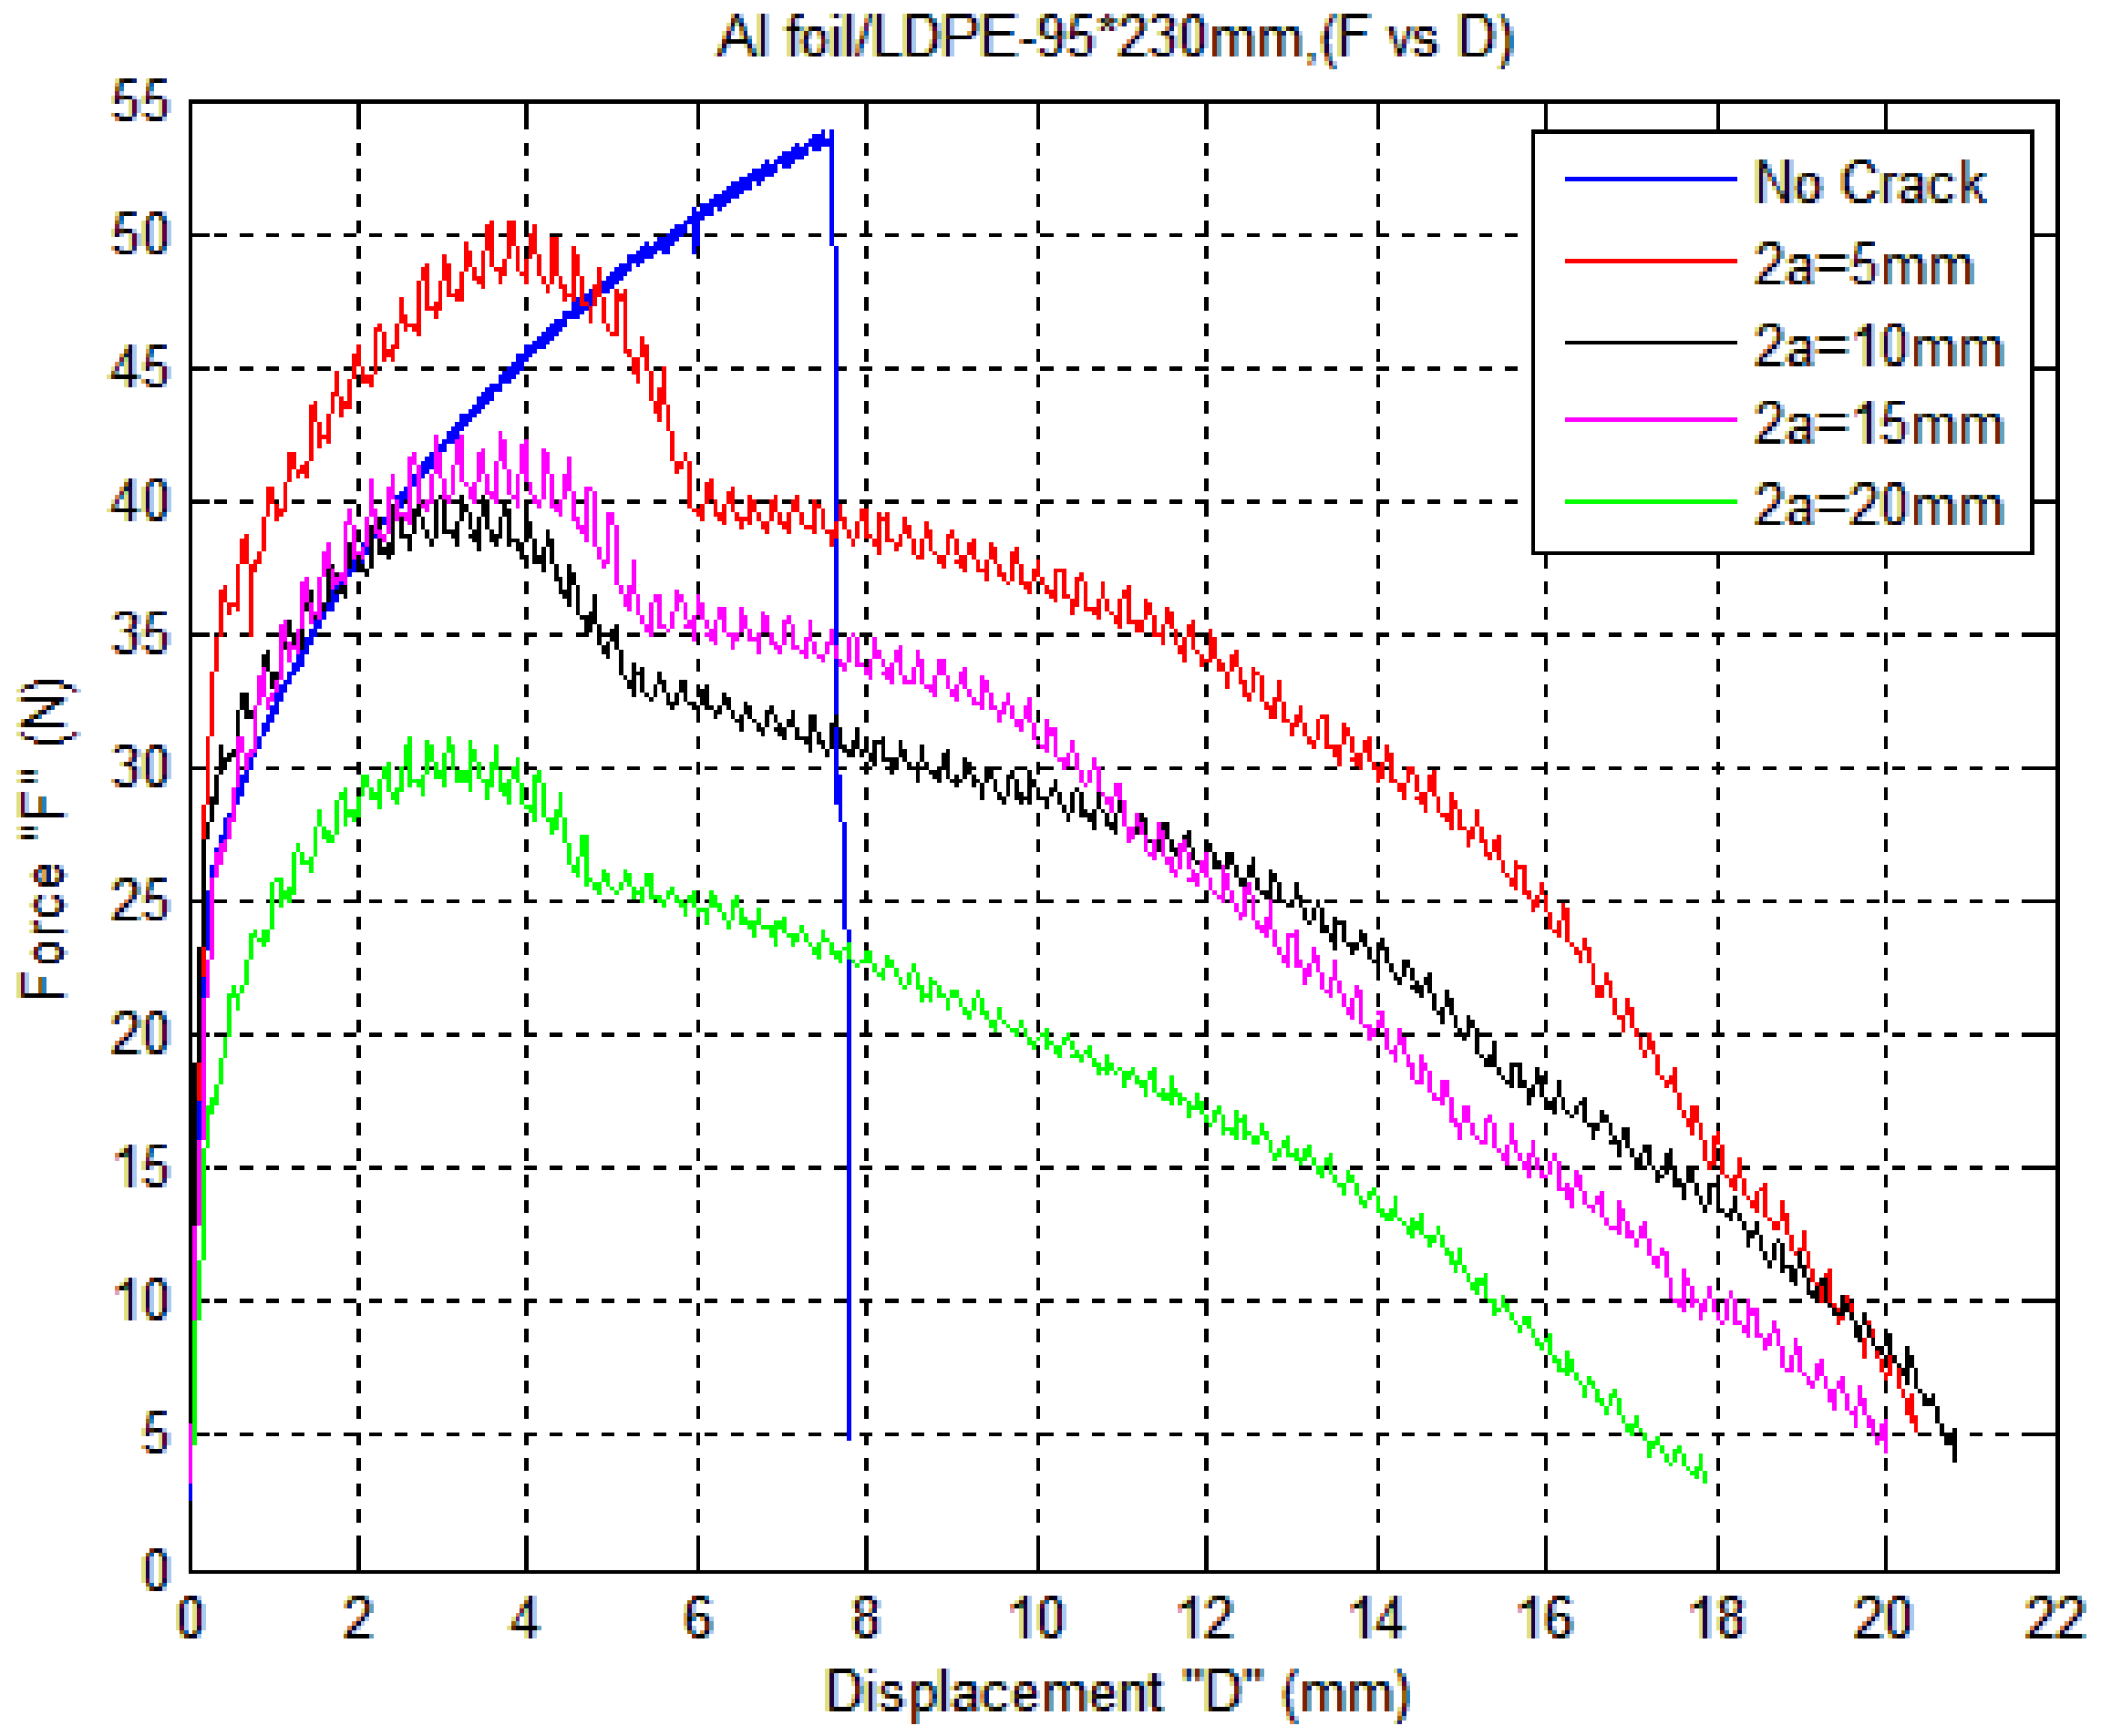
3.4.2. Case 2: Aluminum Foil/LDPE (without Adhesion)

In the absence of adhesion, the Al-foil broke faster than the LDPE. As a result, LDPE took longer to fail than Al-foil. This is due to the ductility of LDPE. In the presence of a pre-crack, aluminum had a much lower maximum extension value than LDPE, but in the absence of a crack, both materials failed near the lower clamp. With no crack introduced, the maximum extension observed was 7.553 mm at a load of 53.8 N. However, when the crack length was 20 mm and the peak load recorded was 31.1 N, the minimum extension observed was 2.6 mm. Figure 8 and Table 3 show the maximum displacement and peak values. Test results for all the specimens are reported in Appendix A, Figure A2.
The peak load value for the LDPE with the same specimen size and no crack was recorded as 20.72 N, and the specimen extended 36 mm. The maximum extension observed when the 5 mm crack was introduced was 30.12 mm, and the peak load was 18.6 N, as shown in Figure 9. These values were used to calculate the other mechanical parameters, which are = 8 MPa, E = 126.1 MPa, and KI = 0.75 MPa/m2 [35]. These variables were then used in the numerical analysis.

3.4.3. Case 3: Al-Foil/Adh/LDPE (with Adhesion)

When Al/Adh/LDPE was tested, the maximum load and extension observed were 44.61 N and 4.756 mm, respectively, when there was no crack. The maximum load was 23.59 N and the displacement was 0.653 mm for the initial crack of 20 mm. The single peak in Figure 10 for each case depicts the behavior of materials in which both materials fail at the same point due to a strong adhesion force between them, which causes them to act as one material. Table 4 summarizes the results. Experimental results are presented in Appendix A, Figure A3 for all the specimens.

3.4.4. Comparison between Case 2 and Case 3

Due to the ductility of LDPE, in case 2, the Al broke before the LDPE failed, as shown in Figure 8. For cases with crack lengths ranging from 5 to 20 mm, Al broke before 6 mm, while LDPE did not fail until 20 mm. In case 3, however, due to the strong adhesive bonding between the materials, they acted as one and both broke at the same point, as shown in Figure 10.

4. Numerical Simulation

A finite element simulation was carried out in simulation tool ABAQUS Explicit 6.10 by Dassault Systèmes, Vélizy-Villacoublay, France [39] to understand the material behavior clearly. The subsequent steps were followed to develop the exact tensile test model carried out in Section 3. The following assumptions were made to conduct numerical tests in ABAQUS 6.10. As the thickness is less, plane stress was considered. Shell elements were considered and for polymers, a linear elastic, von Mises isotropic plastic material model together with progressive damage was used as the material model. A trial-and-error calibration of continuum material parameters and calibration of fracture material parameters were used for the modeling procedure to conduct the tensile test in ABAQUS 6.10/Explicit.

4.1. Material Parameters Calibration

The material properties are required in ABAQUS to model the tensile test for Al-foil and LDPE. Experiment results are required to calibrate the data for numerical simulation. Figure 7 depicts a force vs. displacement graph for an Al-foil with no crack. The blue plot was chosen to calibrate the material’s properties.
First, the stress vs. strain plot from the experimental results was used to calculate Young’s modulus, as shown in Figure 11.
Plasticity is the behavior of a material beyond its elastic limit, which can be calculated using true stress vs. true strain experiments. Analytical methods can be used to calculate true stress and strain. The resulting plot of true stress vs. true strain is shown in Figure 12.

4.2. Fracture Material Parameters Calibration

The following are the components that define the material: the behavior of material under no damage; the behavior of material under damage (damage initiation (point D = 0)); and the behavior of material after damage initiation (damage evolution (D = 0 to ε f p l ). These can be seen in Figure 13.
Damage initiation defines the point at which degradation of stiffness starts. Fracture in a ductile polymer can be caused by two main processes. Nucleation, growth, and coalescence of void cause ductile fracture. Shear band localization causes shear fracture. The behavior of damage growth depends on these above two observations. In ductile metals, the damage caused by nucleation, growth, and coalescence of voids can be predicted by the initiation criterion model. The assumption made in this model is that the plastic strain is a function of stress triaxiality and strain rate for the onset of damage. Damage evolution defines the behavior of a material after damage initiation. It means that once initiation is caused, it defines the rate of degradation of the material stiffness [40].
Figure 13 describe the stress–strain behavior of a material under damage, where, E = Young’s Modulus, D = damage variable, σ y 0 = yield stress when damage onset occurs (at D = 0), ε 0 p l = equivalent plastic strain at damage onset (at D = 0), ε f p l = plastic strain when failure occurs (at D = 1).
All numerical parameters were calibrated by experimental measurement. In Table 5, fracture strains were calculated from the displacement response of the tensile test. As pre-cracked samples were tested, we assumed the strain had fully localized around the cracked surface. The stress triaxiality value was chosen in and of −5 and 5, which made the fracture strain in the material constitutive stress triaxiality independent. Finally, the displacement at failure, which is a FE-simulation material failure parameter, was calibrated by inverse modeling of the force displacement curve from experiment.

4.3. Numerical Results and Discussion

By using the Young Modulus equation and (Figure 11), the values within the elastic limit help to calculate Young’s Modulus. For aluminum: Young’s Modulus (E) = 55.653 GPa, Poisson’s ratio (v) = 0.3, thickness (t) = 9 microns. Similarly, Young’s modulus calculated for LDPE was (E) = 126.1 Mpa.

4.3.1. Aluminum Foil (No Crack)
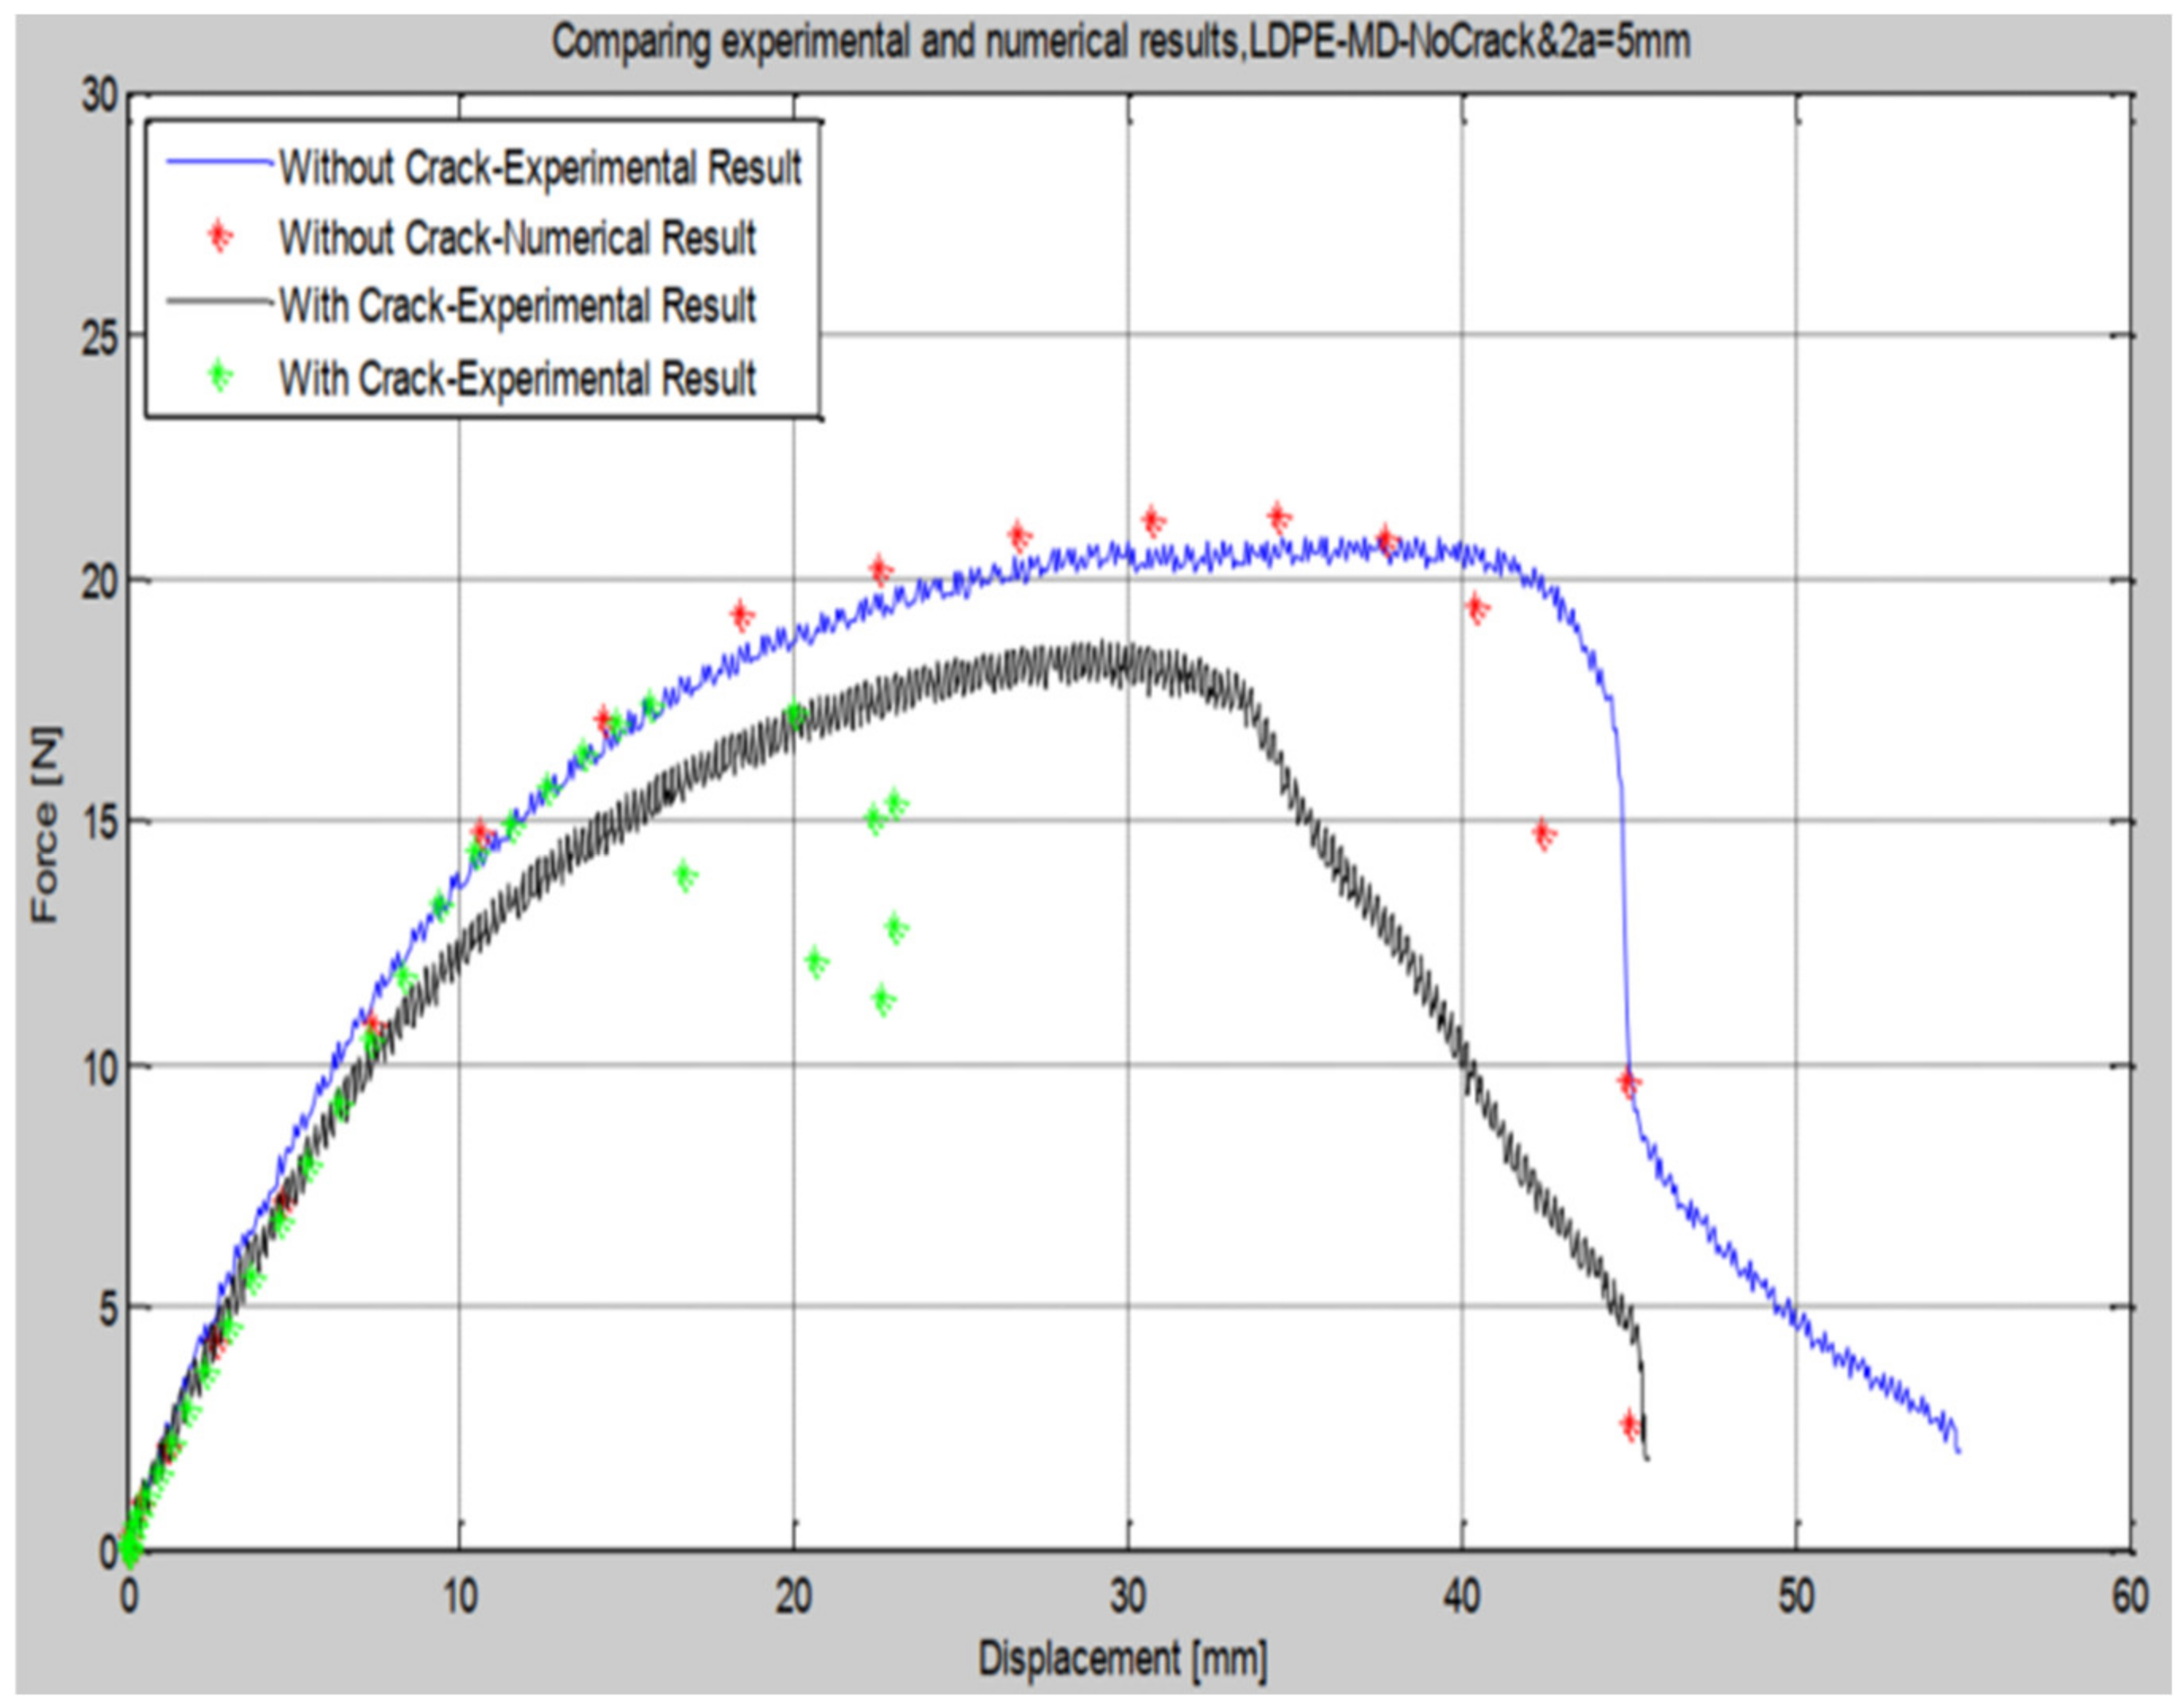
Experiment results were used to calculate the material’s properties. Plasticity values were calculated analytically based on the results. The results of both numerical and experimental calculations are nearly identical. Figure 14 depicts the response of experimental and numerical results. This leads us to the conclusion that the Al-foil can be modeled in the finite element software ABAQUS plasticity values.
After calibrating fracture material parameters, they were compared with experimental results when the Young’s modulus value of 55.63 GPa, and the plasticity values (Appendix B, Table A1) were used; good results were obtained with the damage initiation of 0.0001 and damage evolution of 0.075 mm presented in Table 5. The values of stress triaxiality and strain rate remained fixed in this numerical simulation.

4.3.2. LDPE

The properties of LDPE used in the subsequent theoretical and experimental analysis which are obtained from [35] are presented in Table 5 and Appendix B, Table A2.

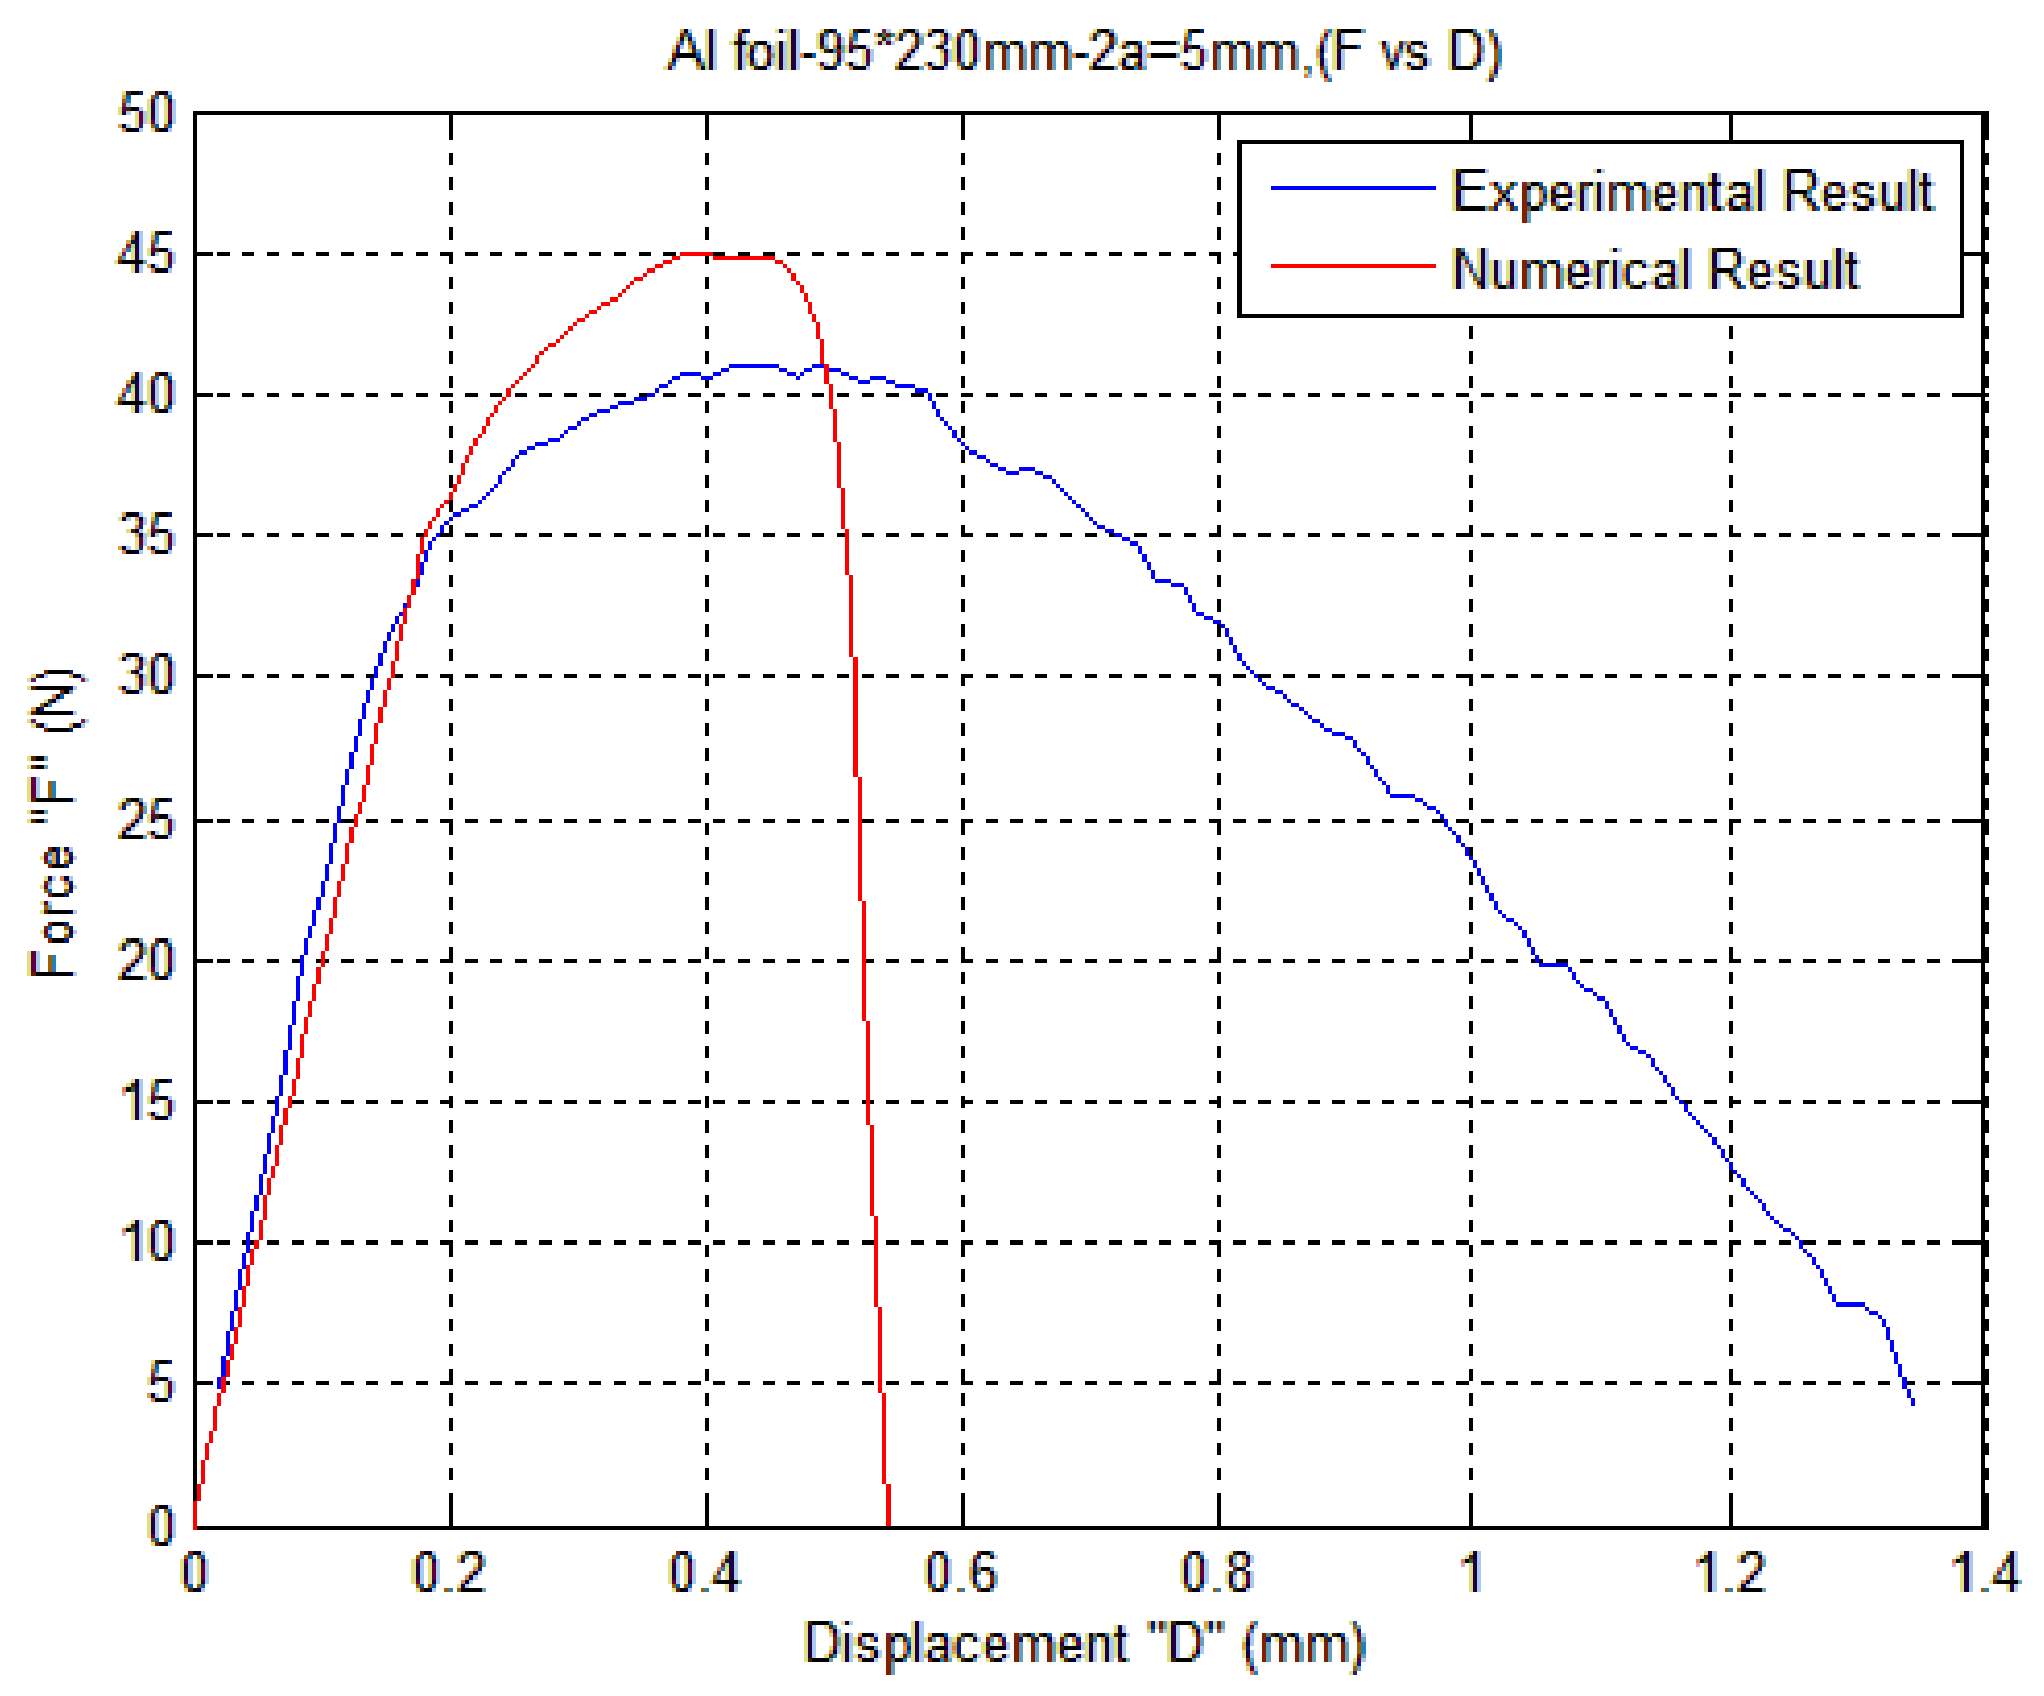
4.3.3. Aluminum Foil (5 mm Crack)

All of the continuum and fractsure material parameters mentioned in Section 4.3.1, such as Young’s modulus, plasticity, damage initiation, and damage evolution, remained constant for the specimen with a crack length of 5 mm.
When the experimental and numerical results are compared, Figure 15, it is clear that the material behavior is the same within the elastic limit, but there are some discrepancies in the material behavior in the plastic region.

4.3.4. Aluminum Foil/LDPE Laminated (No Crack)

To simulate the ABAQUS model, all of the fracture material parameters such as Young’s modulus, plasticity, damage initiation, and damage evolution for both Al-foil and LDPE, as mentioned in Section 4.3.1 and Section 4.3.2, respectively, were used. When the experimental and numerical results are compared Figure 16, it is clear that the material behavior in both cases differs to some extent.

5. Results and Discussion

Critical stresses were calculated for Al-foil with different crack lengths (5, 10, 15, 20, and 45 mm). The following fracture toughness graph was plotted using the LEFM, Equation (5), the strip yield model, Equation (7), and the experimental results for the Al-foil, which shows the normalized critical stresses vs. normalized crack length.
The strip yield model and LEFM’s theoretical calculations show a strong correlation with the experimental data. As depicted in Figure 17, the Al-foil with a thickness of 9 microns has a fracture toughness of 6.39 MPa/m2 For the Al-foil with a thickness of 6.42 microns, the fracture toughness was calculated using mechanical parameters reported in [23] was KC = 6.1 MPa/m2.
When the experimental and numerical findings for Al foil and Al/LDPE were examined Figure 18, it was discovered that the experimental and numerical results for Al foil and Al foil/LDPE exhibited nearly the same behavior until the peak and then altered due to LDPE. However, the results of material laminated in the Blekinge Institute of Technology Lab were not the same as those discussed above. Due to the contact with PET and the heated surface of the machine used for lamination, material properties may alter. Another reason for this is because Al-foil failed first, followed by LDPE. This resulted in oscillation, which influenced the material properties and results.
When comparing the experimental results for Al foil/LDPE with no and full adhesion, as shown in Figure 19, it was discovered that they showed the same behavior until peak and then changed behavior because the material behaved as a different material with new material parameters during full adhesion. This is due to the strong adhesive bonding between the materials as presented in Figure 16.
In the case of laminated Al-foil/LDPE (without adhesion), the material’s behavior in numerical and physical tests is dynamic along the displacement, which could be due to a number of factors, including the fact that both materials were in contact with Polyethylene Terephthalate (PET) to avoid burning and sticking of materials with paper. This may lead to a change in the material’s properties. Second, both materials retained their properties, so that Al-foil broke first, followed by LDPE, which is more ductile than Al-foil. The other reason is that the Al-foil failed first, followed by the LDPE. This resulted in oscillation, which influenced the material properties and results.
The failure occurred at the same force and displacement in both materials while performing experiments on aluminum foil/Adh/LDPE (full adhesion). Due to the strong adhesive bonding between the materials, they behaved as if they were one material, allowing us to conclude that the strong adhesion changes the material parameters.

6. Conclusions

  • Different material properties were determined in this study by developing physical test and FE modeling procedures. The experiments were carried out on Al-foil, aluminum foil laminated with LDPE, with and without adhesion. Material parameters were calibrated for use in the numerical test study. The design of experiment technique was used to determine the material’s Young’s modulus, plasticity, damage initiation, and damage evolution. For Al-foil, the theoretical result using LEFM and modified strip yield model was showing a close relation with the obtained experimental results.
  • The fracture toughness KC obtained for the Al-foil with thickness of 9 microns was 6.39 MPam1/2. An earlier study on the same grade Al-foil reported the fracture toughness KC = 6.1 MPam1/2 for thickness of 6.42 microns.
  • For the case of laminated Al-foil/LDPE (without adhesion), the behavior of the material in the numerical and physical tests was dynamic along the displacement and there may be number of reasons, such as the fact that Al-foil and LDPE were laminated by a lamination machine and were in contact with PET to avoid the burning and sticking of materials with paper. This may have caused the change in the material properties.
  • Failure of Al-foil before the LDPE in case of Al foil/LDPE (without adhesion) cause the specimen oscillation, so vibration can also be a cause of change in material behavior when analyzed numerically.
  • In the case of Al foil/Adh/LDPE, both materials broke at the same point so it can be concluded that the strong adhesion force between laminates can change the properties and the materials act as one.
This research can be expanded in the future to calculate the fracture toughness value of laminated materials. Furthermore, the FE modeling strategy can be defined for materials with full adhesion. Under the microscope, bonded material delamination can be defined and studied. Adhesives and their effects on the properties of bonded materials can be studied.

Author Contributions

Supervised all the project and literature review regarding this paper, U.S.; Supervision of the project including literature review and write-up, B.S.; Did all the experimental work and manuplate the data of this paper, M.S.I.; Look after the experimental work, completed illustration and data interpretation, K.M.; Managed the raw materials and give a proper guidance for materials usage and safety, D.S.I.; Helped in paper revisions and data explanations, O.O.A.; Funding acquisition, N.A.; Provided financial help, Z.I.Z.; Helped in data explainations, Z.M.E.-B. All authors have read and agreed to the published version of the manuscript.

Funding

Supported by National Key Research and Development Program of China (Grant No. 2019yFB2006404) and the Taif Researchers Supporting Project (TURSP-2020/42), Taif University, Taif, Saudi Arabia.

Institutional Review Board Statement

Not applicable for this study.

Informed Consent Statement

Not applicable for this study.

Data Availability Statement

Dataset will be provided by coressponding author upon reasonable request. No publicly archived dataset was utilized in this study.

Conflicts of Interest

The authors declare no conflict of interest.

Appendix A

Figure A1. Experimental results for aluminum foil. (a) F vs. D for 0 mm crack, (b) F vs. D for 5 mm crack, (c) F vs. D for 10 mm crack, (d) F vs. D for 15 mm crack, (e) F vs. D for 20 mm crack, (f) F vs. D for 40 mm crack.
Coatings 11 01079 g0a1
Figure A2. Experimental results for aluminum foil/LDPE. (a) F vs. D for 0 mm crack, (b) F vs. D for 5 mm crack, (c) F vs. D for 10 mm crack, (d) F vs. D for 15 mm crack, (e) F vs. D for 20 mm crack.
Coatings 11 01079 g0a2
Figure A3. Experimental results for aluminum foil/Adh/LDPE. (a) F vs. D for 0 mm crack, (b) F vs. D for 5 mm crack, (c) F vs. D for 10 mm crack, (d) F vs. D for 15 mm crack, (e) F vs. D for 20 mm crack.
Coatings 11 01079 g0a3

Appendix B

Table A1. Yield stress and plastic strain of aluminum foil.
Nos.Yield Stress (MPa)Plastic Strain
136.190
242.540.0001096
345.120.000211
448.130.0003004
551.160.0004633
654.110.0007017
757.380.001147
860.350.00182
962.950.003004
1064.770.004132
1166.560.005547
1268.580.007468
1370.630.009318
1472.120.01117
15730.01246
Table A2. Yield stress and plastic strain of LDPE.
Nos.Yield Stress (MPa)Plastic Strain
15.3320
25.4440.00134
35.680.0022
460.00427
56.160.00569
66.30.0065
76.4590.0079
86.5110.0083
96.620.0093
106.780.01107
116.900.0124
127.080.0147
137.140.0148
147.210.0164
157.3280.0184
167.4120.0193
177.5530.0227
187.6380.0246
197.800.0278
207.920.0313
218.020.0330
228.1360.0365
238.260.04
248.350.0425
258.730.0696

References

  1. Islam, M.S. Fracture and Delamination in Packaging Materials: A Study of Experimental Methods and Simulation Techniques. Ph.D. Thesis, Blekinge Tekniska Högskola, Karlshamn, Sweden, 2019. [Google Scholar]
  2. Islam, M.S.; Alfredsson, K.S. Peeling of metal foil from a compliant substrate. J. Adhes. 2021, 97, 672–703. [Google Scholar] [CrossRef] [Green Version]
  3. Marsh, K.; Bugusu, B. Food packaging—Roles, materials, and environmental issues. J. Food Sci. 2007, 72, R39–R55. [Google Scholar] [CrossRef]
  4. Geueke, B.; Groh, K.; Muncke, J. Food packaging in the circular economy: Overview of chemical safety aspects for commonly used materials. J. Clean. Prod. 2018, 193, 491–505. [Google Scholar] [CrossRef]
  5. Shin, J.; Selke, S.E.M. Chapter 11 Food Packaging. Food Processing: Principles and Applications; John Wiley & Sons: Hoboken, NJ, USA, 2014. [Google Scholar]
  6. Brostow, W.; Lobland, H.E.H.; Khoja, S. Brittleness and toughness of polymers and other materials. Mater. Lett. 2015, 159, 478–480. [Google Scholar] [CrossRef]
  7. Kao-Walter, S. On the Fracture of Thin Laminates. Ph.D. Thesis, Blekinge Institute of Technology, Karlskrona, Sweden, 2004. [Google Scholar]
  8. Tryding, J. In Plane Fracture of Paper. Ph.D. Thesis, Lund Institute of Technology, Lund, Sweden, 1996. [Google Scholar]
  9. Hägglund, R.; Isaksson, P. Analysis of localized failure in low-basis-weight paper. Int. J. Solids Struct. 2006, 43, 5581–5592. [Google Scholar] [CrossRef] [Green Version]
  10. Isaksson, P.; Hägglund, R.; Gradin, P. Continuum damage mechanics applied to paper. Int. J. Solids Struct. 2004, 41, 4731–4755. [Google Scholar] [CrossRef]
  11. Islam, M.S.; Zhang, D.; Mehmood, N.; Kao-Walter, S. Study of shear dominant delamination in thin brittle-high ductile interface. Procedia Struct. Integr. 2016, 2, 152–157. [Google Scholar] [CrossRef] [Green Version]
  12. De-feng, Z.; Md. Shafiqu, I.; Eskil, A.; Sharon, K.-W. Modeling and study of fracture and delamination in a packaging laminate. In Proceedings of the 3rd International Conference on Material Engineering and Application (ICMEA 2016), Shanghai, China, 12–13 November 2016. [Google Scholar]
  13. Li, T.; Suo, Z. Ductility of thin metal films on polymer substrates modulated by interfacial adhesion. Int. J. Solids Struct. 2007, 44, 1696–1705. [Google Scholar] [CrossRef] [Green Version]
  14. Li, T.; Suo, Z. Deformability of thin metal films on elastomer substrates. Int. J. Solids Struct. 2006, 43, 2351–2363. [Google Scholar] [CrossRef] [Green Version]
  15. Suo, Z.; Vlassak, J.; Wagner, S. Micromechanics of macroelectronics. China Particuology 2005, 3, 321–328. [Google Scholar] [CrossRef]
  16. Li, T.; Zhang, Z.; Michaux, B. Competing failure mechanisms of thin metal films on polymer substrates under tension. Theor. Appl. Mech. Lett. 2011, 1, 041002. [Google Scholar] [CrossRef] [Green Version]
  17. Shahid, S.; Gukhool, W. Experimental Testing and Materialmodeling of Anisotropy in Injection Moulded Polymer Materials. Master’s Thesis, Blekinge Institiute of Technology, Karlskrona, Sweden, 2020. [Google Scholar]
  18. Danielsson, M.; Parks, D.M.; Boyce, M.C. Three-dimensional micromechanical modeling of voided polymeric materials. J. Mech. Phys. Solids 2002, 50, 351–379. [Google Scholar] [CrossRef]
  19. Sedighiamiri, A.; Govaert, L.E.; Van Dommelen, J.A.W. Micromechanical modeling of the deformation kinetics of semicrystalline polymers. Polym. Sci. Part B Polym. Phys. 2011, 48, 1297–1310. [Google Scholar] [CrossRef] [Green Version]
  20. Chen, S.H.; Wang, T.C.; Kao-Walter, S. A crack perpendicular to the bimaterial interface in finite solid. Int. J. Solids Struct. 2003, 40, 2731–2755. [Google Scholar] [CrossRef] [Green Version]
  21. Kao-Walter, S.; Ståhle, P.; Chen, S.H. A finite element analysis of a crack penetrating or deflecting into an interface in a thin laminate. Key Eng. Mater. 2006, 312, 173–178. [Google Scholar] [CrossRef] [Green Version]
  22. Kao-Walter, S.; Ståhle, P.; Hägglund, R. Fracture toughness of a laminated composite. Eur. Struct. Integr. Society. 2003, 32, 355–364. [Google Scholar] [CrossRef] [Green Version]
  23. Kao-Walter, S. Mechanical and Fracture Properties of Thin Al-Foil; Blekinge Tekniska Högskola Forskningsrapport: Karlskrona, Sweden, 2001; ISSN 11031581. [Google Scholar]
  24. He, G.; Li, J.; Zhang, F.; Lei, F.; Guo, S. A quantitative analysis of the effect of interface delamination on the fracture behavior and toughness of multilayered propylene–ethylene copolymer/low density polyethylene films by the essential work of fracture (EWF). Polymer 2014, 55, 1583–1592. [Google Scholar] [CrossRef]
  25. Iqbal, M.S.; Muhammadi, A.B. Tearing Fracture and Microscopic Analysis of Laminate Toward Sustainable Packaging. Master’s Thesis, Blekinge Institute of Technology, Karlskrona, Sweden, 2007. [Google Scholar]
  26. Skanse, H. Investigation of Mechanical Tearing and How it can Be Applied in Package Open Ability Prediction. Master’s Thesis, Lund Institute of Technology, Lund, Sweden, 2009. [Google Scholar]
  27. Karmlid, O. Simulation and Testing of Crack Sensitivity in TFA Packaging Material. Master’s Thesis, Lund University, Lund, Sweden, 2011. [Google Scholar]
  28. Min, H. Study of Two Models for Tearing Resistance Assesment Using Essential Work of Fracture Method; Blekinge Institute of Technology: Karlskrona, Sweden, 2008. [Google Scholar]
  29. Kao-Walter, S.; Dahlström, J.; Karlsson, T.; Magnusson, A. A study of the relation between the mechanical properties and the adhesion level in a laminated packaging material. Mech. Compos. Mater. 2004, 40, 29–36. [Google Scholar] [CrossRef]
  30. Kao-Walter, S.; Mfoumou, E. Fracture Toughness Testing of Non Standard Specimens; Blekinge Institute of Technology: Karlskrona, Sweden, 2004. [Google Scholar]
  31. Anderson, T.L. Fracture Mechanics Fundamentals and Applications, 3rd ed.; CRC Press Taylor & Francis Group: Boca Raton, FL, USA, 2005. [Google Scholar]
  32. Kao-Walter, S.; Ståhle, P. Fracture Behaviour of a Thin Al-Foil-Measuring and Modelling of the Fracture Processes. In Proceedings of the Third International Conference on Experimental Mechanics, Beijing, China, 15–17 October 2001; pp. 25–256. [Google Scholar]
  33. Dugdale, D.S. Yielding of steel sheets containing slits. J. Mech. Phys. Solids 1960, 8, 100–104. [Google Scholar] [CrossRef]
  34. Fracture Toughness. Center, N.E.R. Toughness. 2018. Available online: https://www.nde-ed.org/EducationResources/CommunityCollege/Materials/Mechanical/Toughness.html (accessed on 21 August 2020).
  35. Jemal, A.; Katangoori, R.R. Fracture Mechanics Applied in Thin Ductile Packaging Materials-Experiments with Simulations. Master’s Thesis, Blekinge Institute of Technology, Karlskrona, Sweden, 2011. [Google Scholar]
  36. Baldan, A. Adhesively-bonded joints and repairs in metallic alloys, polymers and composite materials: Adhesives, adhesion theories and surface pretreatment. J. Mater. Sci. 2004, 39, 1–49. [Google Scholar] [CrossRef]
  37. Creton, C.A. Materials science of pressure sensitive adhesives, materials science and technology. Process. Mater. 1997, 18, 434–439. [Google Scholar]
  38. Krenk, S. Non-Linear Modeling and Analysis of Solids and Structures; Cambridge University Press: Cambridge, UK, 2009. [Google Scholar]
  39. Systèmes, D. Introduction to Abaqus Scripting; Dassault Systèmes: Vélizy-Villacoublay, France, 2009. [Google Scholar]
  40. Shi, Y.; Swait, T.; Soutis, C. Modelling damage evolution in composite laminates subjected to low velocity impact. Compos. Struct. 2012, 94, 2902–2913. [Google Scholar] [CrossRef]
Figure 1. The strip yield model.
Coatings 11 01079 g001
Figure 2. Specimen configuration with a centered crack of length 2a [35].
Coatings 11 01079 g002
Figure 3. MTS machine at BTH lab.
Coatings 11 01079 g003
Figure 4. Extrusion of test size LDPE layer from PET laminated with LDPE layers [35].
Coatings 11 01079 g004
Figure 5. Specimen with center crack and without center crack.
Coatings 11 01079 g005
Figure 6. Load vs. displacement of Al-foil (center cracked) of 0–45 mm for all specimens.
Coatings 11 01079 g006
Figure 7. Load vs. displacement of Al foil (center cracked) of 0–45 mm.
Coatings 11 01079 g007
Figure 8. Load vs. displacement of Al foil/LDPE with a center crack of 0–20 mm.
Coatings 11 01079 g008
Figure 9. Response of LDPE-MD-95 230 mm experimental and numerical results with crack 2a = 5 mm and without crack.
Coatings 11 01079 g009
Figure 10. Load vs. displacement of Al foil/Adh/LDPE for 0–20 mm (center cracked).
Coatings 11 01079 g010
Figure 11. Stress vs. strain graph.
Coatings 11 01079 g011
Figure 12. True stress vs. true strain graph for continuum Al-foil.
Coatings 11 01079 g012
Figure 13. Stress–strain curve under progressive damage degradation.
Coatings 11 01079 g013
Figure 14. Force vs. displacement graph of aluminum foil (No Crack).
Coatings 11 01079 g014
Figure 15. Force vs. displacement of aluminum foil with 5 mm Crack.
Coatings 11 01079 g015
Figure 16. Force vs. displacement of aluminum foil/LDPE without crack.
Coatings 11 01079 g016
Figure 17. Fracture toughness graph.
Coatings 11 01079 g017
Figure 18. Comparison of experimental and numerical analysis.
Coatings 11 01079 g018
Figure 19. Comparison of experimental results between Al foil/LDPE and Al/Adh/LDPE.
Coatings 11 01079 g019
Table 1. Test cases.
Sr. NoTest CasesCrackThickness (μm)Dimensions (mm × mm)
1Al FoilWith and without crack9230 × 95
2Al Foil/LDPE/(w/o) AdhWith and without crack36230 × 95
3Al Foil/Adh/LDPEWith and without crack36230 × 95
Table 2. Load and displacement of fractured Al foil, thickness B of 9 µm and dimensions of 230 mm × 95 mm.
Crack Length (2a)
(mm)
Maximum Load (F)
(N)
Extension (D)
(mm)
No Crack61.453.218
544.640.606
1038.620.523
1534.990.458
2025.880.38
4514.470.16
Table 3. Peak load and maximum displacement of fractured Al foil/LDPE, thickness B of 40 µm and dimensions of 230 mm × 95 mm.
Crack Length (2a)
(mm)
Maximum Load (F)
(N)
Extension (D)
(mm)
No Crack53.87.553
5 50.463.792
10 40.262.7
15 42.513.666
20 31.12.6
Table 4. Load and displacement of fractured Al foil/Adh/LDPE, thickness B of 45 µm and dimensions of 230 mm × 95 mm.
Crack Length (2a) (mm)Maximum Load (F) (N)Extension (D) (mm)
No. Crack44.614.756
538.041.653
1030.070.863
1528.240.334
2023.590.653
Table 5. The ductile damage initiation damage evolution values for aluminum foil and LDPE.
MaterialsFracture StrainStress TriaxialityStrain RateDisplacement at Failure (mm)
Aluminum Foil0.0001−500.075
0.000150
LDPE0.9−500.9
0.950
Publisher’s Note: MDPI stays neutral with regard to jurisdictional claims in published maps and institutional affiliations.

