Review

TiO2 Nanotubes Architectures for Solar Energy Conversion

Department of Materials Science and Engineering, University of Virginia, Charlottesville, VA 22904, USA
*
Author to whom correspondence should be addressed.
Coatings 2021, 11(8), 931; https://doi.org/10.3390/coatings11080931
Submission received: 28 April 2021 / Revised: 11 July 2021 / Accepted: 29 July 2021 / Published: 4 August 2021
(This article belongs to the Special Issue Smart Coatings for Energy Saving Applications)

Abstract

:
Electromagnetic light from the Sun is the largest source, and the cleanest energy available to us; extensive efforts have been dedicated to developing science and engineering solutions in order to avoid the use of fossil fuels. Solar energy transforms photons into electricity via the photovoltaic effect, generating about 20 GW of energy in the USA in 2020, sufficient to power about 17 million households. However, sunlight is erratic, and technologies to store electric energy storage are unwieldy and relatively expensive. A better solution to store energy and to deliver this energy on demand is storage in chemical bonds: synthesizing fuels such as H2, methane, ethanol, and other chemical species. In this review paper we focus on titania (TiO2) nanotubes grown through electrochemical anodization and various modifications made to them to enhance conversion efficiency; these semiconductors will be used to implement the synthesis of H2 through water splitting. This document reviews selected research efforts on TiO2 that are ongoing in our group in the context of the current efforts worldwide. In addition, this manuscript is enriched by discussing the latest novelties in this field.

1. Introduction

1.1. Water Splitting for Energy Conversion and Storage

Since the industrial revolution, fossil fuels have been used indiscriminately in order to convert the chemical energy contained in these fuels to heat and electricity, thus dominating the global energy landscape despite the increasing concerns about the rapid depletion and the effect of the carbon dioxide emissions on the Earth’s climate [1]. In this context, the Intergovernmental Panel on Climate Change (IPCC, 10-2018) report recommends an average temperature increase within 1.5° over several years to avoid worse consequences. The same report states that the peak of carbon generation must start to decrease within 2020–2030 [2].
Starting with the 1970s, renewable energy, such as wind, solar, and biomass, have attracted increased attention, resulting in the deployment of various methods, many of those ideally being carbon neutral, meaning that no CO2 should be added to the atmosphere [2]. Unfortunately, still in 2016, 80% of the energy generated derived from fossil fuels [3], limiting the extent of achievable decarbonization. The energy mix used in the US in 2019 is shown in Figure 1, showing only 11% renewable energy. However, the amount of renewable energy being generated continues to increase, mainly in the forms of wind power, solar power, and biofuels.
Limitations in energy storage technology and the extent of integration with the power grid system, however, hinders the optimal implementation of these intermittent energy sources [4]. An appealing approach to ensure a continuous, robust energy supply is the conversion of surplus electrical energy to chemical bonds (hydrogen gas, gaseous methane, liquid ethanol) via electrochemical or photo-electrochemical conversion by renewable electricity or direct sunlight [5,6,7], of which water splitting is the simplest example. Due to the relatively high gravimetric energy density and low greenhouse gas footprint of molecular hydrogen, this process is the simplest, but its storage entail several difficulties [8,9]. In this scenario, much of research interests focus on the well-known water splitting reaction. This reaction can be described as two half-cell reactions:
The oxygen evolution reaction OER:
2H2O ⟶ 4H+ + 4e + O2   E° = 1.23 V vs. NHE
As well as the hydrogen evolution reaction:
HER, 2H+ + 2e ⟶ H2   E° = 0.00 V vs. NHE
Overall:
2H2O ⟶ 2H2 + O2   E°cell = −1.23 V; ΔG = 475 kJ/mol
either of which needs an appropriate catalyst to decrease the large overpotential barrier, thus accelerating the electrochemical kinetics. It is noted that the HER, the reaction that synthesizes the fuel, is relatively easy to implement, while the catalysis of OER is more complex and kinetically more difficult, as it requires a four proton-coupled electron transfer (PCET) process and oxygen–oxygen bond formation, which is necessary for the reaction [10].Conventional electrochemical cells for water splitting usually exploit electrocatalysts (IrO2, RuO2, Ni oxides, etc.) to minimize the overpotential and the Tafel slope in order to optimize energy conversion efficiency [11]. However, the onset potential at an electrocatalyst is always higher with respect to the theoretical redox potential of water oxidation (1.23V vs. RHE) due to the thermodynamic energy barriers of this electrochemical reaction. Photoelectrochemical (PEC) cells, on the other hand, use both electrical energy and solar energy and are able to generate larger driving forces and therefore high photovoltage, significantly reducing the onset potential of water oxidation, even below the limit of electrochemical cells, and thus lower the electrical energy required to overcome the energy barrier for oxygen evolution [12].
The photovoltage at semiconductor junctions is generated by the mismatch of the Fermi level between either a p–n junction (of the order of 0.6 V in Si) or a Schottky junction, where an interface metal/semiconductor generates the bending that is necessary to separate the electron–hole pair (Figure 2).

1.2. Photoelectrochemical Cells

It has been long demonstrated by several research groups that PEC water splitting is among the most promising approaches to generate hydrogen directly from solar irradiation [12,13,14]. The photoelectrochemical reaction typically involves several steps: (i) the photon impact at the semiconductor material; (ii) the separation of photo-generated electron/hole pairs in the semiconductor; (iii) the transfer of the charge carriers either to the liquid/solid interface or to the external circuit; and (iv) the water splitting reaction by the charge carriers reaching the interface. This process is governed by the band edge positions of the semiconductor and the redox potential of the solution species. For an n-type semiconductor, the valence band edge must be below the OER potential, while a p-type semiconductor should have a conduction band above the HER potential. An electric field is present at the solid/liquid interface at equilibrium, and a depletion region is formed as shown in Figure 3. The holes (and/or electrons) drift to the interface and inject the protons to conduct OER (or HER). The complementary charge type of the separated carriers may spontaneously transfer to the other electrode to complete the overall reaction. The implementation of PEC cells for water splitting was first conducted by Fujishima and Honda in 1972 using TiO2 as a photoanode and platinum as a cathode [15]. TiO2 based materials then became one of the most extensively studied candidates for high efficiency PEC cells.

1.3. Semiconductors for Water Splitting

Currently, a wide range of semiconductors are being synthesized and studied in order to improve their performance, while in parallel, novel architectures are being developed and implemented. The benchmark in terms of performance is the photocurrent generated by the device; this should be above 10 mA/cm2 in order to be interesting in the context of an industrial application. However, another important characteristic is the stability of the device during a long period of time and continuing operation. In this context, the semiconductors can be classified as (i) single crystal vs. nanostructured and (ii) narrow band gap vs. wide band gap. Single crystals (Si, GaAs, GaP) feature a high diffusion length and high mobility, while nanostructured materials exploit the small distance necessary to achieve a highly efficient rate of charge transfer (e/h+). Regarding the band gap (Eg) width, a large Eg absorbs a narrower fraction of the sun spectrum, resulting in lower absorption, while a small Eg absorbs a larger fraction of the spectrum. In addition, a larger band gap tends to avoid photocorrosion, while a narrow band gap is more susceptible to photocorrosion. The ideal condition for semiconductor stability can be summarized by saying that the Ec and Ev bracket are the E(H/H2) and the E(O2/H2O). Any defect will result in photocorrosion. The stability of semiconductors vs. the redox potential of water splitting is shown in Figure 4.
Other important characteristics for the operation of TiO2 nanotubes are related to charge carrier transport and the rate of recombination. The time constant in TiO2 is strongly dependent on light intensity, and the correlation between transport and recombination is described by Figure 5, showing a fast formation of the exciton (a bound state electron hole attracted by electrostatic forces) and significantly slower transport, resulting in sluggish reactions, especially in relation to the four-hole oxidation (H2O/O2) necessary to generate H2. Calculated water oxidation potential and reduction potential vs. the conduction and valence band edge positions at pH = 0 is shown in Figure 6.

1.4. TiO2 as Photoanodes

Upon the first reported of photoelectrochemical water splitting at the TiO2 surface, TiO2 materials have been heralded as a prototypical semiconductor, which was much investigated as a potential photoanode in past decades [15]. TiO2 is a n-type semiconductor due to its spontaneous reduction in air, forming a Ti3+ and an oxygen vacancy. According to the wide band gap (3.0 eV in rutile, 3.2 eV in anatase form), TiO2 mainly operates as a UV-light absorber, generating electron-hole pairs under irradiation and driving the available photogenerated holes to the solid/liquid interface to conduct the water oxidation process. TiO2 has long been a research focus thanks to its high resistance to photocorrosion in strong alkaline solutions, relatively low cost as an earth-abundant metal oxide, and its lack of toxicity. TiO2 is well known to have at least three distinct crystal phases: anatase (tetragonal), rutile (tetragonal), and brookite (orthorhombic). The conventional unit cells for anatase, rutile, and brookite TiO2 are shown in Figure 7. It has been discussed that the first two phases, especially the anatase phase, display photocatalytic activity towards water oxidation [17,18,19,20]. The main drawback of TiO2 is the relatively wide band gap of 3.0 eV (rutile) or 3.2 eV (anatase), limiting the light absorption to only the UV region of the solar spectrum; thus, only 3–5% of the available photons can be captured, leading to a maximum conversion efficiency of 1.7% [21]. The short minority charge carrier mean free path (of the order of 10 nm) caused by defects such as trap states [22] and sluggish water oxidation kinetics at the electrode/electrolyte interface significantly reduce the amount of photogenerated holes that can reach the surface of TiO2 to conduct the water oxidation process. Furthermore, the charge transfer in the bulk material facilitates the recombination and leads to the photogenerated electron/hole pairs having a short lifespan. Based on these limitations, many efforts have been devoted to overcoming the known restrictions, including (i) designing nanostructures to increase the charge transfer and decrease the bulk recombination; (ii) extrinsic metal/anion doping or inducing formation of oxygen vacancies/Ti3+ to modify the band structure and improve the optical absorption; and (iii) surface modification to reduce the interfacial recombination and improve water oxidation kinetics.

2. Anodic TiO2 Nanotube Arrays (NTs)

Synthesis of 1-D TiO2 nanotubular structures through the electrochemical anodization of metal/alloy planar titanium foil or sputtered substrates has been considered to be one of the most cost-effective and versatile approaches to generate TiO2 nanostructures, as it can be precisely customized in terms of the morphology, the diameter of the pore sizes, and the length of the NTs by simply tailoring the anodization parameters [13]. Initially, anodization of Titanium foil in common acidic electrolytes usually only generated dense TiO2 layers at the surface and could not form a porous structure. By tuning the physical conditions and the electrolyte chemistry, however, an appropriate balance between the Ti dissolution condition (Ti to Ti4+ or [TiF6]2−) and oxide layer growth is required in order to finally obtain a tubular morphology [23,24].
The growth process of TiO2 NTs entails the following steps: (i) the initial compact layer of TiO2 is formed on Ti foil under a high applied potential; (ii) the as-formed oxide layer is attacked by the F ions. TiF62− ions are generated and then diffused into the electrolyte; meanwhile, oxidation further propagates into the substrate; (iii) a relatively disorganized porous layer is formed with the shadow gaps filled in; (iv) with the increasing of the anodization time, the interior of the layer is dissolved and separated tubes are formed; and (v) the length of the tubes will increase according to the reaction time until the nanotube structure collapses due to the thinning of the tube mouth. Aqueous electrolytes containing HF are able to generate TiO2 NTs with relatively irregular shapes and a maximum thickness of 500 nm, while a KF based solution can extend the length of the NTs to ~2.5 µm. The formation of TiO2 NTs in organic solutions such as ethyl glycol or glycerol with a low water content has now been demonstrated to be an effective approach to generate strongly ordered TiO2 nanotube arrays with a thickness that is up to several hundreds of microns due to the reduced etching rate. The TiO2 NTs grown via anodization are typically non-crystalline and thus require annealing to form crystalline phases such as anatase or rutile, to increase the mechanical stability. An annealing temperature of 350–400 °C in air has been found to be optimal to fabricate anatase TiO2 in terms of charge transfer. In addition to the improved 1D charge transport properties, spontaneous n-type doping, and a large surface area geometry compared to planar TiO2, the NTs structure also benefits from allowing a short distance between the sites of water oxidation and the solution species, such that all the photogenerated charge carriers are within a diffusion length of ~100 nm [25]. However, TiO2 NTs still suffer from the abovementioned limitations as a TiO2-based material.

2.1. Defects in TiO2 and TiO2-x Sub-Stoichiometries

The Ti 3d and O 2p states are the relevant energy levels that form the band edges of the conduction band and the valence band respectively, and they define the bandgap for TiO2 materials [26]. Electronic and optical properties of TiO2 strongly depend on the bulk or surface defects, and particularly on the formation, presence, and concentration of bulk or surface Ti3+ states and oxygen vacancies (Vo) [27]. The large bandgap of TiO2-based materials could be narrowed by introducing intrinsic defects such as oxygen vacancies and Ti3+. Such defects are usually present in small fractions in NT structures due to a slightly Ti-rich stoichiometry caused by the anodization condition, while a relatively large amount of these defects can be generated via proper chemical/electrochemical reduction methods [28,29]. The unsaturated surface species such as Ti3+, Ti2+, or even Ti+ can be generated under high-vacuum, unreactive gases (Ar or N2) or a reduction of the gas annealing condition (H2 or NH3), where TiO2 tends to split off of O2 or H2O to from the product and form bridge oxygen and reduced Ti states [26]. During relatively long-term annealing, the surface reduced Ti species can also deeply diffuse into the bulk TiO2. Similar results can be obtained by noble gas ion sputtering (Ar), ion-implantation (N or H), or plasma treatment.
Various defect states are generated in the bandgap by Ti3+ coupled with Vo, usually 0.5–0.7 eV below the conduction band, which generates isolated electronic states in the TiO2 bandgap and minimizes recombination. Increased defects are typically followed by a color change from white/grey to dark blue or even black as a result of the extension of solar absorption [30]. For comparison, doping is also capable of increasing photon absorption by creating electronic states that are close to the conduction band with transition metal cations or to the valence band with major group anions. However, these extrinsic dopants may behave as charge carrier recombination centers by lowering the PEC performance or as charge transfer mediators by enhancing photoactivity depending on the dopant density, energy level, d-band configuration, and uniformity [31,32].
Annealing TiO2 in a high vacuum or reduction atmosphere leads to a deviation from the 1:2 stoichiometry, forming oxygen-deficient TiO2−x. Oxygen vacancies in TiO2−x can be accommodated as point defects with an x value up to 10−3 to 10−4, while beyond this point, the existing crystal structure is no longer stable, and the off-stoichiometry is stabilized by phase transformation to Magneli phases (TinO2n−1, n = 3 to 10), which exhibit a gradually lowering bandgap and increasing metallic property. In particular, Ti4O7 has been reported to exhibit a much lower bandgap of 0.6 eV at room temperature compared to anatase TiO2 (3.2 eV), possibly broadening the absorption of TiO2 from a wavelength of 387 nm to the far infrared region. Ti2O3 and Ti3O5 exhibit semi-metal behavior with a relatively high conductivity of ~0.1 Ω cm. Several efforts related to the bandgap and the oxygen composition of TiO2 sub-stoichiometries, including Magneli phases, are summarized in Figure 8, as reported by Nowotny et al. [33]. The figure also implies a strong trend, suggesting that an increased oxygen deficiency could effectively narrow the bandgap or introduce mid-gap states. A narrowed bandgap close to metallic levels however results in the incident radiation being difficult to separate from the electron/hole pairs, such as the fact that it is possible to exhibit reduced photo-catalytic properties. The optimum amount of oxygen deficiency and the best reduction level degree for photoelectrochemical water oxidation using TiO2-x as the photoanode has yet to be optimized.

2.2. Water Oxidation at the Interface

Besides the limited optical absorption, the PEC operation of the TiO2-based materials is also hindered by the flow of holes into the electrolyte at the electrolyte/electrode interface to induce water oxidation as well as the separation of the electron/hole pairs in bulk. Because the photogenerated hole flux is usually larger than the rate at which they can be injected into the solution species, holes often accumulate on the surface, and recombination occurs. It is well known that water oxidation is a 4-electron transfer reaction and that pristine TiO2 materials do have limited electrochemical catalytic activity, which results in slow water oxidation kinetics and a limited hole-injection efficiency at low applied potential. The issue can be addressed by modifying the TiO2 surface by adding more active sites or by depositing nanoscale electrocatalysts. Therefore, a proper modification method or catalyst is required to improve the water oxidation selectivity on the surface of TiO2 NTs. Meanwhile, to identify the conditions where the PEC performance of the TiO2 NTs is limited by water oxidation, which also plays an important role in quantifying the effects of the surface modification methods/catalysts.

2.3. Manipulating TiO2 Defects to Enhance Solar Conversion

In this section, we seek to provide and investigate a number of methods to modify TiO2 materials with the aim (i) to increase the generation of point defects; (ii) to synthesize TiO2-x sub-stoichiometries by a strong reduction; and (iii) to develop surface modification methods to enhance light absorption, improve charge transfer property, and increase interfacial water oxidation selectivity. Additionally, we seek to improve and augment the existing modification approaches simultaneously. We assume that an optimal level of point defects (dopants, O vacancies, Ti3+) may maximize the photoelectrochemical performance either in the form of point defects in the anatase phase or as a crystalline disorder in newly formed phases; the correct balance of photoelectrochemical properties results in the synergic effect of increasing the light absorption, minimizing the surface recombination, and improving the bulk conductivity. Various modification methods will be applied to control the defect density, mainly through oxygen removal; the stable range of anatase TiO2 with nanotubular morphology will be determined, and the subsequent possible phase transformation will be investigated. The density/types of the created defects will be evaluated and quantified using photoelectrochemical characterization as an overall benchmark together with electrochemical impedance spectroscopy. Light absorption properties of the modified TiO2 NTs will be determined by measuring the incident photon-to-current conversion efficiency (IPCE) change with various wavelengths of the incident light.

3. Nanotubes and Their Modification

3.1. Nanotubes Formation and Modification

TiO2 nanotube arrays were grown on a Ti foil using a double-anodization method in a ethyl glycol electrolyte containing NH4F and water (<5%) with a fixed applied potential of 50 V [34]. The lengths of the nanotubes are controlled by the anodization time. For the nanotubes with a large-gap in between, diethyl glycol was used instead, and the anodization time and water content was controlled in order to tailor the surface morphology [35]. The as-anodized TiO2 were annealed in air at 350 °C to crystallize the anatase phase.
Laser modification was applied by irradiation from a KrF excimer laser (λ = 248 nm) on NTs immersed in deionized (DI) water; the hydrogen reduction of TiO2 sub-stoichiometries were conducted by annealing the NTs in a tube furnace under a mixed gas flow of hydrogen and argon at temperatures ranging from 650 to 850 °C; electrochemical hydrogen doping was conducted in sulfuric acid solution using chronoamperometry; Ar/NH3 modification was applied at a relatively mild temperature of 450 °C in a sequential gas flow of Ar-NH3-Ar.

3.2. Characterization Methods

The crystal structure and phase amount of the TiO2-based materials was determined using X-ray diffraction (XRD), and Rietveld refinement of the X-ray patterns was performed to analyze the phases with low symmetry, such as Magneli phases. High-resolution transmission electron microscopy (HR-TEM) and fast Fourier transform (FFT) were used as a support to the XRD and the refinement results to identify the crystalline phases and the changes caused by the modification methods. The surface morphology and elemental composition were assessed using scanning electron microscopy (SEM) coupled with energy dispersive X-ray spectroscopy (EDS). The oxidation state of the elements and their composition on the surface were further characterized using X-ray photoelectron spectroscopy (XPS) equipped with an argon ion sputtering gun. Electron paramagnetic resonance (EPR) was applied to investigate the bulk Ti3+ species.

3.3. Evaluation for Water Oxidation Selectivity at Electrode/Electrolyte Interface

Recombination not only occurs in the bulk but also occurs on the electrode/electrolyte interface of a PEC cell. By comparing the photoresponse in the electrolyte to that with a hole scavenger solution, which has close to unit water oxidation selectivity, the water oxidation selectivity at electrode/electrolyte interface can be evaluated, provided that the charge separation efficiency in both cases is the same. The charge separation efficiency is used to describe the ratio of holes reaching to the surface of the overall photogenerated holes. The water oxidation selectivity, also known as hole injection efficiency, is to describe the holes that are able participate in the surface reaction compared to the total number of holes that can reach the surface. Sodium sulfite is mainly discussed as an example [36]. PEC water splitting occurs in a potassium hydroxide solution or a phosphate buffer solution, while the oxidation of SO32− drives the generation of a photoresponse in a hole scavenger solution, instead [37,38].

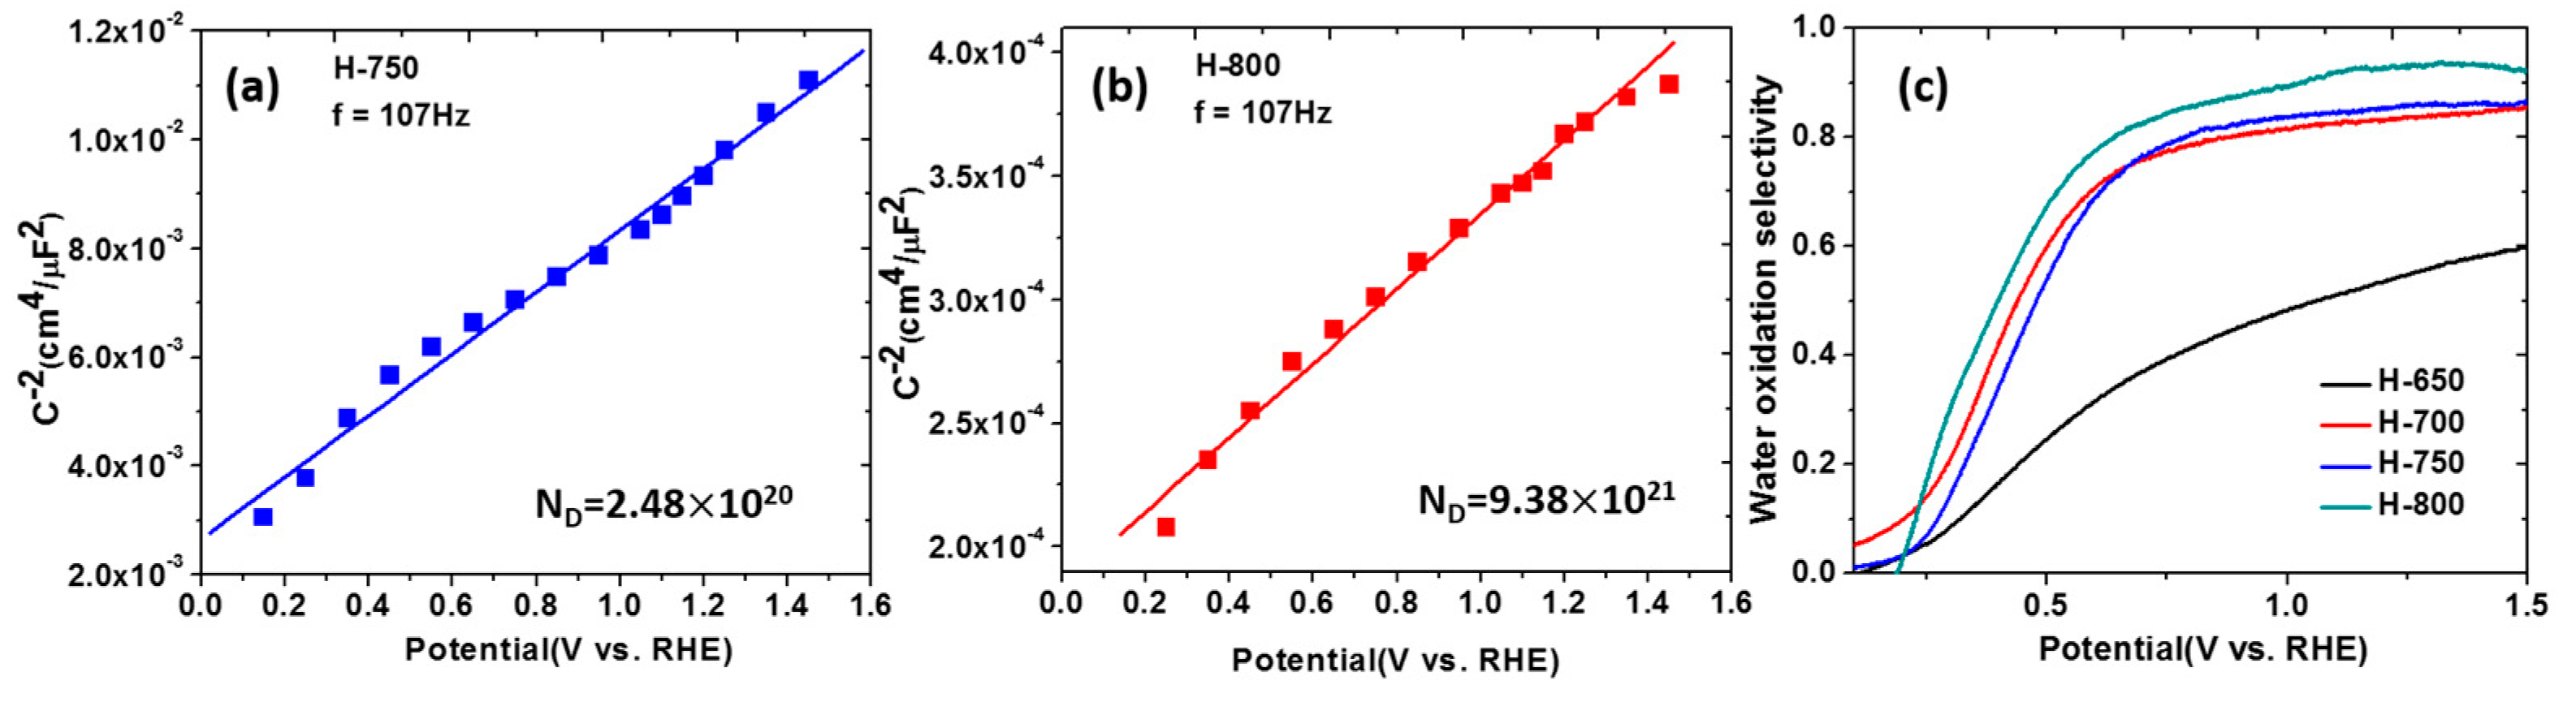
3.4. Determining the Density of Defects and Flat-Band Potential on TiO2 NTs

For an n-type semiconductor, the Fermi level (EF) is often higher than the redox Fermi-level of the electrolyte (EF (redox)) when it first comes into contact, such that the electrons transfer from the semiconductor to the vacant states (Ox) of the solution occurs in order to achieve equilibrium. As the semiconductor carrier density is lower than that of the solution, the space charge region is balanced by the charge of the electrolyte. Varying the voltage of the semiconductor by an externally applied potential will select the Fermi levels of the semiconductor and the electrolyte such that the band bending can be tuned by the applied potential. Under cathodic bias (the redox potential of the electrolyte is used as the reference), the majority of charge carriers (electrons) will accumulate at the interface, and the bands will bend upward, while at the anodic bias, the bands bend downward, and the electrons will be away from the interface in the depletion region. In the flat band potential (Vfb) condition, the band bending effect is neutralized by the applied potential. The Mott–Schottky equation shown below can be used to determine the flat band potential of the semiconductor as well as the donor density (ND) in the depletion region (when EF > EF (redox)) [39].
1 C 2 = 2 ε ε 0 e N D ( E E F B k B T e )
where C represents the semiconductor capacitance, ε is the relative permittivity (~100 for TiO2), ε0 is the dielectric constant, e is the electron charge, ND is the donor density, E is the applied potential, EFB the flat band potential, kB is Boltzmann’s constant, and T is the absolute temperature [40,41]. In particular, the donor density can be calculated from the slope, and the flat band potential can be obtained at the intercept. To obtain the capacitance, electrochemical impedance spectroscopy (EIS) is applied to determine the frequency with the highest capacitance, corresponding to the largest imaginary component in the impedance at this frequency [42]. This method will be conducted as a quantitative analysis and support to the XPS, EDS, and EPR measurements.

4. Some Examples of Rational TiO2 Modification

4.1. Intercalation, Sensitization and Catalysis

A simple method to enhance both the light absorption and the catalytic activity of TiO2 is the intercalation of Li in TiO2 nanotubes via electrochemical biasing, inducing the reduction of Ti4+ in TiO2 to Ti3+. The mechanism can be described by the following reactions [22]:
H+ + Ti(IV)O2 + e ⟶ H-Ti(III)O2
Li+ + Ti(IV)O2 + e ⟶ Li-Ti(III)O2
TiO2 nanotubes sensitized by bacteriochlorophyll-c (BChlc) extracted from photosynthetic bacteria yields a significant conversion efficiency to H2, making a promising candidate for a naturally derived sensitizer for TiO2. The photocurrent conversion efficiency of 0.1% was observed at 600–800 nm, corresponding to the absorption peak in BChlc; a photoanode efficiency of 0.23% was measured at around −0.1 VSCE [43].
Titania nanotubes have broad potential as a scaffold for nanoscale semiconductors. The two candidate materials investigated in this experiment are Cu2O and α-Fe2O3. We have used electrodeposition to fill in these narrow bandgap (∼2eV) materials with TiO2 and investigated their photoelectrochemical response. These composites convert solar light in the visible range, resulting in integrated quantum efficiencies of up to 2%. The two sensitizers behave quite differently due to a vast difference in the bond strength, leading to a size difference [44].
While TiO2 nanotubes are a promising configuration for water dissociation, their performance is constrained due to the limited absorption, charge recombination, and the sluggish kinetics of the water splitting reaction. To maximize conversion efficiency, we investigate the balance between the increased absorption in longer nanotubes and the corresponding recombination. We demonstrate that Li doping extends the optimum nanotube length from 7 to 15 microns, yielding a photocurrent of 1.5 mA cm−2 under simulated sunlight at 1.65 VRHE. Moreover, we determine the conditions where photocurrent conversion is limited by the kinetics of the oxygen evolution reaction (OER). Under conditions where water oxidation was a limiting factor, the addition of a CoOx OER catalyst provided up to a two-fold improvement in the photocurrent under a small-applied bias of 0.4 VRHE. The significant increase in performance with a catalyst led to the investigation of another catalyst, either for OER and HER. For example, binary and ternary Ni-P-X (X = W, Mo) exhibit high electrocatalytic activity toward HER, with some Ni-Mo-P alloys approaching the performance of Pt foils. The activity of Ni-based alloys decreases with increasing P content but increases with the increasing content of W or Mo. Vanadium and their oxides have also shown high levels [45,46,47,48].

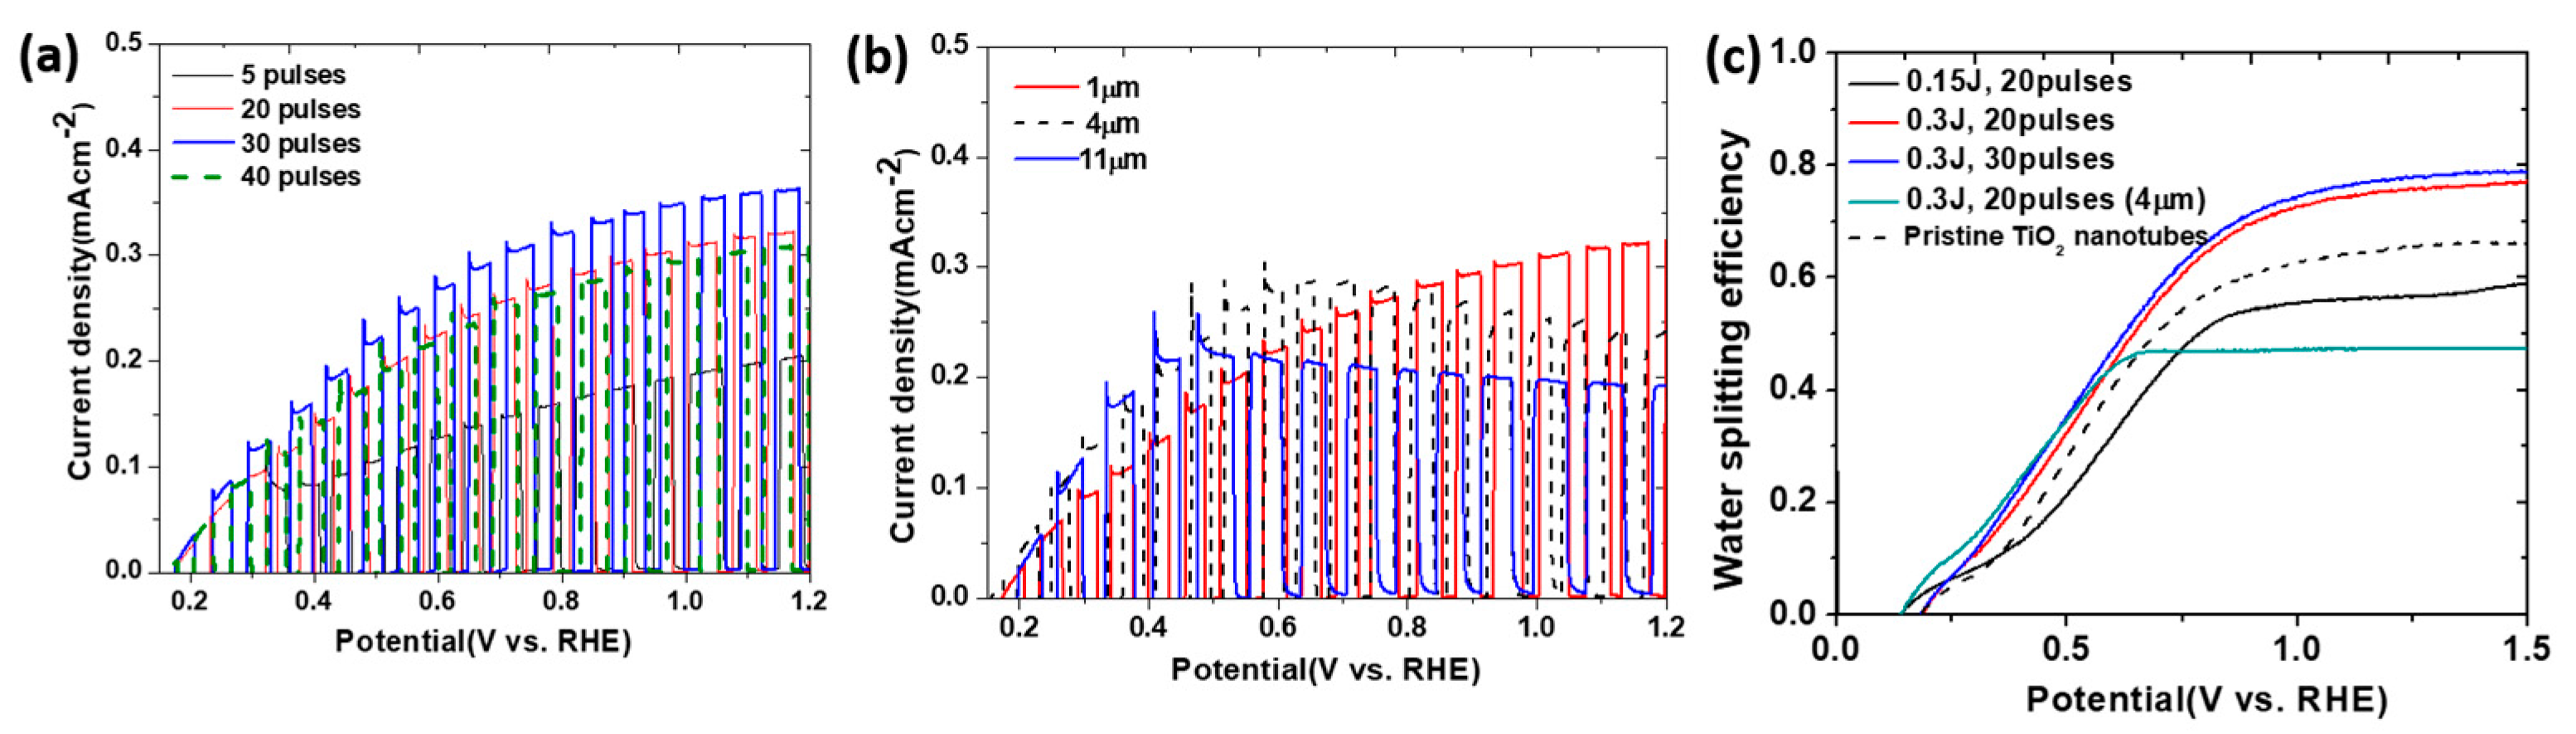
4.2. Laser Irradiation for Surface Modification

Extreme conditions are required to introduce surface defects on TiO2 materials, as has been reported by many works. Molten Al can partially reduce the surface of TiO2, and can meanwhile create a shell of TiO2−x, as reported by Yang et al. [49]. TiO2 prepared for 5 days under a 300 ± 5 psig pure H2 atmosphere at 200 °C or 24–102 h under 10% H2/90% Ar at 400–500 °C is required to generate yellow and black TiO2, as reported by Leshuk et al. [50,51]. Black TiO2 is obtained by Lu et al. after 15 days of treatment [52]. Therefore, to create a surface disorder with simpler and more rapid methods is highly desirable. In this work, treatment under KrF excimer laser (λ = 248 nm) irradiation is conducted in DI water is discussed as an example. A modified surface on the surface of NT arrays is introduced, while the remaining NT arrays remain in the nanotubular structure.
To investigate the laser energy fluence influence, the lengths of the tubes were kept constant at 1 micron, and the pulses per area (PPA) were kept at 20 times. The photocurrent density of pristine TiO2 and laser treated TiO2 is compared in Figure 9. The energy fluence ranges from 0.15 to 0.4 J/cm2. A plateau between 0.6 and 1.2 VRHE is observed for all the samples, which indicates an increasing photocurrent density with potential. A 1.5-fold improvement is obtained when the photocurrent density increases from 0.23 at an energy fluence of 0 J/cm2 to 0.32 mA/cm2 at an energy fluence of 0.3 J/cm2. At higher irradiation energy fluence (0.4 Jcm−2), the NTs show a comparable current density to the pristine NTs, while the photoresponse decreases at an even higher energy fluence. The photocurrent transients of the pristine NTs show a significant decay, which is caused by significant recombination. For the laser modified NTs, the current transients at a similar potential range show a less noticeable recombination feature, which implies that surface modification introduced via laser allows the partial annihilation of trap states.
The donor density obtained from the slope of the Mott–Schottky plots of the linear region is 3.9 × 1019 cm−3 and 2.66 × 1020 cm−3 for the pristine and the laser modified NTs, respectively. This suggests a close-to-one order of magnitude increase of shallow carrier density, as shown in Figure 9. The density of trap states is obtained from the low frequency capacitance at the maximum value at different applied biases [54,55]. Figure 9 indicates a 0.5 VSCE maximum value of capacitance, which reflects a trap state density of 9.3 × 1016 cm−3. In contrast, the laser modified NTs do not show obvious maximum values in capacitance in the same potential window of 0.4 to 0.8 V. This indicates that the density of the trap states can be reduced by laser surface treatment, which is probably caused by the trap state passivation effect induced by the generation of hydrogen caused by water splitting under the laser irradiation, while the lattice disorder is created on the surface of NTs simultaneously [56]. The optimum photocurrent density of 0.3 J/cm2 at a pulse per area of 20 can be therefore linked to two different effects. First, the photocurrent density is improved with the increasing energy fluence as the donor density in the modified region is increased. Second, the higher energy fluence (>0.3 J/cm2) gradually increases the thickening of the surface modified layer such that the total number of photoinduced charge carriers is reduced.
At a fixed energy fluence of 0.3 J cm−2, the PPA was changed in order to understand the influence of the PPA on the PEC performance. A PPA of 30 was determined to be optimum on 1 micron nanotube arrays, as shown in Figure 10. This leads to a photocurrent density of 0.36 mA·cm−2, which is a 1.6-fold increase of pristine NTs. The photocurrent is improved due to the enhanced charge transport at a relatively low PPA (no more than 30), while the increasing thickness of the laser modified disordered layer on the surface limits the absorption of the incident light, and therefore, the total number of photogenerated charge carriers is decreased. The influence of the length of nanotube arrays is further investigated. The photocurrent density augments monotonously before the potential reaches 1.0 V, and the photocurrent density of 4 µm and 11 µm nanotube arrays is higher until the potential reaches 0.5–0.6 V. The photocurrent density decreased at higher potentials for the 4 µm and 11 µm NTs. As the applied potential increases the charge transport driving force, the recombination rate accelerates, leading to a decreased mean free path [57]. The overall number of electrons at the back contact is lower with an increased NT length. As such, the optimum laser treatment condition is determined as 30PPA, 0.3 J·cm−2 at 1 µm TiO2 NT.
Water oxidation selectivity is considered to be another important factor that determines the rate of water splitting caused by PEC. The water oxidation selectivity is evaluated by measuring the photocurrent density in a phosphate buffer solution without or with sodium sulfite, a hole scavenger species. The water oxidation kinetics is the rate limiting step for all of the pristine and laser-modified NTs at relatively low potentials from 0.5 to 0.7 V. For the laser modified NTs, the water oxidation selectivity is measured to be 78% compared to 65% for the TiO2 NTs without modification, which is shown in Figure 10.
In conclusion, laser modification on the surface is proven to be a simple and fast treatment method to introduce crystal disorders on the surface of titania nanotube arrays, and the optimum parameters for the energy fluence and PPA of laser and the length of nanotubes are determined with a 1.6-fold improvement of the overall photocurrent density. The improvement, however, is still limited, and therefore, it is essential to discuss other modification methods to introduce defects that are not only limited to the surface.

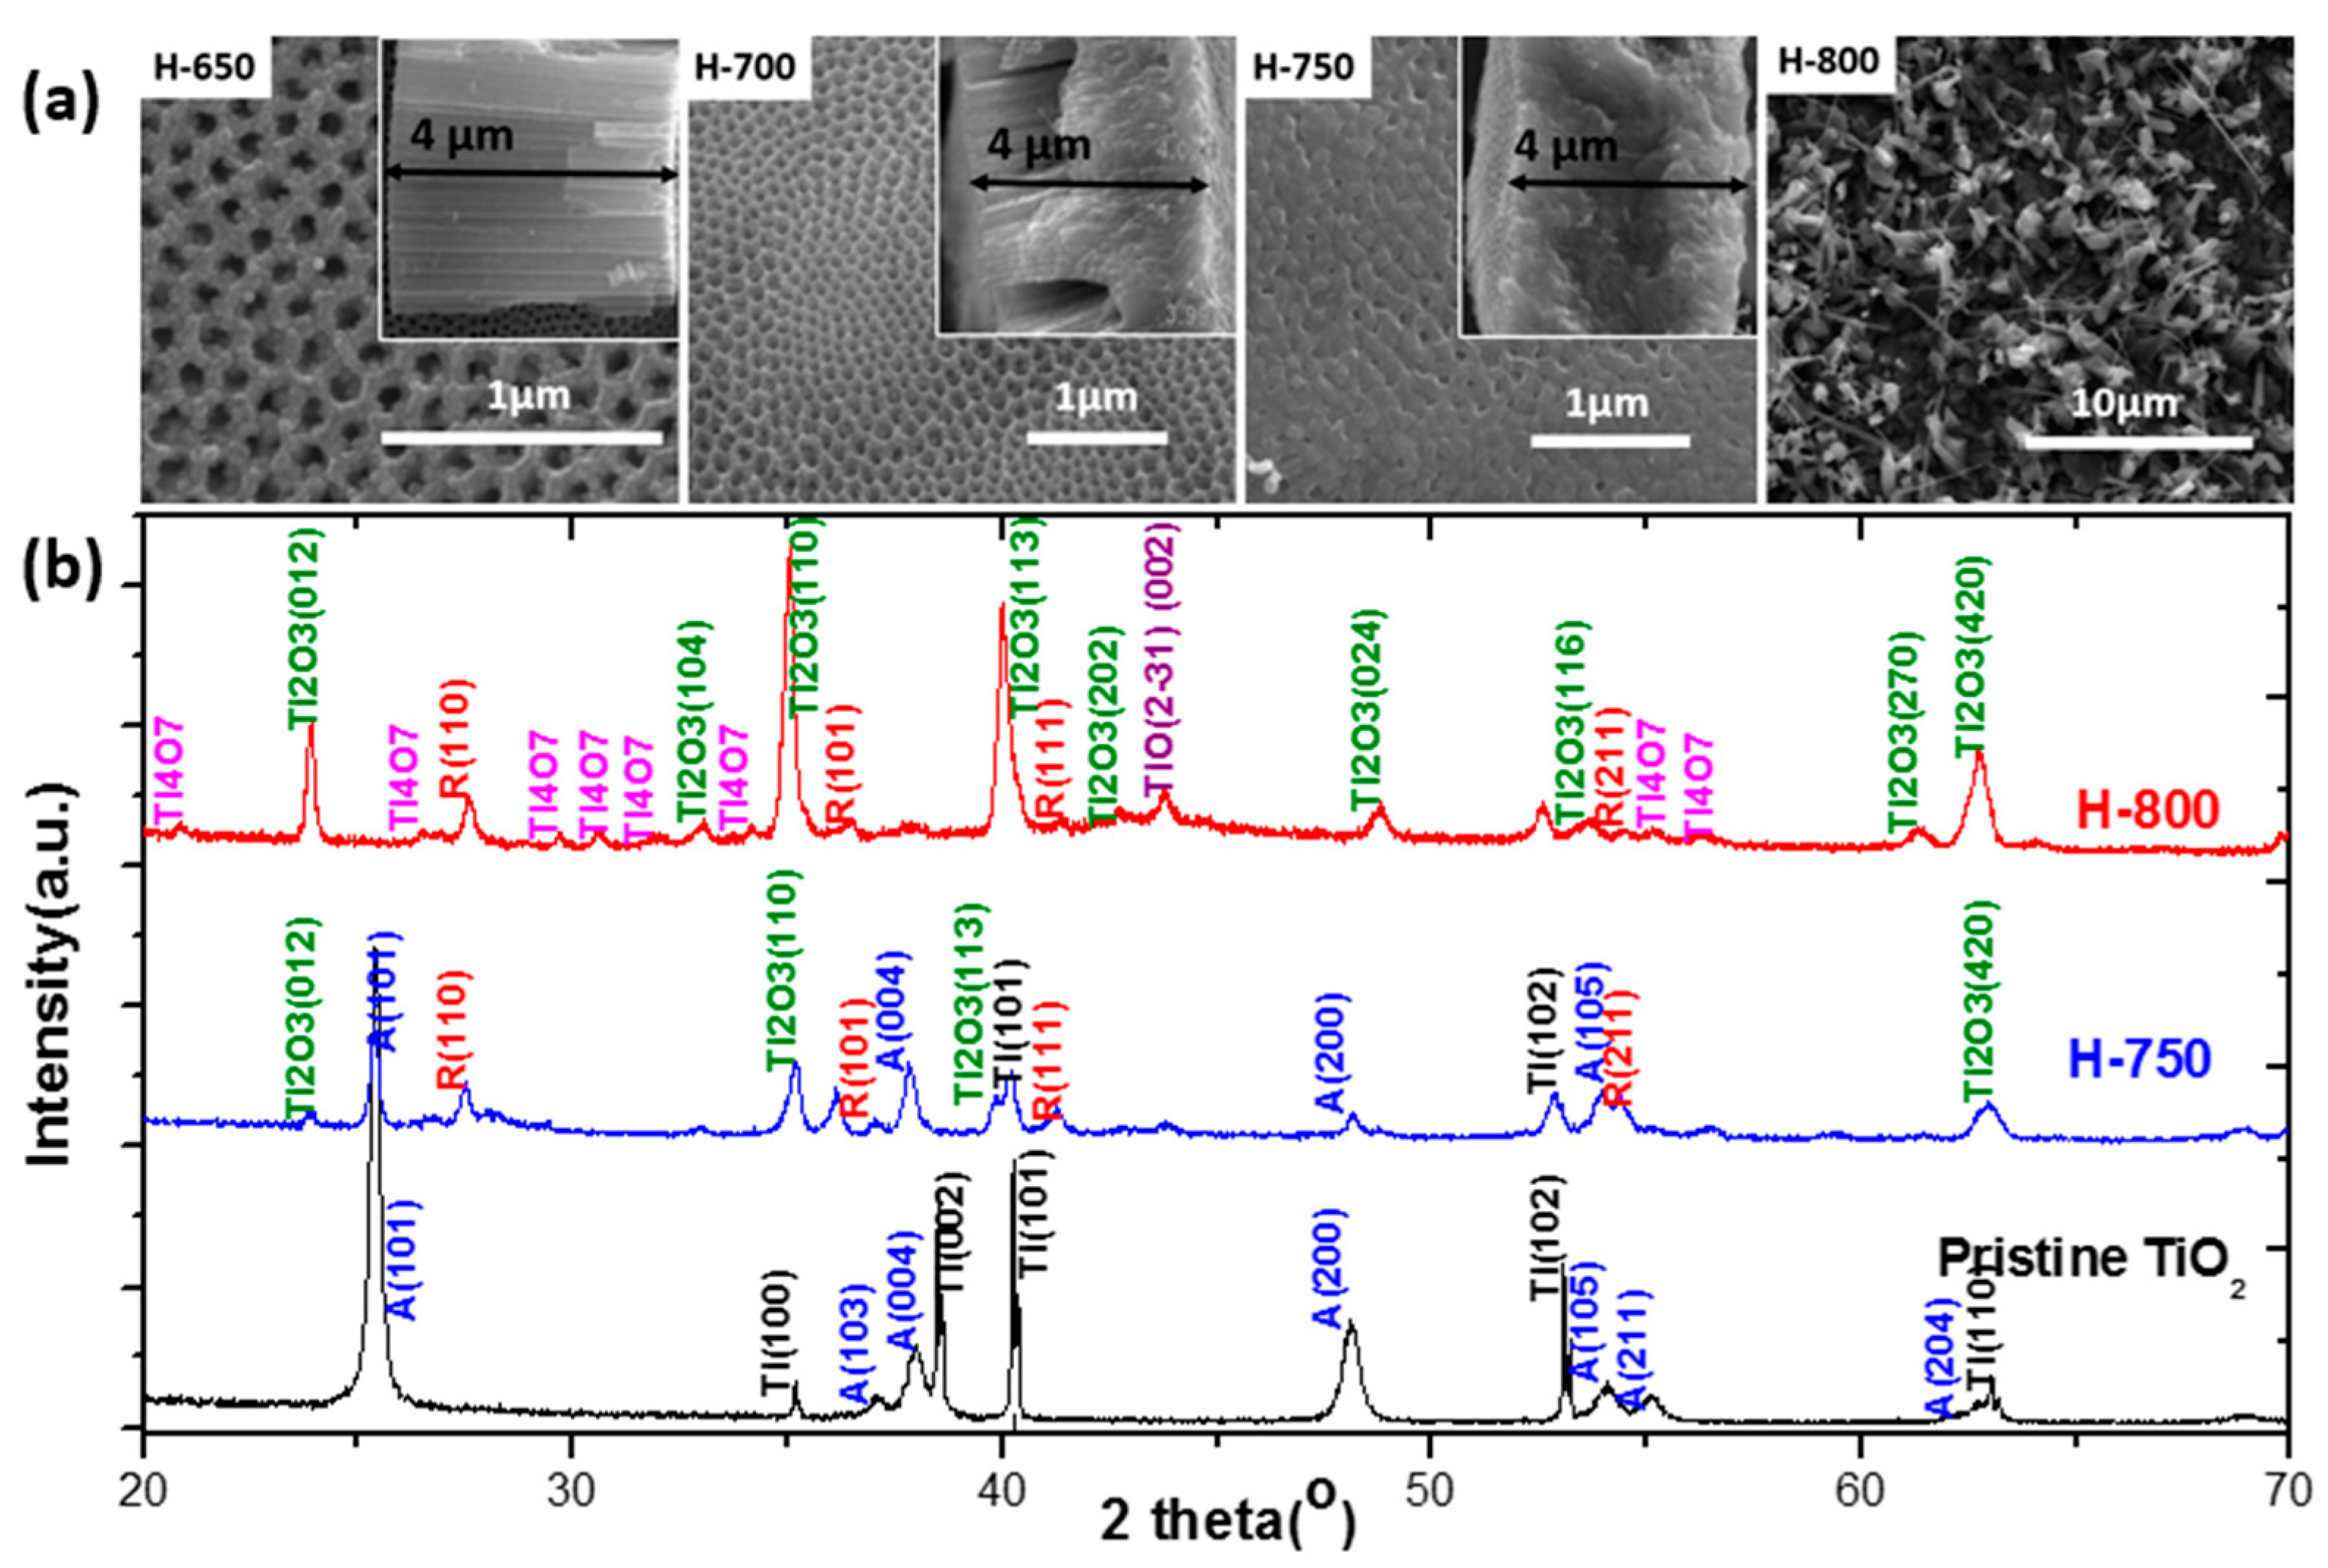
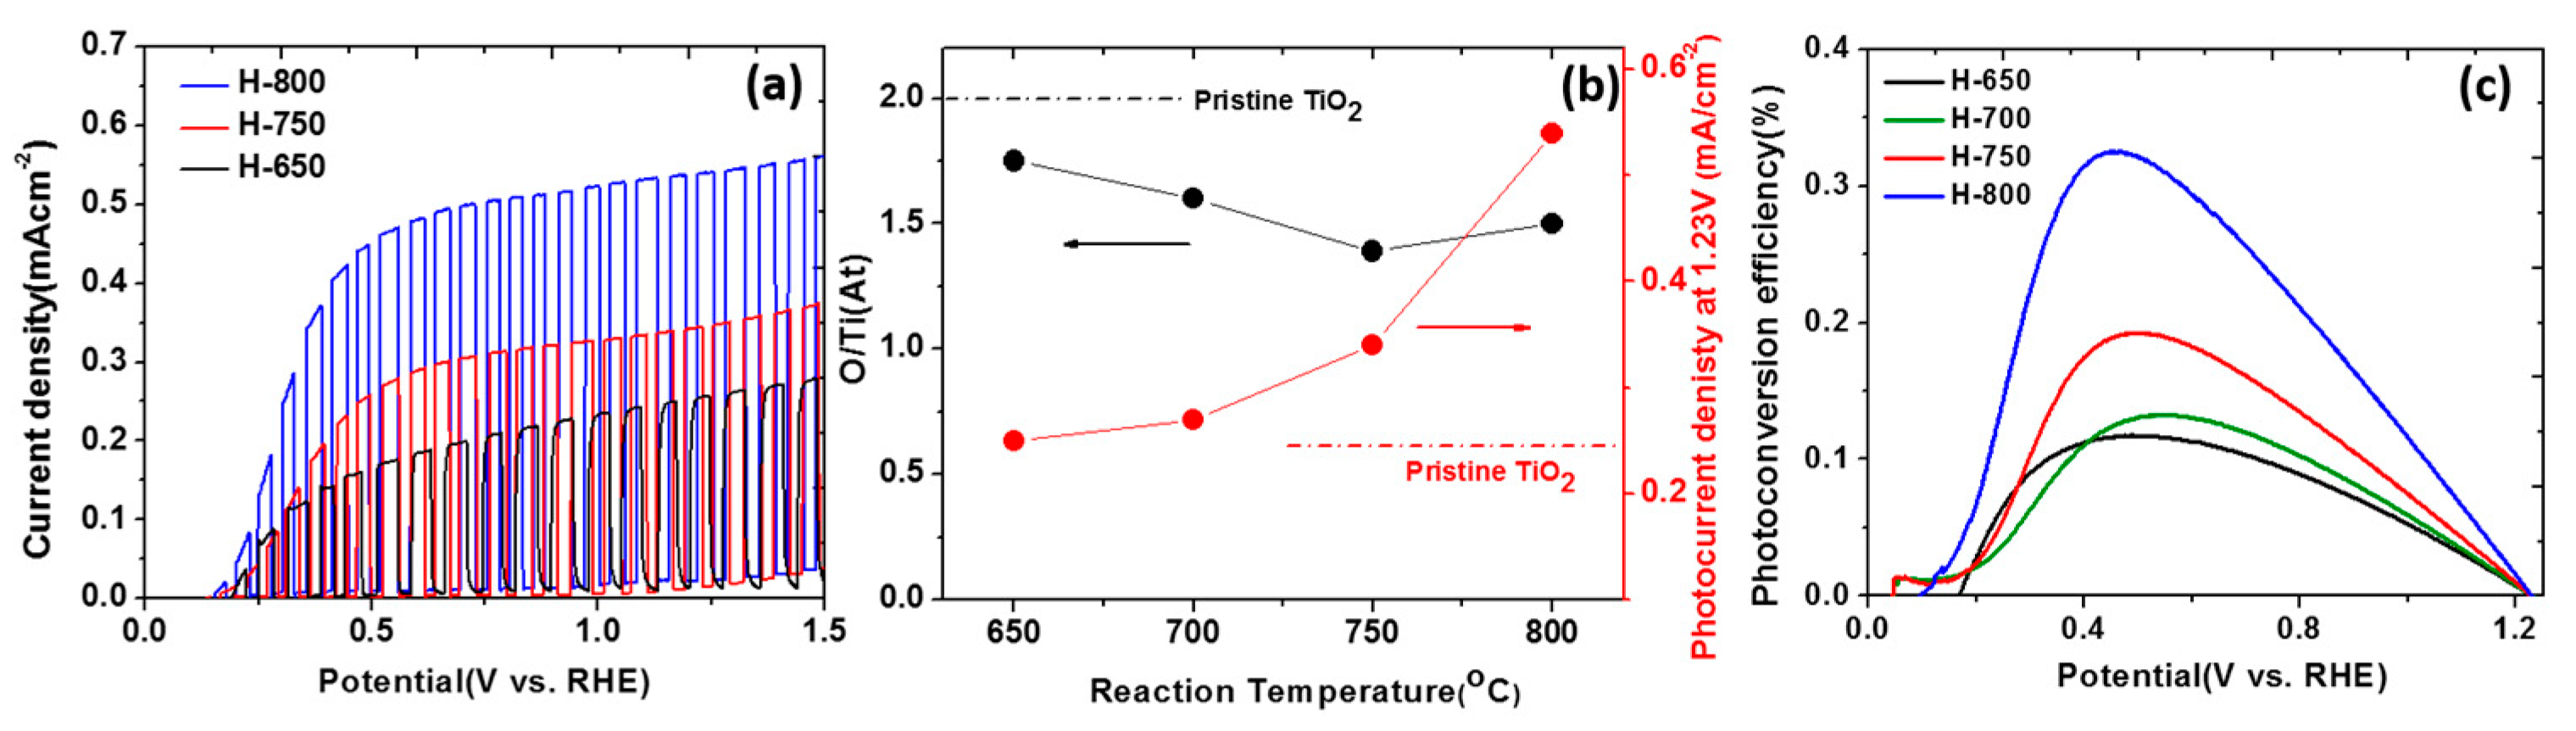
4.3. Phase Transformation of TiO2 for PEC

Typically, thermal hydrogen treatment at ambient pressure is usually applied to fabricate black titania. Hydrogen can create oxygen vacancies by partially or fully reducing Ti4+ to Ti3+, with physical or chemical property changes accordingly [58,59,60]. Wang et al. [59] reported the synthesis of hydrogenated black TiO2 nanowires and NTs through annealing at a high purity H2 atmosphere at 200 to 500 °C. Chen et al. [60] treated bamboo-type TiO2 in a H2 atmosphere at 400 °C for 1h and demonstrated enhanced PEC and supercapacitor properties due to increased conductivity. Zhu et al. [61] reduced TiO2 NTs under a gas mixture of H2 and argon at 400 to 550 °C, resulting in a reduced work function and higher conductivity. Up until now, most studies based on the reduction of TiO2 NTs have been restricted to relatively low annealing temperatures (<700 °C) in order to maintain the nanotubular morphology. In the next discussion, we focus on relatively high temperatures (above 700 °C) in the hydrogen atmosphere in order to understand the degradation behavior of the shape of the nanotube and the formation of a new porous structure. The phase transformation and the relevance to photoelectrochemical performance will also be discussed. A superabundant number of oxygen vacancies are generated, which is sufficient to obtain Magneli phases, which have a lower band gap and an enhanced conduction. The donor density at the electrode/electrolyte interface is evaluated using the Mott–Schottky method, and the recombination at the interface is investigated by evaluating the hole injection efficiency using the hole scavenger species as abovementioned.
The nanotube structure is maintained for the H-650 sample (650 °C annealed), and particles are observed on the top of the nanotubes, as shown in Figure 11. The pore size of the nanotubes starts to shrink after 700 °C annealing, which is further drastically decreased with increasing temperature. At 750 °C, the tubulous structure degrades. At 800 °C, the TiO2 totally loses the nanotube structure, while a morphology of nanowires mixed with micro-sized particles forms instead. This is because of the complete degradation of the NTs and the phase transformation at high temperatures. X-ray diffraction is conducted in order to understand the phase transformation behavior. NTs without thermal hydrogen treatment indicate anatase phase as a result of the 350 °C annealing in air, while the substrate showed an hcp phase of α-Ti, as seen from Figure 11. The anatase phase peak intensity decreases for H-750, while peaks from rutile TiO2 occur, as the rutile phase is thermodynamically favored [62]. Formation of Ti2O3 can be determined from the peaks from the (012), (110), and (113) facets. For H-800, a complete phase transfer is observed. Corundum Ti2O3 is one of the main phases, and Magneli phase Ti4O7 also exist. The presence of TiO is also determined by peaking occurring at ~44°, which comes from the diffraction of the (2–31) and (002) planes.
The shrinking of the pores on the surface can be explained by the phase transformation, where the various phases formed from the initial anatase are in fact likely nucleating both at the tube mouth and at the interface between the Ti and the TiO2 nanotube [64]; to further investigate the phase fraction, Rietveld refinement was applied. The phase fraction of the TiO was determined to be 64.3 At%, while the value of Ti2O3 was 22.9%. The phase fraction of Ti4O7 and TiO was determined as 11.2 At% and 1.64 At%. These results show that the first three newly formed phases are dominant.
Photoresponse as a function of applied potential under chopped AM1.5G solar irradiation for samples annealed at 650, 750 and 800 °C is shown in Figure 12. The photocurrent density first increases with potential before 1.0 V. The photocurrent density is increased at 1.23 V for H-650 from 0.23 mAc006D2 for pristine NTs to 0.25 mAc006D2. For H-750, the photocurrent at the same potential is improved to 0.35 mAc006D2. For H-800, the photocurrent density is maximized with a value of 0.54 mAcm−2, which is 2.4-fold that of pristine NTs. The photocurrent density for NTs is improved in a thermal treatment temperature ranging from 650 to 800 °C, and the photoresponse decays at a temperature higher than 800 °C. The oxygen loss is also associated with the hydrogen intercalation into the TiO2 lattice, which is reported by Amano et al. [65]. This can contribute to p-type or n-type conductivity. The atomic hydrogen intercalation in titania can adjust the hydrogen energy level to around the titania conduction band minimum, which explains the improved photocurrent density for hydrogen thermal annealed NTs. The photoconversion efficiency vs. the applied bias is shown in Figure 12. A maximum energy conversion efficiency of 0.12% is shown for H-650, and the value of H-700 and H-750 increased to 0.13% and 0.19% respectively. H-800 showed the highest energy conversion efficiency of 0.33% at 0.45 V. A time of 0.5 h was determined to be optimum, as 2 h treatment showed same photocurrent.
The Mott–Schottky method was applied to investigate the donor density for NTs annealed at various temperatures. H-750 and H-800 indicated an increased doping level of the 1 and 2 orders of magnitude respectively, as shown in Figure 13a,b. The high donor density for H-800 is mainly because of the TiO, which is metallic. The IPCE, however, is not significantly improved in the visible light region, which leads to a conclusion that the improved charge transport and the accelerated surface kinetics are responsible for the improved PEC performance.
The water oxidation selectivity for NTs with various annealing temperatures is shown in Figure 13c. The increased selectivity is attributed to the increase of the lifespan of the holes that are separated by the applied potential [66]. Saturation values can be reached between 0.6 and 1.0 V for all other samples. This is probably because the rate determining step at low bias is the interfacial recombination, while the hole injection at this potential range is limited by the low electric field. The selectivity of H-650 is close to that of the pristine NTs. The water oxidation selectivity for H-700, H-750, and H-800 was determined to be 85%, 87%, and 92% respectively, which implies that at high applied potential, the interfacial recombination is no longer the rate limiting step. The saturated photocurrent is related to the maximization of the space charge layer within the nanotubes or in the filamentary morphology (for H-800) [67]. Another possibility is that saturation results from the Fermi level pinning, when a high defect density is generated [68]. We therefore conclude that for the hydrogen reduced NTs, the rate-determining process is not the recombination at the interface at highly applied potential, and the Fermi level pinning effect or the space charge layer limitation dominate the process instead.

4.4. Introduction of Ti3+ and Oxygen Vacancies in TiO2 NTs

One of the most promising methods to synthesize black TiO2 is nitrogen doping, as per the report of Asahi et al. [30,69,70]. The localized oxygen vacancies are at 0.75 to 1.18 V below the conduction band minimum of TiO2, as experimentally determined by [71]. A vacancy band below the conduction band can be induced by a high concentration of vacancies, which allows for improved catalytic properties and photoabsorption [65,72]. The intercalation of nitrogen into titania is accompanied by an increased amount of oxygen vacancies, as the formation energy is lowered [73,74]. In this process, Ti3+ species are generated as well, which increases to the difficulty of clarifying its major contribution to the improved PEC performance. Several studies have stated that the catalytic activation for nitrogen doped TiO2 is only generated from oxygen vacancies and Ti3+ reduced species and that nitrogen only make these defects stable [75,76,77,78]. However, other works imply a synergistic effect of the oxygen vacancies, the Ti3+ and the nitrogen dopants, in which the band gap is narrowed by a mixing of the O 2p states and the p states of the N dopants [79,80]. Furthermore, under the typical conditions for N doping at 550–600 °C under NH3, hydrogen can be formed from NH3, leading to an additional reduction of titania and the introduction of another dopant [81].
We herein discuss a treatment method to synthesize N doped TiO2 under the sequential flow of Ar, NH3, and Ar at a relatively mild temperature of 450 °C. The introduction of Ti3+ and oxygen vacancy pairs is demonstrated by XPS, EDS, and EPR. The morphology of the NTs and the anatase crystal phase are maintained.
The surface composition and the oxidation states of the NTs are investigated by X-ray photoemission spectroscopy. As shown in Figure 14, the binding energy of Ti 2p 3/2 and Ti 2p 1/2 is shown at 458.9 eV and 464.6 eV, respectively. There is no obvious change in the pristine and the ammonia treated NTs. Due to the oxidation of the Ti3+ species on the surface, the peak corresponding to Ti3+ at a binding energy of 457 eV is absent [65]. Ti4+ is dominant for ammonia treated NTs and the pristine NTs. From Figure 14, the O 1s spectrum shows a peak of 530.3 eV, indicating that the amount of surface absorbed oxygen or hydroxides is small [82]. The absence of peaks located at 396 eV and 400 eV demonstrates that the argon–ammonia treatment leads to none or limited nitrogen intercalation [30,83]. The thermal treatment at a relatively low temperature results in a limited absorption of nitrogen, probably due to the desorption during the argon gas flow treatment during the cooling down process. The absence of peaks from N 1s was previously reported for nitrogen doped titania [84]. Due to the fact that the detecting limit for XPS is 0.1–1%, nitrogen probably exists in a small amount [85]. EPR measurements are applied to investigate the effect of the argon–ammonia treatment. The absence of a g-factor of 2.02 assigned to the O2 from the adsorbed O2 by surface the Ti3+ (Ti3+-O2) for both pristine and AN-TiO2 further verify the lack of Ti3+ surface species caused by oxidation [79,86]. For the pristine TiO2, a weak peak at a g-factor of 1.996 indicates the presence of Ti3+ in the bulk material, while for the AN-TiO2, a sharp peak with higher intensity is found at the same position, suggesting a large amount of Ti3+ bulk species introduced by the Ar/NH3 treatment [87]. It should also be noted that the commonly observed EPR signal of g = 2.005–2.003 for the paramagnetic (Nb) bulk centers in nitrogen-doped TiO2 is also absent, which supports the XPS observation that only trace amounts of N are present [88,89,90].
In Figure 14e, the photocurrent density of the ammonia treated NTs increases before it reaches the maximum value of 0.93 mA·cm−2 at the potential of 1.23 VRHE, which is a 4-fold improvement of that for pristine TiO2. Side reactions do not occur, as the dark current remains as zero for the pristine NTs and the ammonia treated NTs. In the IPCE measurement, the ammonia treated NTs showed an efficiency above 10% when the wavelength of the incident light was less than 500 nm, while the pristine NTs did not show any efficiency at wavelengths above 400 nm. This demonstrates a photoresponse in the visible light region for the ammonia treated NTs. The color change of the sample from grey to black also indicated an increase in the photoabsorption. The photoresponse increased with the ammonia treated time at a potential higher than 1.0 V, which suggests enhanced charge transport or/and photoabsorption. All of the ammonia treated titania showed a photocurrent density larger than 1 mA·cm−2, which is comparable to the theoretical value of 1.1 mA cm−2 for titania [91]. The potential at which the photocurrent density reaches 1 mA·cm−2 is compared to that Figure 14f, which is decreasing with increased treatment time. For the 4 h ammonia treated titania, this value is 1.18 V, which is less than the theoretical oxidation potential of water in the dark.
The Mott–Schottky approaches were conducted to investigate the charge carrier density and the flat band potential for the NTs treated for 1 h, 2 h, and 4 h. The charge density was 4.99 × 1020 cm−3, 7.04 × 1020 cm−3, 3.61 × 1021 cm−3 for 1 h, 2 h, and 4 h treated NTs, respectively, as shown in Figure 15a, which shows 1–2 orders of magnitude increament compared to the pristine NTs. Extending the treatment time makes it possible to increase the number of charge carriers for the ammonia treated NTs, and this is corresponds to the increased photoresponse. This confirms that the improved charge carrier density plays a main role in the improvement of the photoresponse. The flat band potential for pristine NTs is 0.456 VRHE, which is in agreement with previous reports [41,92]. The flat band potential for ammonia treated NTs at 1 h, 2 h, and 4 h was 0.386 V, 0.371 V and 0.367 V respectively, which implies that a reduced external bias is required to neutralize the band bending effect. The energy difference between the redox potential of OH/O2 and the Fermi level of titania was lowered by the ammonia treatement, as indicated by the results shown in Figure 15b.
The photoresponse at 1.23 V for the as prepared ammonia treated NTs and the same sample placed in air for 1 week is shown from Figure 15c. The photocurrent density is stable at the 600 s measurement in both measurements, indicating that ammonia treated NTs are stable in air for one week. After exposure in air for 6 months, the photocurrent density, however, decreases to half of the initial value, which is caused by the oxidation of the layer up to 3 microns, as indicated by EDS measurements.
Compared to the laser surface modification, hydrogen thermal reduction, and electrochemical reduction methods, Ar/NH3 treatment on TiO2 exhibits an superior enhancement of the TiO2 NTs with a photoreaction response increase of 4–5 fold compared to pristine TiO2 NTs, which is due to a relatively optimized introduction of the oxygen vacancies/Ti3+. To further improve the PEC performance of the modified TiO2 based materials, depositing electrocatalysts on the TiO2 surface is another possibility, while the influence and effectiveness is yet to be investigated.

4.5. Deposition of Electrocatalysts on TiO2 NTs Surface

Electrodeposited Ni or Ni-Fe oxy-hydroxides are among the non-noble metal catalysts with the highest turn-over in alkaline electrolytes. For instance, metallic Ni in alkaline solutions spontaneously forms a variety of (double) hydroxides and oxy-hydroxides, which show a wide range of electrocatalytic activity [93]. The catalytic performance in these materials seems, however, to mainly be related to Fe ions, sometimes inadvertently introduced as impurities present as Fe3+ in Ni-Fe hydroxide at open circuit but oxidizing to Fe4+ at the potential corresponding to oxygen evolution [94]. Studies on loading Ni-Fe (oxy) hydroxides on anodic TiO2 nanotube arrays using electrodeposition methods are rarely reported on, and the influence of the loaded catalysts on the photoanode performance is not fully understood. In the last section of the proposed work, we aim to combine anodized TiO2 nanotubes and electrodeposited, highly efficient OER catalysts to investigate the effect of interfaces and potential synergetic effects related to charge redistribution. We first conducted the electrodeposition of Ni−Fe oxy-hydroxides on the surface of a Au/Si substrate to determine intrinsic electrocatalytic behavior; successively, the same procedure was applied on the anodic TiO2 NT systems with various morphologies, including regular self-ordered TiO2 NTs (R-TiO2), large-gap TiO2 nanotube arrays with walls exposed (LG(L)TiO2), and the short large-gap TiO2 individual nanotubes (LG(S)TiO2) shown in Figure 16a in order to investigate the influence of the surface morphology or conditions of the electrodeposition. Additionally, the electrochemical/photoelectrochemical performances were measured using the linear sweep voltammetry without/with light in an alkaline solution, trying to evaluate the water oxidation kinetics of the Ni−Fe-oxy-hydroxides deposited TiO2 NTs and their application as a photoanode candidate.
Typically, regular self-ordered compact TiO2 NTs are anodized in ethyl glycol solution, while nanotubes with large gaps in between can be prepared using an electrolyte with lower polarity, such as diethyl glycol, which results in a lower density of the nucleation sites caused by a weaker electric field strength [35]. By varying the water content, the etching rate can be controlled, and nanotubes with different lengths can be obtained, as in the case of regular TiO2 NTs. The three different TiO2 NTs systems with various morphologies were successfully synthesized, as shown in Figure 16b.
In the following work, Ni−Fe-oxy-hydroxide was deposited on the surface of the three TiO2 NTs systems, and the relevence of the electrochemical or photoelectrochemical properties will be investigated. In particular, steady state I−V characteristics in the dark will be measured, and Tafel slopes will be calculated to determine the water oxidation kinetics on the loaded catalysts. XPS on the sample surface will be applied to identify the composition and the oxidation states of the Ni−Fe oxy-hydroxides, and XRD will be conducted to observe the possible crystal phases formed during the electrodeposition.

4.6. Black TiO2: Improved Performance

While various modifications have been implemented in order to increase the performance and the generation of hydrogen, the efficiency of TiO2 can be further increased by widening the optical absorption to include the visible spectrum. A drawback along this path is that a strong material reduction and an increase in the concentration oxygen vacancies. This can only be achieved through harsh processing; going through several color changes, from grey and blue and down to black titania; and exhibiting a bandgap of about 1.5 eV that absorbs the full visible sunlight spectrum, thus increasing absorption and the photocatalytic activity. The first publication on black TiO2 was published by Chen [28], who used Ti tetra-isopropoxide nanoparticles processed at 20 bar in pure H2gas. After this process, the black TiO2 nanoparticles were illuminated under simulated solar light, generating about 1 mmol H2 in 5 h. The state density exhibits a broadened band gap, probably due to the disorder at the nanoscale. Black TiO2 in the form of nanotube arrays were also synthesized by a similar method, resulting in a H2 production of the order of 6 mmol/h·cm2 [96]. In this paper, it is hypothesized that annealing under pressure forms a stable, isolated Ti3+ defect within the anatase phase; unfortunately, in these works, only the generation of hydrogen has been reported, making it difficult to compare with the photocurrent. In comparison, the photocurrent in ref [96] is about 4 mA/cm2 [96].
In the last few years, research efforts on photoelectrochemical conversion slowed a bit, but they are still substantial. In the next section we discuss particularly creative efforts. The first example was based on TiO2 and consisted of a series of semiconductor sensitizers designed as the following ladder: TiO2/ CdS/CdS0.5Se0.5/CdSe. Due to the accumulative potential generated in the ladder, the photoanode exhibited a photocurrent of 14.78 mA/cm2 at −0.2 V vs. SCE [97].
Another interesting effort was the synthesis of a high-pressure of TiO2, i.e., the TiO2-II (columbite) phase. This phase should show a lower band gap with respect to TiO2. In addition, this phase should have a low bandgap and a more negative Fermi level. The columbite phase is photoactive with a band gap between 2.4 and 3.1 eV and generates a photocurrent generation under visible light up to ~5 mA/cm2 [98].
The device design in this work involved TiO2 as a support and as a configuration consisting of Ag NPs surrounded by TiO2 material, facilitating charge transfer from the Ag to the conduction band. This system enhances the synthesis of H2, resulting in a photocurrent of the order 42 mA/cm2. This result is the consequence of an intense plasmonic absorption generated by the Ag nanoparticles [99].
Graphitic g-C3N4 is known to exhibit a limited photoactivity, mostly limited by low conductivity. However, the composite TiO2-g-C3N4 provides a higher performance than the two materials. In particular, a 50:50 ratio generates a photocurrent up to about 1.8 mA/cm2. The high response is attributed to a facilitate charge transfer [100].
The combination of materials in a photoelectrochemical device often results in a synergy behavior. In this case, the TiO2/Bi2Se3 composite (large band gap/small band gap) leads to a photocurrent that much higher than that of TiO2, resulting in a photocurrent of 1.76 mA/cm2 and a solar to hydrogen of ~1%. The authors ascribe this enhancement to improved transport from Bi2Se3 to the TiO2 electrode, resulting in a minimal charge recombination [101].
A recent study [102] showed that it is possible to significantly increase the generation of hydrogen at dual porosity three-dimensional TiO2 nanotubes arrays. Under solar irradiation at a planar nanotube array, a production of 40 mmol·h−1·m−2 H2 is generated. After decoration by ~4 nm Pd nanoparticles instead, a production of 40 mmol·h−1·m−2 H2 is generated at the nanotube array, and the hydrogen formation increases to 130 mmol·h−1·m−2.

5. Conclusions

Titanium dioxide is a fascinating and versatile material, but it is still not fully understood because of the complex set of intrinsic defects and the vast possible defects generated by an extrinsic point defect. A wide variety of nanostructures can be synthesized through relatively simple procedures. In this review, we have focused on TiO2 nanotubes, but there are very many other possibilities to synthesize nanorods, nanoparticles, and more exotic shapes. In parallel, nanotube growth synthesis has improved over time to achieve morphologies such as double layer nanotubes, control over length, and nanotube distance. The modification of TiO2 nanomaterials is also possible in very many ways; in particular, we have discussed the possibility of intercalating Li and activating a point defect to increase activity. It is also feasible to use catalysts and sensitizer materials, whether they are dopants or coatings, to improve the light absorption and/or catalytic activity. Reduction processes by chemical or physical methods are very important for increasing activity, and other highly powerful processes are capable of significantly modifying the structure of the material, generating a wider absorption spectrum, possibly furthering potential performance. Even if TiO2 nanotubes have been around more than 15 years, many more opportunities are still available for strategic modifications.

Funding

We acknowledge financial support from the University of Virginia through the MAXNET Energy partnership.

Institutional Review Board Statement

Not applicable.

Informed Consent Statement

Not applicable.

Data Availability Statement

Not applicable.

Acknowledgments

We acknowledge Sarah Bentley and David Cafiso (UVA, Depart. of Chemistry) for the EPR measurements, Keren Freedy and McDonnell for some of the XPS measurements, Michael Melia and James Fitz-Gerald for the laser treatment, and David Klein and Sebastien Cap for the Ar/NH3 treatment.

Conflicts of Interest

The authors declare no conflict of interest.

References

  1. Balat, M.; Balat, H. Biogas as a renewable energy source—A review. Energy Sources Part A 2009, 31, 1280–1293. [Google Scholar] [CrossRef]
  2. Lewis, N.S.; Nocera, D.G. Powering the planet: Chemical challenges in solar energy utilization. Proc. Natl. Acad. Sci. USA 2006, 103, 15729–15735. [Google Scholar] [CrossRef] [Green Version]
  3. Eisenberg, R.; Gray, H.B.; Crabtree, G.W. Addressing the challenge of carbon-free energy. Proc. Natl. Acad. Sci. USA 2019, 117, 12543–12549. [Google Scholar] [CrossRef] [Green Version]
  4. Panwar, N.; Kaushik, S.; Kothari, S. Role of renewable energy sources in environmental protection: A review. Renew. Sustain. Energy Rev. 2011, 15, 1513–1524. [Google Scholar] [CrossRef]
  5. Kudo, A.; Miseki, Y. Heterogeneous photocatalyst materials for water splitting. Chem. Soc. Rev. 2009, 38, 253–278. [Google Scholar] [CrossRef]
  6. Gray, H.B. Powering the planet with solar fuel. Nat. Chem. 2009, 1, 7. [Google Scholar] [CrossRef] [PubMed]
  7. Holladay, J.; Hu, J.; King, D.; Wang, Y. An overview of hydrogen production technologies. Catal. Today 2009, 139, 244–260. [Google Scholar] [CrossRef]
  8. Nathan, S.L.; Crabtree, G.; Nozik, A.J.; Wasielewski, M.R.; Alivisatos, P. Basic Research Needs for Solar Energy Utilization: Report on the Basic Energy Sciences Workshop on Solar Energy Utilization; CIo Technology: Santa Barbara, CA, USA, 2005. [Google Scholar]
  9. Jiao, Y.; Zheng, Y.; Jaroniec, M.; Qiao, S.Z. Design of electrocatalysts for oxygen-and hydrogen-involving energy conversion reactions. Chem. Soc. Rev. 2015, 44, 2060–2086. [Google Scholar] [CrossRef]
  10. Gong, M.; Dai, H. A mini review of NiFe-based materials as highly active oxygen evolution reaction electrocatalysts. Nano Res. 2015, 8, 23–39. [Google Scholar] [CrossRef] [Green Version]
  11. Tahir, M.B.; Pan, L.; Idrees, F.; Zhang, X.; Wang, L.; Zou, J.-J.; Wang, Z.L. Electrocatalytic oxygen evolution reaction for energy conversion and storage: A comprehensive review. Nano Energy 2017, 37, 136–157. [Google Scholar] [CrossRef]
  12. Grätzel, M. Photoelectrochemical cells. Nat. Cell Biol. 2001, 414, 338–344. [Google Scholar] [CrossRef] [PubMed]
  13. Tsui, L.-K.; Zangari, G. Titania nanotubes by electrochemical anodization for solar energy conversion. J. Electrochem. Soc. 2014, 161, D3066–D3077. [Google Scholar] [CrossRef]
  14. Ni, M.; Leung, M.K.; Leung, D.Y.; Sumathy, K. A review and recent developments in photocatalytic water-splitting using TiO2 for hydrogen production. Renew. Sustain. Energy Rev. 2007, 11, 401–425. [Google Scholar] [CrossRef]
  15. Fujishima, A.; Honda, K. Electrochemical photolysis of water at a semiconductor electrode. Nat. Cell Biol. 1972, 238, 37–38. [Google Scholar] [CrossRef] [PubMed]
  16. Chen, S.; Wang, L.-W. Thermodynamic oxidation and reduction potentials of photocatalytic semiconductors in aqueous solution. Chem. Mater. 2012, 24, 3659–3666. [Google Scholar] [CrossRef] [Green Version]
  17. Lin, Z.; Orlov, A.; Lambert, A.R.M.; Payne, M.C. New insights into the origin of visible light photocatalytic activity of nitrogen-doped and oxygen-deficient anatase TiO2. J. Phys. Chem. B 2005, 109, 20948–20952. [Google Scholar] [CrossRef]
  18. Thompson, T.L.; Yates, J.T. Surface science studies of the photoactivation of TiO2 new photochemical processes. Chem. Rev. 2006, 106, 4428–4453. [Google Scholar] [CrossRef]
  19. He, Y.; Tilocca, A.; Dulub, O.; Selloni, A.; Diebold, U. Local ordering and electronic signatures of submonolayer water on anatase TiO2(101). Nat. Mater. 2009, 8, 585–589. [Google Scholar] [CrossRef]
  20. Maeda, K. Direct splitting of pure water into hydrogen and oxygen using rutile titania powder as a photocatalyst. Chem. Commun. 2013, 49, 8404–8406. [Google Scholar] [CrossRef]
  21. Murphy, A.; Barnes, P.; Randeniya, L.; Plumb, I.; Grey, I.; Horne, M.; Glasscock, J.A. Efficiency of solar water splitting using semiconductor electrodes. Int. J. Hydrogen Energy 2006, 31, 1999–2017. [Google Scholar] [CrossRef]
  22. Tsui, L.-K.; Saito, M.; Homma, T.; Zangari, G. Trap-state passivation of titania nanotubes by electrochemical doping for enhanced photoelectrochemical performance. J. Mater. Chem. A 2014, 3, 360–367. [Google Scholar] [CrossRef]
  23. Houser, J.E.; Hebert, K.R. The role of viscous flow of oxide in the growth of self-ordered porous anodic alumina films. Nat. Mater. 2009, 8, 415–420. [Google Scholar] [CrossRef] [PubMed]
  24. Hebert, K.R.; Albu, S.P.; Paramasivam, I.; Schmuki, P. Morphological instability leading to formation of porous anodic oxide films. Nat. Mater. 2012, 11, 162–166. [Google Scholar] [CrossRef] [PubMed]
  25. Varghese, O.K.; Paulose, M.; Shankar, K.; Mor, G.K.; Grimes, C.A. Water-photolysis properties of micron-length highly-ordered titania nanotube-arrays. J. Nanosci. Nanotechnol. 2005, 5, 1158–1165. [Google Scholar] [CrossRef]
  26. Roy, P.; Berger, S.; Schmuki, P. TiO2 nanotubes: Synthesis and applications. Angew. Chem. Int. Ed. 2011, 50, 2904–2939. [Google Scholar] [CrossRef] [PubMed]
  27. Diebold, U. The surface science of titanium dioxide. Surf. Sci. Rep. 2003, 48, 53–229. [Google Scholar] [CrossRef]
  28. Chen, X.; Liu, L.; Yu, P.Y.; Mao, S.S. Increasing solar absorption for photocatalysis with black hydrogenated titanium dioxide nanocrystals. Science 2011, 331, 746–750. [Google Scholar] [CrossRef] [PubMed]
  29. Zuo, F.; Wang, L.; Wu, T.; Zhang, Z.; Borchardt, D.; Feng, P. Self-doped Ti3+ enhanced photocatalyst for hydrogen production under visible light. J. Am. Chem. Soc. 2010, 132, 11856–11857. [Google Scholar] [CrossRef] [PubMed]
  30. Asahi, R.; Morikawa, T.; Ohwaki, T.; Aoki, K.; Taga, Y. Visible-light photocatalysis in nitrogen-doped titanium oxides. Science 2001, 293, 269–271. [Google Scholar] [CrossRef] [PubMed]
  31. Choi, W.; Termin, A.; Hoffmann, M.R. The role of metal ion dopants in quantum-sized TiO2: Correlation between photoreactivity and charge carrier recombination dynamics. J. Phys. Chem. 1994, 98, 13669–13679. [Google Scholar] [CrossRef]
  32. Naldoni, A.; Allieta, M.; Santangelo, S.; Marelli, M.; Fabbri, F.; Cappelli, S.; Bianchi, C.; Psaro, R.; Santo, V.D. Effect of nature and location of defects on bandgap narrowing in black TiO2 nanoparticles. J. Am. Chem. Soc. 2012, 134, 7600–7603. [Google Scholar] [CrossRef] [PubMed]
  33. Nowotny, J.; Bak, T.; Alim, M. (High temperature materials division outstanding achievement award) semiconducting properties and defect disorder of titanium dioxide. ECS Trans. 2015, 64, 11–28. [Google Scholar] [CrossRef]
  34. Tsui, L.-K.; Homma, T.; Zangari, G. Photocurrent conversion in anodized TiO2 nanotube arrays: Effect of the water content in anodizing solutions. J. Phys. Chem. C 2013, 117, 6979–6989. [Google Scholar] [CrossRef]
  35. Kowalski, D.; Mallet, J.; Michel, J.; Molinari, M. Low electric field strength self-organization of anodic TiO2 nanotubes in diethylene glycol electrolyte. J. Mater. Chem. A 2015, 3, 6655–6661. [Google Scholar] [CrossRef]
  36. Hunger, T.; Lapicque, F.; Storck, A. Electrochemical oxidation of sulphite ions at graphite electrodes. J. Appl. Electrochem. 1991, 21, 588–596. [Google Scholar] [CrossRef]
  37. Kim, T.W.; Choi, K.-S. Nanoporous BiVO4 photoanodes with dual-layer oxygen evolution catalysts for solar water splitting. Science 2014, 343, 990–994. [Google Scholar] [CrossRef]
  38. Zhou, M.; Bao, J.; Bi, W.; Zeng, Y.; Zhu, R.; Tao, M.; Xie, Y. Efficient water splitting via a heteroepitaxial BiVO4 photoelectrode decorated with Co-Pi catalysts. ChemSusChem 2012, 5, 1420–1425. [Google Scholar] [CrossRef]
  39. Gelderman, K.; Lee, L.; Donne, S. Flat-band potential of a semiconductor: Using the mott–schottky equation. J. Chem. Educ. 2007, 84. [Google Scholar] [CrossRef]
  40. Yahia, S.A.A.; Hamadou, L.; Kadri, A.; Benbrahim, N.; Sutter, E.M.M. Effect of anodizing potential on the formation and EIS characteristics of TiO2 nanotube arrays. J. Electrochem. Soc. 2012, 159, K83–K92. [Google Scholar] [CrossRef]
  41. Hanzu, I.; Djenizian, T.; Knauth, P. Electrical and Point Defect Properties of TiO2 Nanotubes Fabricated by Electrochemical Anodization. J. Phys. Chem. C 2011, 115, 5989–5996. [Google Scholar] [CrossRef]
  42. Orazem, M.E.; Tribollet, B. Electrochemical Impedance Spectroscopy; John Wiley & Sons: Hoboken, NJ, USA, 2011; Volume 48, ISBN 111820994X. [Google Scholar]
  43. Tsui, L.-K.; Huang, J.; Sabat, M.; Zangari, G. Visible light sensitization of TiO2 nanotubes by bacteriochlorophyll-C dyes for photoelectrochemical solar cells. ACS Sustain. Chem. Eng. 2014, 2, 2097–2101. [Google Scholar] [CrossRef]
  44. Tsui, L.-K.; Zangari, G. The influence of morphology of electrodeposited Cu2O and Fe2O3 on the conversion efficiency of TiO2 nanotube photoelectrochemical solar cells. Electrochim. Acta 2013, 100, 220–225. [Google Scholar] [CrossRef]
  45. Da Silva, D.L.; Delatorre, R.G.; Pattanaik, G.; Zangari, G.; Figueiredo, W.; Blum, R.-P.; Niehus, H.; Pasa, A.A. Electrochemical synthesis of vanadium oxide nanofibers. J. Electrochem. Soc. 2008, 155, E14–E17. [Google Scholar] [CrossRef]
  46. Lu, G.; Evans, P.; Zangari, G. Electrocatalytic properties of Ni-based alloys toward hydrogen evolution reaction in acid media. J. Electrochem. Soc. 2003, 150, A551–A557. [Google Scholar] [CrossRef]
  47. Lu, G.; Zangari, G. Study of the electroless deposition process of Ni-P-based ternary alloys. J. Electrochem. Soc. 2003, 150, C777–C786. [Google Scholar] [CrossRef]
  48. Lu, G.; Zangari, G. Corrosion resistance of ternary Ni P based alloys in sulfuric acid solutions. Electrochim. Acta 2002, 47, 2969–2979. [Google Scholar] [CrossRef]
  49. Yang, C.; Wang, Z.; Lin, T.; Yin, H.; Lu, X.; Wan, D.; Xu, T.; Zheng, C.; Lin, J.; Huang, F.; et al. Core-shell nanostructured “Black” rutile titania as excellent catalyst for hydrogen production enhanced by sulfur doping. J. Am. Chem. Soc. 2013, 135, 17831–17838. [Google Scholar] [CrossRef] [PubMed]
  50. Leshuk, T.; Parviz, R.; Everett, P.; Krishnakumar, H.; Varin, R.A.; Gu, F. Photocatalytic activity of hydrogenated TiO2. ACS Appl. Mater. Interfaces 2013, 5, 1892–1895. [Google Scholar] [CrossRef]
  51. Leshuk, T.; Linley, S.; Gu, F. Hydrogenation processing of TiO2 nanoparticles. Can. J. Chem. Eng. 2013, 91, 799–807. [Google Scholar] [CrossRef]
  52. Lu, H.; Zhao, B.; Pan, R.; Yao, J.; Qiu, J.; Luo, L.; Liu, Y. Safe and facile hydrogenation of commercial Degussa P25 at room temperature with enhanced photocatalytic activity. RSC Adv. 2014, 4, 1128–1132. [Google Scholar] [CrossRef]
  53. Oskam, G.; Hoffmann, P.M.; Schmidt, J.C.; Searson, P.C. Energetics and kinetics of surface states at n-type silicon surfaces in aqueous fluoride solutions. J. Phys. Chem. 1996, 100, 1801–1806. [Google Scholar] [CrossRef]
  54. Oskam, G.; Hoffmann, P.M.; Searson, P.C. In situ measurements of interface states at silicon surfaces in fluoride solutions. Phys. Rev. Lett. 1996, 76, 1521–1524. [Google Scholar] [CrossRef]
  55. Liu, L.; Yu, P.Y.; Chen, X.; Mao, S.; Shen, D.Z. Hydrogenation and disorder in engineered black TiO2. Phys. Rev. Lett. 2013, 111, 065505. [Google Scholar] [CrossRef] [PubMed]
  56. Xu, Y.; Melia, M.A.; Tsui, L.-K.; Fitz-Gerald, J.M.; Zangari, G. Laser-induced surface modification at anatase TiO2 nanotube array photoanodes for photoelectrochemical water oxidation. J. Phys. Chem. C 2017, 121, 17121–17128. [Google Scholar] [CrossRef]
  57. van de Lagemaat, J.; Park, N.-G.; Frank, A.J. Influence of electrical potential distribution, charge transport, and recombination on the photopotential and photocurrent conversion efficiency of dye-sensitized nanocrystalline TiO2 solar cells: A study by electrical impedance and optical modulation techniques. J. Phys. Chem. B 2000, 104, 2044–2052. [Google Scholar] [CrossRef]
  58. Chen, X.; Liu, L.; Huang, F. Black titanium dioxide (TiO2) nanomaterials. Chem. Soc. Rev. 2015, 44, 1861–1885. [Google Scholar] [CrossRef] [PubMed]
  59. Wang, G.; Wang, H.; Ling, Y.; Tang, Y.; Yang, X.; Fitzmorris, R.C.; Wang, C.; Zhang, J.Z.; Li, Y. Hydrogen-treated TiO2 nanowire arrays for photoelectrochemical water splitting. Nano Lett. 2011, 11, 3026–3033. [Google Scholar] [CrossRef]
  60. Chen, B.; Hou, J.; Lu, K. Formation mechanism of TiO2 nanotubes and their applications in photoelectrochemical water splitting and supercapacitors. Langmuir 2013, 29, 5911–5919. [Google Scholar] [CrossRef]
  61. Zhu, W.-D.; Wang, C.-W.; Chen, J.-B.; Li, D.-S.; Zhou, F.; Zhang, H.-L. Enhanced field emission from hydrogenated TiO2nanotube arrays. Nanotechnology 2012, 23, 455204. [Google Scholar] [CrossRef]
  62. Hanaor, D.A.H.; Sorrell, C.C. Review of the anatase to rutile phase transformation. J. Mater. Sci. 2010, 46, 855–874. [Google Scholar] [CrossRef] [Green Version]
  63. Xu, Y.; Lin, Q.; Ahmed, R.; Hoglund, E.R.; Zangari, G. Synthesis of TiO2-based nanocomposites by anodizing and hydrogen annealing for efficient photoelectrochemical water oxidation. J. Power Sour. 2019, 410, 59–68. [Google Scholar] [CrossRef]
  64. Albu, S.; Tsuchiya, H.; Fujimoto, S.; Schmuki, P. TiO2 nanotubes—Annealing effects on detailed morphology and structure. Eur. J. Inorg. Chem. 2010, 2010, 4351–4356. [Google Scholar] [CrossRef]
  65. Amano, F.; Nakata, M.; Yamamoto, A.; Tanaka, T. Effect of Ti3+ ions and conduction band electrons on photocatalytic and photoelectrochemical activity of rutile titania for water oxidation. J. Phys. Chem. C 2016, 120, 6467–6474. [Google Scholar] [CrossRef]
  66. Tsui, L.-K.; Xu, Y.; Dawidowski, D.; Cafiso, D.; Zangari, G. Efficient water oxidation kinetics and enhanced electron transport in Li-doped TiO2 nanotube photoanodes. J. Mater. Chem. A 2016, 4, 19070–19077. [Google Scholar] [CrossRef]
  67. Beranek, R.; Tsuchiya, H.; Sugishima, T.; Macak, J.; Taveira, L.V.; Fujimoto, S.; Kisch, H.; Schmuki, P. Enhancement and limits of the photoelectrochemical response from anodic TiO2 nanotubes. Appl. Phys. Lett. 2005, 87, 243114. [Google Scholar] [CrossRef]
  68. Bard, A.J.; Bocarsly, A.B.; Fan, F.R.F.; Walton, E.G.; Wrighton, M.S. The concept of Fermi level pinning at semiconductor/liquid junctions. Consequences for energy conversion efficiency and selection of useful solution redox couples in solar devices. J. Am. Chem. Soc. 1980, 102, 3671–3677. [Google Scholar] [CrossRef]
  69. Zhou, X.; Liu, N.; Schmuki, P. Ar+-ion bombardment of TiO2 nanotubes creates co-catalytic effect for photocatalytic open circuit hydrogen evolution. Electrochem. Commun. 2014, 49, 60–64. [Google Scholar] [CrossRef] [Green Version]
  70. Zhou, X.; Häublein, V.; Liu, N.; Nguyen, N.T.; Zolnhofer, E.M.; Tsuchiya, H.; Killian, M.S.; Meyer, K.; Frey, L.; Schmuki, P. TiO2 nanotubes: Nitrogen-ion implantation at low dose provides noble-metal-free photocatalytic H2-Evolution activity. Angew. Chem. Int. Ed. 2016, 55, 3763–3767. [Google Scholar] [CrossRef] [Green Version]
  71. Cronemeyer, D.C. Infrared absorption of reduced rutile TiO2 single crystals. Phys. Rev. 1959, 113, 1222–1226. [Google Scholar] [CrossRef]
  72. Wang, Z.; Wen, B.; Hao, Q.; Liu, L.-M.; Zhou, C.; Mao, X.; Lang, X.; Yin, W.-J.; Dai, D.; Selloni, A.; et al. Localized excitation of Ti3+ ions in the photoabsorption and photocatalytic activity of reduced rutile TiO2. J. Am. Chem. Soc. 2015, 137, 9146–9152. [Google Scholar] [CrossRef]
  73. Ihara, T.; Miyoshi, M.; Iriyama, Y.; Matsumoto, O.; Sugihara, S. Visible-light-active titanium oxide photocatalyst realized by an oxygen-deficient structure and by nitrogen doping. Appl. Catal. B Environ. 2003, 42, 403–409. [Google Scholar] [CrossRef]
  74. Di Valentin, C.; Pacchioni, G.; Selloni, A.; Livraghi, S.; Giamello, E. Characterization of paramagnetic species in N-doped TiO2 powders by EPR spectroscopy and DFT calculations. J. Phys. Chem. B 2005, 109, 11414–11419. [Google Scholar] [CrossRef] [PubMed]
  75. Chen, X.; Lou, Y.; Samia, A.C.S.; Burda, C.; Gole, J.L. Formation of oxynitride as the photocatalytic enhancing site in nitrogen-doped titania nanocatalysts: Comparison to a commercial nanopowder. Adv. Funct. Mater. 2005, 15, 41–49. [Google Scholar] [CrossRef]
  76. Emeline, A.; Sheremetyeva, N.V.; Khomchenko, N.V.; Ryabchuk, V.; Serpone, N. Photoinduced formation of defects and nitrogen stabilization of color centers in N-doped titanium dioxide. J. Phys. Chem. C 2007, 111, 11456–11462. [Google Scholar] [CrossRef]
  77. Batzill, M.; Morales, E.H.; Diebold, U. Influence of nitrogen doping on the defect formation and surface properties of TiO2 rutile and anatase. Phys. Rev. Lett. 2006, 96, 026103. [Google Scholar] [CrossRef] [PubMed]
  78. Serpone, N. Is the band gap of pristine TiO2 narrowed by anion- and cation-doping of titanium dioxide in second-generation photocatalysts? J. Phys. Chem. B 2006, 110, 24287–24293. [Google Scholar] [CrossRef]
  79. Hoang, S.; Berglund, S.; Hahn, N.T.; Bard, A.J.; Mullins, C.B. Enhancing visible light photo-oxidation of water with TiO2 nanowire arrays via cotreatment with H2 and NH3: Synergistic effects between Ti3+ and N. J. Am. Chem. Soc. 2012, 134, 3659–3662. [Google Scholar] [CrossRef]
  80. Chen, Y.; Cao, X.; Lin, B.; Gao, B. Origin of the visible-light photoactivity of NH3-treated TiO2: Effect of nitrogen doping and oxygen vacancies. Appl. Surf. Sci. 2013, 264, 845–852. [Google Scholar] [CrossRef]
  81. Irie, H.; Watanabe, Y.; Hashimoto, K. Nitrogen-concentration dependence on photocatalytic activity of TiO2-x N x powders. J. Phys. Chem. B 2003, 107, 5483–5486. [Google Scholar] [CrossRef]
  82. Liu, Y.; Wang, X.; Yang, F.; Yang, X. Excellent antimicrobial properties of mesoporous anatase TiO2 and Ag/TiO2 composite films. Microporous Mesoporous Mater. 2008, 114, 431–439. [Google Scholar] [CrossRef]
  83. Saha, N.C.; Tompkins, H.G. Titanium nitride oxidation chemistry: An X-ray photoelectron spectroscopy study. J. Appl. Phys. 1992, 72, 3072–3079. [Google Scholar] [CrossRef]
  84. Yates, H.; Nolan, M.; Sheel, D.; Pemble, M. The role of nitrogen doping on the development of visible light-induced photocatalytic activity in thin TiO2 films grown on glass by chemical vapour deposition. J. Photochem. Photobiol. A Chem. 2006, 179, 213–223. [Google Scholar] [CrossRef]
  85. Shard, A.G. Detection limits in XPS for more than 6000 binary systems using Al and Mg Kα X-rays. Surf. Interface Anal. 2014, 46, 175–185. [Google Scholar] [CrossRef]
  86. Anpo, M.; Che, M.; Fubini, B.; Garrone, E.; Giamello, E.; Paganini, M.C. Generation of superoxide ions at oxide surfaces. Top. Catal. 1999, 8, 189–198. [Google Scholar] [CrossRef]
  87. Kumar, C.P.; Gopal, N.O.; Wang, T.C.; Wong, A.M.-S.; Ke, S.C. EPR Investigation of TiO2Nanoparticles with Temperature-Dependent Properties. J. Phys. Chem. B 2006, 110, 5223–5229. [Google Scholar] [CrossRef] [PubMed]
  88. Di Valentin, C.; Finazzi, E.; Pacchioni, G.; Selloni, A.; Livraghi, S.; Paganini, M.C.; Giamello, E. N-doped TiO2: Theory and experiment. Chem. Phys. 2007, 339, 44–56. [Google Scholar] [CrossRef]
  89. Livraghi, S.; Paganini, M.C.; Giamello, E.; Selloni, A.; Di Valentin, C.; Pacchioni, G. Origin of photoactivity of nitrogen-doped titanium dioxide under visible light. J. Am. Chem. Soc. 2006, 128, 15666–15671. [Google Scholar] [CrossRef] [PubMed]
  90. Xu, Y.; Ahmed, R.; Klein, D.; Cap, S.; Freedy, K.; McDonnell, S.; Zangari, G. Improving photo-oxidation activity of water by introducing Ti3+ in self-ordered TiO2 nanotube arrays treated with Ar/NH3. J. Power Sources 2019, 414, 242–249. [Google Scholar] [CrossRef]
  91. Liu, C.; Dasgupta, N.P.; Yang, P. Semiconductor nanowires for artificial photosynthesis. Chem. Mater. 2013, 26, 415–422. [Google Scholar] [CrossRef]
  92. Siuzdak, K.; Szkoda, M.; Sawczak, M.; Lisowska-Oleksiak, A.; Karczewski, J.; Ryl, J. Enhanced photoelectrochemical and photocatalytic performance of iodine-doped titania nanotube arrays. RSC Adv. 2015, 5, 50379–50391. [Google Scholar] [CrossRef]
  93. Berger, T.; Lana-Villarreal, T.; Monllor-Satoca, D.; Gómez, R. Charge transfer reductive doping of nanostructured TiO2 thin films as a way to improve their photoelectrocatalytic performance. Electrochem. Commun. 2006, 8, 1713–1718. [Google Scholar] [CrossRef]
  94. Goldsmith, Z.; Harshan, A.K.; Gerken, J.B.; Vörös, M.; Galli, G.; Stahl, S.S.; Hammes-Schiffer, S. Characterization of NiFe oxyhydroxide electrocatalysts by integrated electronic structure calculations and spectroelectrochemistry. Proc. Natl. Acad. Sci. USA 2017, 114, 3050–3055. [Google Scholar] [CrossRef] [Green Version]
  95. Xu, Y.; Ahmed, R.; Lin, Q.; Zangari, G. (Photo) electrochemical water oxidation at anodic TiO2 nanotubes modified by electrodeposited NiFe oxy-hydroxides catalysts. Electrochim. Acta 2019, 308, 91–98. [Google Scholar] [CrossRef]
  96. Liu, N.; Schneider, C.; Freitag, D.; Hartmann, M.; Venkatesan, U.; Müller, J.; Spiecker, E.; Schmuki, P. Black TiO2 nanotubes: Cocatalyst-free open-circuit hydrogen generation. Nano Lett. 2014, 14, 3309–3313. [Google Scholar] [CrossRef] [PubMed]
  97. Liu, X.; Chen, Z.; Li, W.; Cao, M. Distinctly improved photocurrent and stability in TiO2 nanotube arrays by ladder band structure. J. Phys. Chem. C 2017, 121, 20605–20612. [Google Scholar] [CrossRef]
  98. Wang, Q.; Watanabe, M.; Edalati, K. Visible-light photocurrent in nanostructured high-pressure TiO2-II (columbite) phase. J. Phys. Chem. C 2020, 124, 13930–13935. [Google Scholar] [CrossRef]
  99. Singh, S.V.; Kumar, M.P.; Anantharaj, S.; Mukherjee, B.; Kundu, S.; Pal, B.N. Direct evidence of an efficient plasmon-induced hot-electron transfer at an in situ grown Ag/TiO2 interface for highly enhanced solar H2 generation. ACS Appl. Energy Mater. 2020, 3, 1821–1830. [Google Scholar] [CrossRef]
  100. Luo, H.; Dimitrov, S.D.; Daboczi, M.; Kim, J.-S.; Guo, Q.; Fang, Y.; Stoeckel, M.-A.; Samorì, P.; Fenwick, O.; Sobrido, A.B.J.; et al. Nitrogen-doped carbon Dots/TiO2 nanoparticle composites for photoelectrochemical water oxidation. ACS Appl. Nano Mater. 2020, 3, 3371–3381. [Google Scholar] [CrossRef]
  101. Subramanyam, P.; Meena, B.; Suryakala, D.; Subrahmanyam, C. TiO2 photoanodes sensitized with Bi2Se3 nanoflowers for visible–near-infrared photoelectrochemical water splitting. ACS Appl. Nano Mater. 2021, 4, 739–745. [Google Scholar] [CrossRef]
  102. Chen, Y.-X.; Gombac, V.; Montini, T.; Lavacchi, A.; Filippi, J.; Miller, H.A.; Fornasiero, P.; Vizza, F. An increase in hydrogen production from light and ethanol using a dual scale porosity photocatalyst. Green Chem. 2018, 20, 2299–2307. [Google Scholar] [CrossRef]
Figure 1. Energy consumption by energy source in 2019 reported by the U.S. Energy Information Administration (EIA).
Coatings 11 00931 g001
Figure 2. Schematics of n–p junction (a) and Schottky junction (b).
Coatings 11 00931 g002
Figure 3. A typical PEC cell with n-semiconductor under light as the photoanode and metal as the cathode.
Coatings 11 00931 g003
Figure 4. Stability of semiconductors in relation to the redox potential of the water splitting process.
Coatings 11 00931 g004
Figure 5. Time scales for the generation (10−13), recombination (10−7 s) of the photogenerated electron/hole pairs and the charge transfer process for HER (10−3 s) and OER (100 s).
Coatings 11 00931 g005
Figure 6. Calculated water oxidation potential and reduction potential vs. the conduction and valence band edge positions at pH = 0. Reprinted with permission from [16]. Copyright (2012) American Chemical Society.
Coatings 11 00931 g006
Figure 7. A conventional cell unit of anatase, rutile, and brookite TiO2.
Coatings 11 00931 g007
Figure 8. Bandgap of TiO2 sub-stoichiometries as a function of partial pressure of O2 and O/Ti ratio. Reprinted with permission from [33], Copyright (2015) IOP.
Coatings 11 00931 g008
Figure 9. (a) Linear scanning voltammetry of laser modified NTs at different energy fluences in 1M potassium hydroxide under AM1.5G solar irradiation. Insert: photocurrent density vs. energy fluence of laser treatment. (b) Mott–Schottky measurements of NTs without and with laser modification using EIS. (c) Low-frequency capacitance vs. potential at different frequencies for pristine NTs. (d) Low-frequency capacitance vs. potential at different frequencies for laser modified NTs. Reprinted with permission from [53]. Copyright (2017) American Chemical Society.
Coatings 11 00931 g009
Figure 10. Linear scanning voltammetry for laser modified NTs with different PPA (a) and NT length (b) as well as water oxidation selectivity (c) for pristine and laser modified NTs. Reprinted with permission from [53]. Copyright (2017) American Chemical Society.
Coatings 11 00931 g010
Figure 11. (a) SEM images of Ti−O compounds reduced at various annealing temperatures. (b) X-ray diffraction of pristine NTs and thermally reduced NTs. Reprinted from [63], Copyright (2019), with permission from Elsevier.
Coatings 11 00931 g011
Figure 12. (a) Photocurrent density vs. applied potential for Ti−O compounds annealing at various temperature. (b) Ratio of oxygen to titanium and the corresponding photocurrent. (c) Energy conversion efficiency for thermally reduced NTs. Reprinted from [63], Copyright (2019), with permission from Elsevier.
Coatings 11 00931 g012
Figure 13. Density of charge carriers measured by the Mott–Schottky method for (a) H-750 and (b) H-800. Water oxidation selectivity for hydrogen thermally annealed NTs (c). Reprinted from [63], Copyright (2019), with permission from Elsevier.
Coatings 11 00931 g013
Figure 14. (a) Ti 2p, (b) O 1s, (c) N 1s XPS patterns for pristine TiO2 NTs and Ar/NH3 treated NTs; (d) EPR spectra for the background, pristine TiO2 NTs and Ar/NH3 treated TiO2 NTs; (e) Linear sweep voltammograms under AM 1.5G chopped illumination of the pristine and (f) the potential as which the current density reaches 1 mA cm−2 for different Ar/NH3 treatment time. Reprinted from [90], Copyright (2019), with permission from Elsevier.
Coatings 11 00931 g014
Figure 15. (a) Evaluation of donor density using the Mott–Schottky method at 100 Hz for the Ar/NH3 treated TiO2 with various reaction times. (b) Donor density and flat band potential vs. reaction time for the Ar/NH3 treatment. Black dots represent the density of donors, and blue dots represent the flat band potential. (c) Stability test in a measurement time scale of 10min for TiO2 samples placed in air for various times. Reprinted from [90], Copyright (2019), with permission from Elsevier.
Coatings 11 00931 g015
Figure 16. (a) Schematics of electroposited Ni−Fe-oxy-hydroxide on different TiO2 nanotube systems; (b) top view SEM images of the three corresponding TiO2 nanotube systems. Reprinted from [95], Copyright (2019), with permission from Elsevier.
Coatings 11 00931 g016
Publisher’s Note: MDPI stays neutral with regard to jurisdictional claims in published maps and institutional affiliations.

