Review

A Past, Present, and Prospective Review on Microwave Nondestructive Evaluation of Composite Coatings

by
Teng Wei Siang
1,
Muhammad Firdaus Akbar
1,*,
Ghassan Nihad Jawad
2,
Tan Shin Yee
1 and
Mohd Ilyas Sobirin Mohd Sazali
1
1
School of Electrical and Electronic Engineering, Universiti Sains Malaysia, Penang 14300, Malaysia
2
Department of Electronics and Communications Engineering, University of Baghdad, Baghdad 10071, Iraq
*
Author to whom correspondence should be addressed.
Coatings 2021, 11(8), 913; https://doi.org/10.3390/coatings11080913
Submission received: 1 July 2021 / Revised: 20 July 2021 / Accepted: 26 July 2021 / Published: 30 July 2021
(This article belongs to the Special Issue State-of-the-Art on Coatings Research in Asia)

Abstract

:
Recent years have witnessed an increase in the use of composite coatings for numerous applications, including aerospace, aircraft, and maritime vessels. These materials owe this popularity surge to the superior strength, weight, stiffness, and electrical insulation they exhibit over conventional substances, such as metals. The growing demand for such materials is accompanied by the inevitable need for fast, accurate, and affordable nondestructive testing techniques to reveal any possible defects within the coatings or any defects under coating. However, typical nondestructive testing (NDT) techniques such as ultrasonic testing (UT), infrared thermography (IRT), eddy current testing (ECT), and laser shearography (LS) have failed to provide successful results when inspecting composite coatings. Consequently, microwave NDT techniques have emerged to compensate for the shortcomings of traditional NDT approaches. Numerous microwave NDT methods have been reported for composite coatings inspection. Although existing microwave NDT methods have shown successful inspection of composite coatings, they often face several challenges, such as low spatial image quality and extensive data interpretation. Nevertheless, many of these limitations can be addressed by utilizing microwave NDT techniques with modern technologies such as soft computing. Artificially intelligent techniques have greatly enhanced the reliability and accuracy of microwave NDT techniques. This paper reviews various traditional NDT techniques and their limitations in inspecting composite coatings. In addition, the article includes a detailed review of several microwave NDT techniques and their benefits in evaluating composite coatings. The paper also highlights the advantages of using the recently reported microwave NDT approaches employing artificial intelligence approaches. This review demonstrates that microwave NDT techniques in conjunction with artificial intelligence approaches have excellent prospects for further enhancing composite coatings inspection and assessment efficiency. The review aimed to provide the reader with a comprehensive overview of most NDT techniques used for composite materials alongside their most salient features.

1. Introduction

Composite is a combination of two or more materials to attain properties that supersede those of the original substances. Over the years, the development of composite materials has kept pace with the advancements of other industries. By the early 20th century, fiber-reinforced polymer (FRP) emerged as a promising composite material for military applications. However, the superior properties of FRP (especially its corrosion resistance) made it a desirable material for other industries, such as aerospace, construction, and transportation [1].
Various composite materials have been developed to fit the required merits for specific applications. The desired merits, such as flexibility, tensile strength, hardness, and compressive strength, are achieved by adding a material that features those benefits to another material lacking such quality. Consequently, many composite materials have emerged, such as glass fiber-reinforced polymers (GFRP), carbon fiber-reinforced polymers (CFRP), and ceramic matrix composites. For instance, CFRP composite is formed by adding metal and glass fiber to the carbon fiber. The tensile strength of the glass, combined with the metal’s hardness, results in a rigid composite with a high strength-to-weight ratio [2].
FRP has been widely used as insulation coatings in many industries due to its highly favorable material properties. However, due to the aging and cyclic process, these composites’ performance is affected by various defects, such as cracks on the metal substrate under insulations [3], delamination, and corrosion between insulations and metal structure. Hence, numerous nondestructive testing (NDT) techniques have been employed to identify these defects, such as ultrasonic testing (UT), infrared thermography (IRT), eddy current testing (ECT), X-ray radiography, magnetic particle testing, laser shearography (LS), and acoustic emission (AE). NDT plays a significant part in the maintenance of the structural integrity of the system by enabling timely detection before critical damage occurs. Although each of these techniques has its advantages in its application, there are certain limitations in inspecting composite coatings due to poor signal penetration. Microwave NDT appears to be one of the most promising inspection tools in detecting the presence of defects in coatings [4,5,6,7,8,9,10]. Several microwave NDT methods have been reported for composite inspection. Although these existing microwave NDT methods have shown successful composite coatings inspection, they often have limitations in terms of detection accuracy and resolution. However, emerging soft computing techniques, such as signal processing development, have proved to address challenges [11,12,13]. The combination of microwave NDT techniques with artificial intelligence and signal processing techniques can overcome limitations and improve defect detection sensitivity. Although there has been little research into combining soft computing techniques with microwave NDT techniques, current efforts to hybridize them together have the potential to overcome the limitations.
In the next section, a comprehensive review is given for the most prominent traditional NDT techniques, such as UT, IRT, ECT and LS, and their shortcomings when used for composite material inspection. Different types of defect or composite coating might need a different method to perform the inspection. Moreover, Section 3 outlines the principles of microwave inspection and discusses the previously reported techniques used for this purpose. The section also delves into the various signal processing and AI approaches used. Overall, microwave NDT techniques have shown superiority over conventional NDT techniques in inspecting and assessing composite coatings. Furthermore, by processing the signal of microwave NDT techniques using soft computing approaches, the composites inspection results have demonstrated significant findings. Finally, Section 4 draws together the key conclusions from the previous sections. The review aimed to provide the researchers and the engineers working in this field with a broader perspective on the possible action required for any material evaluation challenge.

2. Conventional Inspection Methods

Generally, selecting the appropriate NDT technique to inspect a particular material is a challenging task. First, the type of material under test determines the nature of the inspection method to guarantee a safe and accurate process. Secondly, the types and locations of the possible defects can be a significant factor in selecting the accurate technique to determine their location quickly. Finally, a trade-off has to be made between the inspection’s sensitivity, cost, and duration.
In this section, four of the most widely known NDT methods used to inspect composite materials are outlined in terms of fundamental principles, used techniques, and their advantages and limitations. The summarized advantages and limitations for each of the methods are described in Table 1.

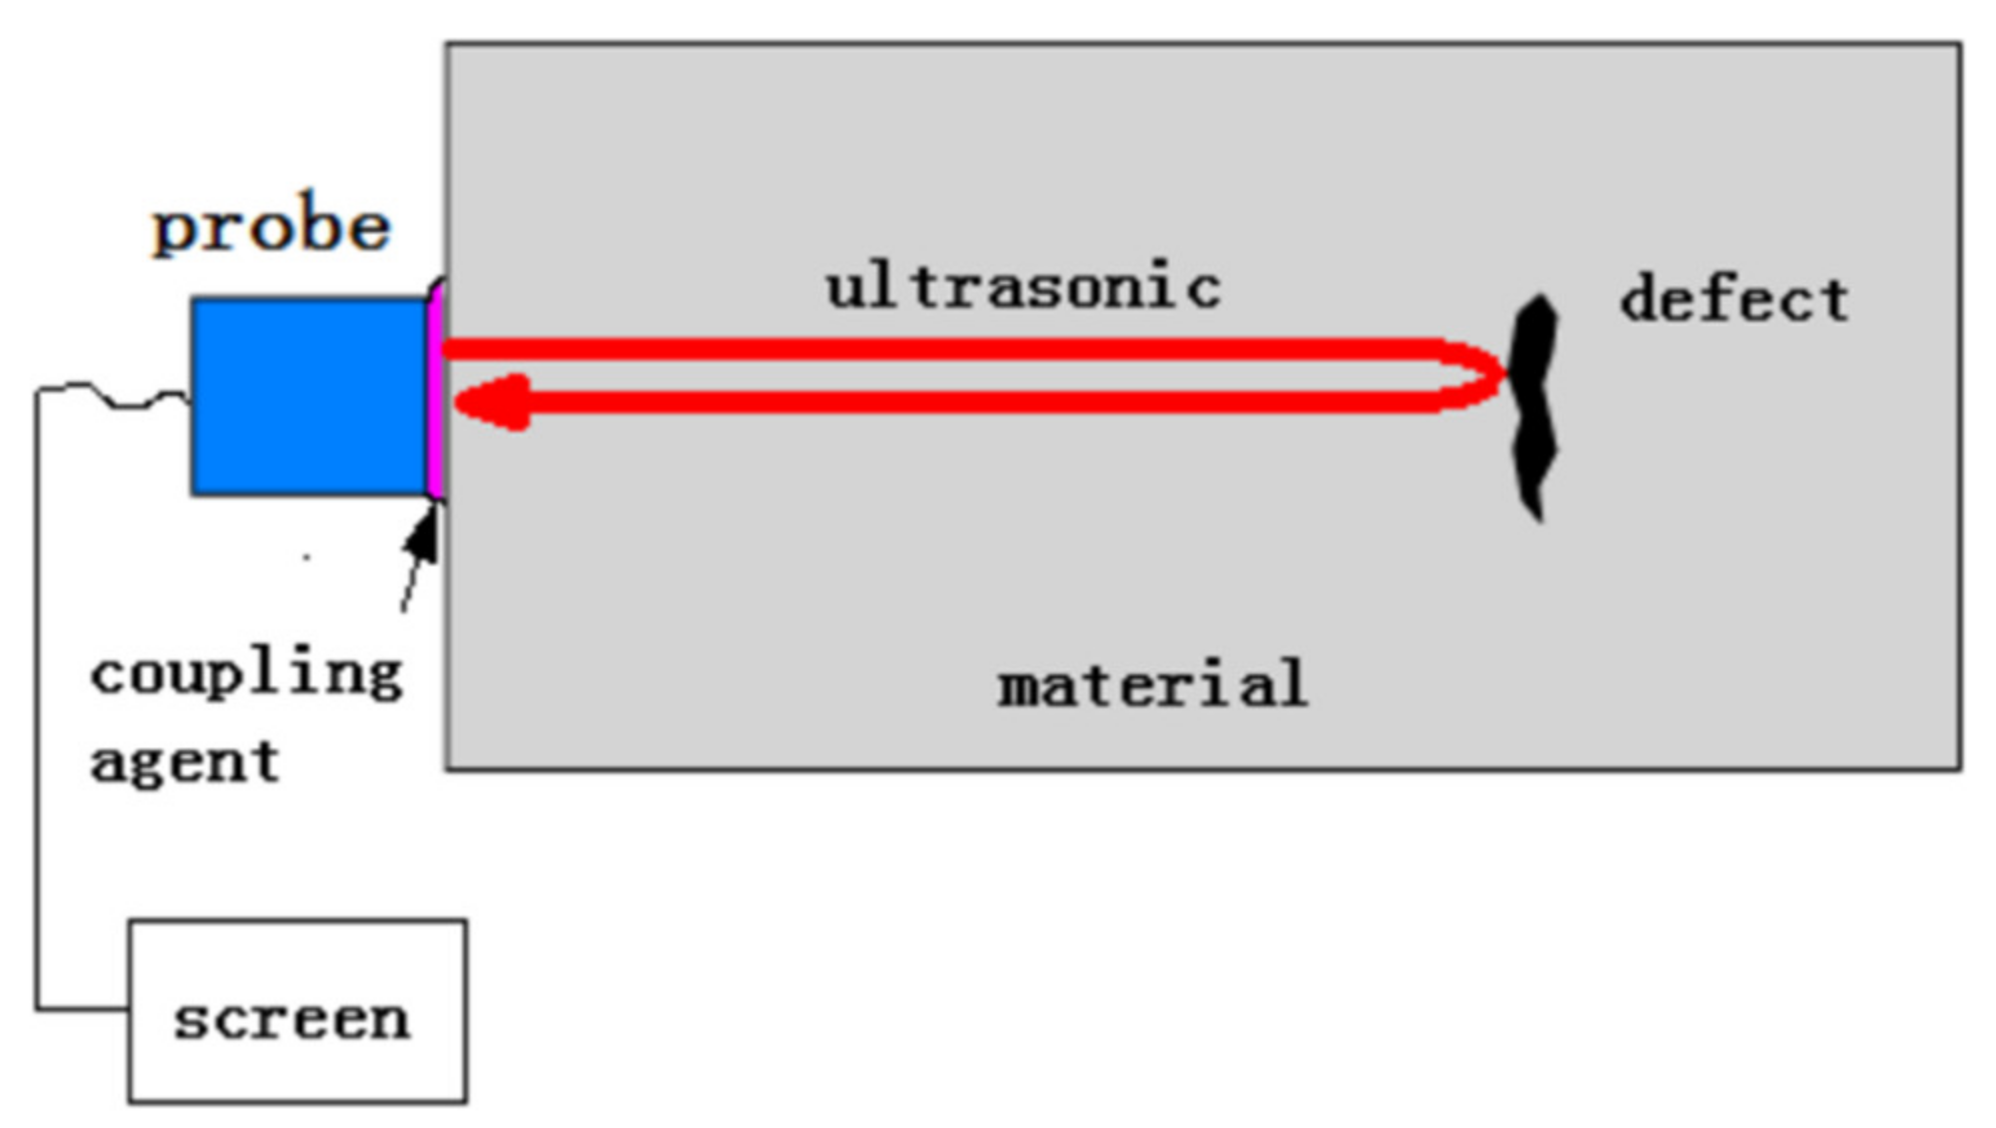
2.1. Ultrasonic Testing (UT)

Ultrasonic testing (UT) is characterized by using the mechanical energy of ultrasonic waves to detect defects in composite materials [20]. The range of frequencies above the human hearing (0.5–20 MHz) is utilized in this technique. Such short wavelengths of these signals can travel through solid, liquid, and gas, making them the best choice for better local resolution [16,21]. Figure 1 illustrates the basic principles of ultrasonic testing. A voltage pulse is sent to the probe to generate an ultrasonic pulse in this arrangement, propagating into the inspected material through a coupling agent. Upon meeting any defect, partial reflection will occur. The reflection travels back through the same path to be received by the probe, converted to an electric signal and displayed on the screen. The position and size of the detected defects could be determined by analyzing the reflected pulses in terms of location and amplitude [14].
Based on the thickness and structure of the inspected material, different frequencies are to be used in the inspection. Since composite materials are formed by stacking ply layers, higher frequencies are required to solve individual ply interfaces’ reflections. In other words, the resolution of the ultrasonic detection technique depends on the frequency of the utilized ultrasonic waves. On the other hand, the ultrasonic wave amplitude also needs to be adjusted to overcome the attenuation effects suffered by the acoustic waves reflected from the defects.
Reflection from internal defects in composite materials can be modeled as a reflection of partial wave [22]. The acoustic impedance of composite material is usually expressed as Z = ν ρ , where ν is the longitudinal wave velocity, and ρ is the density of the composite material [22]. Internal defects in the composite material are modeled as impedance discontinuities that cause partial reflection of the wave upon its incidence. Thus, this technique is able to detect any slight change in the density of the composite material as the partial reflections are tracked in amplitude and time.
From the aforementioned description, it can be understood that ultrasonic testing features the ability to detect defects in composite materials. However, some limitations hinder the wide usage of this technique. The first challenge is the inability to detect the mismatched regions between materials with different densities clearly. Another challenge arises from the long time required for ultrasonic testing to be performed [14]. Despite addressing these challenges in many approaches, there is still a high cost associated with each solution.
Moreover, since ultrasonic waves suffer from high attenuation that originates from defects of a particular shape, size, and spatial distribution, this technique is prone to fail in detecting defects that are small or located deep in the material [14].
Another problem with UT is the low resolution associated with the typically used frequency bands, namely 5 to 20 MHz. Higher resolution requires increasing the frequency band up to 2 GHz. Under such conditions, a method known as scanning acoustic microscopy (SAM) is used to detect the defects in detail. Furthermore, using ultrasonic testing to inspect laminated materials might cause the waves to be reflected or scattered.

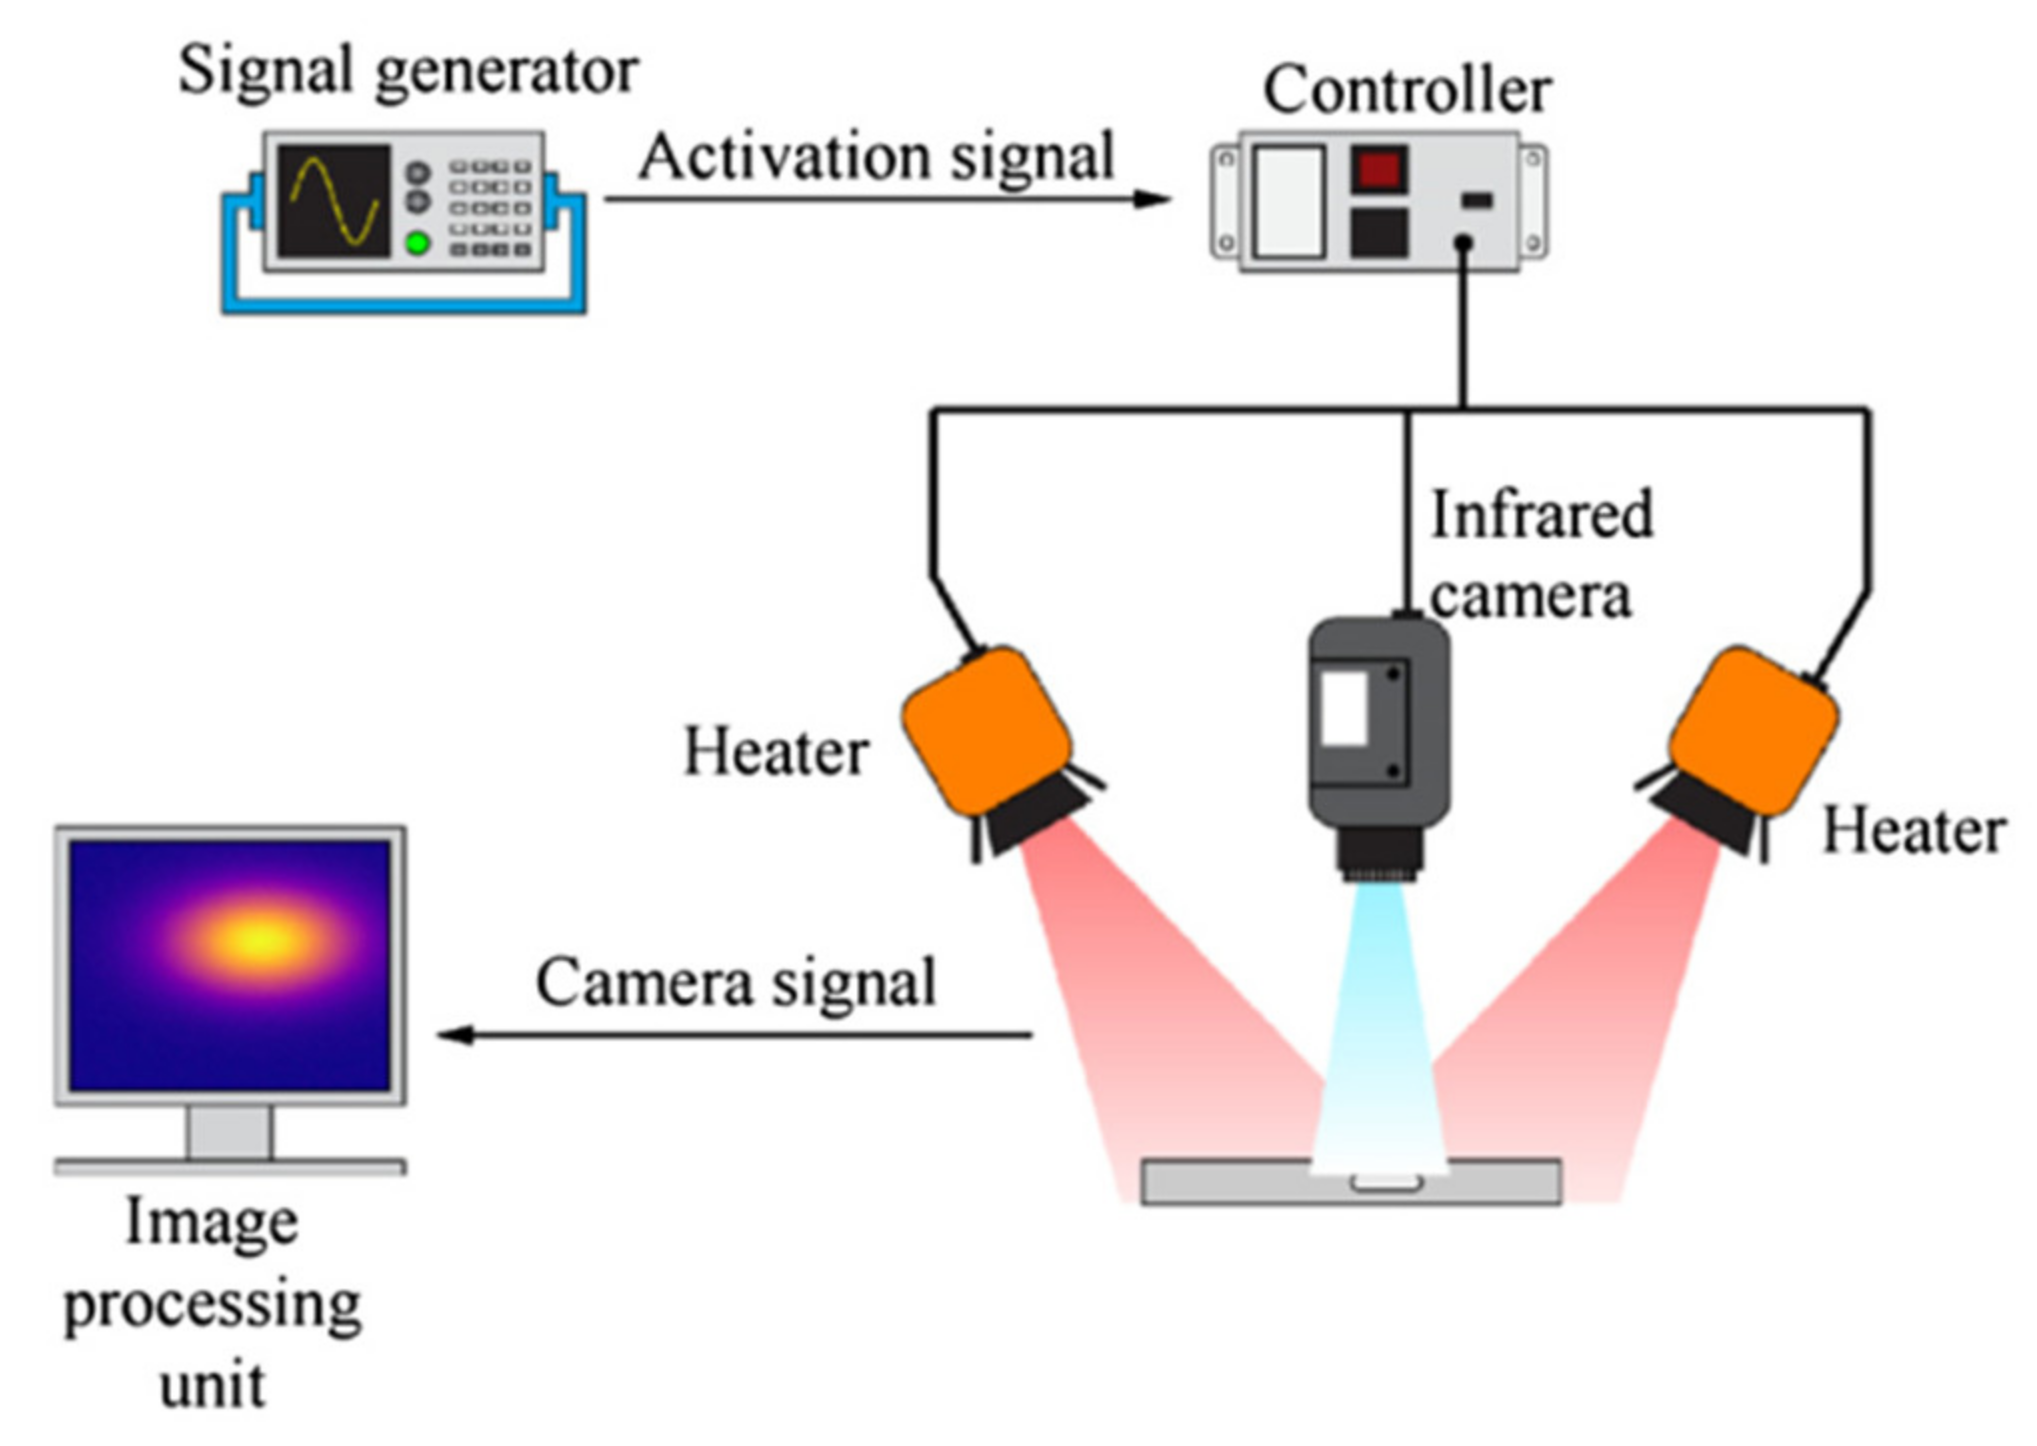
2.2. Infrared Thermography (IRT)

Infrared thermography (IRT) is a transient NDT method used for defect detection in composite materials by determining the temperature changes on the surface [23]. Propagation of the infrared thermal energy through the inspected material generates a thermal gradient that could be used to determine the existence of defects according to the emissivity coefficients [15]. IRT can be categorized into passive IRT, where testing is conducted by monitoring the conditions of the tested material based on the thermal radiation emitted by its surface under natural conditions [24]. On the other hand, active IRT uses external sources to create a temperature difference between the areas to be inspected [25,26,27].
Figure 2 shows a basic setup of active infrared thermography testing. Placing two heaters above the composite material under test causes the surface temperature of the sample to increase due to the infrared radiation. Consequently, the surface temperature starts to decay as the infrared heat starts to propagate through the material. The changes in the temperature are captured by the infrared camera fixed above the sample. By processing these changes via an image processing unit, any impurities or defects will be detected as they cause a change in the heat flow inside the sample [18]. The shapes of the defects can be deduced from the difference in the temperature distribution between the defective area and the region around it. For instance, for a composite material containing a delaminated area, the rate of temperature decay within that area will be slower than in other regions not affected by the same defect.
Active IRT can be achieved by several methods depending on the type of the external heat source, such as optically stimulated thermography, ultrasonic stimulated thermography, and eddy current stimulated thermography [28].
In ultrasonic stimulated thermography (also known as vibro-thermography), an ultrasonic plastic welding horn is pressed against the surface of the composite material sample under test, which causes internal vibrations in the material to generate frictional heating in the defected regions and can be captured by the infrared camera [29].
In most cases, the use of IRT only is inadequate for nondestructive inspection of composite materials. There are many reasons for this limitation: first, some IRT methods require a long processing time and are limited to depth resolution. Secondly, the high heating power required for the inspection process might cause non-uniform surface heating and, in some cases, cause damages to some parts of the samples.

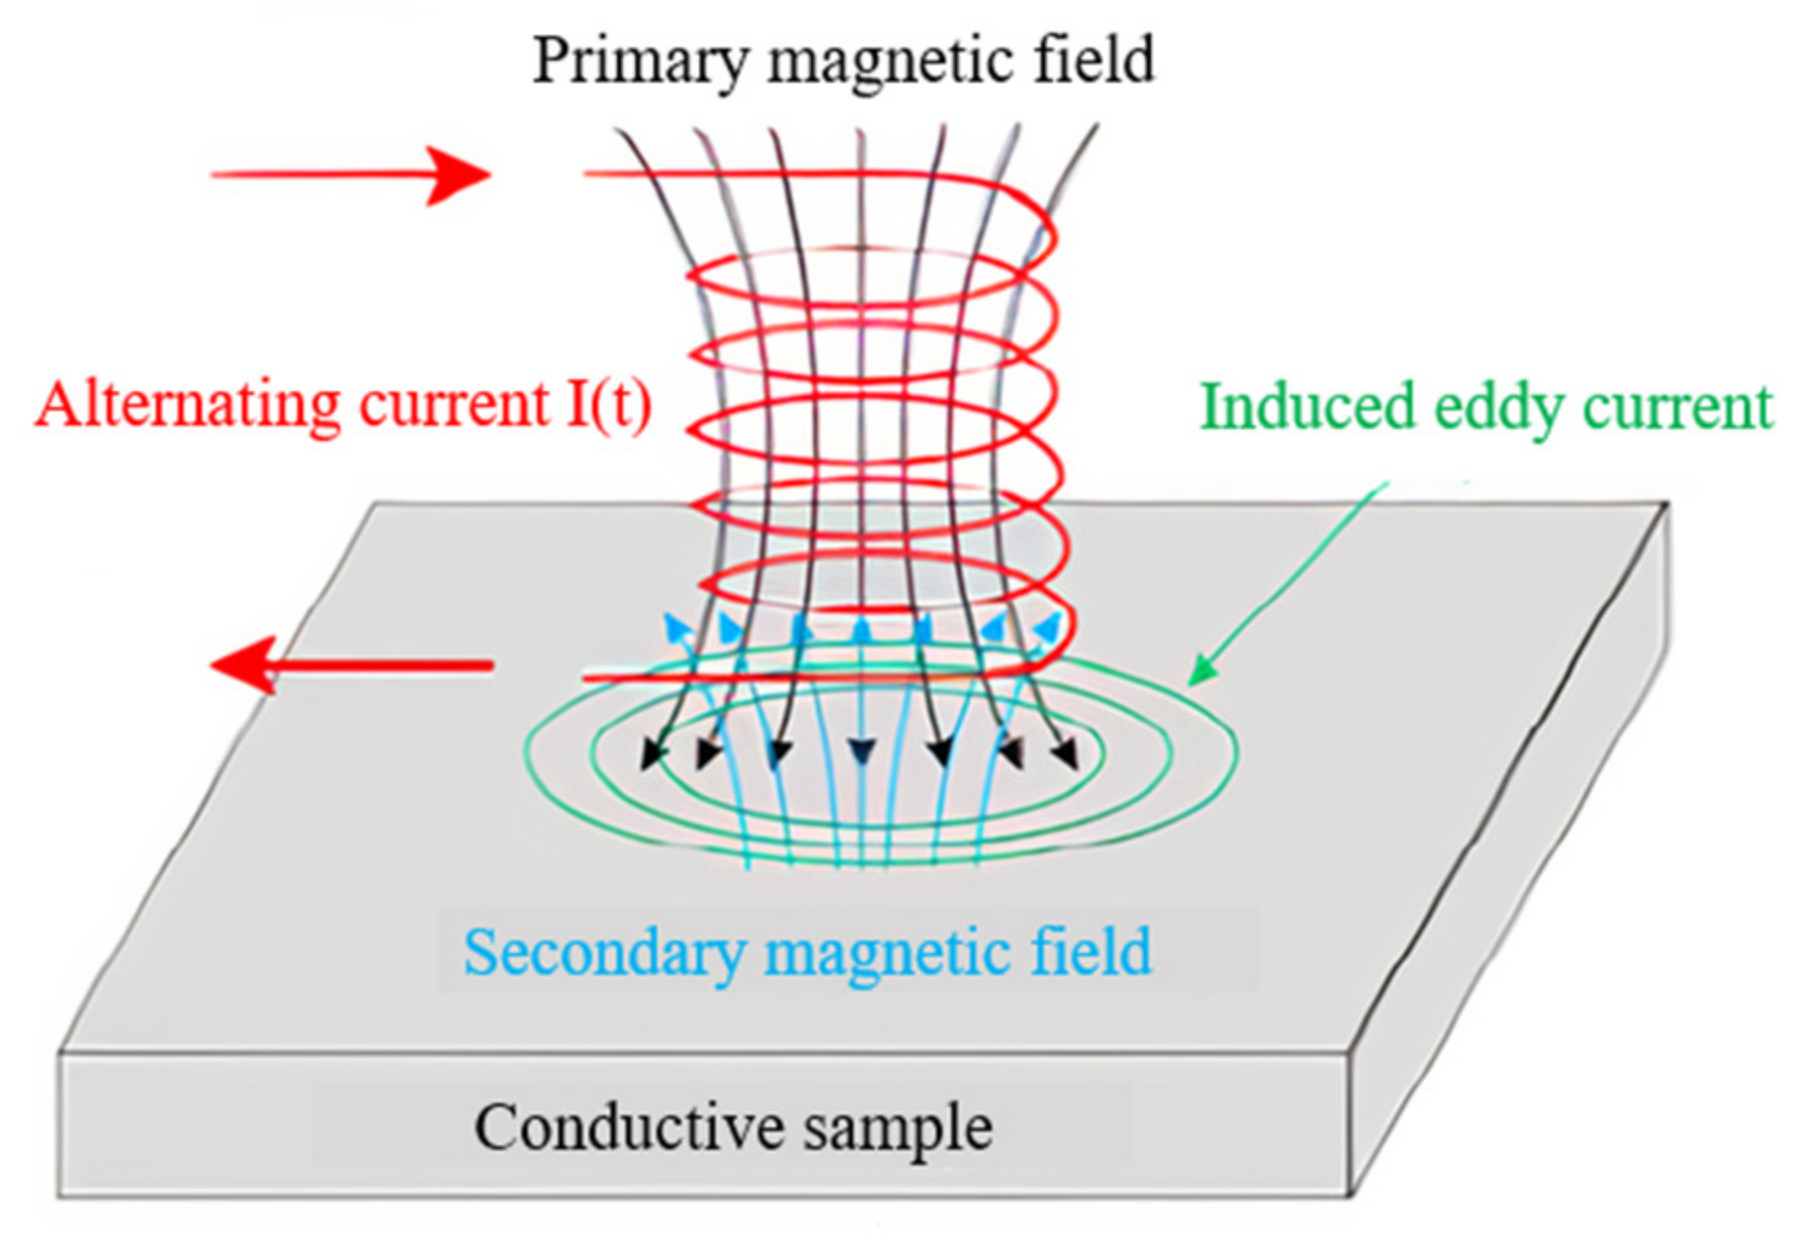
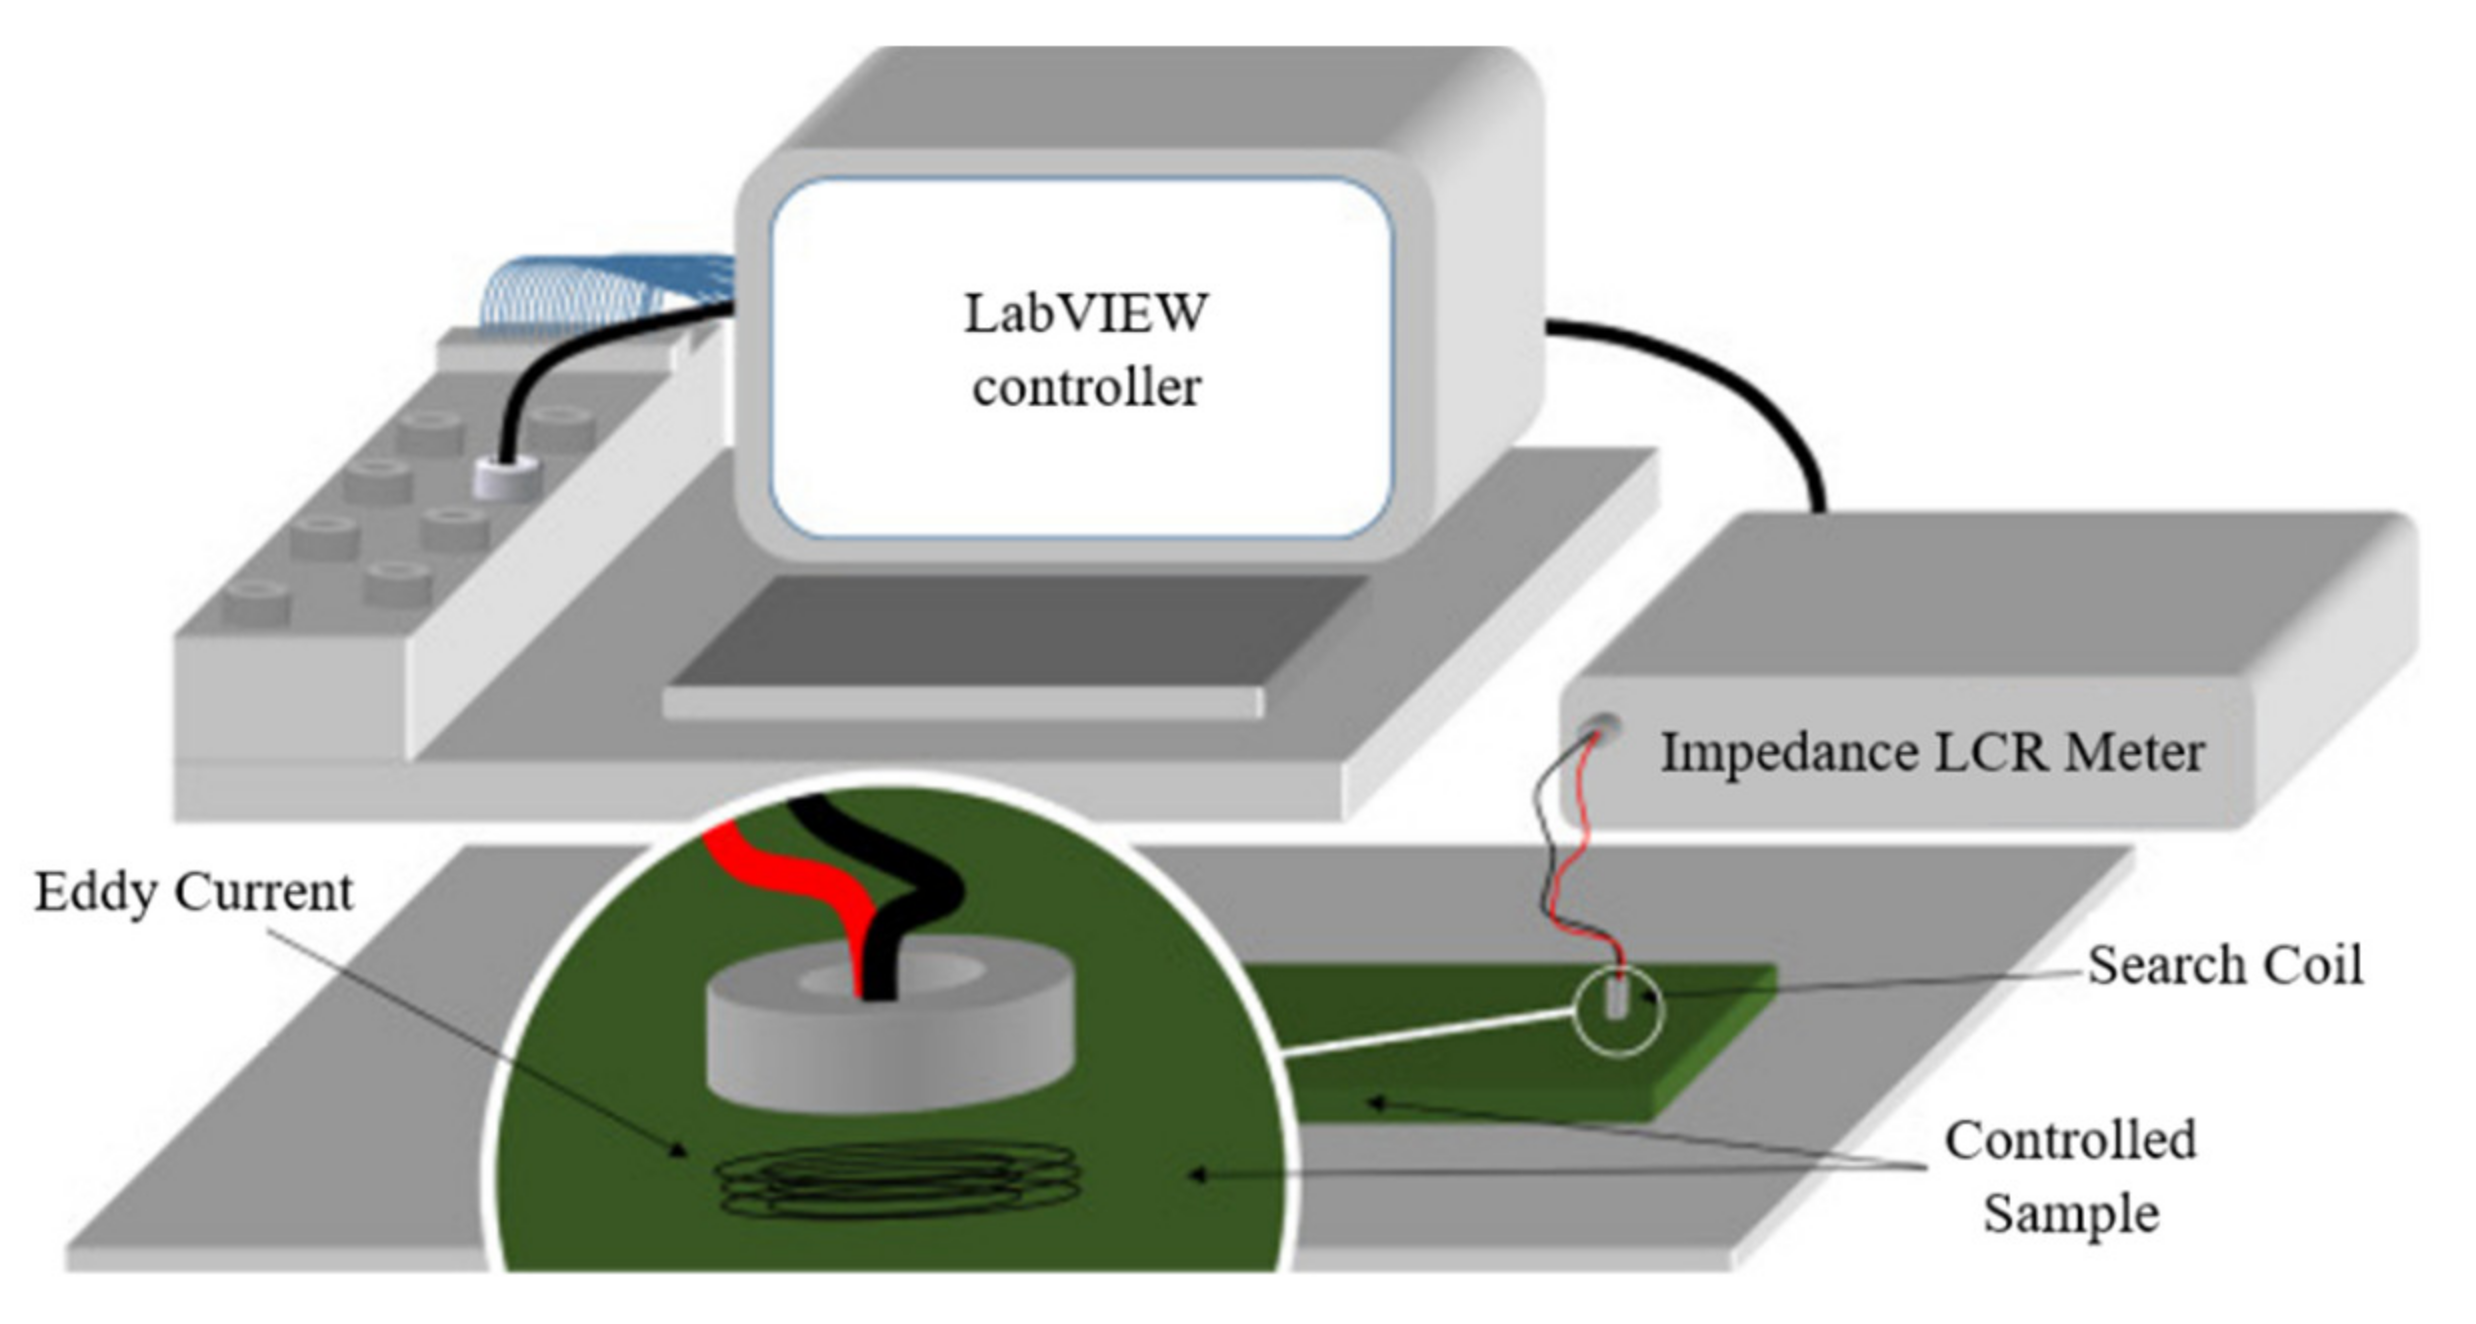
2.3. Eddy Current Testing (ECT)

Eddy current testing (ECT) is a method that utilizes the theory of electromagnetic induction to inspect conductive composite materials [16,30]. By using a transmitter coil, a primary magnetic field is generated near the material under test. According to Faraday’s law, an eddy current will be induced in the material [31]. A secondary magnetic field will also be generated in the material to interact with the magnetic field generated by the coil, as shown in Figure 3. On the other hand, the schematic diagram of the ECT is shown in Figure 4.
Composite material inspection using the above arrangement can be undertaken by performing eddy current thermography, which relies on heat generation by electromagnetically induced eddy currents. Heat diffusion waves will be stimulated by the eddy current and interact with the defects inside the composite material to be inspected. On the other hand, ECT can also be performed by inspecting the secondary magnetic field in the composite material. The existence of defects inside the inspected material will cause the eddy currents to be interrupted. Therefore, defected regions can be identified by observing the parts of the tested samples with weak secondary magnetic fields. Detecting the internal defects can also be performed by tracking the changes in the impedance of the inspected regions since it is related to the strength of the eddy currents.
ECT is a popular inspection method in many applications, such as steam generator tubes, feedwater heater tubes, and turbine blades and rotors [16]. It is also widely utilized to test the CFRP and metal matrix composites used in the aircraft industry. However, as explained above, this NDT approach can only be used with conductive composite materials. Therefore, it falls short of inspecting any insulator or dielectric-based wrapping samples. Also, many ECT approaches can only detect surface and near-surface flaws [17], although it could detect deep defects when applying the pulsed eddy current testing (PECT) technique [34]. Moreover, numerous conditions need to be considered before performing ECT, such as determining the optimal distance between the probe and the material and frequency of the pulses used for detection [17,35].

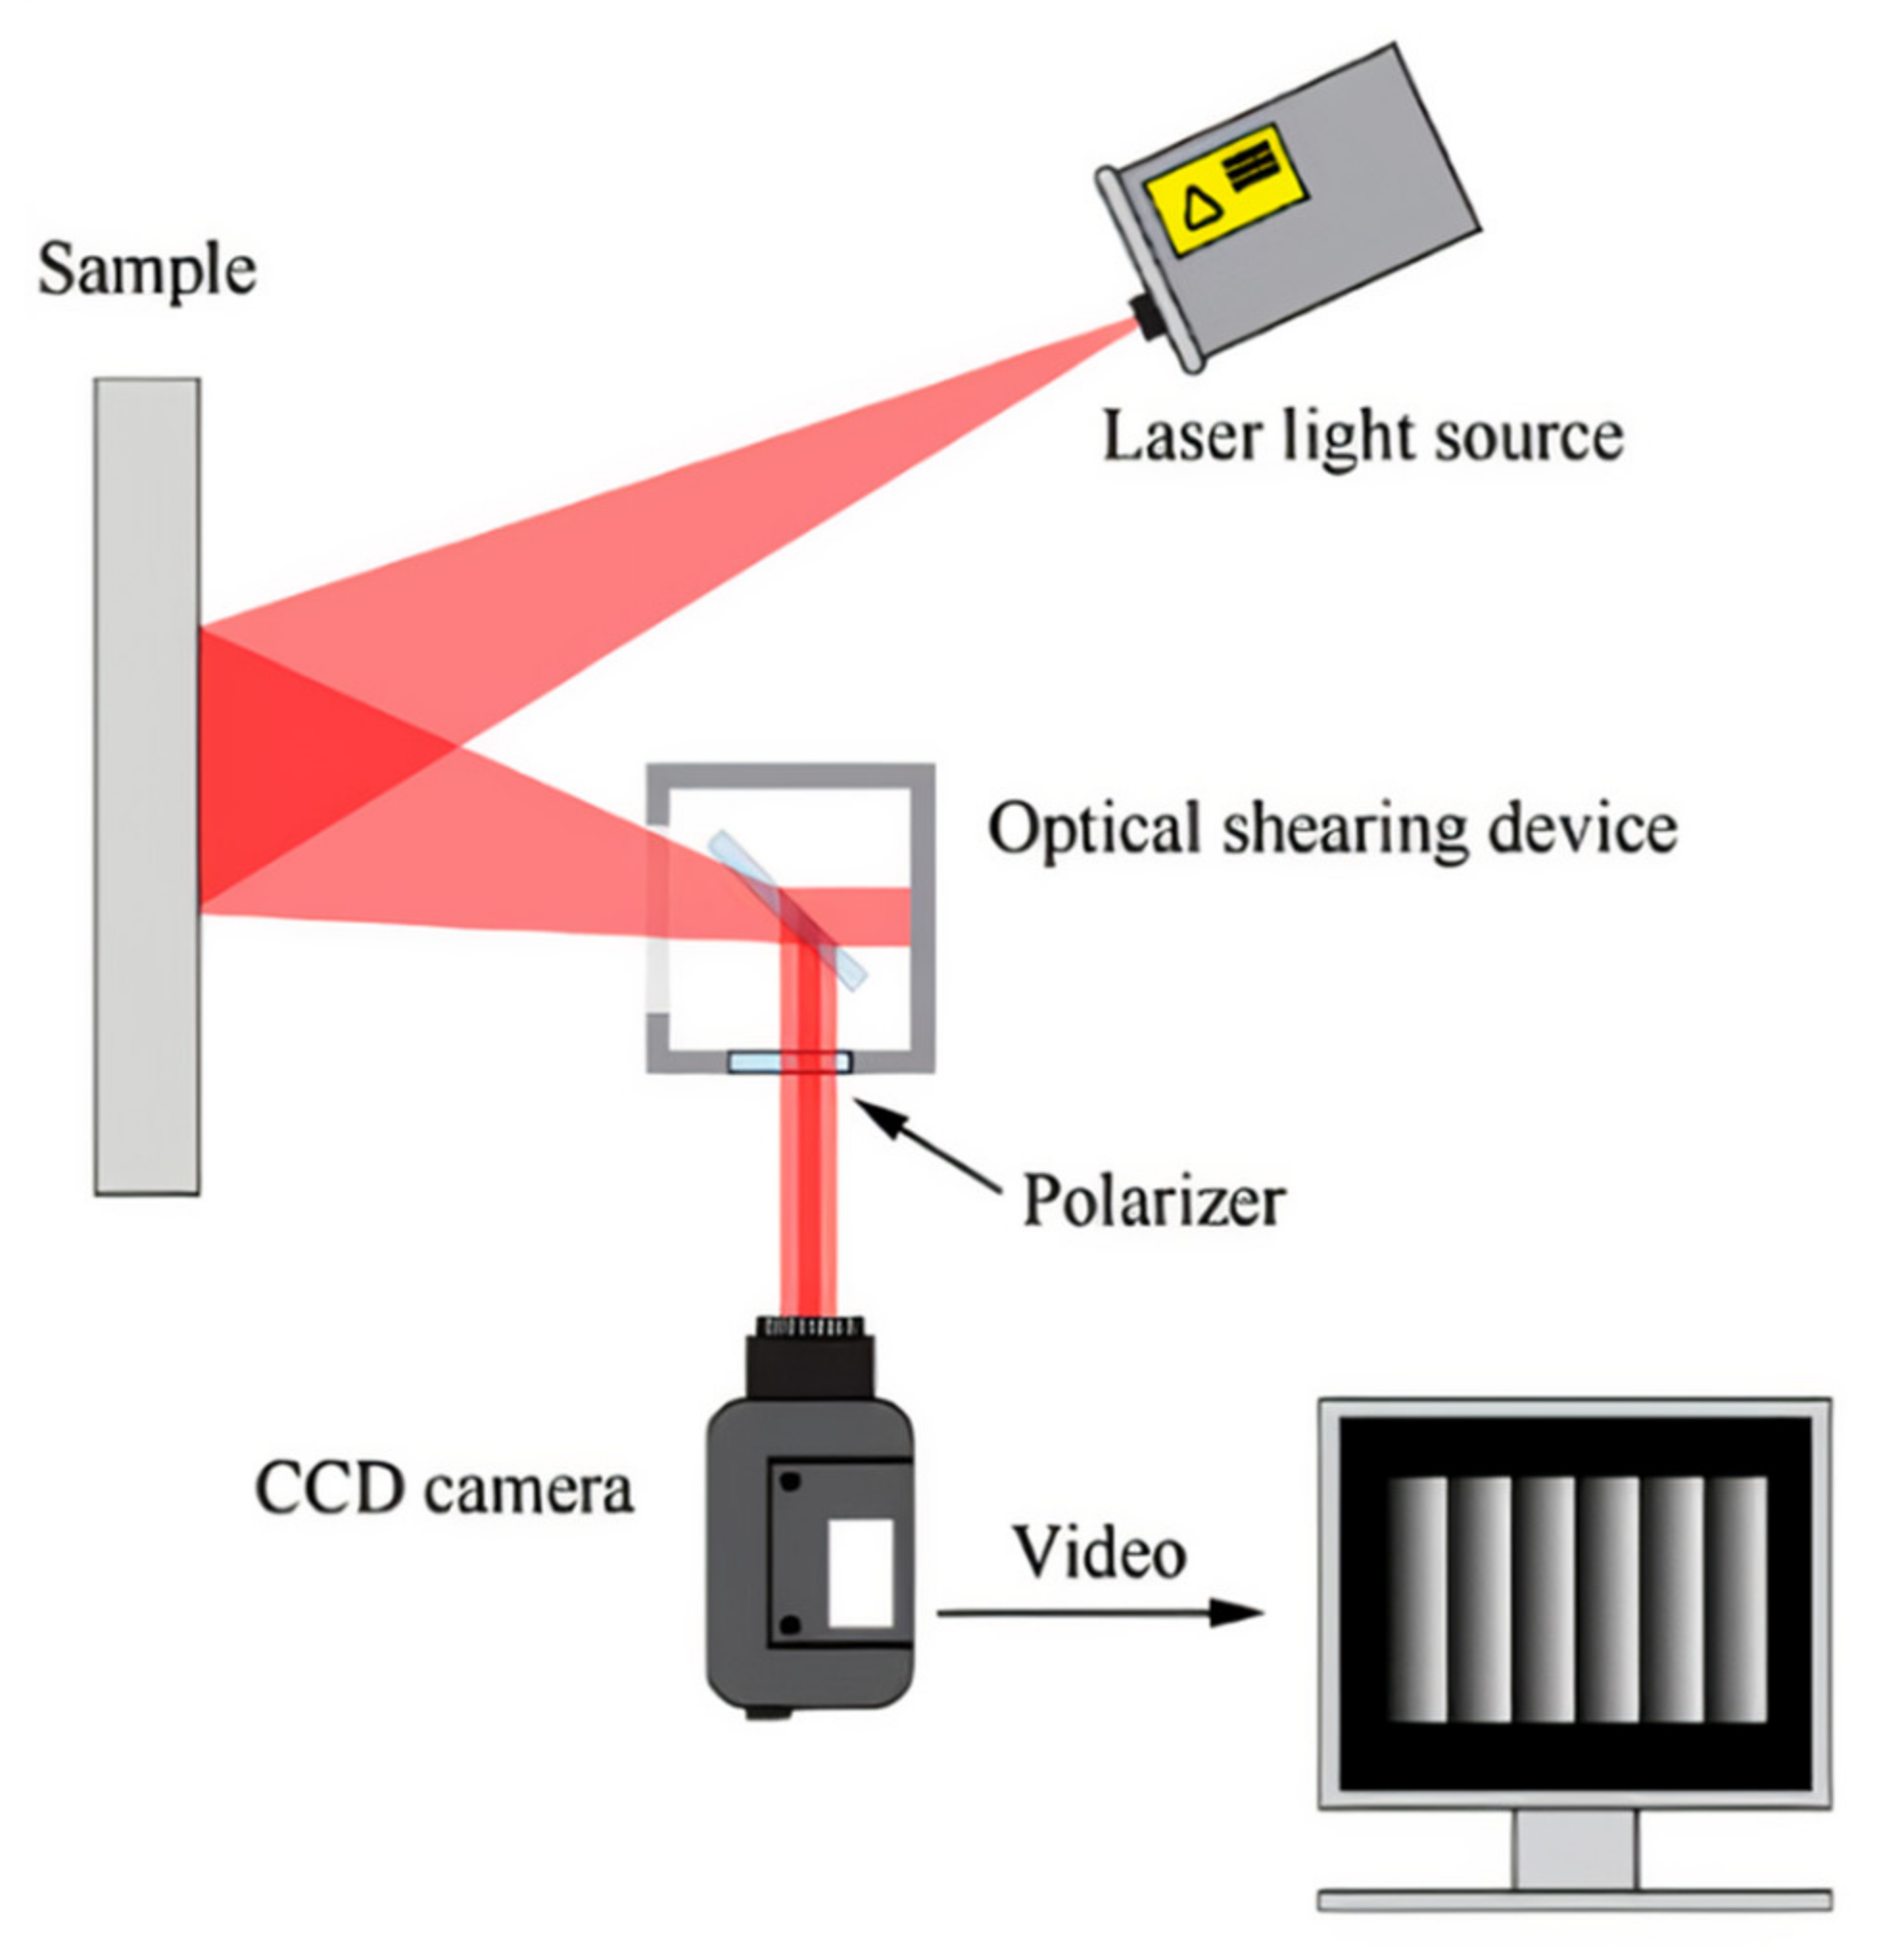
2.4. Laser Shearography (LS)

Laser shearography (LS) employs coherent and monochromatic laser light properties to illuminate the surface of the composite material under test. These properties will cause the reflected lights from the rough surfaces of the defected areas to generate a speckle pattern, which is captured by a camera [18]. Figure 5 shows an LS testing setup. The processing of the interferometry images is achieved by using two laser beams with the same wavelength. A charge-coupled device (CCD) video sensor captures the condition of the inspected sample. Consequently, the speckle pattern can be produced according to the inherent surface roughness of the material. Applying external load causes deformations in the inspected material’s surface, which will make the speckle pattern change. Employing a loading system, such as a vacuum, would emphasize the defects in the composite materials by applying surface vacuum stressing to the sample, which causes the effect of body “expansion” [27].
There are numerous advantages to the LS method. However, there are some limitations. First, the method is not able to access deformations and defects inside the material [19]. Secondly, the method suffers from a low signal-to-noise ratio, which represents a hindrance to an accurate evaluation.

3. Microwave Inspection

The microwave inspection method involves using frequencies from 300 MHz to 300 GHz, which is, in general, higher than the frequency bands used for the eddy current technique [36]. Electromagnetic waves within these frequency ranges can penetrate dielectric materials and interact with their internal structure [11]. Moreover, extra safety measures’ added cost is reduced when using such non-ionizing waves [37]. Therefore, unlike electromagnetic inspection methods that use higher frequencies (e.g., X-ray NDT), this method could be considered the best candidate for nondestructively inspecting dielectric composite materials.
Microwave inspection can be performed in two modes, namely reflection mode and transmission mode. In reflection mode, the microwave signal is transmitted through the inspected material. The material’s internal structure reflections are collected and processed in terms of magnitude and/or phase behaviour. A circulator is used as a duplexer to allow the same probe to be used for transmission and reception, as shown in Figure 6a. On the other hand, transmission mode uses a probe to transmit the microwave signal from one side of the sample and another probe to receive the signal from its backside, as shown in Figure 6b.
This section will outline and discuss the most prominent microwave inspection techniques reported in the literature. The applications for each technique are summarized in Table 2. The signal processing approaches that are followed to analyze the reflected and transmitted microwave signals are also highlighted. The section will also delve into the state-of-art machine learning methods used to enhance the outcomes of the microwave inspection techniques.

3.1. Techniques of Microwave Inspection

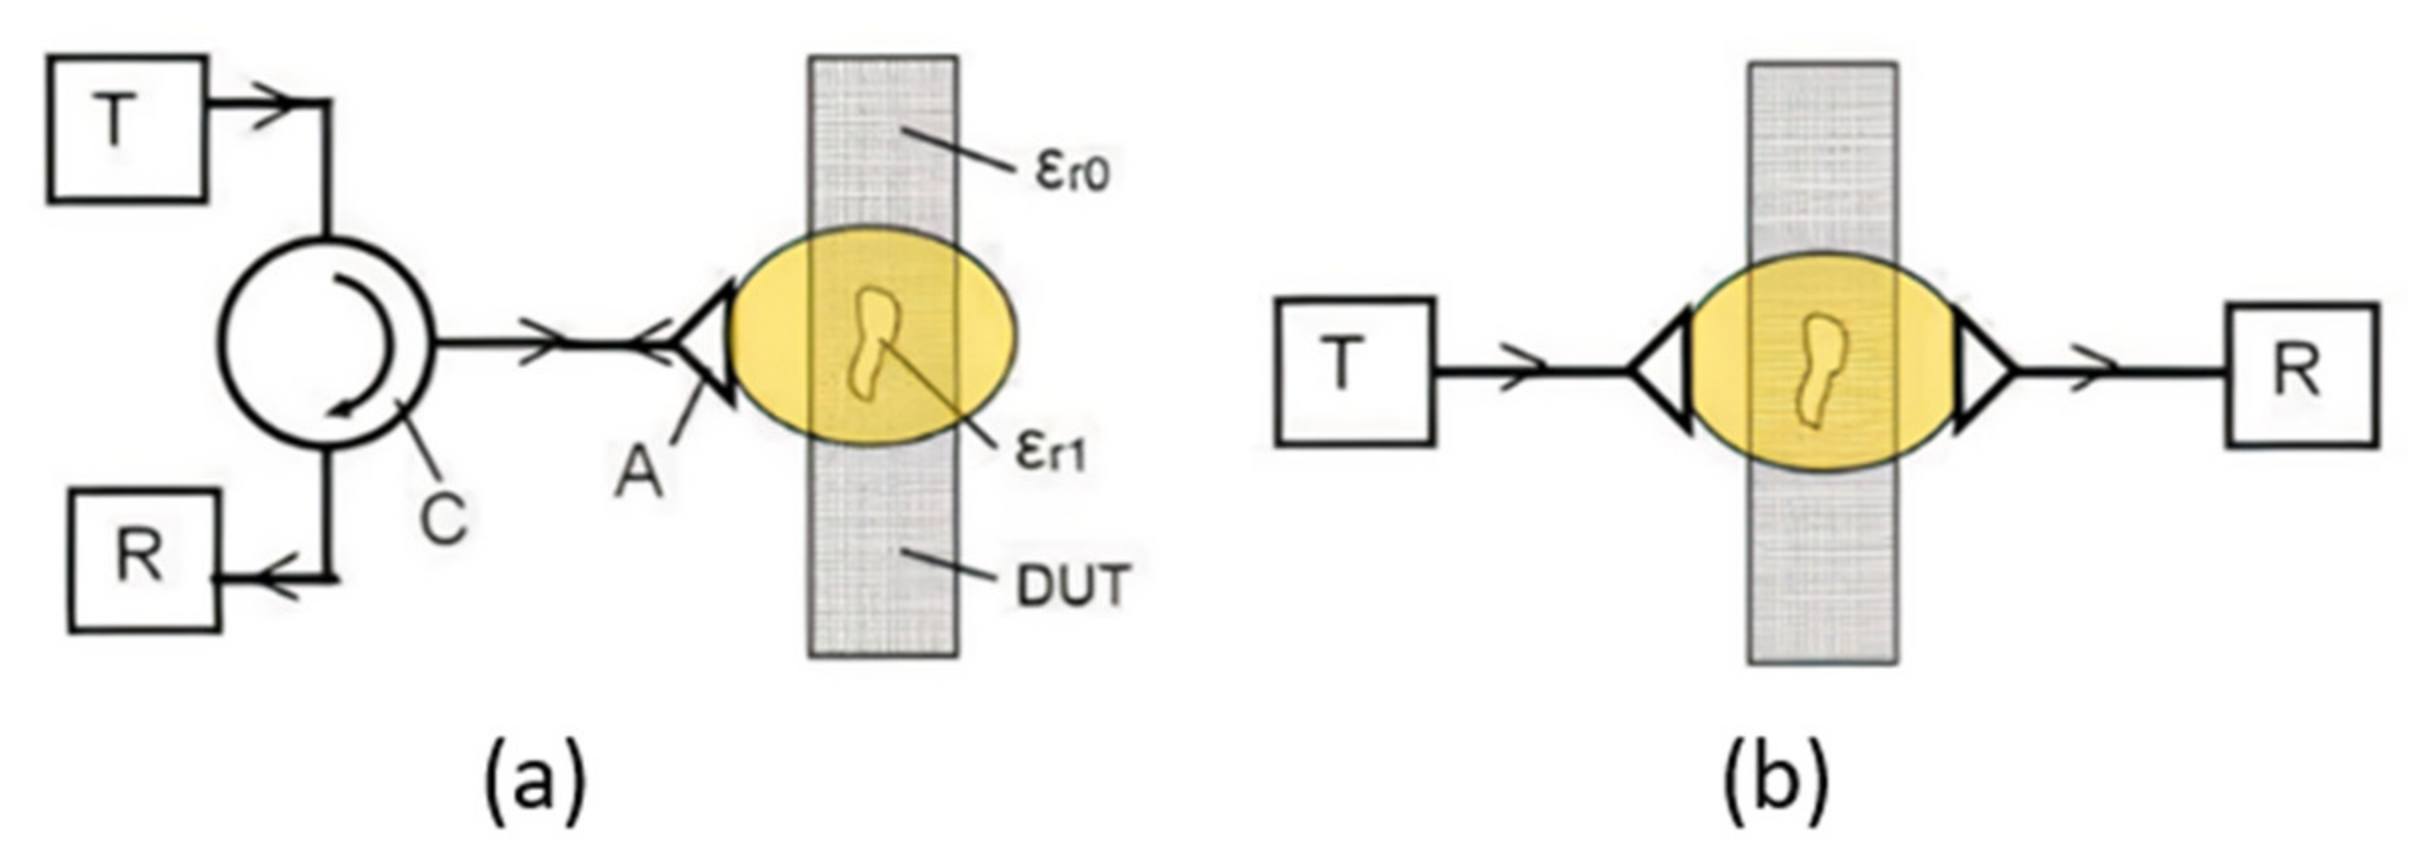
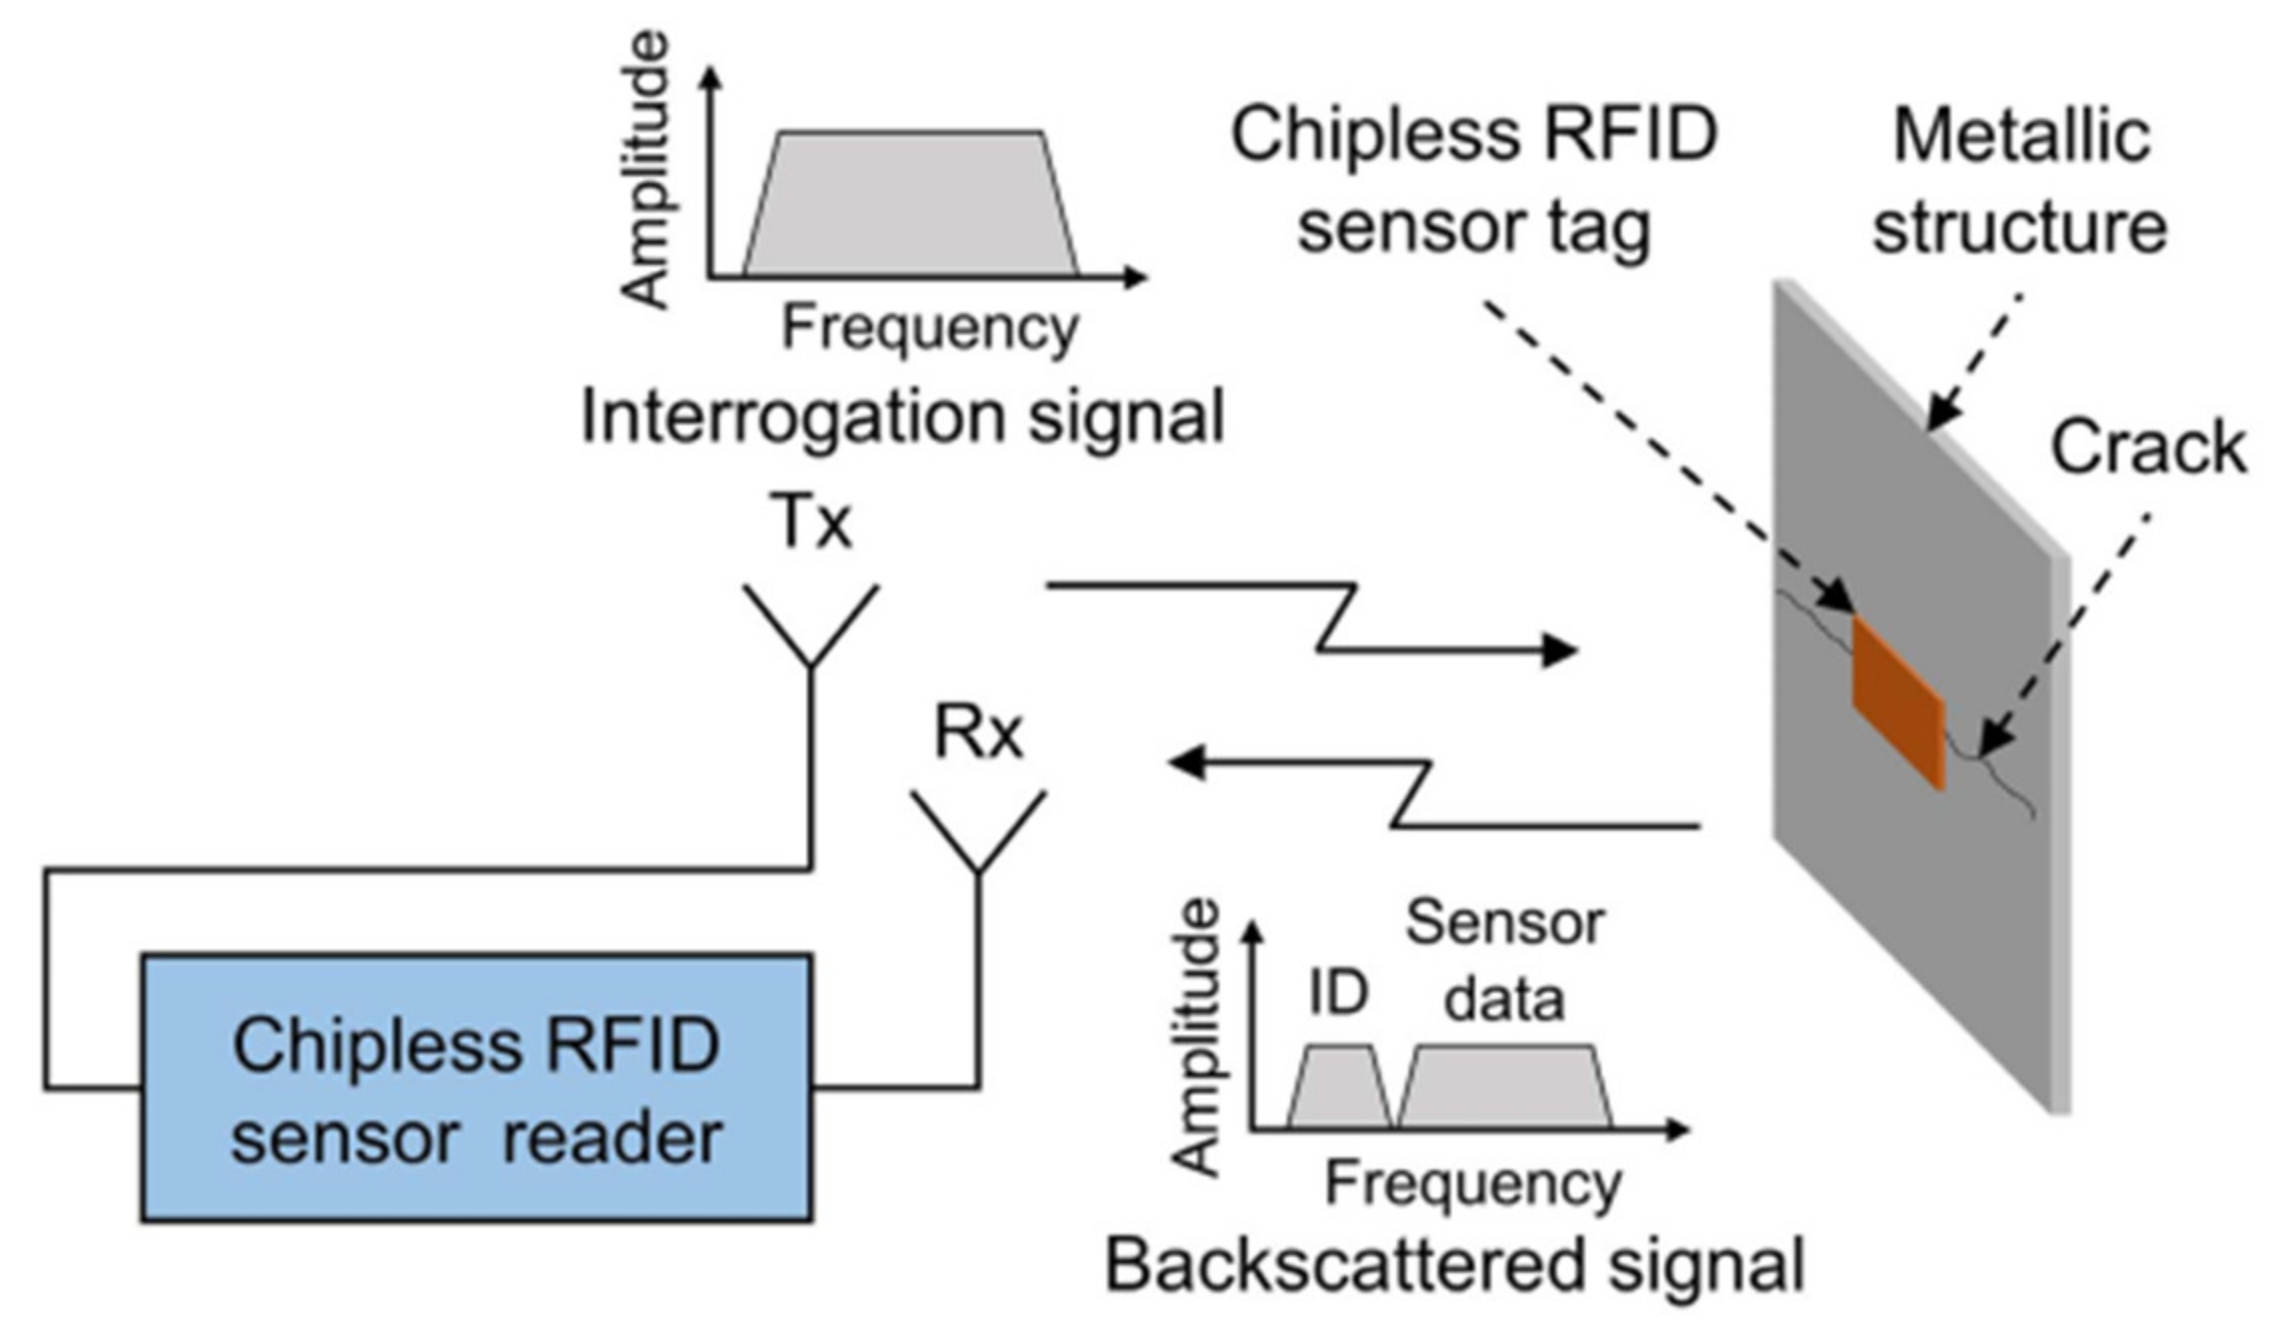
3.1.1. Chipless Radio-Frequency Identification (RFID) Sensor System

The chipless radio-frequency identification (RFID) sensor system was studied in [38] for structural health monitoring (SHM) applications. The working principles of the system for metal crack detection and characterization are shown in Figure 7. There is a sensor tag mounted on a metallic structure that is under investigation. The sensor reader will communicate with the sensor tag by transmitting a broadband signal via the transmitter. The resulting backscattered signal will be reflected from the sensor tag and the metal to the receiver for the sensor reading to carry out signal processing and feature extraction. This step is to identify the tag ID and read the information of the sensor. The sensor tag is very important in shaping the backscattered signal and forming a special signature in the frequency domain throughout the system. On the other hand, there is also a reader used to interpret the sensing features from the sensor tag to sense the availability of the cracks in the metallic structure under investigation.
In [50], a multi-directional expansion of metal defects is studied, where a 3D patch-bend dipole operating at 915 MHz was used. The simulation process was performed via Ansys HFSS. The results obtained were explained in terms of accuracy in depth, width, and the locations of the smooth defects on the metal surface. According to the study, the antenna could detect the defects with a minimum of 2 mm accuracy for depth and 1 mm accuracy for width. However, this kind of antenna is only suitable for surface smooth defects detection on the metal structures on the right side of the antenna, as shown in Figure 8.

3.1.2. Guided Microwave Testing (GMT)

Corrosion under insulation (CUI) is a common issue faced by the oil and gas industry, where corrosion always occurs in the pipeline. The insulation layers and protective metallic cladding cause the inspection process to be complex and unable to directly access the pipe surface [39]. Removal of the insulation layers at every inspection is time-consuming and costly. Hence, Bejjavarapu et al. have shown the utilization of guided microwave testing (GMT) to investigate the extended length of the pipeline [40]. During GMT, the microwave pulse will be transmitted by the transmitter through a sensor cable. The transmitted microwave pulse will hit the surface of the liquid and be reflected to the sensor and finally to the transmitter housing. The filling level will be determined by the electronic integrated at the transmitter according to the time taken by the microwave pulse transmitted to and back from the sensor. The strength of the microwave reflections from the wet volumes of insulation will affect the sensitivity of GMT. By this, a sudden change from dry to fully saturated insulation will occur. The idealized water volumes must be characterized by an abrupt transition from dry to 100% of water saturation to obtain high sensitivity. The paper proposed an experiment related to saturation dynamics in a highly permeable material to determine the saturation profiles obtained from capillary rise and seepage. Based on the experimental results, the wavelength of the probing signal is larger than the extent of the transition region. This will have some limited effects on the amplitude of the reflected signal. In this case, acquiring and storing the microwave signals was undertaken at 5 s intervals for the first 10 min and this was followed every 2 min. Estimation of the reflected pulse amplified from the aperture without foam was undertaken by performing a baseline measurement, which is to compensate for backscattering caused by the aperture in the cladding used to allow water into the foam blocks. About 0.1% of the end cap reflection was deducted from the reflection coefficient from the absorbed water. The narrow gaps of a few millimeters in width caused the water infiltration in the insulation of actual pipelines. Hence, the width was between one or two orders of magnitude smaller than the TEM wavelength. This condition leads to a very small backscattering and signal loss.

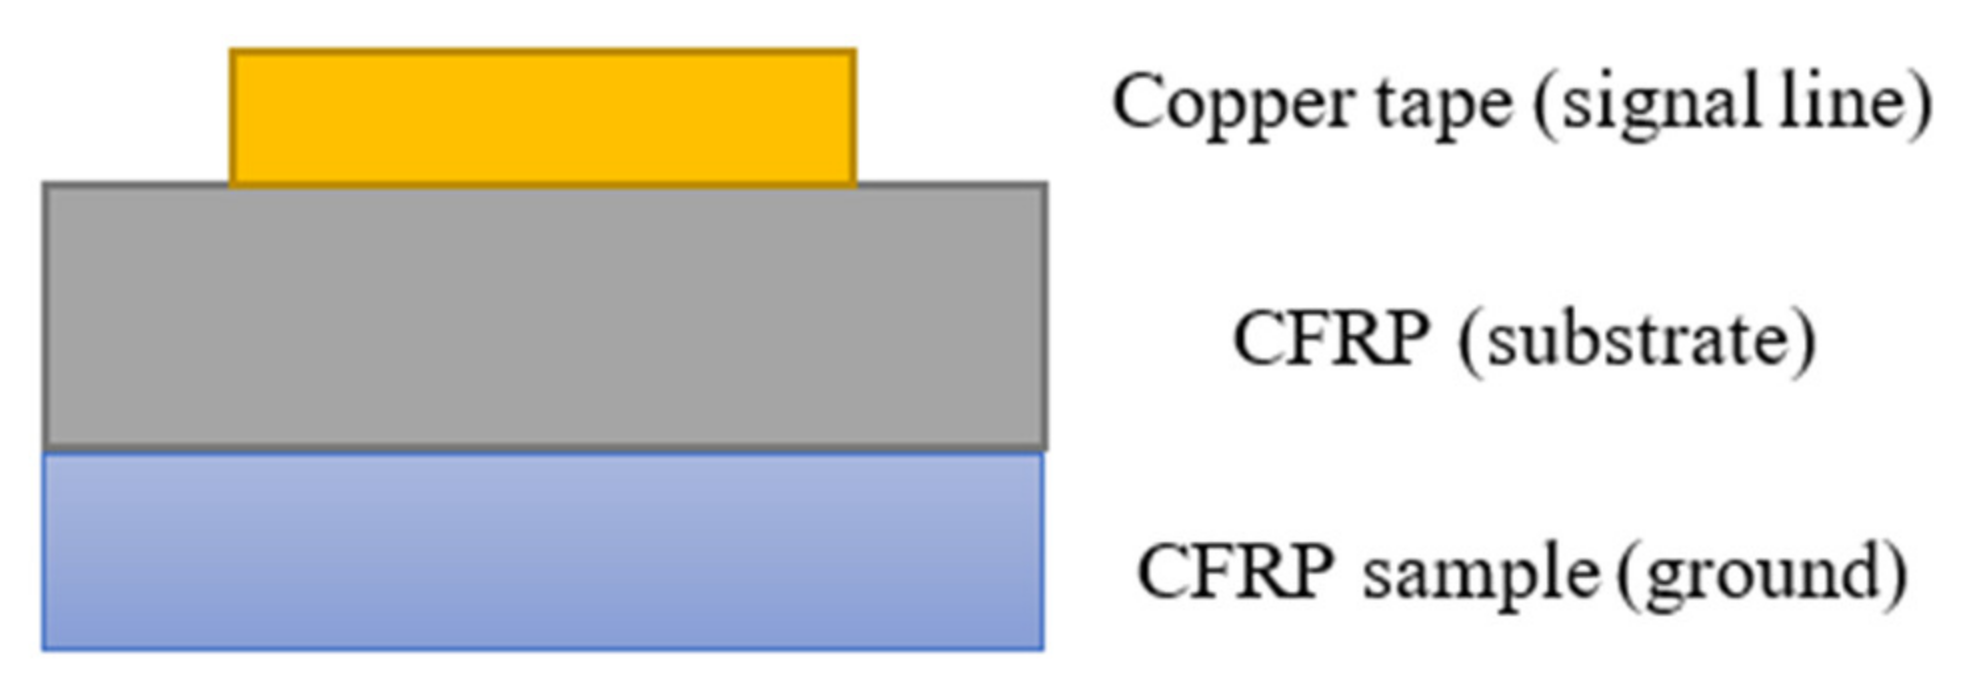
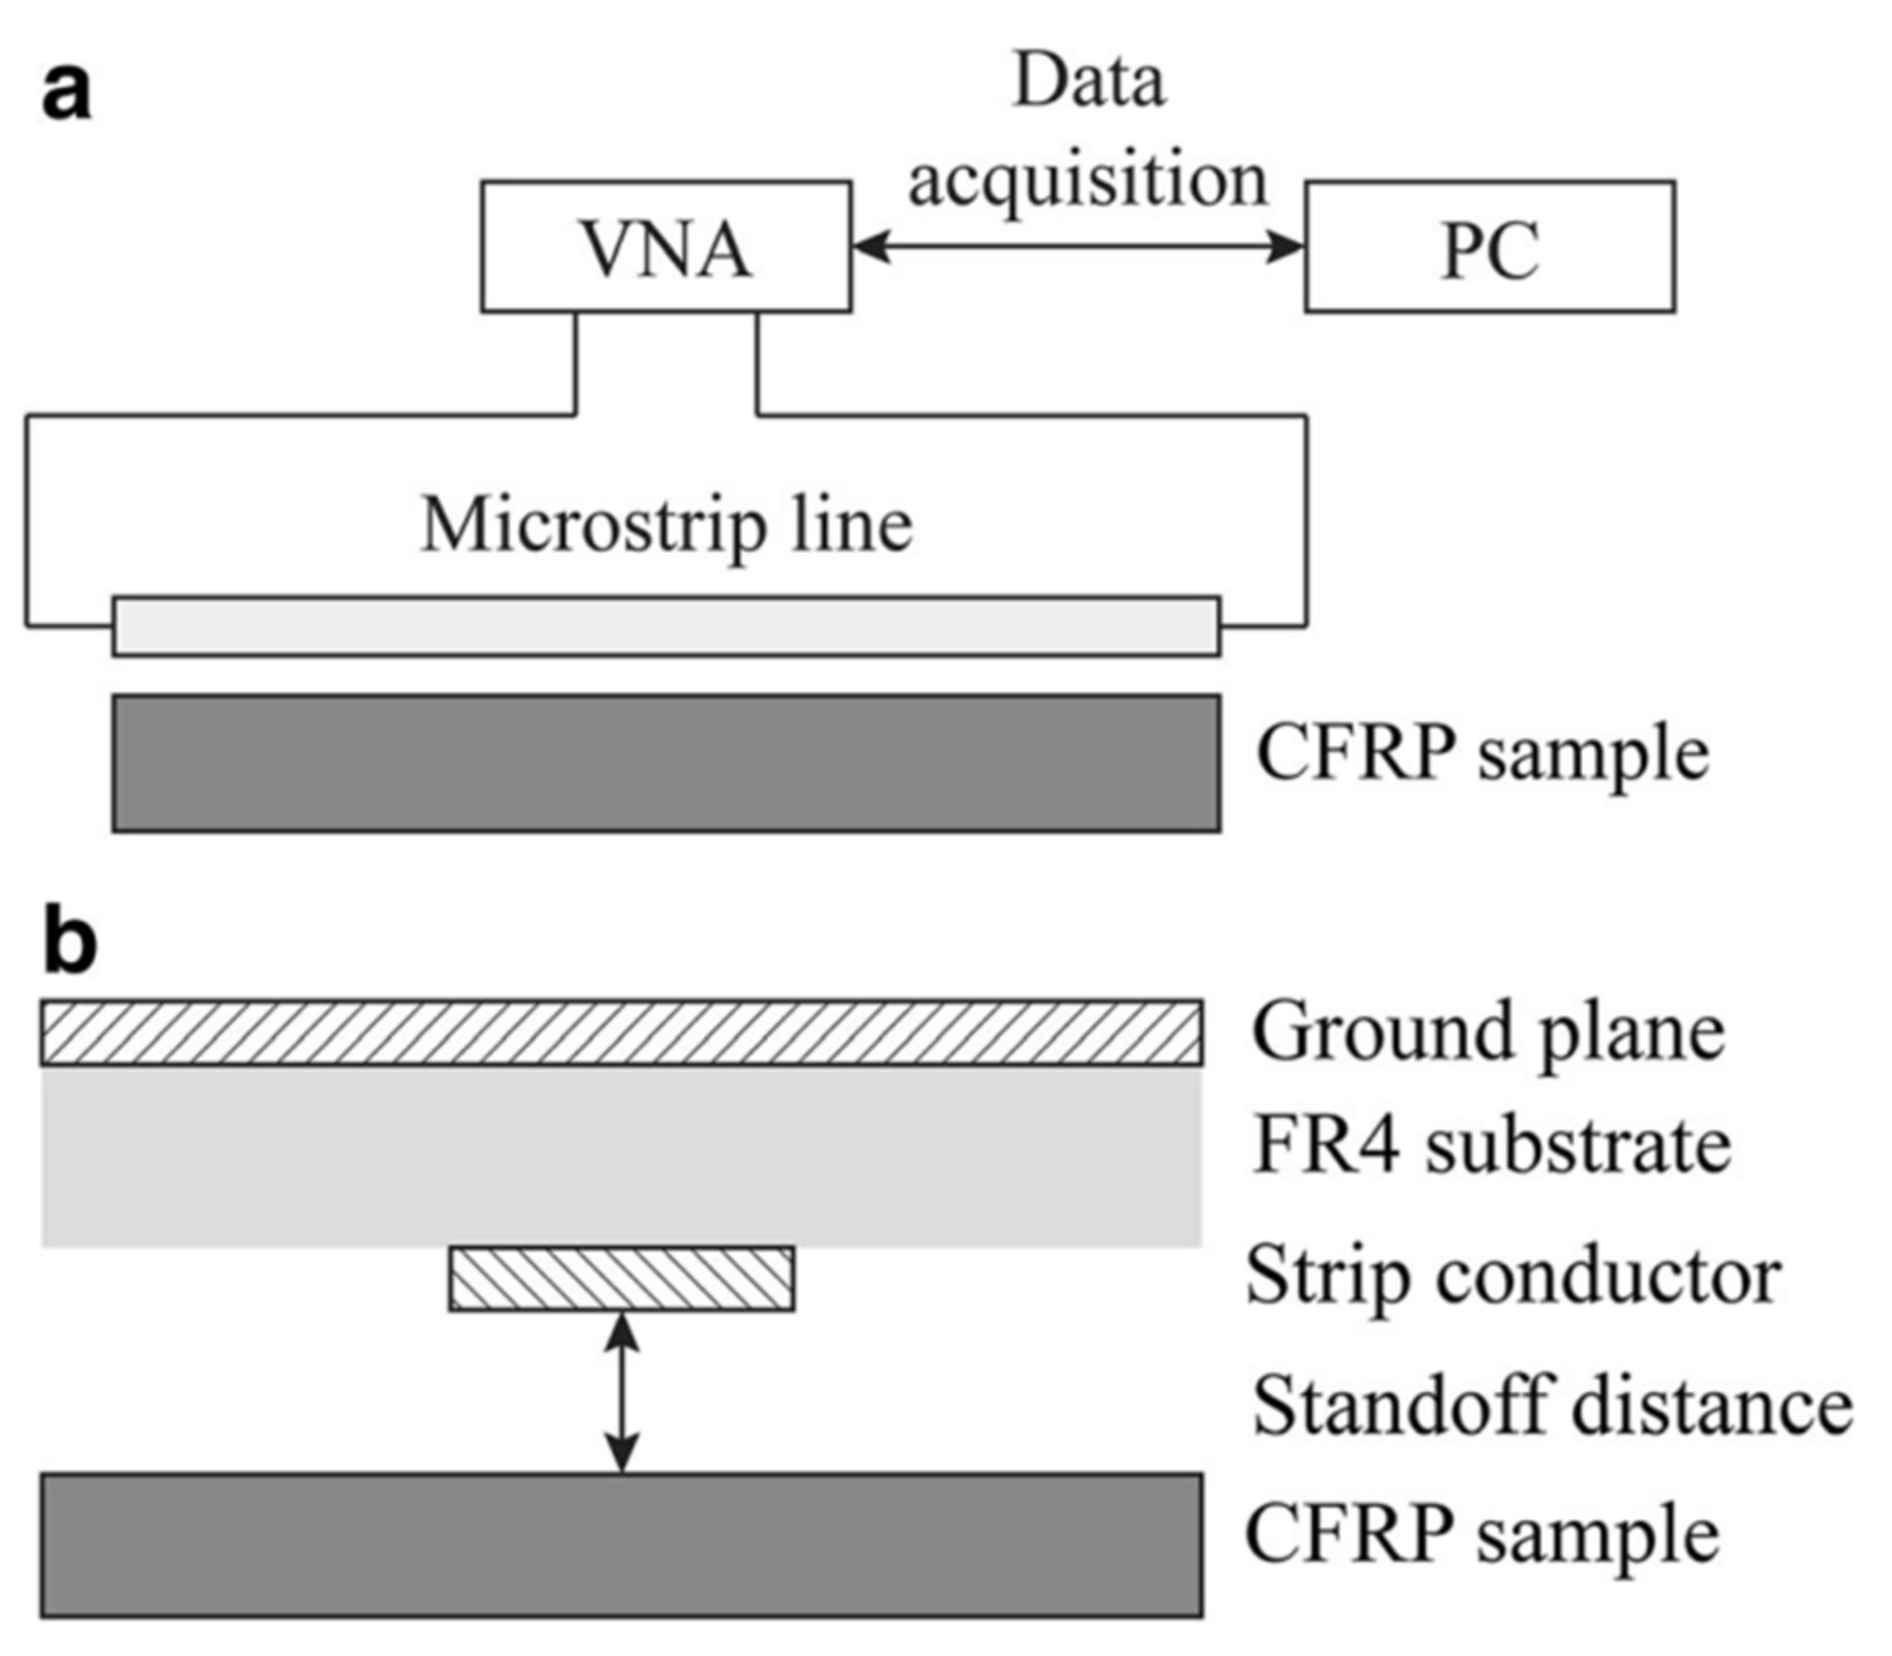
3.1.3. Microwave Transmission Line Sensor

One of the transmission lines being used in microwave NDT is the microwave transmission line sensor. It is being utilized in microwave NDT as presented in [51]. Inspected materials will act as conductive materials for the microwave circuit. The material permittivity will change if and only if any defects exist in the materials. The signals’ responses will be reflected to determine the location and size of the defects. The microwave transmission line is employed to determine the porosity of materials, such as evaluating the purity of honey in maintaining the quality of production as stated in [41]. Moreover, it is also used to ensure food quality and assess specific quality parameters in all food chain links, ranging from processing, distribution, and retail to preparing food. An experiment was done in [42] to show the reliability in detecting foreign objects and showing the sensor technology’s capability to measure fat content in minced meat.
On the other hand, the composite could become a ground plane of a transmission line. Based on [51,52,53], a copper tape as a signal line is placed on the GFRP plate, which acts as a substrate, as shown in Figure 9. This constructed structure is known as the microstrip line under the category of the self-sensing method. The working principle of this method while inspecting the materials is based on changing characteristic impedance whenever any defects exist. According to the reflected signal, the existing defects could be located in the form of a time-domain known as time-domain reflectometry (TDR). As reported, several defects such as delamination lightning strike damage, matric cracks, and fiber breakage could be detected successfully via the aforementioned method. By referring to the testing setup in Figure 9, the dimensions of GFRP and CFRP were the same as both plates were glued together. The copper tape and CFRP that stuck to the GFRP were soldered to a coaxial cable at the end of the transmission line. Due to this scenario, this method does not apply to numerous practical applications since microstrip lines should be bounded to the sample under inspection.
In addition, another work related to the self-sensing method, which is part of a transmission line according to the study conducted by [54]. An independent microstrip line was used on the printed circuit board (PCB) to detect the defects of the materials under inspection via the TDR concept. The detection system setup with a microstrip line sensor is shown in Figure 10. The strip conductor was placed near the surface of the CFRP sample. A new transmission line will be formed when a portion of the electromagnetic field was distributed between the strip conductor and the CFRP sample. The reported measuring system in [54] differs from the measuring system in [51,52,53], where it can be separated from the material under investigation. Moreover, according to the study conducted in [54], the size is smaller than the CFRP sample. Hence, the whole area of the material could be examined by conducting a line scan. A microstrip line was made on the FR4 substrate during testing with a standoff distance of 100 µm. The vector network analyzer (VNA) will generate the microwave signal transmitted towards the material under inspection. After that, time-domain data were obtained from the frequency domain data via the inverse fast Fourier transform (IFFT) [55]. According to the data obtained, the detected defects on the material were represented by the peak in the curve. Whenever there is a defect, the magnitude of the curve at a specific location will be higher than other locations to form a peak.

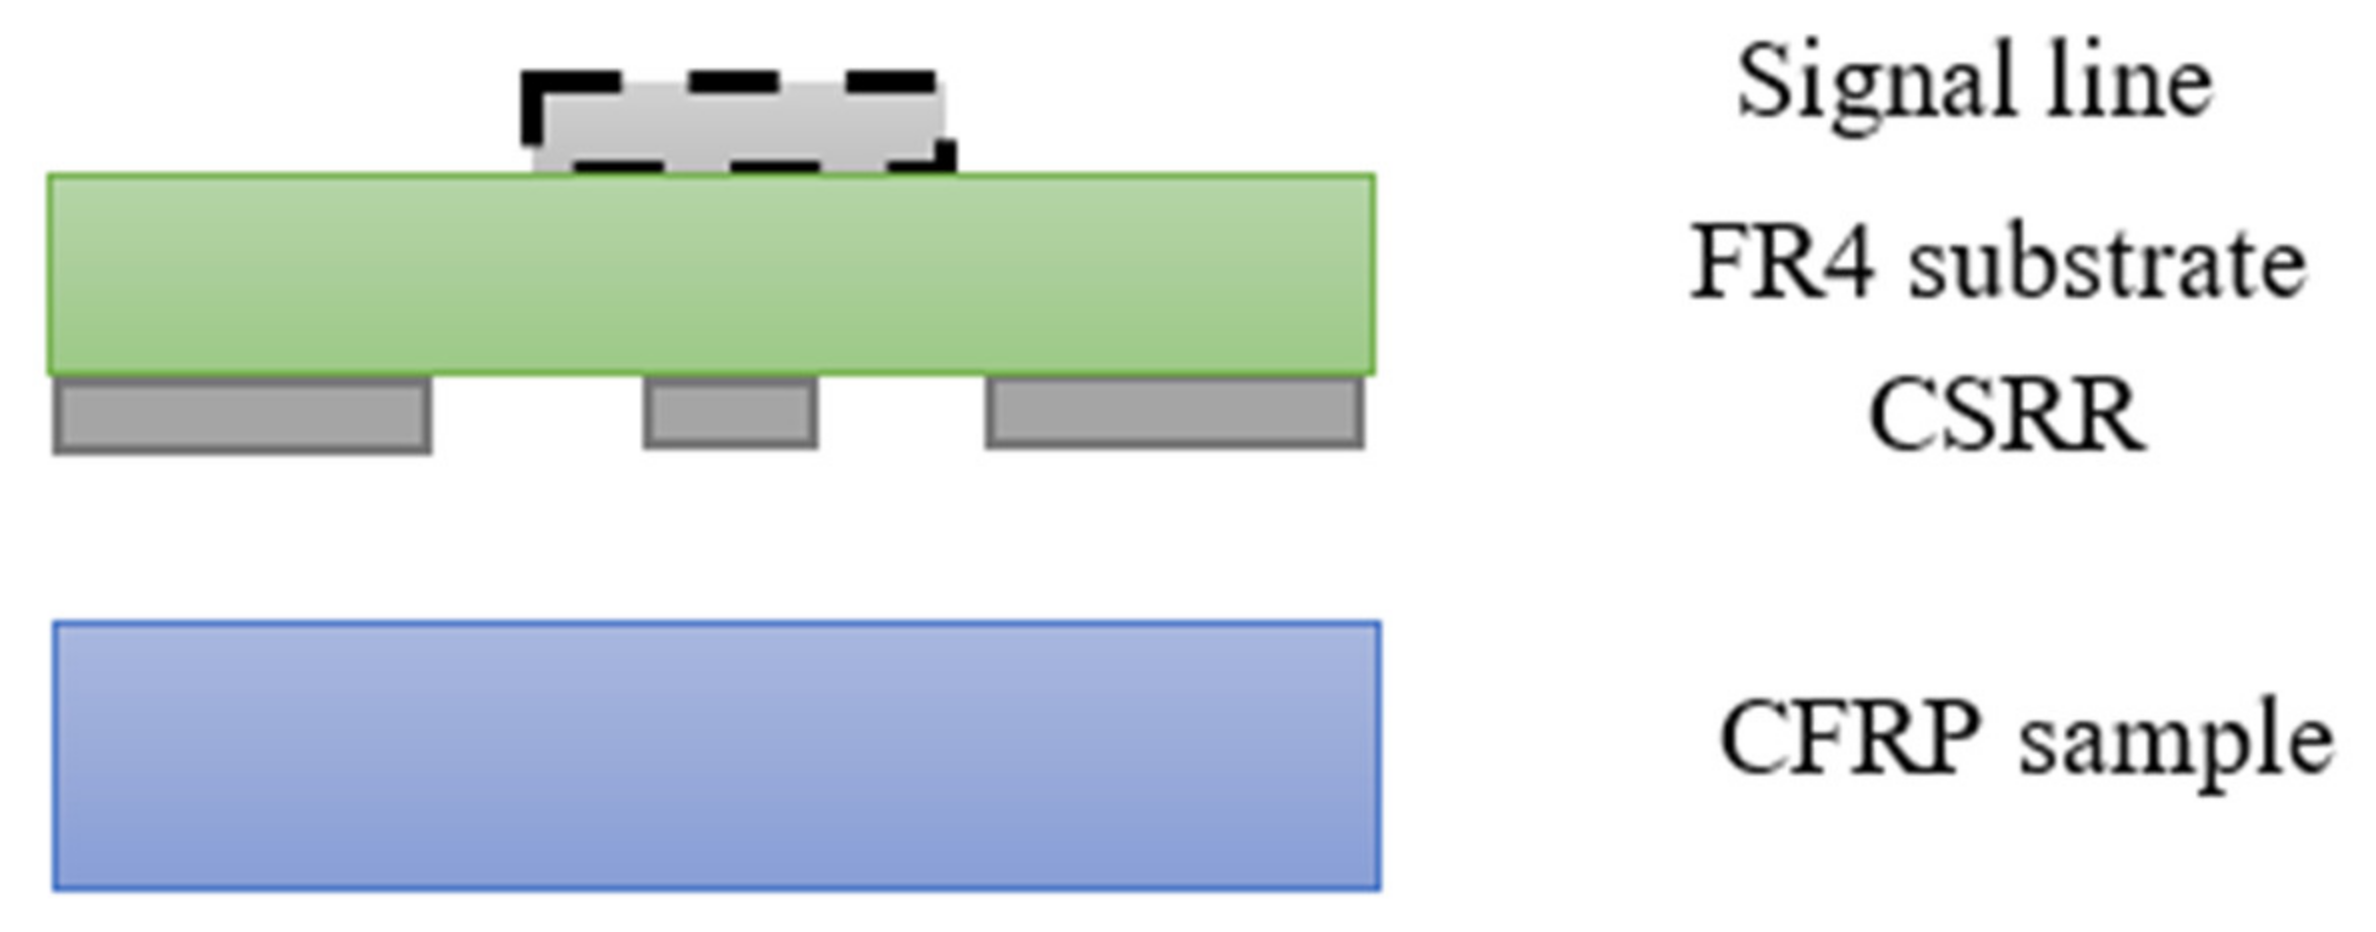
3.1.4. Microwave Planar Resonator

The microwave planar resonator is a method in microwave NDT testing. A complementary split-ring resonator (CSRR) was developed in [43] instead of a resonant cavity. As illustrated in Figure 11, the CSRR was located on the lower side of the FR4 substrate, while the microstrip line was made on the upper side for signal feed. During testing towards the CFRP sample, two coaxial cables connected the HP 3720D VNA (HP Inc., Palo Alto, CA, USA)to the sensor, which was located above the CFRP sample with a standoff distance of 100 µm. The defects in the CFRP sample were detected by measuring the part of the sample without any defects as a reference to the part with defects. According to the results obtained, the resonant frequency shifts if and only if any defects exist.

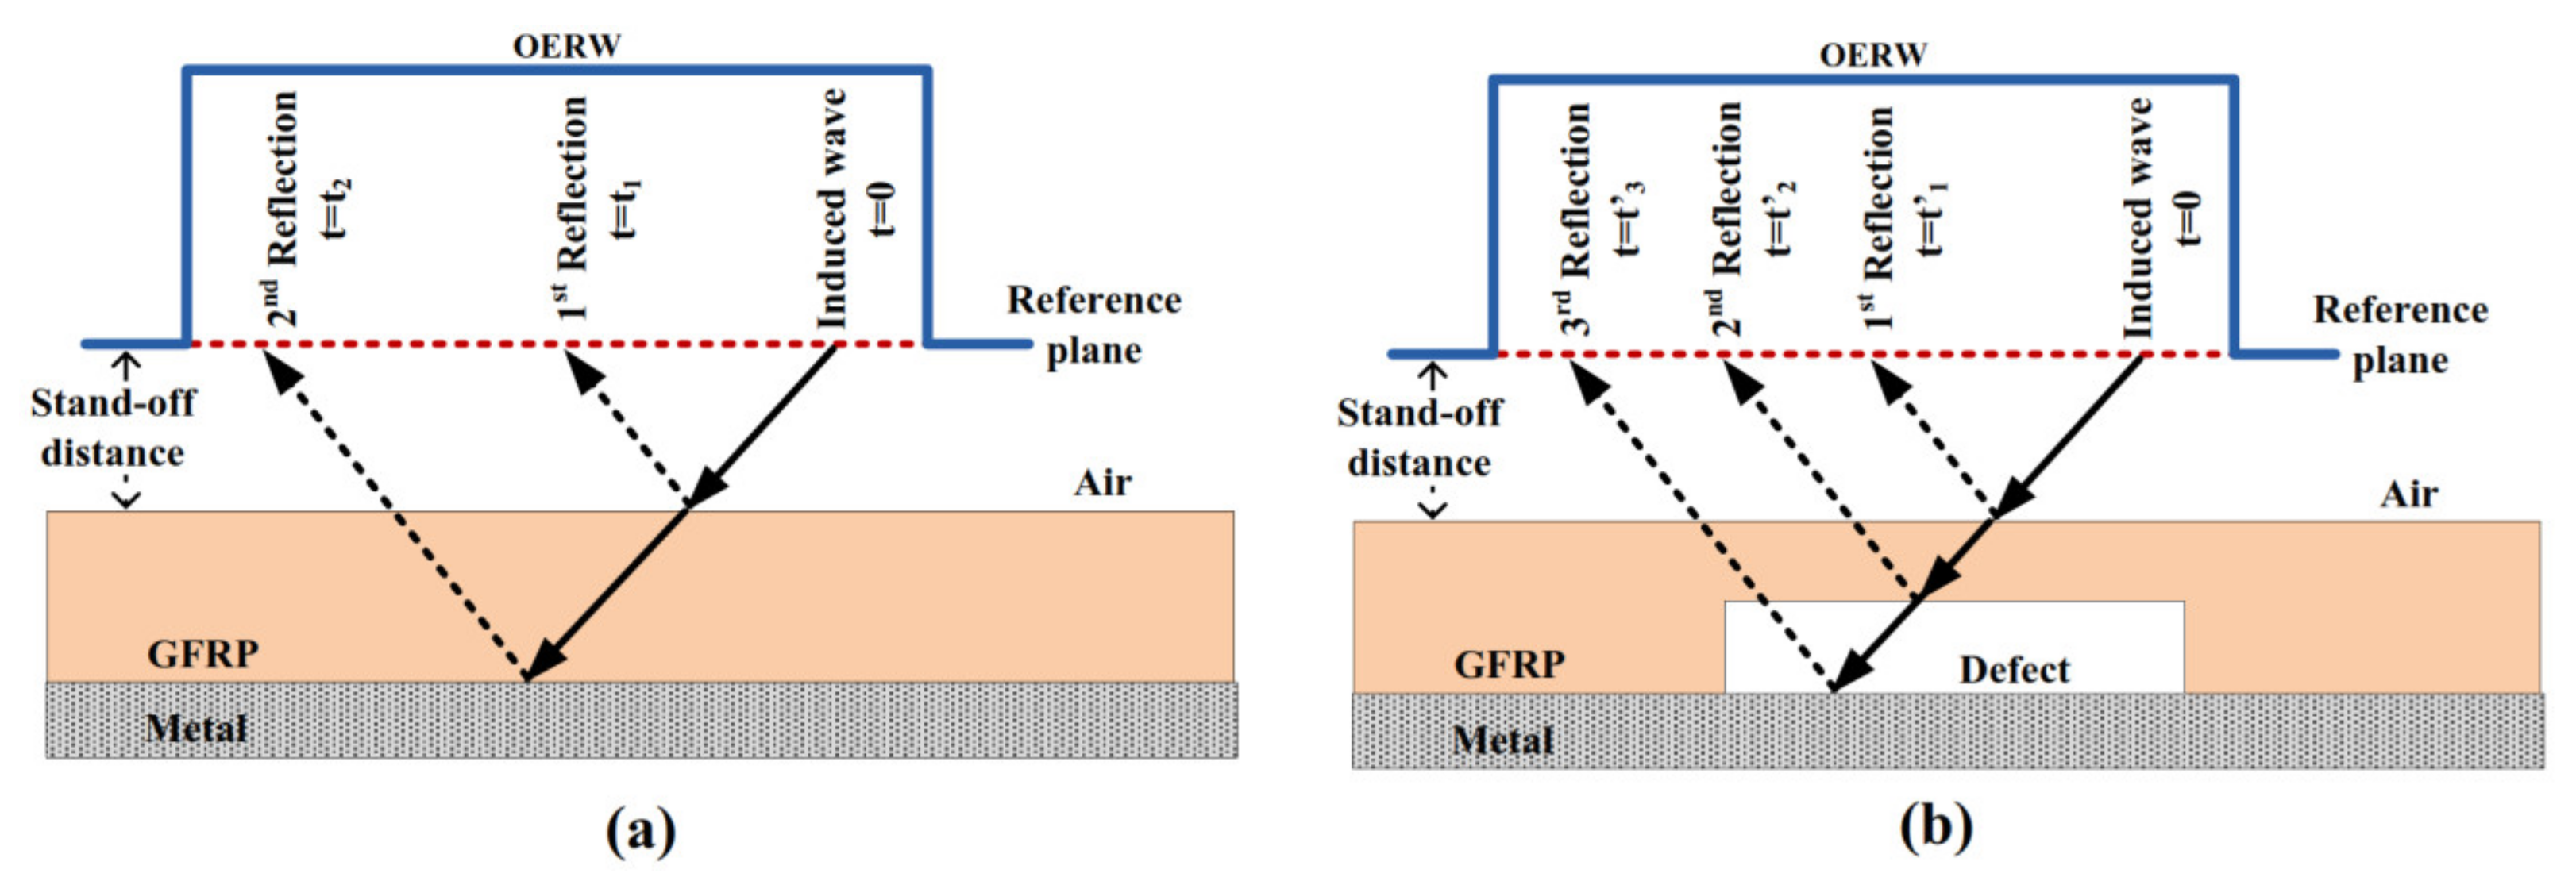
3.1.5. Microwave Open-Ended Waveguide

Microwave open-ended waveguide imaging is another method in microwave NDT testing [10,44]. Two types of probes are used in microwave open-ended waveguide imaging: open-ended coaxial probes and open-ended rectangular waveguide probes. Among these probes, open-ended coaxial probes are the most popular as compared to open-ended rectangular waveguide probes. However, various coaxial probes with different diameters might be selected at a maximum frequency of operation, 50 GHz. On the other hand, there is no frequency limit for open-ended rectangular waveguide probes at 50 GHz and up to 300 GHz. The inspection of this method refers to one-port measurement. The detection via this method involves placing the probe above, on, or immersed in the materials under inspection. This could be contact or contactless measurement of the materials. Contact measurement is only applicable for laminar solid, power, or liquid, while contactless measurement is only applicable for liquid or powder [36].
Under the inspection of open-ended waveguides, the current will be induced in the conductive materials under inspection. Therefore, defects such as cracks could be detected easily based on the magnitude or phase information of the reflection coefficient, S11 acquired from a vector network analyzer (VNA). There are different types of open-ended waveguides according to their operating frequency. The higher the operating frequency, the smaller the size of the waveguide. Also, the spatial resolution of the inspection depends on the size of the waveguide [32].
Figure 12 shows the propagation of microwaves through the materials under inspection. Initially, the thickness of defects under insulation is estimated by TDR according to the time of receiving the reflected wave [57,58]. This method is based on the speed of the wave travelling in the medium, which is the speed of light under the same conditions. By this, two reflections will be obtained at different times if there are no defects in the materials. However, three reflections will be obtained at different times if and only if there are defects in the materials [59]. A comparison between the time taken for the second and third reflected wave to be received by the microwave open-ended waveguide imaging was made to estimate the depth/size of the defects. The larger the differences between the time taken between the second and third reflected wave to be received, the larger the depth/size of the defects.

3.1.6. Horn Antenna

Horn Antenna was used together with the vector network analyzer (VNA) to form a microwave imaging system in inspecting the reinforced concrete blocks [42,60]. During the process of inspection, electromagnetic waves will travel through the concrete. At the path of travelling, the waveform and electric field intensity could be varied by altering the geometry and electromagnetic characteristics of the medium. The received signal will be analyzed to determine the distribution of rebar steels in the concretes. In order to improve the efficiency of signal penetration, a lower frequency of the microwave signal in the range of 800 until 4500 MHz is required. Hence, a vector network analyzer will be used to transmit the ultra-wideband stepped frequency signal. The selection of this frequency is based on comparing the reflection data of the reinforcement in the concretes. Then, the original data will be used to find the sensitive bands.
In [45], the design and simulation of pyramidal horn antenna were presented for NDT applications, such as detecting cracks in different materials. The designed pyramidal horn antenna works in the microwave domain with an operating frequency of 4.7 GHz and a gain of 12.90 dB. During NDT, the designed pyramidal horn antenna was made to face the material under inspection, such as aluminium, as stated in the paper with a few millimetres of distance. A comparison of the characteristics of the antenna was made by using a sample with and without defects. The sample used in [45] were FR4-epoxy and aluminium. Based on the results of the FR4-epoxy, the return loss is more negative and operating at a lower frequency for FR4 epoxy with defects compared to the FR4-epoxy without defects. On the other hand, the return loss for aluminium is less negative and operating at a lower frequency than aluminium without defects. This shows the importance of comparing the results with and without defects towards the materials. With this step, the defects that exist in the materials can be analyzed easily.

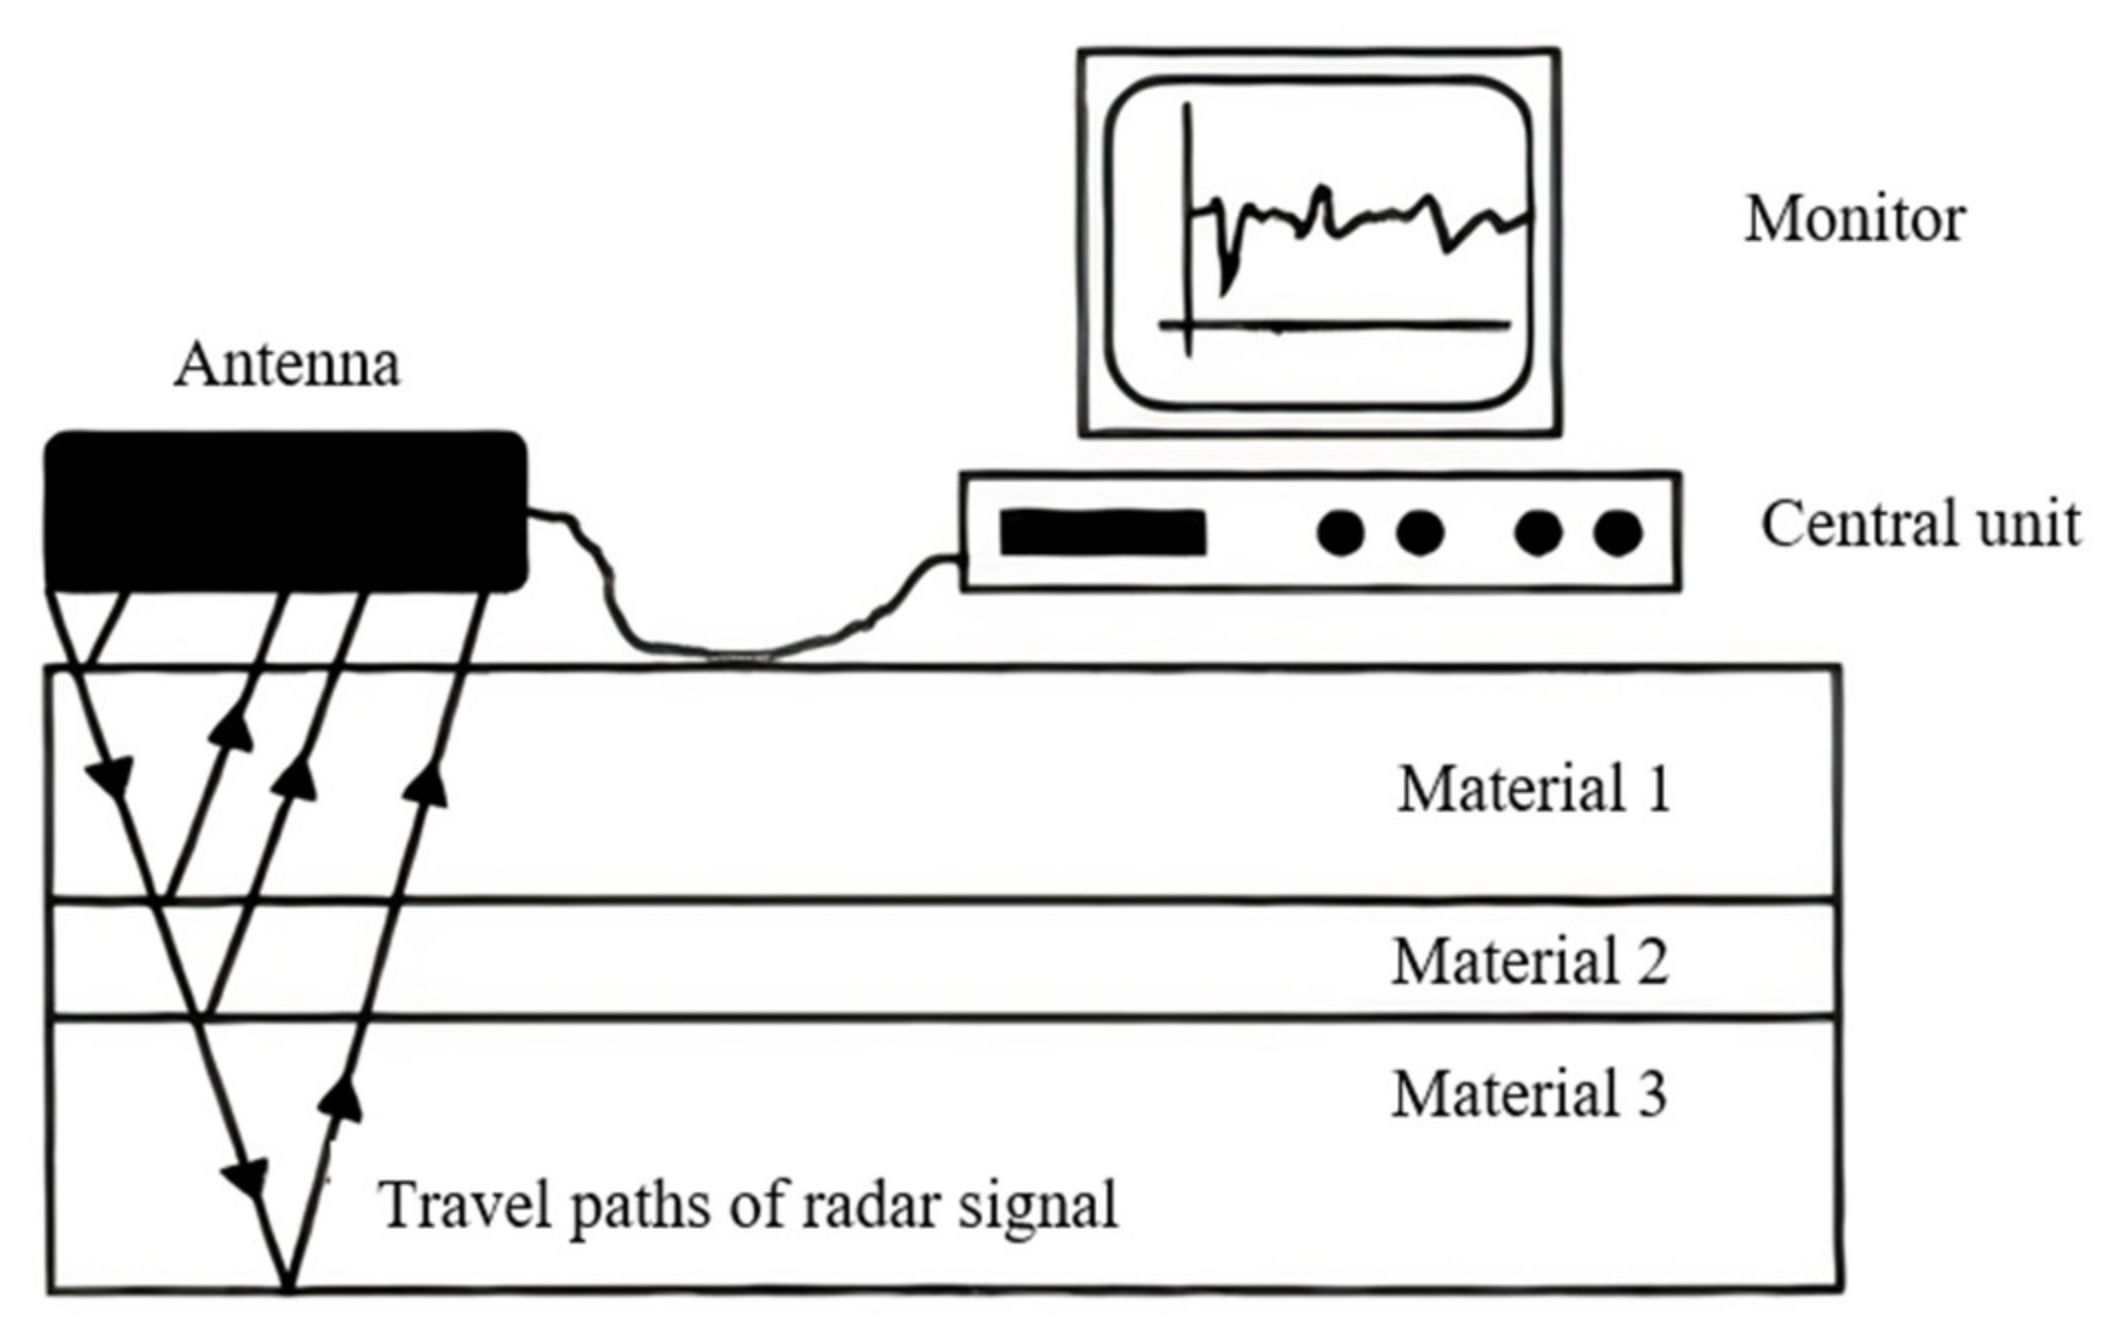
3.1.7. Ground-Penetrating Radar (GPR)

Ground-penetrating radar (GPR) is a subsurface imaging technology method of NDT where the electromagnetic wave, typically in the 1–1000 MHz frequency range will transmit into the material under investigation [61]. The basic principles of radar wave propagation, reflection, and transmission were employed while investigating the material. According to [62], the electromagnetic wave will reflect at interfaces and objects within the material. Analysis of the results obtained will be useful in determining the location and depth of the detected interfaces and buried objects. There are two basic types of radar wave such as pulse and continuous wave. Based on the method of NDT discussed, pulse radar waves are employed to investigate the material as it will transmit a burst of radar energy and the echoes will be reflected back to the same antenna. The short pulse radar waves will propagate through the layers of material which is under investigation. Figure 13 shows the principle of GPR where the sensor and software pulse EEKO100 GPR system with an antenna for transmission and reception of electromagnetic waves is connected to the computer [63]. A structure with three different materials is used to study the principle of GPR. The signal of GPR is emitted via an antenna. Reflection of signals is happening at the interfaces between the materials and interfaces with the surrounding medium. Receiving the reflected signals by the same antenna represents one scan. The process is repeated to obtain several scans at different locations of the structure for analyzing purposes.
Several studies have been reported on using GPR for NDT purposes [64,65,66]. Based on [47], GPR is used to check the condition of reinforced concrete structures of bridge decks. Another work [67] stated that almost 90% of the concrete, reinforced, or pre-stressed inspections were undertaken via GPR. The main kinds of the structure under this method of investigation are bridges, structural buildings, and tunnels as GPR has the benefits of fast data acquisition and high reflectivity on different kinds of reinforcement elements. With that, the GPR method is highly recommended to be applied in reinforcement detection and joint detection. Reinforcement detection involves investigating the depth position of reinforcement, moisture content of concrete [68], and GPR mid-frequency. Joist detection involves the investigation of the size of the joist. In addition, Giamou et al. have shown that concrete imaging investigation at the Clinton Power Station, south of Chicago, Illinois [69], via the GPR method with a lower intrusion and disruption to the operation of the nuclear plant. The objective of the investigation was to observe the spatial location and depth of all embedded reinforcement bars and conduits (1.8 m × 3 m) before the new crane hoist installation. The GPR method was chosen in the project as it has higher scanning speed within a large scanning area with immediate onsite results. Besides, a higher resolution of data would be another benefit of using the GPR method to enable the definition of embedded structural elements. In the study, the processed radar data for the six grid was pieced together for the depth slice from 75 to 100 mm below the floor surface. Accurate grid registration and careful data acquisition were done by matching from grid to grid. This makes interpretation of the location of the intersecting beams easy. On the other hand, another work of identifying early cracking in cement concrete pavement with the combination method of GPR and computational modeling was reported in [70]. This was done by an experimental and numerical approach. The reported work aimed to allow early identification of pavement cracks, reducing life cycle and decreasing life circulation comfort. An early maintenance process would help reduce the life-cycle cost and increase the pavement life.
Furthermore, another experimental study on an improved joint detection technique for concrete structure using two techniques such as GPR and sensing pre-stressed concrete multivariate analysis of transcript splicing (SPC-MATS) was presented in [46]. A joint application using the aforementioned two NDT techniques was undertaken to inspect the concrete construction, which usually focuses on the internal void defects of grooved pipe in pre-stressed concrete structures. By focusing on the GPR method, this was applied in the experimental study to obtain the information from the interior structure of the concrete to determine the location of an anomaly. This technique demonstrated clearly its sustainability in detecting the anomalies via the attenuation or the scattering of the GPR signal.
In short, GPR is one of the NDT methods providing a faster and continuous measurement tool in investigating concrete structures. Utilization of this method could help to improve the safety of the workers and checking time. Moreover, it could also help improve the speed of decision-making according to the results given by the GPR method [61]. Nevertheless, data processing will take longer, and it is complex to analyze due to irregular geological interface. Besides, interpretation of GPR data will be difficult when there are any unexpected causes such as uncontrolled fill or previous excavations [71].

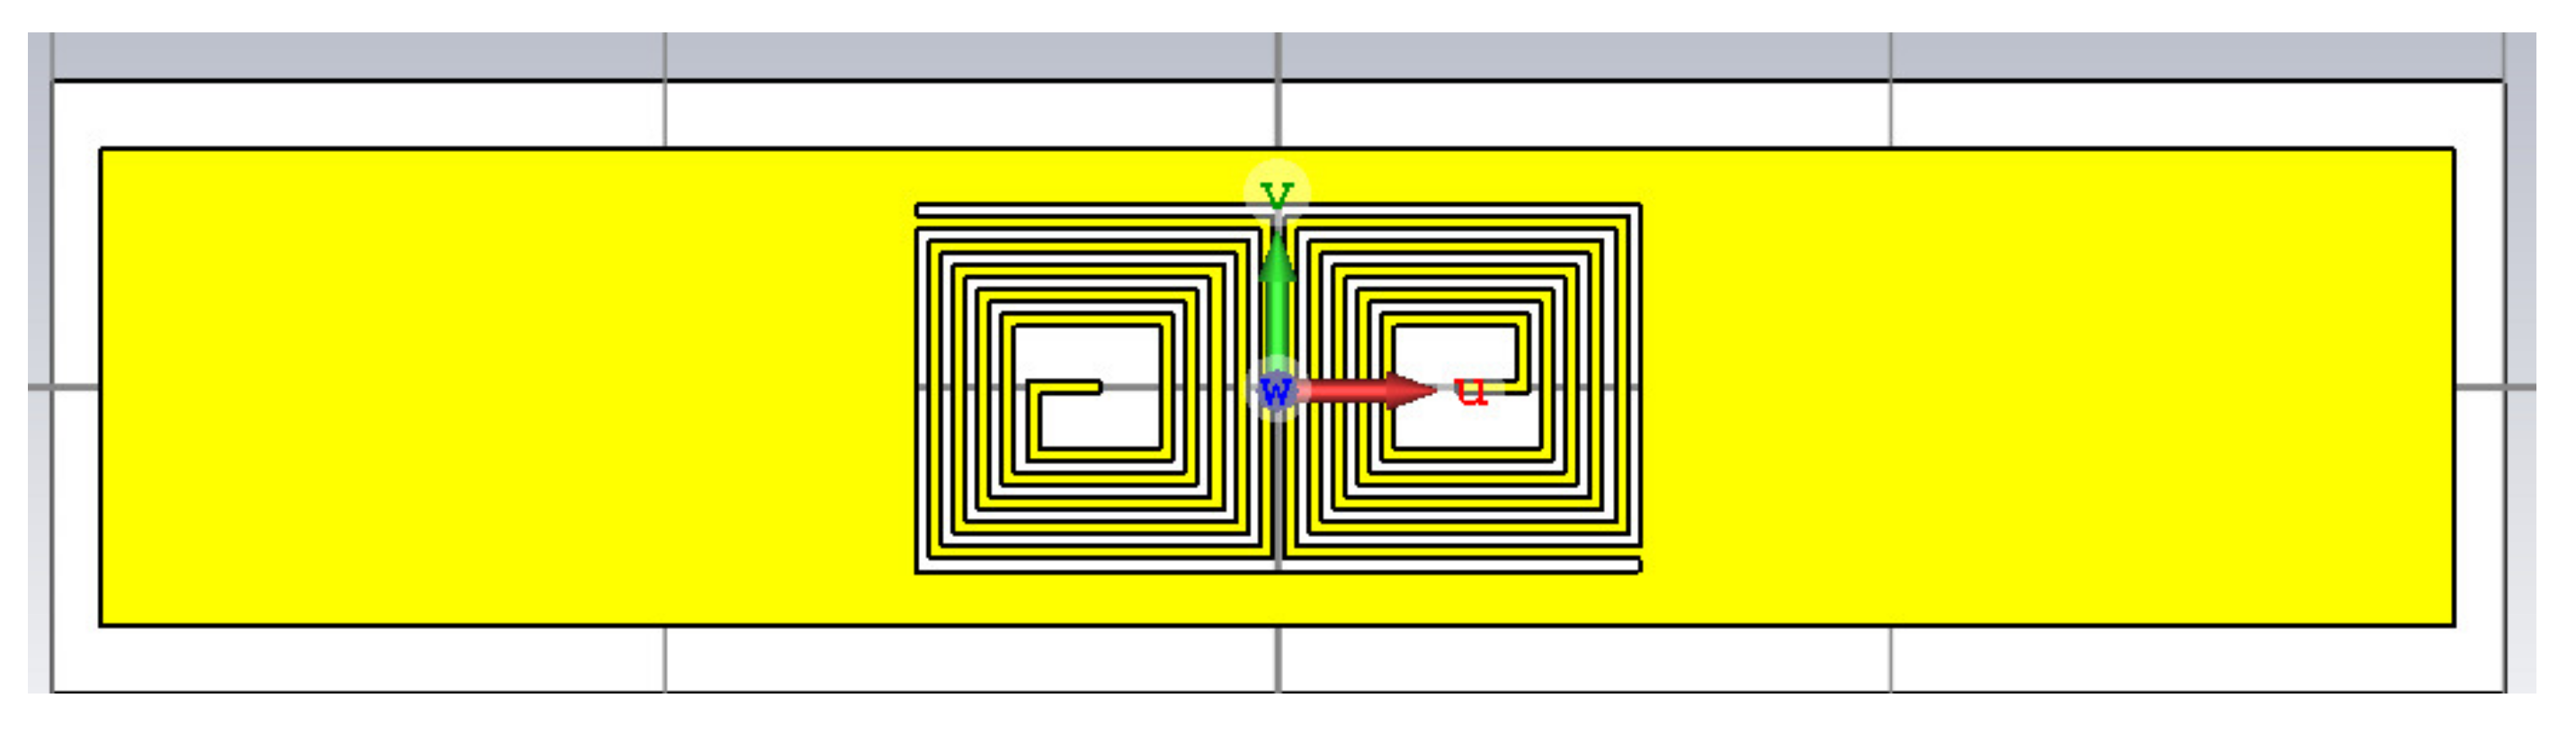
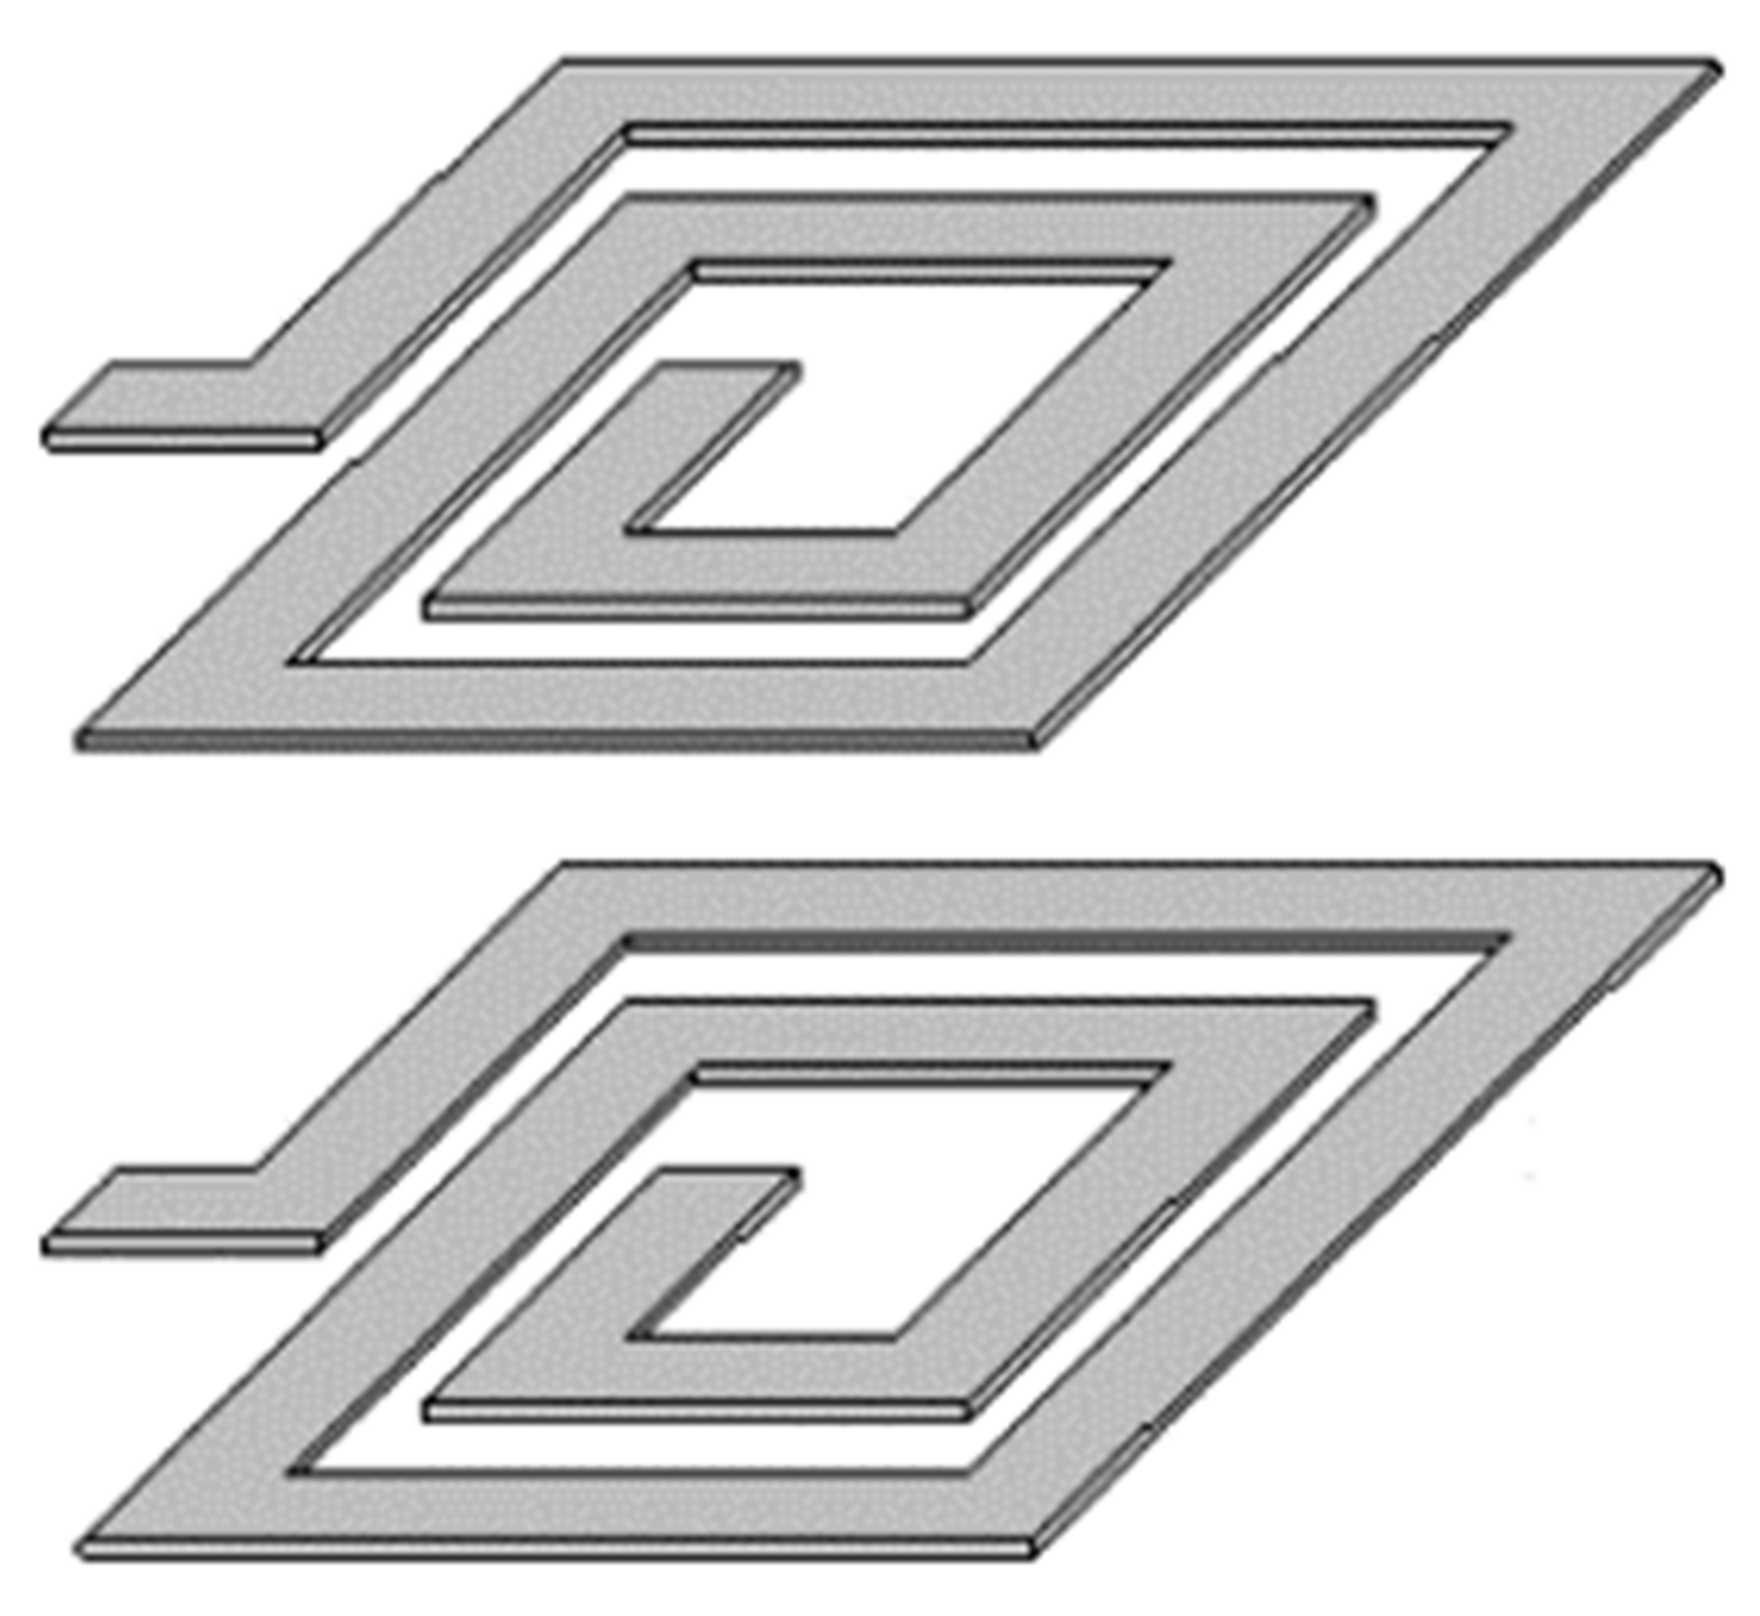
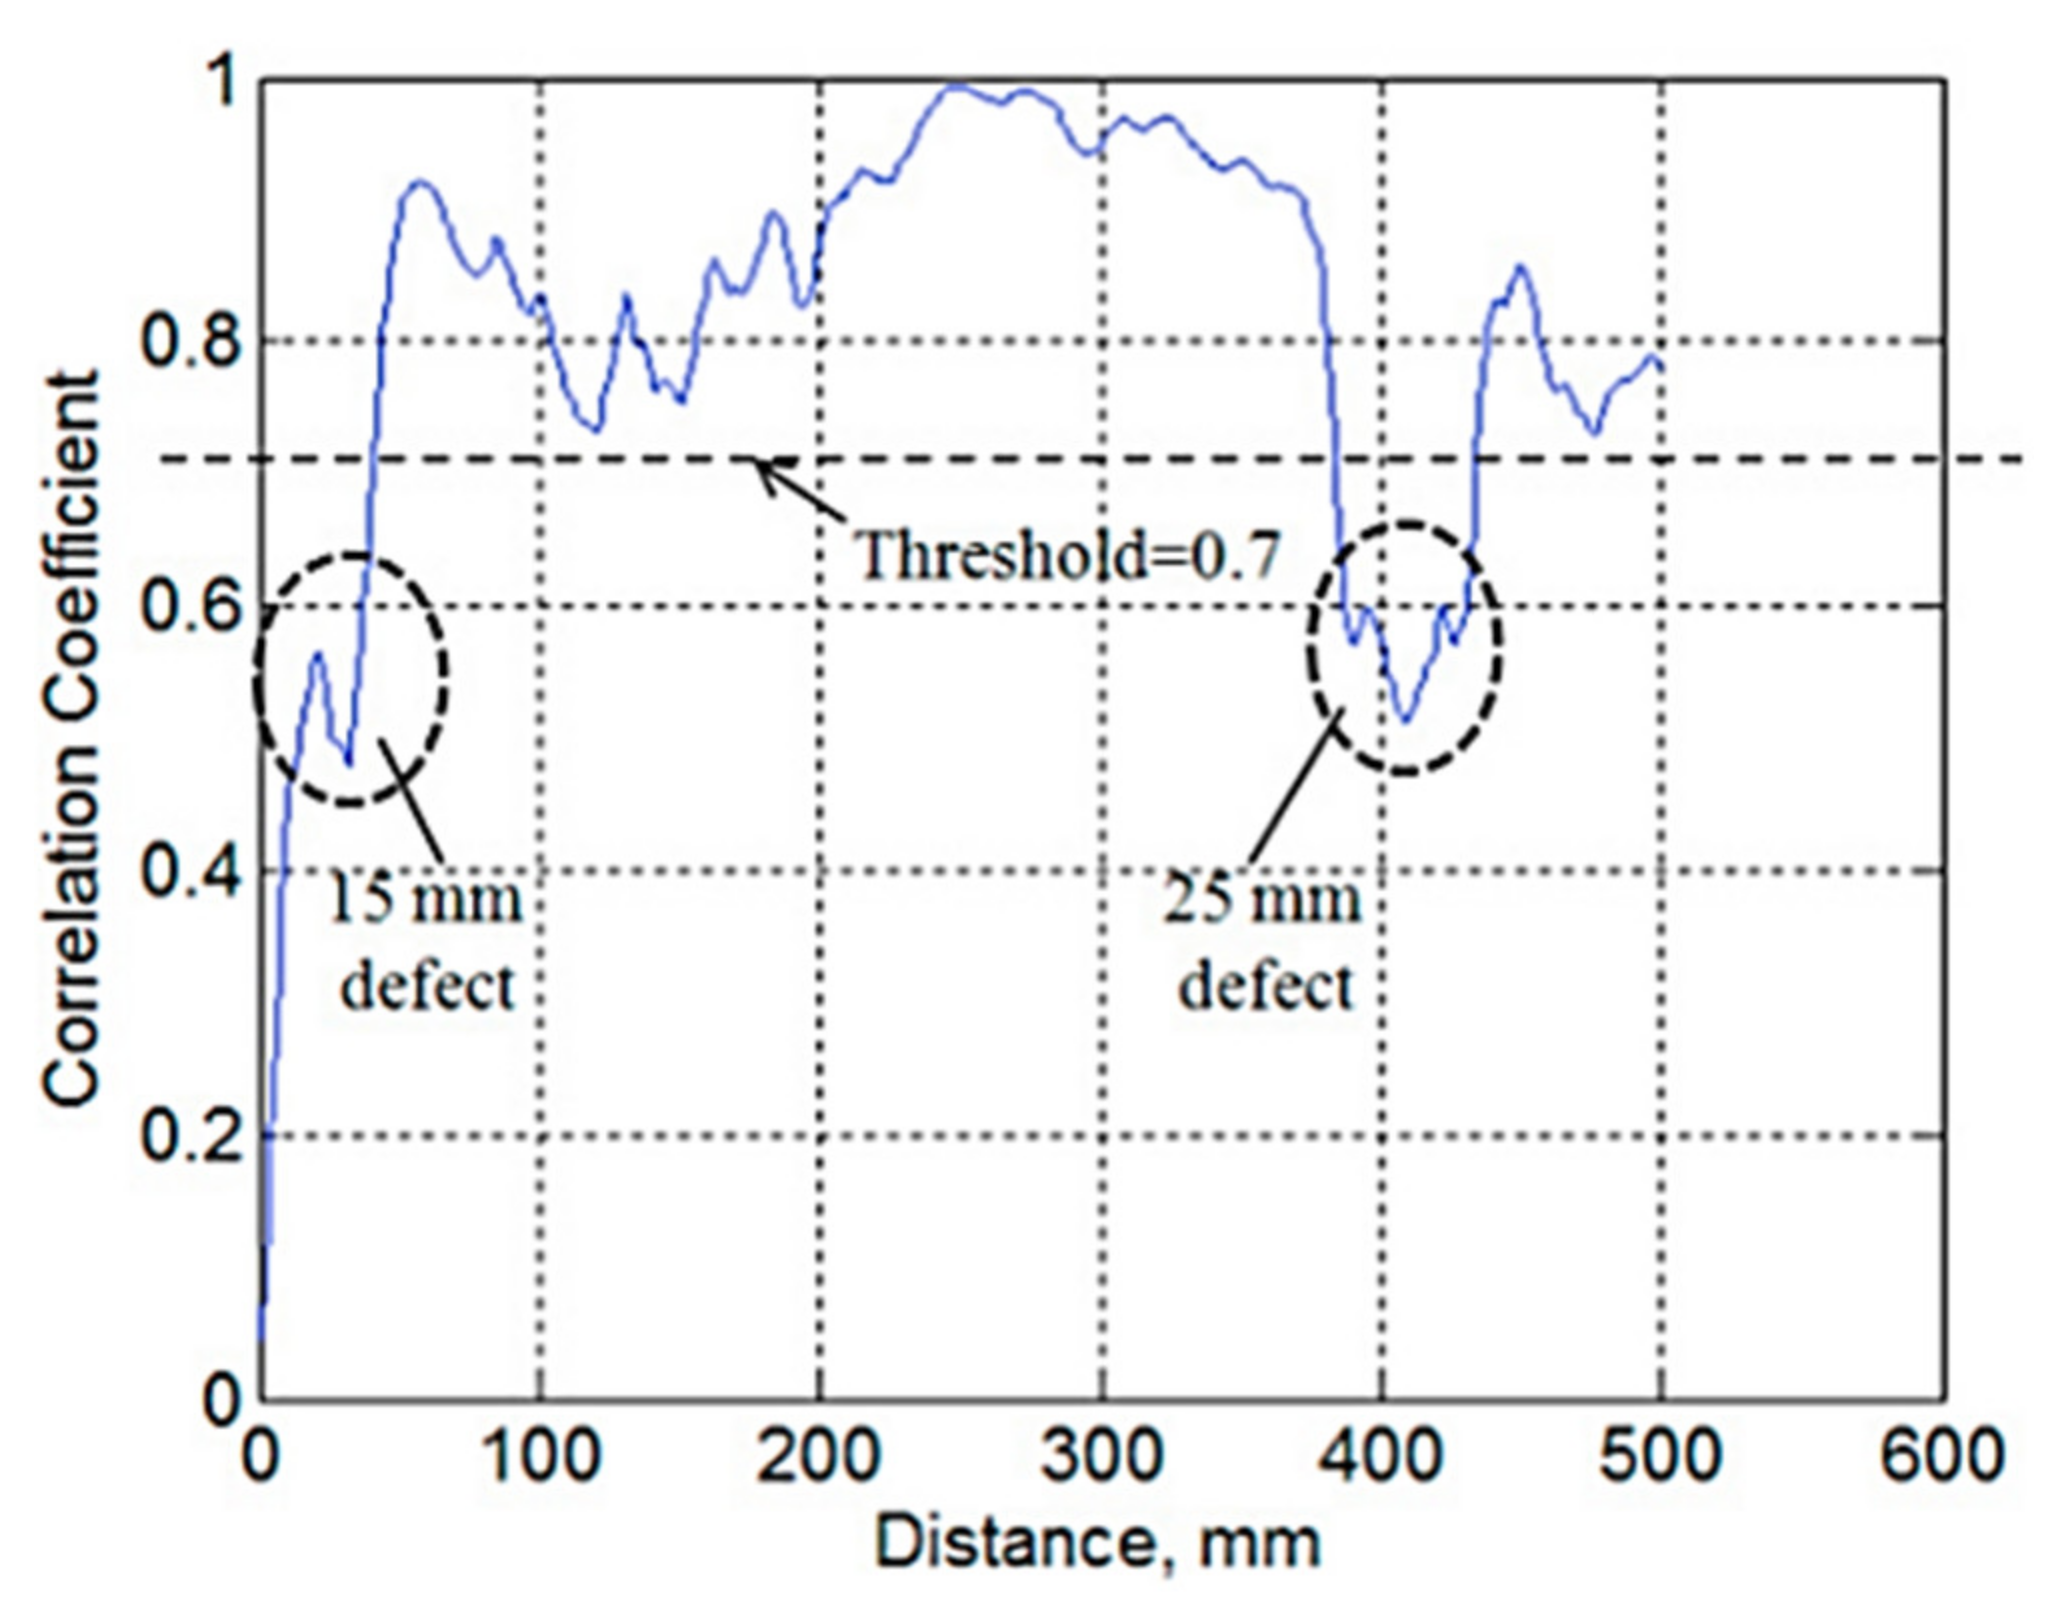
3.1.8. Couple Spiral Inductors (CSI)

Couple spiral inductors (CSI) are another form of designed probe popular for microwave nondestructive testing. These are constructed by primary and secondary coils forming two spiral inductors. The principle applied in this sensor is the measurement of the transmitted energy from the secondary coil to the primary coil. This might be affected by the variation of the thickness of the materials under inspection [11]. Normally, the operating frequency of CSI is basically from 10 to 500 MHz, and it is known as an RF NDT sensor. However, the sensor’s operating frequency could also increase up to 5.5 GHz depending on the application, such as on-chip spiral inductors as described in [48]. Several types of defects could be examined by CSI, such as cracks, porosity, and delamination. The images of the defects provided by CSI are better as compared to other conventional NDT methods such as ultrasonic testing [32]. The image of the detected defects is related to the terms of the spatial resolution of CSI and is better than ultrasonic testing. Spatial resolution is the ability of the methods in separating the defects which are close to each other [72]. The sensor is mounted on the XYZ scanning stage for the experimental setup and connected to the vector network analyzer (VNA) connected to the computer. Moreover, the computer is connected to the PIC18C452 microchip microcontroller for data acquisition and precise movement control [32].
Several orientations of couple spiral inductors can be organized, such as planar coupling between two side-by-side spiral inductors on the same metal layer and vertical coupling of two spiral inductors as shown in Figure 14 and Figure 15, respectively [48]. Planar coupling of spiral inductors is usually fabricated on the underside of the PCB. Two-port sensing devices are made as the inductor connected to a coplanar transmission line on the top side. Several parameters such as couple spiral inductors’ geometry like several turns of the coils, frequency, and standoff distance are considered in estimating the sensitivity of the transmission coefficient of the sensor. The principle used in defects detection is based on the scattering transmission coefficient, S12, which indicates the transmission of relative power from the primary spiral to the secondary spiral as S12 has a greater signal-to-noise ratio than the other S-parameters. Whenever any defects exist in the materials under inspection, they disturb the coupling and perturb the transmission coefficient to enable detection and evaluation. In other words, the transmission coefficient will change when the coupling region is interacting with a groove where the coupling region will start to move across and leave the boundaries of the groove [72]. The vertical coupling of two spiral inductors is constructed by overlapping two identical spirals. This configuration of spiral inductors is robust which could be used as an on-chip transformer [48].
According to a sensitivity graph, the curve will rise with the movement of the coupling center until it arrives at the left boundaries of the groove. Then, if any defects exist, it will influence the coupling and cause it to become prominent gradually at that moment. Meanwhile, the sensitivity value will stabilize until the center comes to the right of the groove. Then, the sensitivity will reduce to zero as the sensitivity of the transmission coefficient drops due to the center moving away from the groove. Overall, there are three stages experienced by the sensitivity curve while the sensor is scanning through the groove, which are increasing, temporarily stable, and decreasing [72].
As mentioned in [72], some developments have been applied to improve the sensitivity performance of CSI. The idea of improvement was obtained from the well-established PCB transformer, where a ferrite sheet was placed on the top side of the transformer to reduce the magnetic circuit’s reluctance. However, the ferrite sheet was applied to the coils of the CSI for shielding purposes and the magnetic field concentration.
According to the study conducted in [49], several types of defects were being used in CSI detection under RF C-scans, such as holes, cracks, delamination, and voids. There were certain frequency values for the defects to be seen clearly, and they will disappear when the frequency was at any other values. Different types of defects will require different frequency values to be observed clearly. For example, an oblique void could be observed clearly below frequency values of 150 MHz but quickly disappears with the increase of frequency.

3.2. Signal Processing Development

Conventional NDT techniques, as discussed in previous sections, face several challenges such as automation complexity, low quality of the spatial image and blurred defect shape, extensive data interpretation, and difficult defect detection due to penetration limitation. In addition, reducing the dependency on the skills and experience of operators has become a necessity for reducing the cost of the NDT process. Signal processing using artificial intelligence (AI) could be considered the best approach to meet all the aforementioned challenges and is illustrated in the next subsection. Using AI could also increase the sensibility of defect detection and improve the possibility of fully automating the monitoring procedure [73].
Signal processing employed in NDT techniques usually undergoes four stages: preprocessing, feature extraction, feature reduction, and classification. The post-processing stage is the stage that eliminates noise effects and unnecessary data. Feature extraction is the process that extracts the most important features for defects analysis. This process is normally related to features selection which selects the most important features for defects analysis. Finally, the classification stage process is responsible for classifying and estimating the defects based on their characteristics [11].
Post-processing could be regarded as the most important stage in the signal processing algorithm since it entails removing undesired signal components, such as noise. In other words, this stage is to enhance the signal-to-noise ratio (SNR). The greyscale conversion process is involved in this stage as the edge detectors in the spatial frequency domain are usually performed in grayscale images that require conversion [74]. There are several techniques to improve SNR as discussed in [75], such as cross-correlation, Hilbert Huang transform (HHT), autoregressive analysis, wavelet transform (WT), and others. The methods of testing discussed in [75] were based on ultrasonic signal processing methods. The signal processing reported here relies on the cross-correlation method, based on calculating the similarity degrees between two signals. The output of the cross-correlation operation will be maximum if the two signals are almost similar to each other or opposite; the cross-correlation operation will be minimum if the two signals are different from each other. From here, the received signal could be used to compare with the reference signal (reflected signal at defect-free region) in extracting the information from dispersive wave modes or change the signal waveform due to delay and scattering. According to the analysis undertaken, there are two steps to be completed in cross-correlation analysis. First, the cross-correlation between the reference signal and the full signal obtained from the full inspection of the materials needs to be completed to estimate the normalized cross-correlation coefficients. Next, cross-correlation was performed along with a 10-point moving average filter to estimate the delay time between flights’ time of reference signal and the full signal obtained from the full inspection of the materials. The defected region will result in a longer delay as compared to defect-free regions. Figure 16 and Figure 17 show the defect detection in the materials by using the cross-correlation method.
HHT is another method used to improve SNR during NDT testing. This method combines two different signal processing techniques: Hilbert transform (HT) and empirical mode decomposition (EMD). Each method gives different functions in the signal process, where EMD will decompose the analyzed signal into various intrinsic mode functions (IMFs) while HT calculates individual frequencies. By referring to the example of ultrasonic testing in [75], the decomposed ultrasonic signal could be represented in either amplitude distribution or local energy in a time-frequency plane. This representation is very important for information extraction, followed by further processing as the results were different between the defect-free region and the defect region. A comparison between HHT, Fourier transform (FT), and wavelet transform (WT) was undertaken in the same study. The results proved the superiority of HHT over the other methods in terms of its applicability to linear and non-linear transient signals. Analysis using the Hilbert–Huang method showed that the defect-free region would have a shorter approximate time of arrival of the first IMF than the defective region. As shown in Figure 18, the larger the defect, the longer the approximate time of arrival of the first IMF.
The last technique to be discussed is WT, which is the most popular technique used to suppress the noise in the signals to increase defect detection accuracy. This method decomposes the signals into preliminary signals called wavelets. Each of the wavelet coefficients consists of signals and noise in the time-frequency domain. Therefore, the noise that exists in the wavelet could be reduced by manipulating the wavelet coefficients. Two approaches could be used to remove the unwanted wavelet coefficients, namely soft-or-hard threshold and discrete wavelet transform (DWT). However, due to the inefficiency of the former approach with correlated noise, the DWT approach is usually used for increasing the SNR during the signal processing phase.
The following stage is feature extraction and selection, which selects the only relevant features that differentiate the signal in the feature space. The purpose of this stage is to reduce the unwanted data without losing the desired information by reducing the dimensionality of input data to improve the performance and computational efficiency with a series of additional and appropriate transforms. Several transforms have been proposed for feature extraction methods such as Karhunen–Loeve transform, singular value decomposition, discrete Fourier transform, discrete cosine transform, Haar transform, and discrete wavelet transform. Each of the transforms has its advantages and disadvantages. Among the aforementioned transforms, the Haar transform is considered the best in energy packing efficiency, although wavelet transform could also be good to improve the energy packing efficiency if and only if a proper mother wavelet is chosen. Moreover, wavelet transformation also has a better localization property. Overall, it is used to find the moment when an abrupt change occurred in the frequency domain at a certain period [76]. In addition, other reported researches have shown that wavelet transformation is the most successful method to use for feature extraction and selection [77,78]. Based on [78], there are also several methods used in feature selection and extraction, such as principal component analysis (PCA) and artificial neural networks (ANN). The PCA method transforms a set of correlated variables into a set of uncorrelated variables known as principal components. This method is to reduce the dimensionality of input features for the classification of a bunch of data. On the other hand, ANN is a method used in data processing for simulating the biological brain via simple computational elements such as neurons.
The final stage in signal processing is the classification stage. This stage is to classify the unknown patterns of data into a class. The class could be either previously exist or newly created. Supervised classification is one of the classification methods used to classify unknown data or patterns easily. In this method, the labelling of each class is known as a priori by using a set of training samples. The training samples are the set of test data to be allocated to the classifier. In this way, the result of classifying each sample could be easily determined. However, some problems still arise in the training samples, and the corresponding classes are not always available. Hence, another method is known as unsupervised classification or clustering has been introduced [76]. Here, the classification is done by determining the likeness and grouping it into the same vector according to x feature vectors. Each group or cluster consists of many samples that are close together, but the similarities among each other are relatively small. A classifier needs to be selected throughout the classification stage to maintain high accuracy and speed with low computational steps. Besides, the high reliability of classification in the NDT inspection system is also important to ensure clear results [76].
According to the discussion above, several signal processing methods have been employed in the signal processing stages. Since signal processing is a part of machine learning [79], supervised and unsupervised classifications have been involved in signal processing, as discussed previously [80]. Employing these techniques will make the data analysis easier.

3.3. Nondestructive Testing (NDT) Using Artificial Intelligence

Artificial intelligence (AI) can simulate human intelligence by using a complex algorithm and training over large amounts of data. Those data will be the reference for the system to perform analysis and prediction in making decisions. By this, a system or computer will have the ability to learn and think like a human. Any machine learning (ML) technique can be AI if and only if it can decide like human beings. AI includes robotics, machine learning, natural language processing (NLP), and others. According to Figure 19, ML is part of AI that recognizes a given data pattern. Decisions will be made without human intervention by learning from the given data set based on the patterns identified. By using this, a large set of sample data should be used to compare with the incoming signal. Then, a decision will be made based on the results of the comparison. Furthermore, it is also shown that neural networks (NN) and deep learning (DL) are parts of ML. NN will simulate a human brain neural network to identify, classify, and analyze different kinds of data in determining the patterns which are considered complex for human brains. DL is based on NN, which handles complex algorithms with multiple variables and hidden layers in deriving high-level patterns [81].
Many ML methods could be utilized in improving the performance of conventional NDT techniques’ results such as ANN, deep neural network (DNN), support vector machine (SVM) [11], and convolutional neural network (CNN) [81] as there are many challenges as stated in Section 2. ANN, DNN, and CNN are part of the methods of ML and subsets of NN.
ANN is a type of supervised learning system constructed from many simple elements, known as neurons. Each of the simple elements will make simple decisions. Each decision made will be interconnected to form interconnected layers. In this way, a neural network will be formed to simulate any functions, such as answering a question if the training samples and computational power were enough. There are three layers of neurons for a simple neural network: input layer, hidden layer, and output layer, as shown in Figure 20. Input layers normally accept inputs, while the output layer gives out any predictions based on the training data provided.
DNN is like ANN, but it has more than one hidden layer of neurons to process inputs, as shown in Figure 21. Hence, DNN to have more layers of neurons in total. By this, DNN is more accurate as compared to ANN. In addition, DNN is efficient if autonomous jobs are going to replace human labour. In other words, the efficiency of DNN does not decline. Hence, many applications of DNN can be used to ease human life, such as a real-time camera for an automatic face recognition system in identifying criminals, AI cars, AI robots, and a lot more applications have been designed. From the applications, it was known that DNN is a complicated system that can recognize voice commands, sound, and graphics, undertake an expert review, creative thinking, and other activities. Hence, DNN could solve problems and making decisions depending on the information provided and the desired results. However, there is none of any marked data provided for DNN in solving a problem.
CNN was originally devised for image analysis. However, recently, it has been discovered to have excellent capacity in sequential data analysis such as natural language processing. Generally, there are two operations involved in CNN such as convolution and pooling. Multiple filters are being used in extracting features from the data set in preserving the spatial information if a convolutional operation is applied. On the other hand, the pooling or subsampling operation is used to lower the dimension of feature maps from the convolutional operation. There are two types of pooling: maximum pooling and average pooling, which are common to be applied in CNN [82].
SVM is another ML method in analyzing data for classification and estimation purposes. This method can provide reliable and fast recognition of NDT defects, which is the most important criterion for materials’ health monitoring to ensure it is safe during services. It can also provide a better generalization capability, especially in dealing with unseen data. In this way, SVM can also be used for various defect recognition. SVM can differentiate the defects by using a binary classifier where output ‘1’ is for the defected region, and output ‘0’ is for the defect-free region. During the testing period, the classification results of the conditions of the materials under inspection can be obtained by sending all the input data to the classifier. If many classes exist, there will be more classifiers. Therefore, a longer period will be needed for classification as higher computational will be required. Besides, the computation cost is also higher. Instead of SVM, support vector regression (SVR) is being introduced, which could completely avoid complicated mathematical modelling and reduce the higher computational cost [11].
Throughout the explanation of AI/ML approaches, one of its applications in NDT testing was studied in [83] to detect and accurately predict the location and type of defects in composite materials. This was undertaken with the combination of the concept of broadband dielectric spectroscopy with a ML approach and neural network computing systems. In addition, various defects could be classified according to the dielectric properties. On the other hand, Sacco et al. have shown that utilization of the ML methods for swift inspection towards the automated fiber placement manufactured composite structures due to the faster lay-up time and consistency of production across different geometries leads to difficulties in quality assurance efforts and inspection [84]. Moreover, other manufacturing defects might be induced, such as wrinkles, twists, gaps, and overlaps. Thus, software packages, such as image analysis algorithms, were employed to demonstrate the manufacturing defect types. Overall, the utilization of AI and NDT testing helps detect the defects and helps to detect the types of defects with their accurate location/size/depth.

4. Conclusions

This review paper covers studies on NDT testing techniques undertaken on composite materials. NDT testing is vital in inspecting the conditions of the materials either during manufacturing or in services to ensure the high quality of the manufactured materials and improves the reliability of the materials to be used by end-users. Conventional NDT techniques discussed include ultrasonic testing (UT), infrared thermography (IRT), eddy current testing (ECT), and laser shearography (LS). On the other hand, microwave NDT techniques reviewed include the chipless radio-frequency identification (RFID) sensor system, guided microwave testing (GMT), the microwave transmission line sensor, microwave planar resonator, microwave open-ended waveguide imaging, horn antenna, ground penetrating radar (GPR), and couple spiral inductors (CSI). The review demonstrates some challenges faced in conventional NDT techniques, such as penetration limitation. Hence, microwave NDT techniques were introduced to overcome the challenges faced as the microwave’s working frequency is higher than the working frequency of conventional NDT techniques. However, the research reveals that microwave methods have numerous drawbacks in material inspection, including low spatial image quality, blurred defect geometry, and extensive data interpretation. Soft-computing techniques, such as signal processing development, were introduced as a result to overcome the constraints. In addition, the review presented numerous research studies of microwave NDT techniques that have improved the efficiency of composite coatings inspection using machine learning and artificial intelligence approaches. Thus, microwave NDT approaches using machine learning and artificial intelligence have a significant potential for use in the nondestructive testing area, benefiting related industries.

Author Contributions

Conceptualization, T.W.S. and M.F.A.; writing—original draft preparation, T.W.S., G.N.J., and M.F.A.; writing—review and editing, M.F.A., G.N.J., T.S.Y., and M.I.S.M.S.; visualization, M.F.A.; supervision, M.F.A.; funding acquisition, M.F.A. All authors have read and agreed to the published version of the manuscript.

Funding

This work was supported by the Ministry of Education Malaysia Fundamental Research Grant Scheme (FRGS), Grant No. 203.PELECT.6071430.

Institutional Review Board Statement

Not applicable.

Informed Consent Statement

Not applicable.

Data Availability Statement

No new data were created and analyzed in this study. Data sharing is not applicable to this article.

Conflicts of Interest

The authors declare no conflict of interest.

References

  1. Ngo, T.-D. Introduction to Composite Materials. In Composite and Nanocomposite Materials—From Knowledge to Industrial Applications; InnoTech Alberta: Edmonton, AB, Canada, 2020; pp. 1–27. [Google Scholar]
  2. Al-Oqla, F.M.; Salit, M.S. Natural Fiber Composites. In Materials Selection for Natural Fiber Composites; Woodhead Publishing: Shaston, UK, 2017; pp. 23–48. [Google Scholar]
  3. Alem, S.; Latifi, R.; Angizi, S.; Hassanaghaei, F.; Aghaahmadi, M.; Ghasali, E.; Rajabi, M. Microwave Sintering of Ceramic Reinforced Metal Matrix Composites and their Properties: A Review. Mater. Manuf. Process. 2020, 35, 303–327. [Google Scholar] [CrossRef]
  4. Mirala, A.; Shirazi, R.S. Detection of Surface Cracks in Metals using Time-Domain Microwave Non-Destructive Testing Technique. IET Microw. Antennas Propag. 2017, 11, 564–569. [Google Scholar] [CrossRef]
  5. Al-Mattarneh, H. Determination of Chloride Content in Concrete using Near- and Far-Field Microwave Non-Destructive Methods. Corros. Sci. 2016, 105, 133–140. [Google Scholar] [CrossRef]
  6. Wahab, A.; Aziz, M.M.A.; Sam, A.R.M.; You, K.Y.; Bhatti, A.Q.; Kassim, K.A. Review on Microwave Non-Destructive Testing Techniques and its Applications in Concrete Technology. Constr. Build. Mater. 2019, 209, 135–146. [Google Scholar] [CrossRef]
  7. Akbar, M.F.; Jawad, G.N.; Duff, C.I.; Sloan, R. Porosity Evaluation of In-Service Thermal Barrier Coated Turbine Blades using a Microwave Nondestructive Technique. NDT E Int. 2018, 93, 64–77. [Google Scholar] [CrossRef]
  8. Alderman, B.; Huggard, P.G.; Powell, J.; Parow-Souchon, K.; Firdaus, M.; Liu, H.; Duff, C.I.; Sloan, R. Active Millimeter-Wave Radiometry for Nondestructive Testing/Evaluation of Composites-Glass Fiber Reinforced Polymer. IEEE Access 2016, 65, 641–650. [Google Scholar]
  9. Viegas, C.; Alderman, B.; Huggard, P.G.; Powell, J.; Firdaus, A.J.K.M.; Parow-Souchon, K.; Liu, H.; Duff, C.I.; Sloan, R. Active Imaging of Glass Reinforced Plastic using Millimeter-wave Radiometry. In Proceedings of the 2016 46th European Microwave Conference (EuMC), London, UK, 4–6 October 2016. [Google Scholar]
  10. Firdaus, J.K.M.; Sloan, R.; Duff, C.I.; Wielgat, M.; Knowles, J.F. Microwave Nondestructive Evaluation of Thermal Barrier Coated Turbine Blades using Correlation Analysis. In Proceedings of the 2016 46th European Microwave Conference (EuMC), London, UK, 4–6 October 2016. [Google Scholar]
  11. Shrifan, N.H.M.M.; Akbar, M.F.; Isa, N.A.M. Prospect of Using Artificial Intelligence for Microwave Nondestructive Testing Technique: A Review. IEEE Access 2019, 7, 1–13. [Google Scholar] [CrossRef]
  12. Shrifan, N.H.; Akbar, M.F.; Isa, N.A.M. Maximal Overlap Discrete Wavelet-Packet Transform Aided Microwave Non-Destructive Testing. NDT E Int. 2021, 119, 11. [Google Scholar] [CrossRef]
  13. Yu, Y.; Li, Y.; Qin, H.; Cheng, X. Microwave Measurement and Imaging for Multiple Corrosion Cracks in Planar Metals. Mater. Des. 2020, 196, 109151. [Google Scholar] [CrossRef]
  14. Towsyfyan, H.; Biguri, A.; Boardman, R.; Blumensath, T. Successes and Challenges in Non-Destructing Testing of Aircraft Composite Structures. Chin. J. Aeronaut. 2020, 33, 771–791. [Google Scholar] [CrossRef]
  15. Sharath, D.; Menaka, M.; Venkatraman, B. Comparison of Pulse and Lock-In Thermography Techniques for Debond Detection in Ni-B Coatings. Mater. Eval. 2019, 77, 1450–1462. [Google Scholar]
  16. Haigler, T. Introduction of NDT Methods and Techniques in Power Plants. Mater. Eval. 2002, 78, 1–9. [Google Scholar] [CrossRef]
  17. She, S.; Chen, Y.; He, Y.; Zhou, Z.; Zou, X. Optimal Design of Remote Field Eddy Current Testing Probe for Ferromagnetic Pipeline Inspection. Measurement 2021, 168, 108306. [Google Scholar] [CrossRef]
  18. Bossi, R.H.; Georgeson, G.E. Nondestructive Testing of Composites. Mater. Eval. 2018, 76, 1048–1060. [Google Scholar]
  19. Yan, P.; Wang, Y.; Sun, F.; Lu, Y.; Liu, L.; Zhao, Q. Shearography for Non-Destructive Testing of Specular Reflecting Objects using Scattered Light Illumination. Opt. Laser Technol. 2019, 112, 452–457. [Google Scholar] [CrossRef]
  20. Gupta, M.; Khan, M.A.; Butola, R.; Singari, R.M. Advances in Applications of Non-destructive Testing: A Review. Adv. Mater. Process. Technol. 2021, 7, 1–22. [Google Scholar] [CrossRef]
  21. Meyendorf, N.G.; Heilmann, P.; Bond, L.J. NDE 4.0 in Manufacturing: Challenges and Opportunities for NDE in the 21st Century. MeFeature 2020, 78, 1–10. [Google Scholar]
  22. Li, S.; Shi, K.; Yang, K.; Xu, J. Research on the Defect Types Judgment in Wind Turbine Blades using Ultrasonic NDT. In Proceedings of the Global Conference on Polymer and Composite Materials (PCM 2015), Beijing, China, 16–18 May 2015. [Google Scholar]
  23. Benedict, Z.; Dayal, V. Progress Towards the Development of a Compact Calibration Set for Quantitative NDE Inspection of Aerospace Composites; The American Society for Nondestructive Testing: Ames, IA, USA, 2016. [Google Scholar]
  24. Linke, M.; Chakraborty, S.; Gobel, H.; Lammering, R. On the Accuracy of Monitoring Inter-Fibre Fractures in Composites using Passive Infrared Thermography extended by Microscopic Analysis. Nondestruct. Test. Eval. 2021, 1–13. [Google Scholar] [CrossRef]
  25. Ramzan, B.; Malik, M.S.; Martarelli, M.; Ali, H.T.; Yusuf, M.; Ahmad, S. Pixel Frequency based Railroad Surface Flaw Detection using Active Infrared Thermography for Structural Health Monitoring. Case Stud. Therm. Eng. 2021, 27, 101234. [Google Scholar] [CrossRef]
  26. Theodorakeas, P.; Ftikou, E.; Cheilakou, E.; Koui, M. Passive and Active Infra-Red Thermography: An Overview of Applications for the Inspection of Mosaic Structures. J. Phys. Conf. Ser. 2015, 655, 1742–6596. [Google Scholar] [CrossRef]
  27. Gryzagoridis, J.; Findeis, D.; Dirk, N.B. Vacuum Excitation in Shearographic NDT. Insight-Non-Destr. Test. Cond. Monit. 2007, 49, 98–101. [Google Scholar] [CrossRef]
  28. Alhammad, M.; Avdelidis, N.P.; Deane, S.; Ibarra-Castanedo, C.; Pant, S.; Nooralishahi, P.; Ahmadi, M.; Genest, M.; Zolotas, A.; Zanotti-Fragonara, L.; et al. Diagnosis of Composite Materials in Aircraft Applications: Towards a UAV-based Active Thermography Inspection Approach. In Proceedings of the Thermosense: Thermal Infrared Applications XLIII 11743, Online, 12 April 2021; p. 1174306. [Google Scholar]
  29. Fierro, G.P.M.; Calla, D.; Ginzburg, D.; Ciampa, F.; Meo, M. Nonlinear Ultrasonic Stimulated Thermography for Damage Assessment in Isotropic Fatigued Structures. J. Sound Vib. 2017, 404, 102–115. [Google Scholar] [CrossRef] [Green Version]
  30. Aouf, A.; Bouchala, T.; Abdou, A.; Abdelhadi, B. Eddy Current Probe Configuration for Full Rail Top Surface Inspection. Instrum. Mes. Metrol. 2021, 20, 65–72. [Google Scholar]
  31. Xie, S.; Tian, M.; Xiao, P.; Pei, C.; Chen, Z.; Takagi, T. A Hybrid Non-Destructive Testing Method of Pulsed Eddy Current Testing and Electromagnetic Acoustic Transducer Techniques for Simultaneous Surface and Volumetric Defects Inspection. NDT E Int. 2017, 86, 153–163. [Google Scholar] [CrossRef]
  32. Li, Z.; Meng, Z. A Review of the Radio Frequency Non-Destructive Testing for Carbon-Fibre Composites. Meas. Sci. Rev. 2016, 16, 68–76. [Google Scholar] [CrossRef] [Green Version]
  33. Durcharne, B. Micromagnetic Nondestructive Testing Barkhausen Noise vs other Techniques. In Barkhausen Noise for Nondestructive Testing and Materials Characterization in Low-Carbon Steels; Woodhead Publishing: Shaston, UK, 2020; pp. 223–238. [Google Scholar]
  34. Chen, Z.; Fan, M.; Cao, B.; Hu, B.; Sha, J. Characterization of Image Sequences of a Defect using Pulsed Eddy Current Signals. J. Magn. Magn. Mater. 2021, 534, 168007. [Google Scholar] [CrossRef]
  35. Bato, M.R.; Hor, A.; Rautureau, A.; Bes, C. Experimental and Numerical Methodology to Obtain the Probability of Detection in Eddy Current NDT Method. NDT E Int. 2020, 114, 102300. [Google Scholar] [CrossRef]
  36. Case, J.T.; Kenderian, S. MW NDT: An Inspection Method. Mater. Eval. 2017, 75, 338–346. [Google Scholar]
  37. Hinken, J.H. Microwave Testing: An Overview. Nondestruct. Test. (NDT) 2016, 8, 1–7. [Google Scholar]
  38. Marindra, M.J.; Tian, G.Y. Chipless RFID Sensor Tag for Metal Crack Detection and Characterization. Microw. Theory Tech. 2018, 66, 2452–2462. [Google Scholar] [CrossRef]
  39. Simonetti, F.; Nagy, P.B.; Bejjavarapu, S.M.; Instanes, G.; Pedersen, A.O. Long-Range Microwave Detection of Wet Insulation for CUI Mitigation. In Proceedings of the Corrosion 2015, Dallas, TX, USA, 15–19 March 2015. [Google Scholar]
  40. Bejjavarapu, S.M.; Simonetti, F. An Experimental Model for Guided Microwave Backscattering from Wet Insulation in Pipelines. J. Nondestruct. Eval. 2014, 33, 583–596. [Google Scholar] [CrossRef]
  41. Li, Z.; Haigh, A.; Soutis, C.; Gibson, A.; Sloan, R. Evaluation of Water Content in Honey using Microwave Transmission Line Technique. J. Food Eng. 2017, 215, 113–125. [Google Scholar] [CrossRef] [Green Version]
  42. Qi, S.; Ren, J.; Gu, L.; Xu, H.; Wang, Y. The Application Research of Microwave Nondestructive Testing and Imaging based on w-k Algorithm. In Proceedings of the Ninth International Conference on Digital Image Processing (ICDIP 2017), Shenyang, China, 21 July 2017. [Google Scholar]
  43. Li, Z.; Haigh, A.; Soutis, C.; Gibson, A.; Sloan, R. Applications of Microwave Techniques for Aerospace Composites. In Proceedings of the 2017 IEEE International Conference on Microwaves, Antennas, Communications and Electric Systems (COMCAS), Tel-Aviv, Israel, 13–16 November 2017. [Google Scholar]
  44. AJK, M.F.; Sloan, R.; Duff, C.I.; Wielgat, M.; Knowles, J.F. Nondestructive Testing of Thermal Barrier Coated Turbine Blades using Microwave Techniques. Am. Soc. Nondestruct. Test. 2016, 74, 543–551. [Google Scholar]
  45. Zahia, G.; Monir, A.; Hichem, A.; Mourad, Z.; Latifa, H. Design and Simulation of Pyramidal Horn Antenna for NDT Applications. Int. J. Math. Comput. Simul. 2017, 11, 143. [Google Scholar]
  46. Wu, H.-K.; Shu, Z.-L.; Liu, C.-W.; Miao, Y.-C.; Liu, B.-X. Experimental Study on an Improved Joint Detection Technique for Concrete Structures. Mater. Eval. 2020, 78, 537–546. [Google Scholar] [CrossRef]
  47. Garrett, S. Nondestructive Assessment of Bridge Decks. Mater. Eval. 2019, 77, 479–488. [Google Scholar]
  48. Dhamodaram, M.; Kumar, R.P.; Jegadeesan, S. On-Chip Spiral Inductors and On-Chip Spiral Transistors for Accurate Numerical Modeling. J. Magn. 2018, 23, 50–54. [Google Scholar] [CrossRef]
  49. Salski, B.; Gwarek, W.; Korpas, P.; Reszewicz, S.; Chong, A.Y.; Theodorakeas, P.; Hatziioannidis, I.; Kappatos, V.; Selcuk, C.; Gan, T.-H.; et al. Non-Destructive Testing of Carbon-Fibre-Reinforced Polymer Materials with a Radio-Frequency Inductive Sensor. Compos. Struct. 2015, 122, 104–112. [Google Scholar] [CrossRef]
  50. Li, Q.; Chen, J.; Zhao, L. Research on an Improved Metal Surface Defect Detection Sensor Based on a 3D RFID Tag Antenna. J. Sens. 2020, 2020, 1–13. [Google Scholar] [CrossRef]
  51. Todoroki, A.; Yamada, K.; Mizutani, Y.; Suzuki, Y.; Matsuzaki, R. Impact Damage Detection of a Carbon-Fibre-Reinforced-Polymer Plate Employing Self-Sensing Time-Domain Reflectometry. Compos. Struct. 2015, 130, 174–179. [Google Scholar] [CrossRef]
  52. Korokawa, H.; Todoroki, A.; Mizutani, Y. Damage Monitoring of CFRP Plate Using Self-Sensing TDR Method. J. Solid Mech. Mater. Eng. 2012, 6, 1053–1061. [Google Scholar] [CrossRef] [Green Version]
  53. Todoroki, A.; Ohara, K.; Mizutani, Y.; Suzuki, Y.; Matsuzaki, R. Lightning Strike Damage Detection at a Fastener using Self-Sensing TDR of Composite Plate. Compos. Struct. 2015, 132, 1105–1112. [Google Scholar] [CrossRef]
  54. Li, Z.; Haigh, A.D.; Saleh, M.N.; McCarthy, E.D.; Soutis, C.; Gibson, A.A.; Sloan, R. Detection of Impact Damage in Carbon-Fibre Composites using an Electromagnetic Sensor. Res. Nondestruct. Eval. 2018, 29, 123–142. [Google Scholar] [CrossRef] [Green Version]
  55. Jawad, G.N.; Akbar, M.F. IFFT-based Microwave Non-Destructive Testing for Delamination Detection and Thickness Estimation. IEEE Access 2021, 9, 98561–98572. [Google Scholar]
  56. Li, Z.; Haigh, A.; Soutis, C.; Gibson, A. Principles and Applications of Microwave Testing for Woven and Non-Woven Carbon Fibre-Reinforced Polymer Composites: A Topical Review. Appl. Compos. Mater. 2018, 25, 965–982. [Google Scholar] [CrossRef]
  57. Akbar, M.F.; Jawad, G.N.; Rashid, L.D.; Sloan, R. Nondestructive Evaluation of Coatings Delamination Using Microwave Time Domain Reflectometry Technique. IEEE Access 2020, 8, 114833–114841. [Google Scholar] [CrossRef]
  58. Akbar, M.F.; Jawad, G.N.; Danoon, L.R.; Sloan, R. Delamination Detection in Glass-Fibre Reinforced Polymer (GFRP) Using Microwave Time Domain Reflectometry. In Proceedings of the 15th European Radar Conference (EuRAD), Madrid, Spain, 26–28 September 2018; pp. 253–256. [Google Scholar]
  59. Shrifan, N.H.M.M.; Jawad, G.N.; Isa, N.A.M.; Akbar, M.F. Microwave Nondestructive Testing for Defect Detection in Composites Based on K-means Clustering Algorithm. IEEE Access 2020, 9, 4820–4828. [Google Scholar] [CrossRef]
  60. Abhignya, G.; Yogita, B.; Abhinay, C.; Balaji, B.; Murthy, M. Design, Fabrication and Testing of Pyramidal Horn Antenna. Int. J. Eng. Appl. Sci. 2015, 2, 2394–3661. [Google Scholar]
  61. Wilson, B.; Devadas, A.; Lytton, R.; Sebesta, S. Ground Penetrating Radar as a Quality Assurance Tool in Hot-Mix Asphalt Road Construction. Mater. Eval. 2020, 78, 1129–1139. [Google Scholar] [CrossRef]
  62. Morcous, G.; Erdogmus, E. Use of Ground Penetrating Radar for Construction Quality Assurance of Concrete Pavement. In Nebraska LTAP. Mid-America; Nebraska Transportation Center: Boulder, CO, USA, 2009. [Google Scholar]
  63. Liang, H.; Xing, L.; Lin, J. Application and Algorithm of Ground-Penetrating Radar for Plant Root Detection: A Review. Sensors 2020, 20, 2836. [Google Scholar] [CrossRef]
  64. Rasol, M.A.; Perez-Gracia, V.; Fernandes, F.M.; Pias, J.C.; Santos-Assuncao, S.; Santos, C.; Sossa, V. GPR Laboratory Tests and Numerical Models to Characterize Cracks in Cement Concrete Specimens, Exemplifying Damage in Rigid Pavement. Measurement 2020, 158, 107662. [Google Scholar] [CrossRef]
  65. Sossa, V.; Perez-Gracia, V.; Gonzalez-Drigo, R.; Rasol, M.A. Lab Non Destructive Test to Analyze the Effect of Corrosion on Ground Penetrating Radar Scans. Remote Sens. 2019, 11, 2814. [Google Scholar] [CrossRef] [Green Version]
  66. Rasol, M.A.; Perez-Gracia, V.; Fernandes, F.M.; Pais, J.C.; Solla, M.; Santos, C. NDT Assessment of Rigid Pavement Damages with Ground Penetrating Radar: Laboratory and Field Tests. Int. J. Pavement Eng. 2002, 1–16. [Google Scholar] [CrossRef]
  67. Feistkorn, S.; Muhlan, B.; Schiegg, Y.; Algernon, D.; Hasenstab, A. Nondestructive Testing in Civil Engineering Requirements for the Practical Application and State of the Art in Switzerland (Research Project AGB 2012/016 for the Federal Roads Office; FEDRO). In Proceedings of the NDE/NDT for Highways & Bridges: SMT 2018, Ittigen, Switzerland, 27–29 August 2018; 2018. [Google Scholar]
  68. Solla, M.; Laguela, S.; Riveiro, B.; Lorenzo, H. Non-destructive Testing for the Analysis of Moisture in the Masonry Arch Bridge of Lubians (Spain). Struct. Control. Health Monit. 2013, 20, 1366–1376. [Google Scholar] [CrossRef]
  69. Giamou, P. Ground Penetrating Radar Imaging of Concrete at a Nuclear Power Plant; The American Society for Nondestructive Testing, Inc.: Columbus, OH, USA, 2015; Volume 14, pp. 1–4. [Google Scholar]
  70. Rasol, M.A.; Perez-Gracia, V.; Solla, M.; Pais, J.C.; Fernandes, F.M.; Santos, C. An Experimental and Numerical Approach to Combine Ground Penetrating Radar and Computational Modeling for the Identification of Early Cracking in Cement Concrete Pavements. NDT E Int. 2020, 115, 102293. [Google Scholar] [CrossRef]
  71. Quinta-Ferreira, M. Ground Penetration Radar in Geotechnics. Advantages and Limitations. In Proceedings of the IOP Conferences—World Multidisciplinary Earth Sciences Symposium (WMESS 2018), Coimbra, Portugal, 3–7 September 2018. [Google Scholar]
  72. Li, Z.; Haigh, A.; Soutis, C.; Gibson, A.; Sloan, R.; Karimian, N. Detection and Evalution of Damage in Aircraft Composites using Electromagnetically Coupled Inductors. Compos. Struct. 2016, 140, 252–261. [Google Scholar] [CrossRef]
  73. Ye, J.; Ito, S.; Toyama, N. Computerized Ultrasonic Imaging Inspection: From Shallow to Deep Learning. Sensors 2018, 18, 3820. [Google Scholar] [CrossRef] [Green Version]
  74. Dorafshan, S.; Maguire, M.; Chang, M. Comparing Automated Image-Based Crack Detection Techniques in the Spatial and Frequency Domains. In Proceedings of the 26th ASNT Research Symposium, Jacksonville, FL, USA, 13–16 March 2017; pp. 13–16. [Google Scholar]
  75. Tiwari, K.A.; Raisutis, R.; Samaitis, V. Signal Processing Methods to Improve the Signal-to-Noise Ratio (SNR) in Ultrasonic Non-Destructive Testing of Wind Turbine Blade. Procedia Struct. Integr. 2017, 5, 1184–1191. [Google Scholar] [CrossRef]
  76. Vejdannik, M.; Sadr, A.; de Albuquerque, V.H.C.; Tavares, J.M.R. Signal Processing for NDE. In Handbook of Advanced Non-Destructive Evaluation; Springer International Publishing: Heidelberg, NY, USA, 2018; pp. 1–19. [Google Scholar]
  77. Crouch, G.; Kesharaju, M.; Nagarajah, R. Characterisation, Significance and Detection of Manufacturing Defects in Reaction Sintered Silicon Carbide Armour Materials. Ceram. Int. 2015, 41, 11581–11591. [Google Scholar] [CrossRef]
  78. Kesharaju, M.; Nagarajah, R. Feature Selection for Neural Network based Defect Classification of Ceramic Components using High Frequency Ultrasound. Ultrasonics 2015, 62, 271–277. [Google Scholar] [CrossRef]
  79. Tiwari, A.; Chenji, H.; Devabhaktuni, V. Comparison of Statistical Signal Processing and Machine Learning Algorithms for Spectrum Sensing. In Proceedings of the 2018 IEEE Global Communications Conference (GLOBECOM), Abu Dhabi, United Arab Emirates, 9–13 December 2018. [Google Scholar]
  80. Harley, B.; Sparkman, D. Machine Learning and NDE. Past, Present, and Future. In Proceedings of the AIP Conference Proceedings, Gainesville, OH, USA, 8 May 2019. [Google Scholar]
  81. Anis, S.; Lai, K.W.; Chuah, J.H.; Ali, S.M.; Mohafez, H.; Hadizadeh, M.; Yan, D.; Ong, Z.-C. An Overview of Deep Learning Approaches in Chest Radiograph. IEEE Access 2020, 8, 182347–182354. [Google Scholar]
  82. Zhu, W.; Ma, Y.; Zhou, Y.; Benton, M.; Romagnoli, J. Deep Learning Based Soft Sensor and Its Application on a Pyrolysis Reactor for Compositions Predictions of Gas Phase Components. Comput. Aided Chem. Eng. 2018, 44, 2245–2250. [Google Scholar]
  83. Elenchezhian, M.R.P.; Vadlamudi, V.; Nandini, A.; Raihan, M.R. Detection and Prediction of Defects in Composite Material using Di-electric Characterization and Neural Network. In Proceedings of the SAMPE Conference Proceedings, Long Beach, CA, USA, 21–24 May 2018. [Google Scholar]
  84. Sacco, C. Machine Learning Methods for Rapid Inspection of Automated Fiber Placement Manufactured Composite Structures. Scholar Commons. Master’s Thesis, University of South Carolina, Columbia, SC, USA, 2019; p. 99. [Google Scholar]
Figure 1. Basic principle of ultrasonic testing [22].
Coatings 11 00913 g001
Figure 2. Setup of infrared thermography (IRT) [14].
Coatings 11 00913 g002
Figure 3. Induced currents in conductive material [32].
Coatings 11 00913 g003
Figure 4. Schematic diagram of eddy current testing [33].
Coatings 11 00913 g004
Figure 5. Setup system of laser shearography (LS) [14].
Coatings 11 00913 g005
Figure 6. Microwave testing in (a) reflection mode and (b) transmission mode [37].
Coatings 11 00913 g006
Figure 7. Basic principle of a chipless radio-frequency identification (RFID) sensor system for crack detection and characterization on a metallic structure [38].
Coatings 11 00913 g007
Figure 8. Simulation process of 3D RFID tag antenna on the metal structures with defects [50].
Coatings 11 00913 g008
Figure 9. Self-sensing sensor [52].
Coatings 11 00913 g009
Figure 10. Detection system with microstrip line sensor (a) experiment setup (b) cross-section [56].
Coatings 11 00913 g010
Figure 11. Side view of the complementary split-ring resonator (CSRR) [43].
Coatings 11 00913 g011
Figure 12. Cross-section diagram of the scanning arrangement using an open-ended rectangular waveguide in case of (a) defect-free and (b) defect [11].
Coatings 11 00913 g012
Figure 13. The basic configuration of ground-penetrating radar [62].
Coatings 11 00913 g013
Figure 14. Planar coupling between two side-by-side spiral inductors.
Coatings 11 00913 g014
Figure 15. Vertical coupling of two spiral inductors [48].
Coatings 11 00913 g015
Figure 16. Correlation coefficient along with the scanning onto the materials using cross-correlation [75].
Coatings 11 00913 g016
Figure 17. Time delay of all signals along with the scanning onto the materials using cross-correlation [75].
Coatings 11 00913 g017
Figure 18. Instantaneous amplitudes of first two intrinsic mode functions (IMFs) using Hilbert transform (a) defect-free signal, (b) 15 mm defective signal, (c) 25 mm defective signal [75].
Coatings 11 00913 g018
Figure 19. Venn diagram of artificial intelligence with its categories [81].
Coatings 11 00913 g019
Figure 20. Neural network with one hidden layer.
Coatings 11 00913 g020
Figure 21. Neural network with many hidden layers.
Coatings 11 00913 g021
Table 1. Advantages and limitations for each traditional NDT technique.
Ref. No.NDT TechniqueAdvantagesLimitations
[14]Ultrasonic Testing (UT)
  • Able to detect a slight change in the density of composite material.
  • Inability to detect mismatch region.
  • Longer inspection time.
  • Inability to detect smaller defects, which deep into the material.
  • Lower resolution.
[15]Infrared Thermography (IRT)
  • Temperature variation helps to identify the location of defects
  • Longer processing time.
  • Requirement of high heating power.
[16,17]Eddy Current Testing (ECT)
  • Depends on the heat generation by electromagnetically-induced eddy currents.
  • The strength of secondary magnetic fields decided the location of defects
  • Only applicable for conductive composite materials.
  • Mostly detect surface and near-surface flaws.
[18,19]Laser Shearography (LS)
  • Generation of speckle pattern to indicate the defected areas.
  • Unable to access deformations and defects inside the material.
  • Low signal-to-noise ratio
Table 2. Applications of microwave inspection techniques.
Ref. No.NDT TechniqueApplications
[38]Chipless Radio-Frequency Identification (RFID) Sensor System
  • Structural health monitoring (SHM).
[39,40]Guided Microwave Testing (GMT)
  • Investigation of the corrosion on the metal pipeline.
[41,42]Microwave Transmission Line Sensor
  • Determine the porosity of materials.
  • Detect foreign objects.
[43]Microwave Planar Resonator
  • Defects detection.
[10,44]Microwave Open-Ended Waveguide
  • Defects detection.
[45]Horn Antenna
  • Cracks’ detection.
[46,47]Ground-Penetrating Radar (GPR)
  • Condition check on reinforced concrete structures of bridge decks.
  • Inspecting concrete construction.
[48,49]Couple Spiral Inductor (CSI)
  • On-chip spiral inductors.
  • Defects detection.
Publisher’s Note: MDPI stays neutral with regard to jurisdictional claims in published maps and institutional affiliations.

