Article

Discrete Coating of CNT on Carbon Fiber Surfaces and the Effect on Improving the Electrochemical Performance of VRFB Systems

1
Department of Information System, Saitama Institute of Technology, Fukaya 3690293, Japan
2
Ningbo Haizhi Institute of Material Industry Innovation, Ningbo 315000, China
3
Tokyo Green Power Electric Research Institute Co., Ltd., Tokyo 111022, Japan
*
Author to whom correspondence should be addressed.
Coatings 2021, 11(6), 736; https://doi.org/10.3390/coatings11060736
Submission received: 6 May 2021 / Revised: 10 June 2021 / Accepted: 16 June 2021 / Published: 18 June 2021
(This article belongs to the Special Issue Surface Modification and Functionalization for Advanced Materials)

Abstract

:
Carbon fiber, as an electrode material, has been widely used in all-vanadium liquid flow batteries. In order to further reduce the size of the all-vanadium storage system, it is imperative to increase the current density of the battery and to achieve high conductivity and large electrostatic capacitance. The graphitization of the electrode material and the improvement in the specific surface area of the electrode surface also greatly affect the performance of all-vanadium redox liquid flow batteries. Therefore, in this paper, carbon nanotubes (CNTs) with a small diameter and a large specific surface area were coated on the electrode surface of the VRFB system by the dispersion method to improve the cell performance. The performance of the surface-modified electrode was also verified by Raman spectroscopy, XRD and SEM surface observations and charge/discharge experiments.

1. Introduction

The liquid flow battery is an electrochemical energy storage technology proposed by Thaller (NASA Lewis Research Center, Cleveland, OH, USA) in 1974 [1,2]. The liquid flow battery is also known as a battery active material renewable fuel cell [3]. When vanadium ions are used as the active material in the battery, called a vanadium liquid flow battery (VRFB), the vanadium electrolyte in the liquid storage tank is pressed into the battery stack through an external pump during system operation to complete the electrochemical reaction. V4+ in the positive electrode is oxidized to V5+ during charging, and V3+ in the negative electrode is reduced to V2+. The reverse reaction occurs during the discharge process. The reaction is as follows.
Positive electrode reaction:
VO 2 + + H 2 O discharge   charge   VO 2 + + e + 2 H + at   E 0 = + 1.0   V
Negative electrode reaction:
V 3 + + e discharge   charge   V 2 + at   E 0 = 0.26   V
As an energy storage battery, the all-vanadium liquid flow battery has been widely used in various energy storage fields, including large power stations, photovoltaic power generation and wind power generation [4,5,6,7]. However, the disadvantages of a low energy density and a large size need to be further addressed [8,9,10]. Therefore, reducing the size of all-vanadium liquid flow batteries and increasing the energy density and current density of the batteries are the main objectives of current research and development [11,12,13]. This goal is achieved mainly through two ways: one is to improve the performance of the battery component materials, and the other is to optimize the design of the battery frame and flow path [14,15]. One of them is about the battery component materials, which mainly include the electrode materials and diaphragm materials of the battery. Electrode materials are improved mainly by means of heat treatment and surface modification [16,17,18,19,20]. The heat treatment process can improve the carbonization of the electrode to reduce the resistance of the electrode [21,22]. However, while improving the carbonization, we believe that for aqueous solution batteries, the hydrophilicity of the electrode should be improved at the same time, and excessive heat treatment will reduce the hydrophilicity of the electrode [23], thus reducing the charge and discharge performance. Surface modification of the electrode is mainly conducted by increasing the specific surface area of the carbon ballast [24,25,26], which increases the contact area between the carbon ballast and the electrolyte, thus improving the reaction rate and reducing the charge mobility resistance [27,28,29,30].
As a key component of the VFRB, the electrode not only provides the site for the redox reaction of vanadium ions but also plays an important role in the performance of the battery. The performance of the electrode directly affects the charging and discharging performance of the VFRB. Carbon felt is a widely used electrode material due to its good stability, high conductivity and low cost. However, carbon felt electrodes also have some disadvantages, such as poor electrochemical activity and a small specific surface area. These problems need to be solved by surface modification. In 2016, Venkata Yarlagadda et al. published a paper [31,32] showing studies which increased the specific surface area of the electrode to 29 times the original one by producing multi-walled carbon nanotubes directly on the electrode surface by the electrical deposition method. The efficiency of the H2-Br2 fuel cell was 16% higher than that using a triple-layer fuel cell at an 80% discharge voltage. In 2019, H.R. Jiang et al. published a paper [33,34] in which a two-hole graphite felt electrode was prepared by a simple and effective catalytic etching method with seven times the specific surface area of the original stone carbon felt, current densities of 300 and 400 mA/cm2 and energy efficiencies of 82.47% and 77.69%. The performance of the carbon felt electrode was effectively improved.
In order to further improve the performance of carbon electrodes in VRFB systems, in this paper, a method is proposed to dispersively coat carbon nanotubes (CNTs) with small diameters and large specific surface areas on the surface of carbon electrode fibers in VRFB systems. Furthermore, the carbon electrodes were heat-treated at various temperature conditions, and the optimum heat treatment conditions were found to improve the electrode performance. The performance of the surface-modified electrodes was verified by Raman spectrum, XRD and SEM surface observations and charge/discharge experiments, which also proved that the method proposed in this thesis is effective.

2. Experimental Methods

In this study, the dispersion of multi-walled carbon nanotubes was treated with different dispersions and the dispersions were analyzed using a ZC-3000 ZETA potentiostat from Kyowa Interface Science Co., Ltd. (Niiza, Japan). To ensure the uniformity of the coating, we applied the dispersed CNT solution in batches on both the front and back sides of the electrodes, which were heated and dried. The VRFB used for charge/discharge experiments was a homemade spiral pump-driven cell with an electrode area of 5 × 10 cm. For the data of the charge/discharge experiments, SEM-EDS(JEOL Ltd. JSM-5510 Tokyo, Japan) observation analysis, Raman spectroscopy analysis(JASCO Corporation. NRS-4100, Tokyo, Japan) and XRD (Rigaku Corporation, RINT2500HF, Tokyo, Japan) surface crystallography analysis were performed on the electrode surface. The obtained analytical data were calculated, and the calculated results were compared in order to summarize the experimental results.

2.1. Experimental Conditions

The CNTs used in this experiment were multi-walled carbon nanotubes produced by Wako Pure Chemical Industries, Ltd (Tokyo, Japan), commercially available multi-walled CNTs with an average diameter of 10 nm and an average length of 1 μm. The dispersion medium mainly contained deionized water and ethanol solution, and the surfactant was SDBS (sodium dodecylbenzene sulfonate). Here, 0.006 g of CNTs was placed in three different solvents, stirred for 15 min, sonicated for 20 min and left for 1 h. The stability of the dispersed solution was determined by measuring the ZETA potential. The ultrasonic treatment instrument was model W-113A manufactured by Honda Electronics, Ltd. (Tokyo, Japan) and the ultrasonic treatment conditions were 60 °C, 45 KHZ and 20 min, as shown in Figure 1.

2.2. Calculation Method

The charge/discharge experiment was performed with a constant current charge/discharge, an electrolyte flow rate of 2.4 mL min−1 cm−2 and a carbon felt compression ratio of 30%. The charge/discharge experiments were carried out on untreated carbon felt and treated carbon felt, and the charge/discharge data results were calculated to compare the experimental results. The charge and discharge internal resistance (IR), voltage efficiency (EV), coulombic efficiency (EC), energy efficiency (EE), energy density (ED) and output density (OD) of the battery were calculated based on the constant current charge and discharge curves. The calculation equations are shown in Equations (3)–(8).
I R = U a v g . c h a r g e U a v g . d i s c h a r g e 2 C D
E V = U a v g . d i s c h a r g e U a v g . c h a r g e × 100 %
E C = i d i s c h a r g e ( t ) d t i c h a r g e ( t ) d t × 100 %
E E = E V × E C
O D   ( W / L ) = I × U a v g . d i s c h a r g e V 1
E D   ( Wh / L ) = I × T d × U a v g . d i s c h a r g e V 1

3. Experimental Results

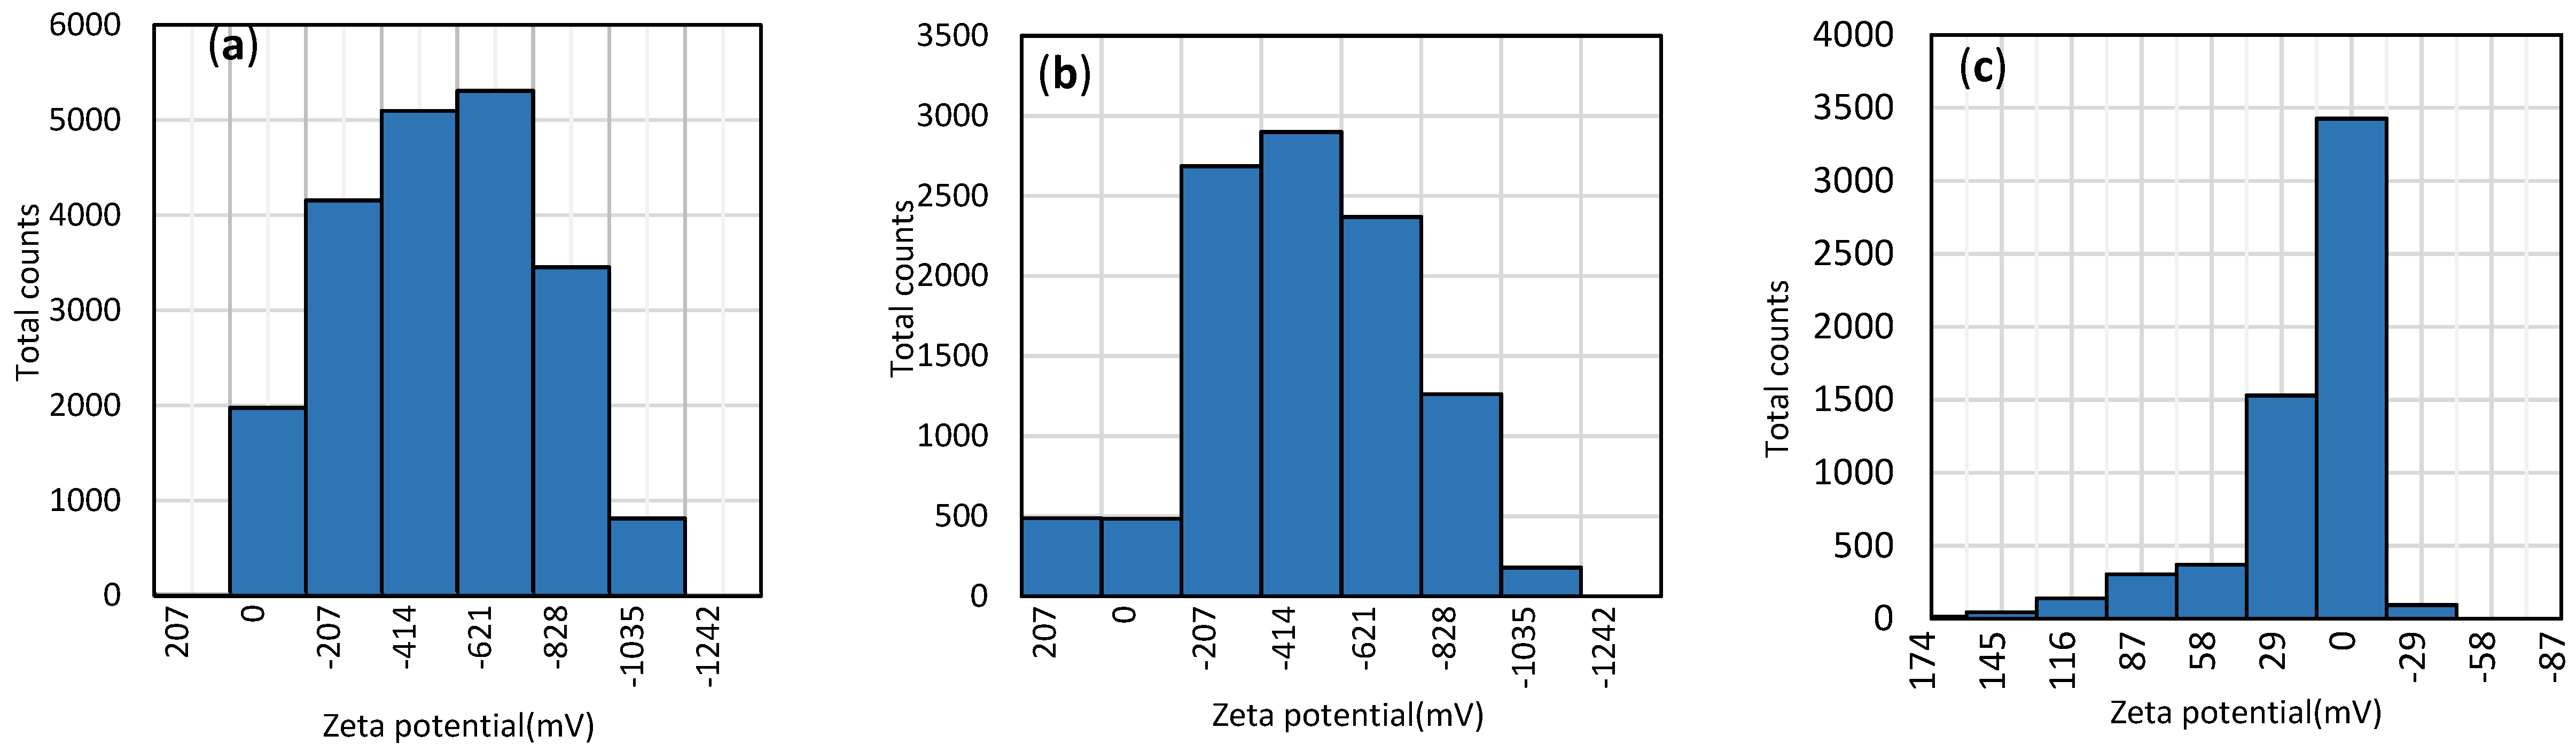
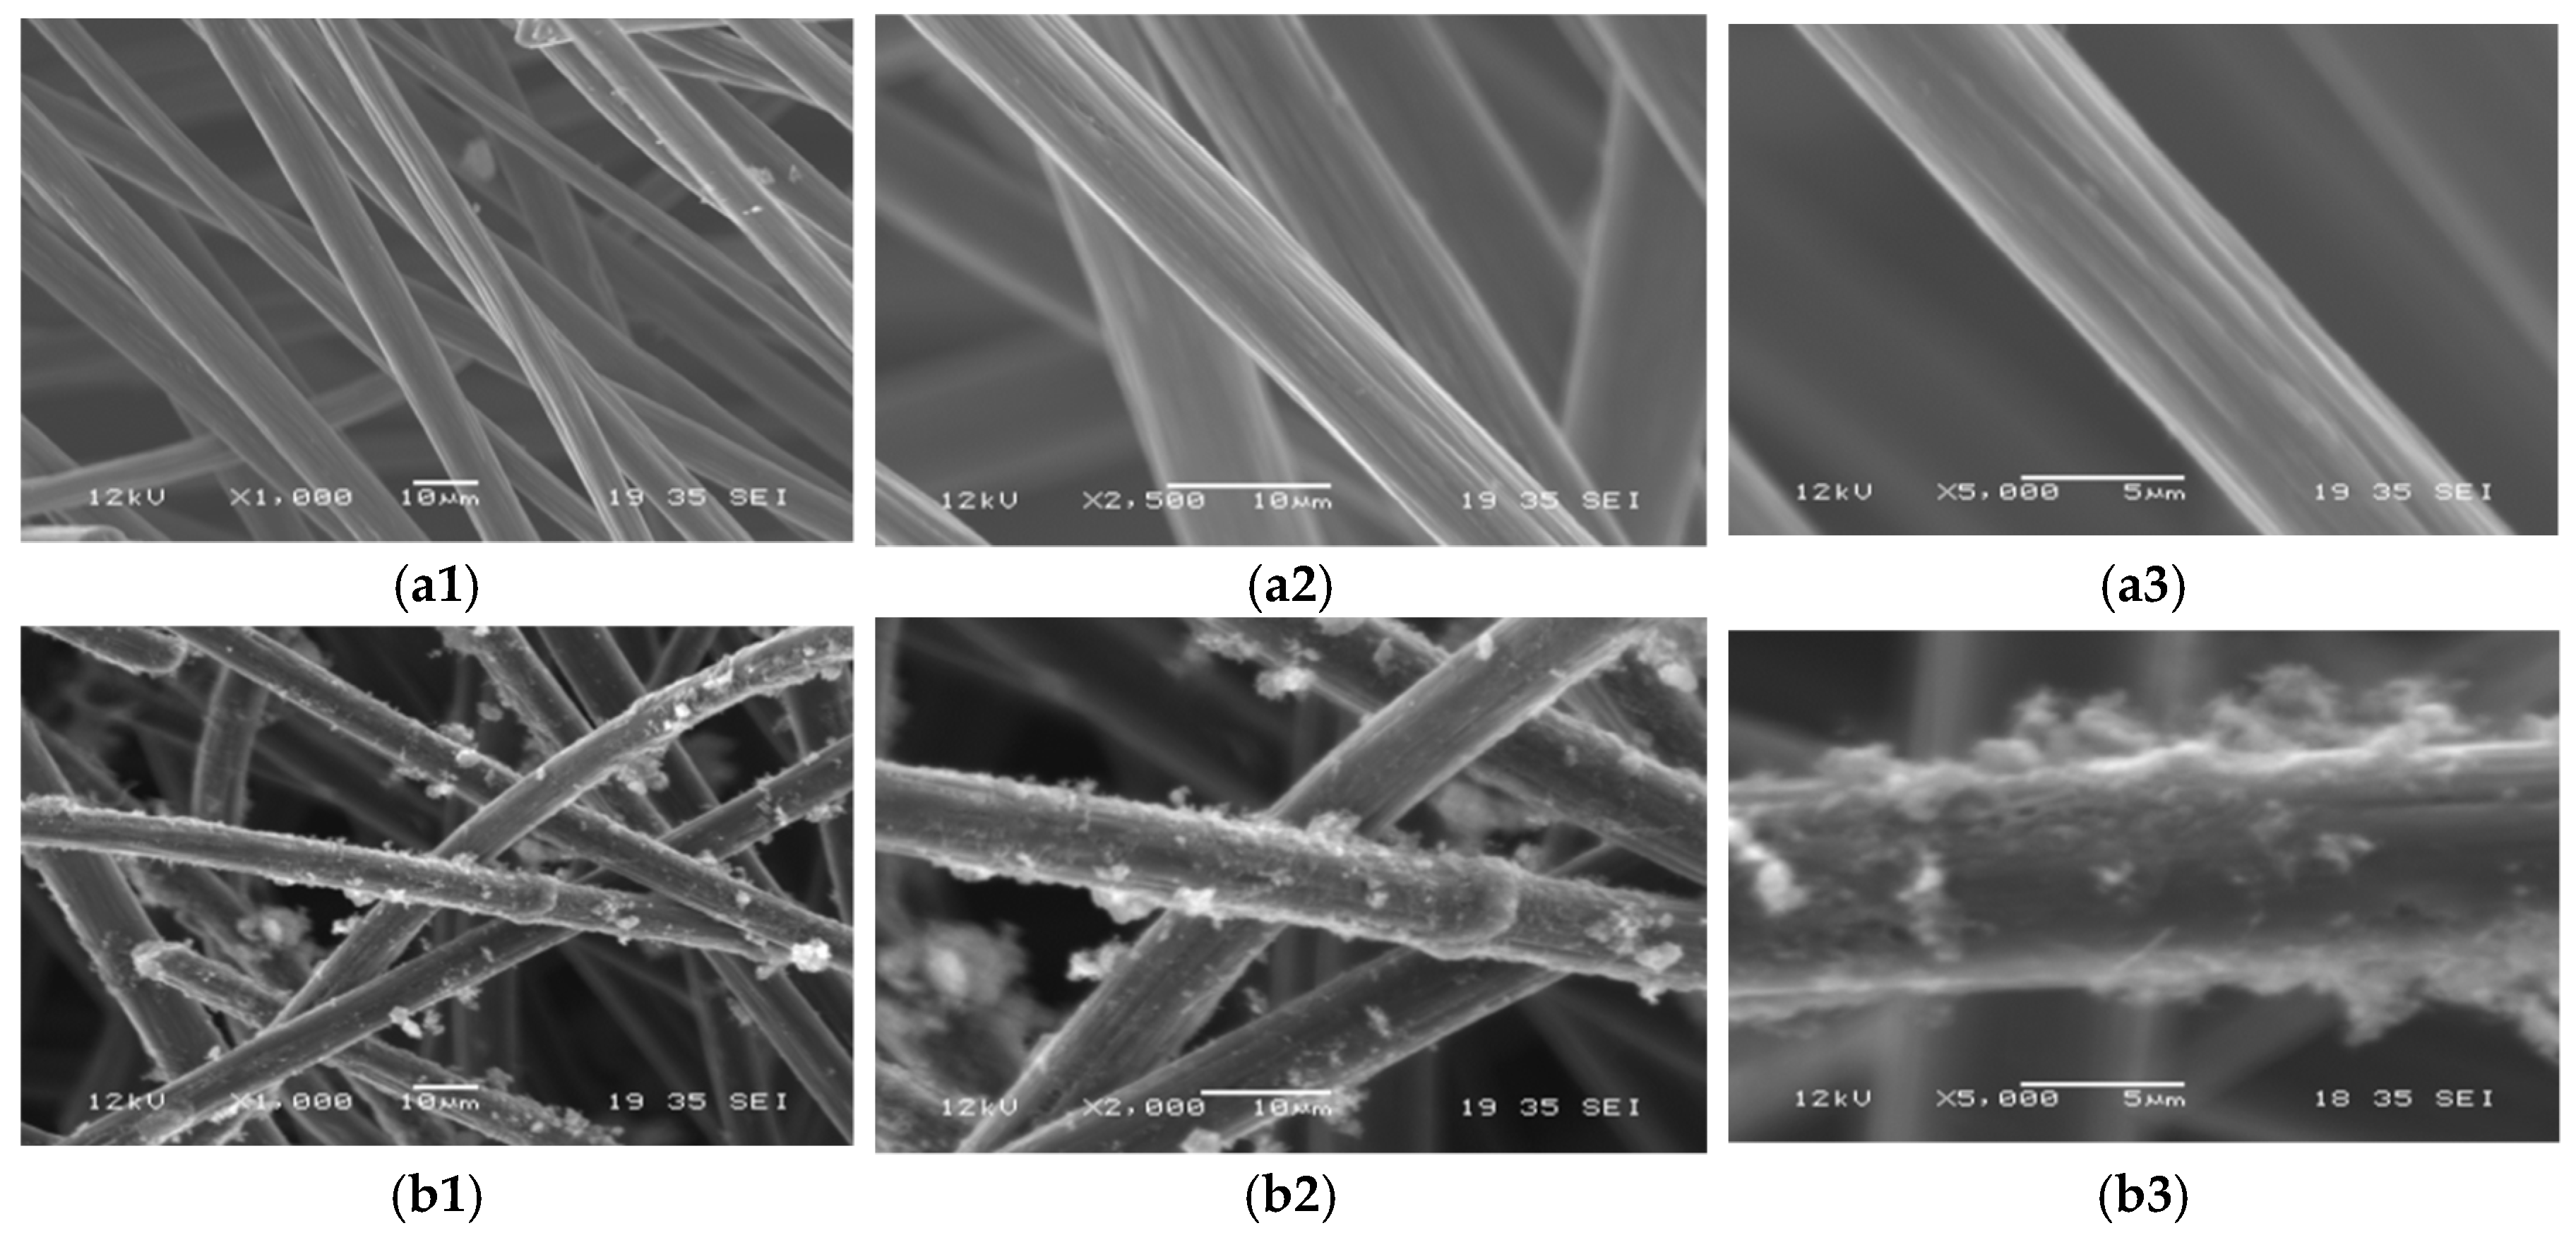
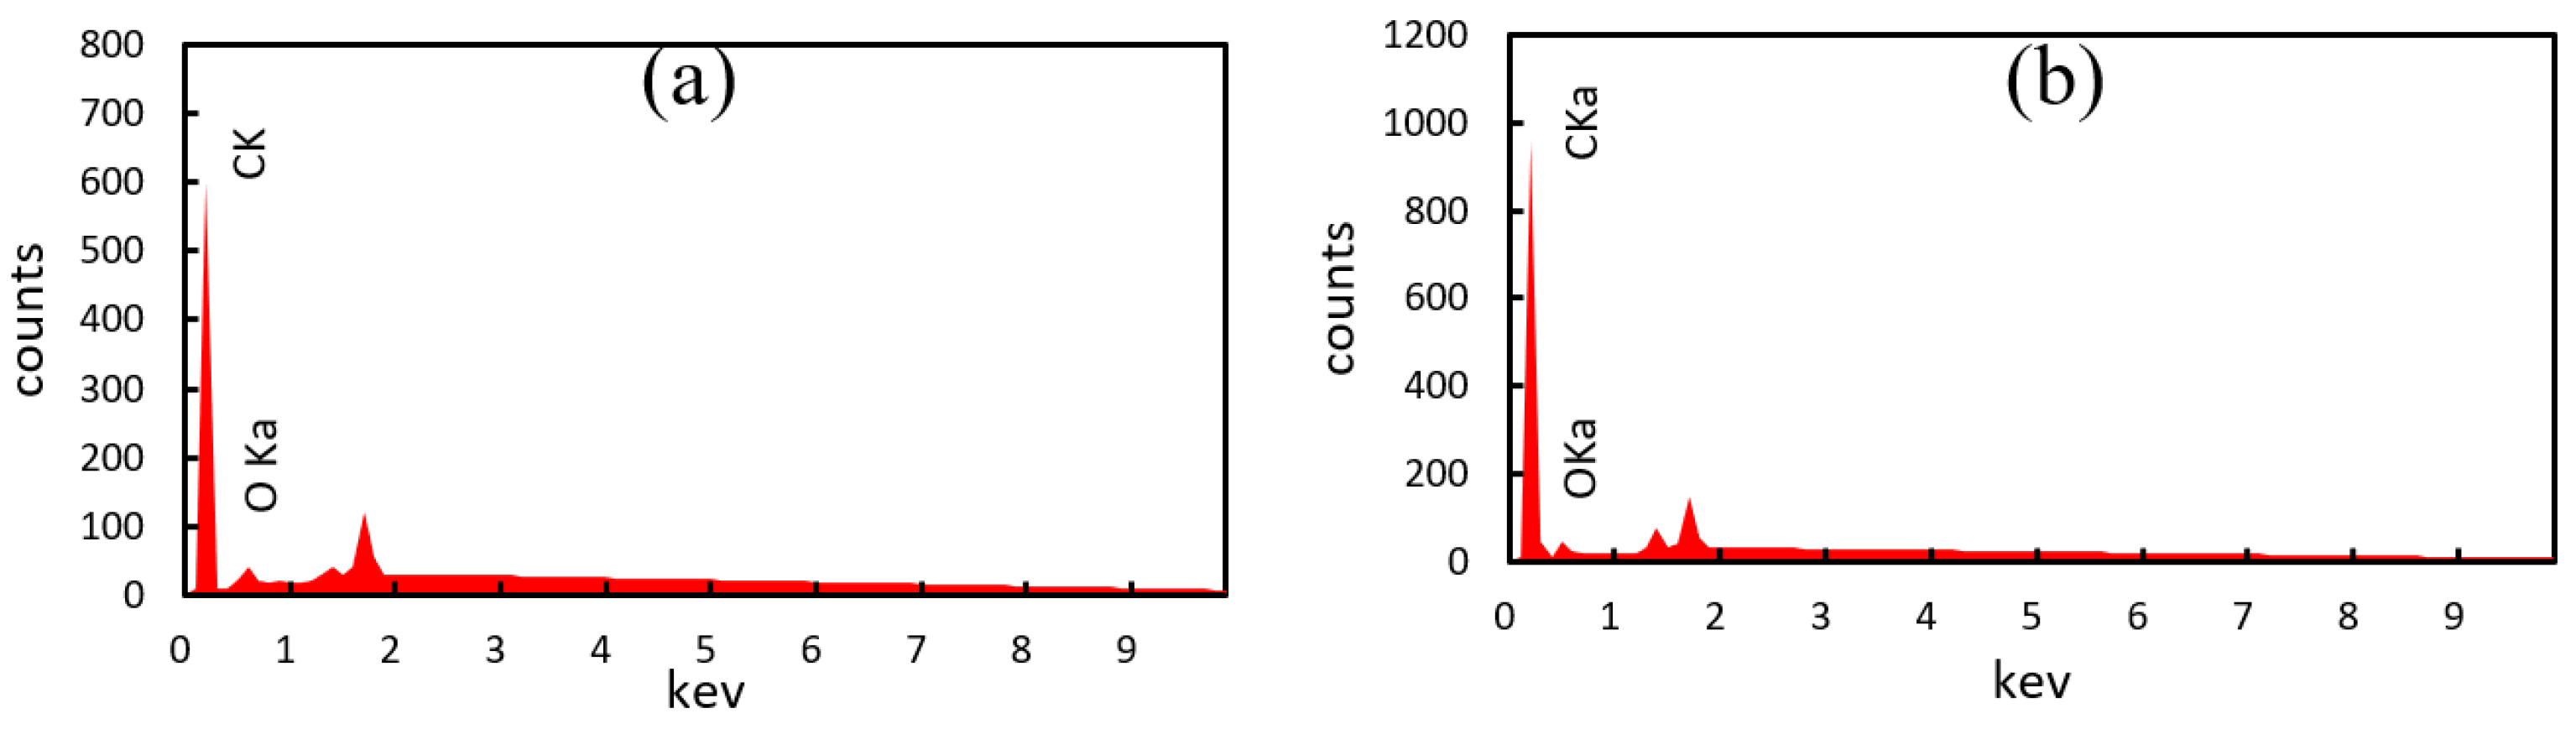
3.1. Dispersion Experiments of CNTs and SEM-EDS Surface Observation and Elemental Analysis

The dispersions of the three dispersions at different concentrations were compared by measuring the ZETA potential. The results show that the 80% ethanol solution (a), 0.1 mol/L SDBS ethanol solution (b) had the best dispersion. The dispersion potential is negative and arranged in a gradient. The measurement results are shown in Figure 2. Since the SDBS ethanol solution produced a large number of bubbles after sonication, the solution started to solidify after 2 h of standing, and the precipitation was obvious after 6 h of standing. Therefore, the 80% ethanol solution was used in this experiment.
The 100 mL of dispersed solution was heated and dried after being dropped into the carbon felt electrode several times. The surface state and elements of the carbon fiber electrodes were observed and analyzed by SEM-EDS. The SEM images of the untreated electrode, Figure 3(a1–a3), and the treated electrode, Figure 3(b1–b3), are shown in Figure 3. The SEM comparison shows that the dispersed CNTs completely adhered to the surface of the carbon felt fibers.
The results of the EDS elemental analysis are shown in Table 1 and Figure 4. It can be seen from the elemental analysis results that the carbon element percentage of the treated carbon felt increased by 4.25%.

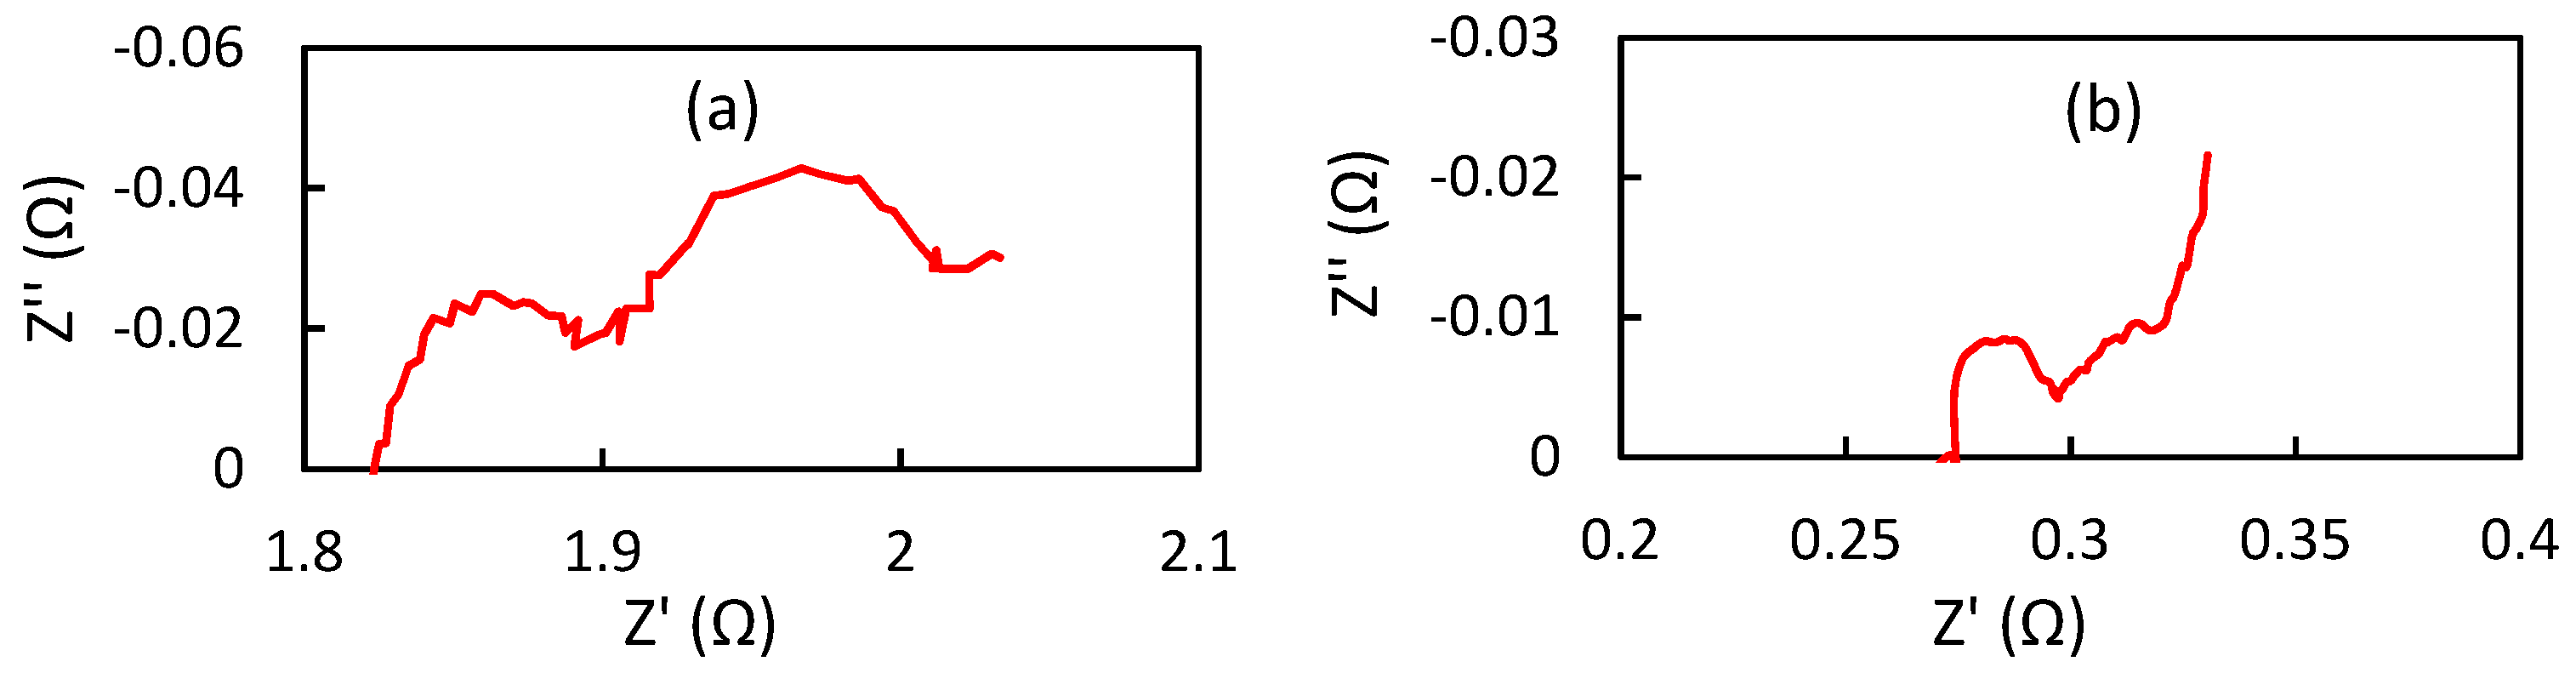
3.2. Charge and Discharge Experiments and Impedance Measurement Evaluation

The experimental results are shown in Figure 5 ((a) untreated carbon felt, (b) treated carbon felt) after conducting a constant current charge/discharge experiment on a single cell with a current density of 100–500 mA/cm2. The maximum power density of the untreated carbon felt electrode is 300 mA/cm2, and the charging voltage is 1.8 V. The treated carbon felt electrode can reach 400 mA/cm2, and the charging voltage is 1.6–1.7 V. The charging and discharging data were calculated according to Equations (3)–(8), as shown in Table 2. It can be seen from Table 2 that the IR of the treated carbon felt is two times lower than that of the treated carbon felt, and the EV and EE are increased by about 15%. This is because the surface coating of the carbon felt with CNTs improves the conductivity of the electrode and increases the specific surface area, thus reducing the charge/discharge internal resistance.
For the charge/discharge experimental data, the AC impedance of the battery was measured, and the results (Nyquist plot) are shown in Figure 6 for the test range of 105 → 0.1 Hz. The intersection of the starting position of the curve with the x-axis is the on-state resistance (RL) of the battery itself. In the figure, the half-circle part is the charge movement resistance (RP) in the high-frequency region, and the diagonal part is the material movement resistance (RD) in the low-frequency region. σ is the Warburg coefficient, ω is the frequency and Cd is the double-layer capacitance. The calculation equation is shown in (9) and (10).
Z = R L + σ ω + R P ( 1 + σ ω C d ) 2 + ω 2 C d 2 ( σ ω + R P ) 2
Z = σ ω ( 1 + σ ω C d ) 2 + ω C d ( σ ω + R P ) 2 ( 1 + σ ω C d ) 2 + ω 2 C d 2 ( σ ω + R P ) 2
The main purpose of this experiment is to review the charge movement resistance RP in the high-frequency region and the matter movement resistance RD in the low-frequency region. From the measured Nyquist diagram, it can be calculated that RP = 0.7 Ω and RD = 1 Ω for the untreated carbon felt and RP = 0.025 Ω and RD = 0.035 Ω for the treated carbon felt. It can be seen that the charge and discharge impedance of the coated carbon felt is reduced by about five times.

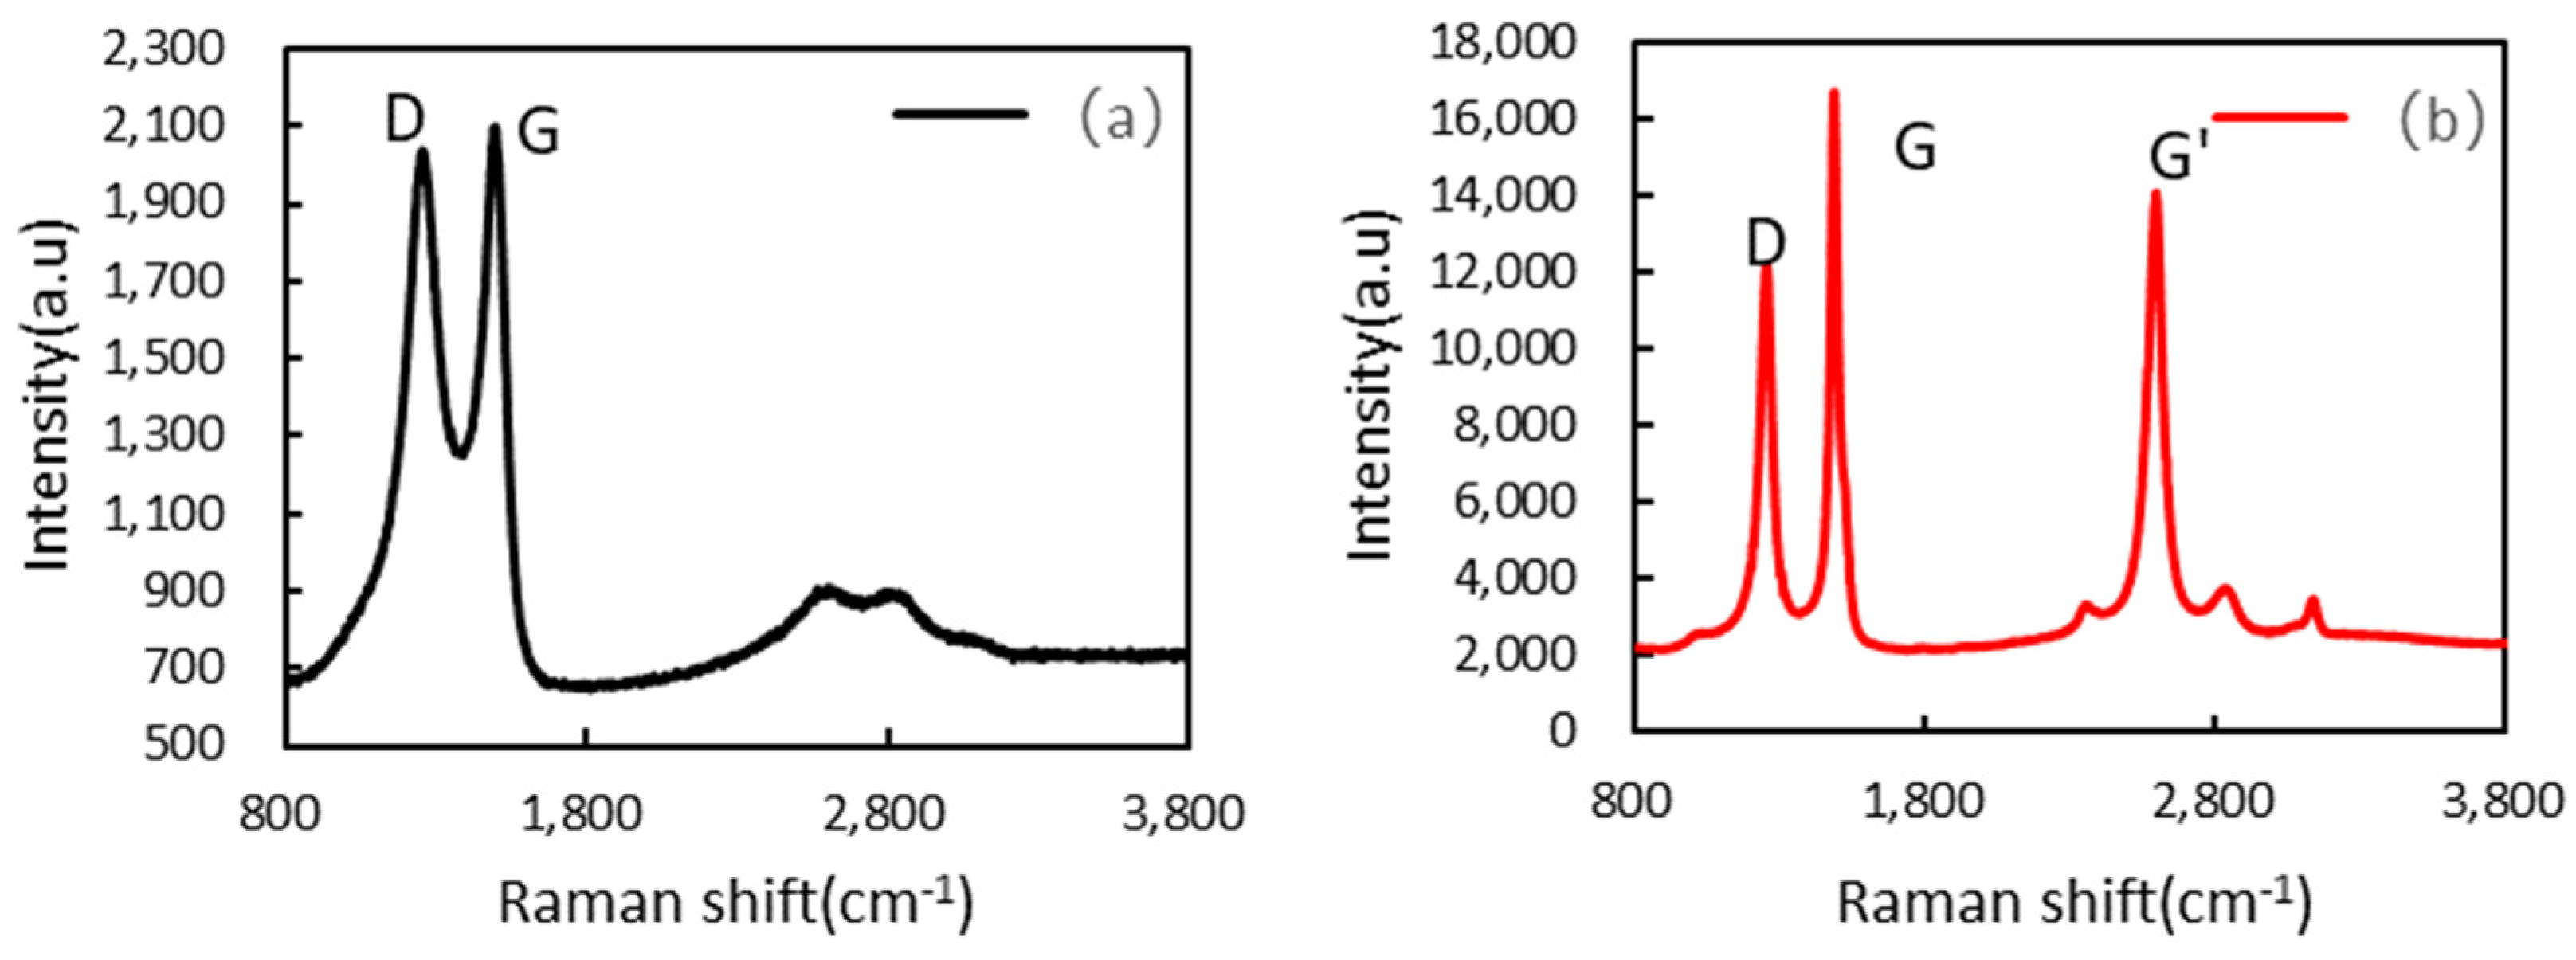
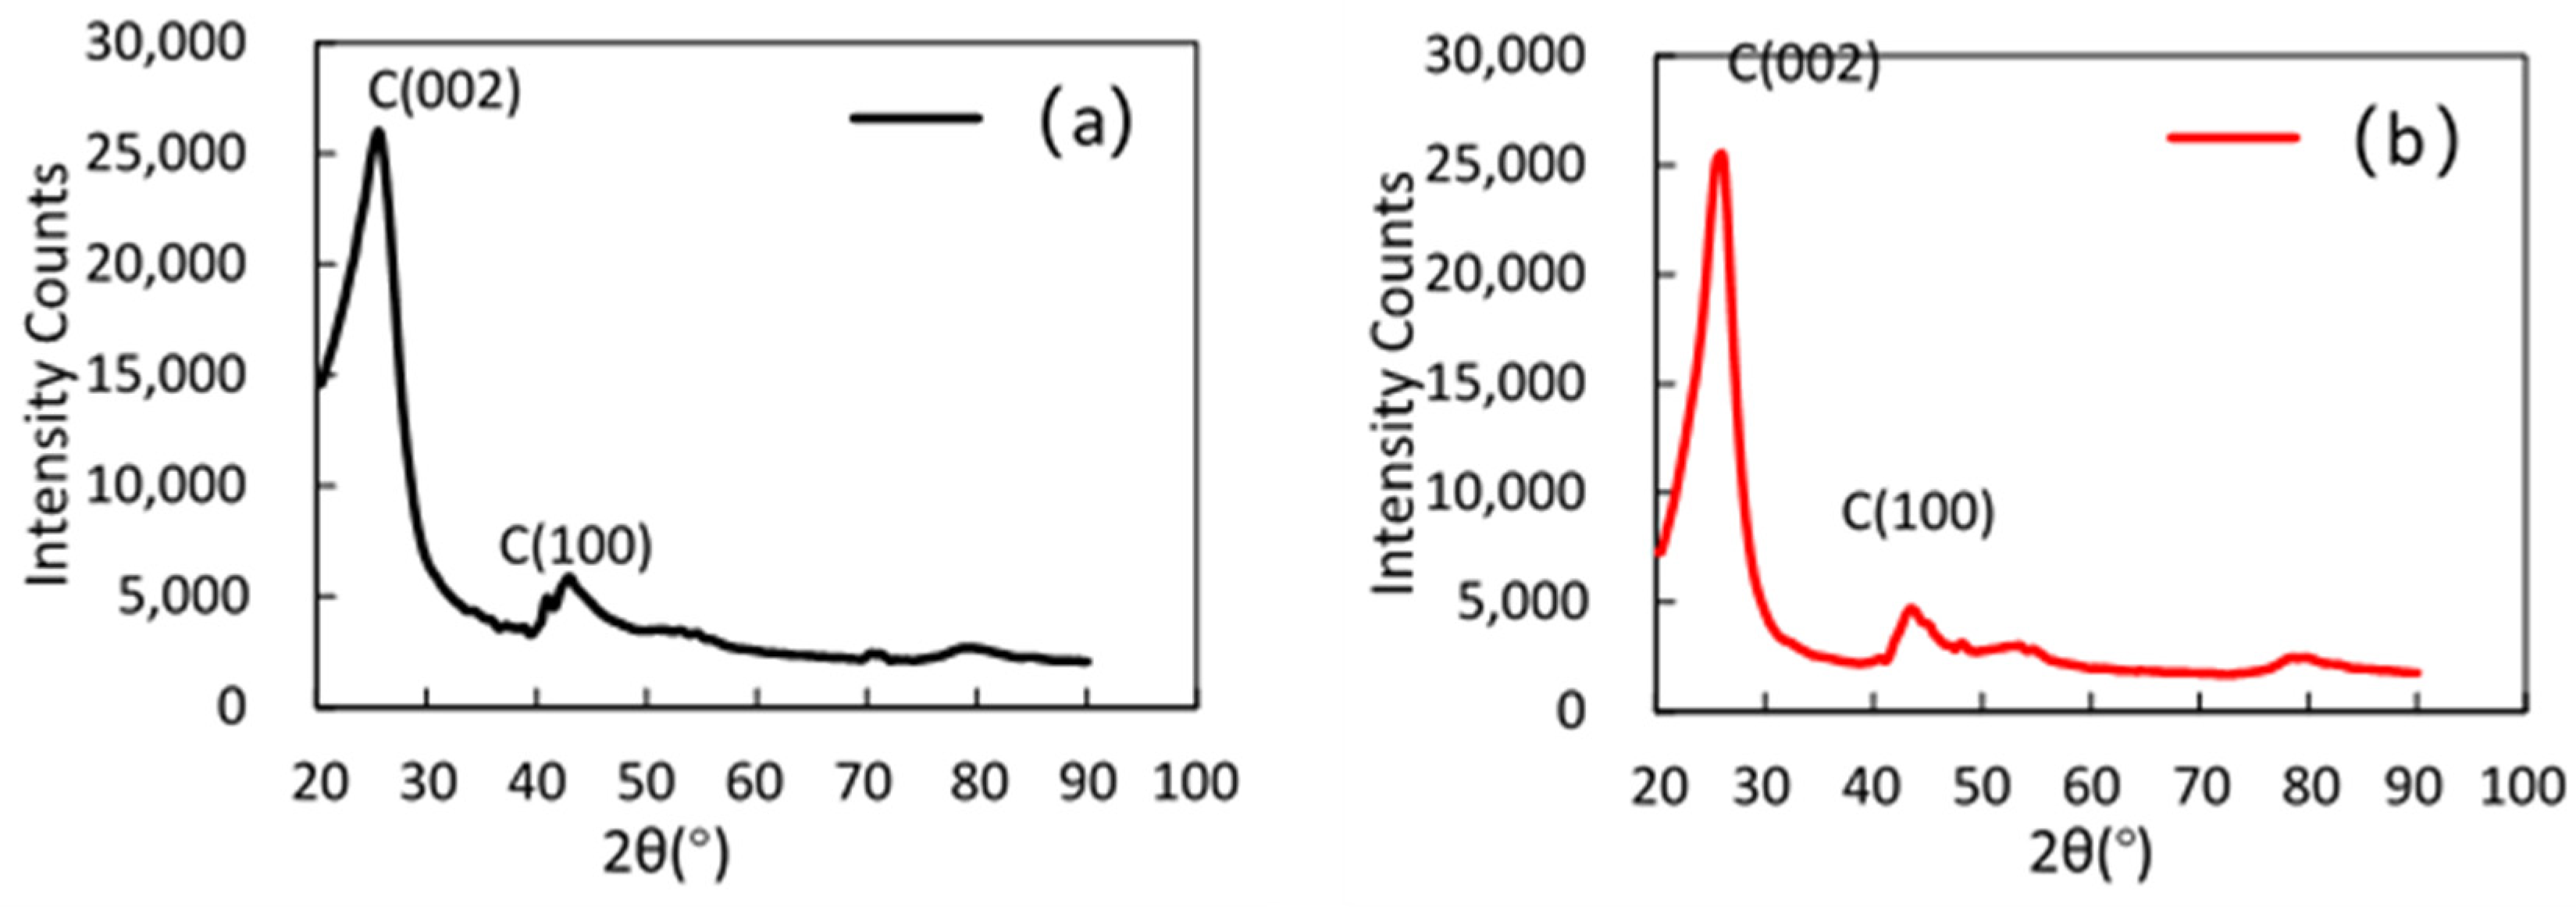
3.3. Raman Spectroscopic Detection and XRD Surface Crystallization Analysis

For the results of constant current charging and discharging, we performed Raman spectroscopy and XRD surface crystallographic analysis on two carbon felts.
In this paper, we use the common method of Raman spectroscopy to analyze carbon materials. There are two characteristic peaks in the Raman spectrum of carbon materials: the G peak near 1580 cm−1 and the D peak near 1360 cm−1 [35]. Researchers usually go through the D and G peaks. The integrated area ratio ID/IG is used to determine the integrity of the carbon material. The larger the ID/IG ratio, the lower the structural integrity of the carbon material. The smaller the ID/IG ratio, the higher the structural integrity of the carbon material [36,37]. In this study, the treated carbon fiber electrodes were tested by Raman spectroscopy using the NRS-4100 from JASCO (JASCO Corporation. Tokyo, Japan). The measured Raman spectra are shown in Figure 7, and the measured data are shown in Table 3. Combining the Raman spectra and the measured data, it can be seen that the peak shapes of the D and G peaks of the coated treated carbon felt became relatively sharp and obvious, the integrated area ratio and half-height width of the peaks also became smaller, the characteristic peak G’ appeared near 2700 cm−1 of the carbon felt and the ratio of ID/IG decreased by 0.068.
For the surface crystal structure, untreated and treated carbon fibers were analyzed using the RINT 2500 VHF from RIGAKU Corporation, Japan, under the following test conditions: voltage: 40 kV: 30 mA (Cu). The measurement results are shown in Figure 8. It can be seen that the shape of the (002) diffraction peak for 2θ = 25° is basically the same. However, the intensity of the peak increases after the coating treatment. There is no significant difference in the (100) diffraction peak at 2θ = 43°.
d 002 = λ 2 s i n θ
L = K λ β c o s θ
According to Equations (11) and (12), the layer spacing d002 of the carbon fibber graphite crystallites and the thickness of the crystallite stack Lc can be calculated [38]. The (100) peak in the XRD spectrum can be used to calculate the direction of the graphite crystallite along the axis, the crystal plane width La and the diffraction angle of the θ crystal plane diffraction peak; λ is the wavelength (λ = 0.1541 nm); K is the shape factor, K = 0.94 when Lc is calculated, and K = 1.84 when La is calculated; and β is the measured full width at half maximum. The calculation results are shown in Table 4.
From the comparison of the calculated results in Table 4, it can be found that there is no significant difference between the crystal spacing d002 and the crystal spacing d100 of the untreated and treated electrodes; the radial size Lc and the axial size La of the crystals of the treated carbon fiber electrodes become larger. The larger crystallite size indicates a more complete development and a higher degree of graphitization [39]. Therefore, it was theoretically demonstrated that the performance of the treated carbon cellulose electrodes was higher than that of the untreated electrodes.

4. Conclusions

In this paper, we improved the VRFB system by proposing a method for dispersion coating of CNTs on the surface of carbon electrodes. The following results were obtained from this study.
  • The performance of the existing carbon felt is improved by the CNT surface coating method. Charge and discharge data show that the current density of VRFB can reach up to 400 mA/cm2. At a current density of 200 mA/cm2, the energy efficiency is close to 80%, which is about 15% higher than that of the untreated carbon felt.
  • AC impedance data surfaced showing the treated carbon felt reduces the RP by 0.68 Ω and the RD by 0.96 Ω during charging and discharging, meaning that the charge and discharge internal resistance of VRFB is reduced by three times.
  • Raman and XRD analyses of the two carbon felts were performed, and the experimental results showed that the ID/IG of the treated carbon felts decreased by 0.068, while the XRD calculation data showed that the crystal radial size Lc and axial size La of the treated carbon fiber electrode became larger.
  • In this study, the performance of the coated treated carbon felts was tested, but the durability of the treated carbon felts needs further study.

Author Contributions

Data compilation, Z.T.; formal analysis, S.S., K.H. and Z.T.; funding access, D.J.; Surveys, Z.T. and K.H.; Methodology, Z.T. and D.J.; Project Management, D.J.; Software Z.T. Supervision, D.J.; Writing—original draft, Z.T.; Writing—review and editing, D.J. All authors have read and agreed to the published version of the manuscript.

Funding

This research was funded by the Ningbo Haizhi Institute of Material Industry Innovation, China.

Institutional Review Board Statement

Not applicable.

Informed Consent Statement

Not applicable.

Data Availability Statement

The data used to support the findings of this study are available from the corresponding author upon request.

Acknowledgments

This research is based on the support of the new multifunctional secondary battery energy storage project of the Ningbo Haizhi Material Industry Innovation Research Institute.

Conflicts of Interest

The authors declare no conflict of interest. The funders had no role in the design of the study; in the collection, analyses, or interpretation of data; in the writing of the manuscript, or in the decision to publish the results.

Nomenclature

Cconcentration (mol m−3)
Ddensity (*/L), where “*” is for other units
ddischarge/full width at half maxima
E efficiency (%)/energy
KK = 0.94
L length (m)
Ooutput density (W/L)
R area specific resistance (Ωcm2)
t thickness (m)
T time (s)
Ucharge and discharge voltage (V)
V cell voltage (V)/volume (L)
Greek Symbols
σ Warburg factor
λ wavelength (λ = 0.1541 nm)
θ angle (°)
β rad
ωfrequency
ohm
Superscripts and Subscripts
avg average charge process
discharge discharge process

References

  1. Thallerl, H.; Nice, A.W. Fluid battery prom ises economical storage. Power Eng. 1981, 85, 56–58. [Google Scholar]
  2. Thaller, L.H. Electrically Rechargeable Redox Flow Cells. In Proceedings of the 9th Intersociety Energy Conversion Engineering Conference, San Francisco, CA, USA, 26–30 August 1974; American Society of Mechanical Engineers: New York, NY, USA, 1974; pp. 924–928. [Google Scholar]
  3. Shunichi, U. Multipurpose redox flow battery. In Development Trend of Redox Flow Battery; CMC Publishing: Chattanooga, TN, USA, 2017; pp. 162–175. [Google Scholar]
  4. Kear, G.; Shah, A.A.; Walsh, F.C. Development of the all-vanadium redox flow battery for energy storage: A review of technological, financial and policy aspects. Int. J. Energy Res. 2012, 36, 1105–1120. [Google Scholar] [CrossRef]
  5. Holzman, D.C. The Vanadium Advantage: Flow Batteries Put Wind Energy in the Bank. Environ. Health Perspect. 2007, 115, A358–A361. [Google Scholar] [CrossRef] [Green Version]
  6. Shigematsu, T. Redox Flow Battery for Energy Storage. SEI Tech. Rev. 2011, 73, 4–13. [Google Scholar]
  7. Liu, X.; Li, K. Energy storage devices in electrified railway systems. Transp. Saf. Environ. 2020, 2, 183–201. [Google Scholar] [CrossRef]
  8. Jiang, H.; Wei, L.; Fan, X.; Xu, J.; Shyy, W.; Zhao, T. A novel energy storage system incorporating electrically rechargeable liquid fuels as the storage medium. Sci. Bull. 2019, 64, 270–280. [Google Scholar] [CrossRef] [Green Version]
  9. Ortiz-Martínez, V.M.; Gómez-Coma, L.; Perez, G.; Ortiz, A.; Ortiz, I. The roles of ionic liquids as new electrolytes in redox flow batteries. Sep. Purif. Technol. 2020, 252, 117436. [Google Scholar] [CrossRef]
  10. Doetsch, C.; Pohlig, A. The Use of Flow Batteries in Storing Electricity for National Grids. In Future Energy—Improved: Sustainable and Clean Options for Our Planet, 3rd ed.; Elsevier: Amsterdam, The Netherlands, 2020; pp. 263–277. [Google Scholar]
  11. Zhu, Z.; Meng, Y.; Wang, M.; Yin, Y.; Chen, W. A high-performance aqueous iron–hydrogen gas battery. Mater. Today Energy 2021, 19, 100603. [Google Scholar] [CrossRef]
  12. Larcher, D.; Tarascon, J.M. Towards greener and more sustainable batteries for electrical energy storage. Nat. Chem. 2015, 7, 19–29. [Google Scholar] [CrossRef]
  13. Gür, T.M. Review of electrical energy storage technologies, materials and systems: Challenges and prospects for large-scale grid storage. Energy Environ. Sci. 2018, 11, 2696–2767. [Google Scholar] [CrossRef]
  14. Skyllas-Kazacos, M.; Rychcik, M.; Robins, R.G.; Fane, A.G.; Green, M.A. New all-vanadium redox flow cell. J. Electrochem. Soc. 1986, 133, 1057. [Google Scholar] [CrossRef]
  15. Wu, Q.; Zhang, X.; Lv, Y.; Lin, L.; Liu, Y.; Zhou, X. Bio-inspired multiscale-pore-network structured carbon felt with enhanced mass transfer and activity for vanadium redox flow batteries. J. Mater. Chem. 2018, 6, 20347–20355. [Google Scholar] [CrossRef]
  16. Wu, X.; Xu, H.; Shen, Y.; Xu, P.; Lu, L.; Fu, J.; Zhao, H. Treatment of graphite felt by modified Hummers method for the positive electrode of vanadium redox flow battery. Electrochim. Acta 2014, 138, 264–269. [Google Scholar] [CrossRef]
  17. Jiang, H.R.; Shyy, W.; Wu, M.C.; Wei, L.; Zhao, T.S. Highly active, bi-functional and metal-free B4C-nanoparticle-modified graphite felt electrodes for vanadium redox flow batteries. J. Power Sources 2017, 365, 34–42. [Google Scholar] [CrossRef]
  18. Zhang, J.; Jiang, G.; Xu, P.; Kashkooli, A.G.; Mousavi, M.; Yu, A.; Chen, Z. An all-aqueous redox flow battery with unprecedented energy density. Energy Environ. 2018, 11, 2010–2015. [Google Scholar] [CrossRef]
  19. Kim, S.; Choi, J.; Choi, C.; Heo, J.; Kim, D.W.; Lee, J.Y.; Hong, Y.T.; Jung, H.T.; Kim, H.T. Pore-Size-Tuned Graphene Oxide Frameworks as Ion-Selective and Protective Layers on Hydrocarbon Membranes for Vanadium Redox-Flow Batteries. Nano Lett. 2018, 18, 3962–3968. [Google Scholar] [CrossRef]
  20. Zhu, H.Q.; Zhang, Y.M.; Yue, L.; Li, W.S.; Li, G.L.; Shu, D.; Chen, H.Y. Graphite–carbon nanotube composite electrodes for all vanadium redox flow battery. J. Power Sources 2008, 184, 637–640. [Google Scholar] [CrossRef]
  21. Saha, A.; Basiruddin, S.K.; Ray, S.C.; Roy, S.S.; Jana, N.R. Functionalized graphene and graphene oxide solution via polyacrylate coating. Nanoscale 2010, 2, 2777–2782. [Google Scholar] [CrossRef] [PubMed]
  22. Pezeshki, A.M.; Clement, J.T.; Veith, G.M.; Zawodzinski, T.A.; Mench, M.M. High performance electrodes in vanadium redox flow batteries through oxygen-enriched thermal activation. J. Power Sources 2015, 294, 333–338. [Google Scholar] [CrossRef] [Green Version]
  23. So, S.; Cha, M.S.; Jo, S.W.; Kim, T.H.; Lee, J.Y.; Hong, Y.T. Hydrophilic Channel Alignment of Perfluoronated Sulfonic-Acid Ionomers for Vanadium Redox Flow Batteries. ACS Appl. Mater. Interfaces 2018, 10, 19689–19696. [Google Scholar] [CrossRef] [PubMed]
  24. Zeng, L.; Sun, J.; Zhao, T.S.; Ren, Y.X.; Wei, L. Balancing the specific surface area and mass diffusion property of electrospun carbon fibers to enhance the cell performance of vanadium redox flow battery. Int. J. Hydrogen Energy 2020, 45, 12565–12576. [Google Scholar] [CrossRef]
  25. Di Blasi, A.; Busacca, C.; Di Blasi, O.; Briguglio, N.; Antonucci, V. Synthesis and characterization of electrospun nickel-carbon nanofibers as electrodes for vanadium redox flow battery. J. Electrochem. Soc. 2018, 165, 1478–1485. [Google Scholar] [CrossRef]
  26. Maharjan, M.; Bhattarai, A.; Ulaganathan, M.; Wai, N.; Oo, M.O.; Wang, J.Y.; Lim, T.M. High surface area bio-waste based carbon as a superior electrode for vanadium redox flow battery. J. Power Sources 2017, 362, 50–56. [Google Scholar] [CrossRef] [Green Version]
  27. Ulaganathan, M.; Jain, A.; Aravindan, V.; Jayaraman, S.; Ling, W.C.; Lim, T.M.; Srinivasan, M.P.; Yan, Q.; Madhavi, S. Bio-mass derived mesoporous carbon as superior electrode in all vanadium redox flow battery with multicouple reactions. J. Power Sources 2015, 274, 846–850. [Google Scholar] [CrossRef]
  28. Wei, G.J.; Gao, Z.G.; Wei, Z.F.; Fan, X.Z.; Liu, J.G.; Yan, C.W. Coupling effect between the structure and surface characteristics of electrospun carbon nanofibres on the electrochemical activity towards the VO2þ/VO2þ redox couple. Phys. Chem. Chem. Phys. 2015, 17, 20368–20375. [Google Scholar] [CrossRef]
  29. Zeng, L.; Zhao, T.; Wei, L. Revealing the performance enhancement of oxygenated carbonaceous materials for vanadium redox flow batteries: Functional groups or specific surface area? Adv. Sustain. Syst. 2018, 2, 1700148. [Google Scholar] [CrossRef]
  30. Estevez, L.; Reed, D.; Nie, Z.; Schwarz, A.M.; Nandasiri, M.I.; Kizewski, J.P.; Wang, W.; Thomsen, E.; Liu, J.; Zhang, J.G.; et al. Tunable oxygen functional groups as electrocatalysts on graphite felt surfaces for all-vanadium flow batteries. Chemsuschem 2016, 9, 1455–1461. [Google Scholar] [CrossRef] [PubMed]
  31. Yarlagadda, V.; Lin, G.; Chong, P.Y.; Van Nguyen, T. High Surface Area Carbon Electrodes for Bromine Reactions in H2-Br2 Fuel Cells. J. Electrochem. Soc. 2016, 163, 5126–5133. [Google Scholar] [CrossRef] [Green Version]
  32. Yarlagadda, V.; Lin, G.; Chong, P.Y.; Van Nguyen, T. High Active Surface Area and Durable Multi-Wall Carbon Nanotube-Based Electrodes for the Bromine Reactions in H2-Br2 Fuel Cells. J. Electrochem. Soc. 2016, 163, 5134–5143. [Google Scholar] [CrossRef] [Green Version]
  33. Jiang, H.R.; Shyy, W.; Wu, M.C.; Zhang, R.H.; Zhao, T.S. A bi-porous graphite felt electrode with enhanced surface area and catalytic activity for vanadium redox flow batteries. Appl. Energy 2019, 233–234, 105–113. [Google Scholar] [CrossRef]
  34. Jiang, H.R.; Sun, J.; Wei, L.; Wu, M.C.; Shyy, W.; Zhao, T.S. A high power density and long cycle life vanadium redox flow battery. Energy Storage Mater. 2020, 24, 529–540. [Google Scholar] [CrossRef]
  35. Tuinstra, F.; Koenig, J.L. Characterization of graphite fiber surfaces with Raman spectroscopy D. J. Compos. Mater. 1970, 4, 492–499. [Google Scholar] [CrossRef]
  36. Nakamizo, M.; Honda, H.; Inagaki, M. Raman spectra of ground natural graphite. Carbon 1978, 16, 281–283. [Google Scholar] [CrossRef]
  37. Nemanich, R.J.; Solin, S.A. First and second-order Raman seattering from finite-size crystals of graphite O. Phys. Rev. B 1979, B20, 39240. [Google Scholar]
  38. Zhu, B.; Cao, W.; Wu, Y.; Cai, X.; Zhao, W. Effect of high temperature heat treatment on RMS spectrum property of carbon felt. Heat Treat. Metals 2011, 36, 8. [Google Scholar]
  39. Min, J. Comparison of the Microstructure of Toray T800H and T800S Carbon Fibers. Mater. Sci. Technol. 2015, 23, 45–52. [Google Scholar]
Figure 1. CNT dispersion and carbon fiber modification.
Coatings 11 00736 g001
Figure 2. (a) Dispersion results of 0.006 g CNTs in 80% ethanol solution, (b) Dispersion results of 0.006g CNTs in 0.1 mol/L SDBS ethanol solution and (c) Dispersion results of 0.006 g CNTs in 2% SDBS aqueous solution.
Coatings 11 00736 g002
Figure 3. Comparison of SEM images of untreated carbon felts (top) (a1) is a 1000 magnification image of untreated carbon fiber, (a2) is a 2500 magnification image, and (a3) is a 5000 magnification image, and treated carbon felts (bottom). (b1) 1000 magnification image of carbon fiber after processing, (b2) 2000 magnification image, and (b3) 5000 magnification image.
Coatings 11 00736 g003
Figure 4. EDS surface elemental analysis results for (a) untreated carbon felt and (b) carbon felt after attachment treatment.
Coatings 11 00736 g004
Figure 5. Charge and discharge data. (a) Constant-current charge/discharge experiment for untreated electrode. (b) Constant-current charge/discharge experiment of treated electrode.
Coatings 11 00736 g005
Figure 6. Single battery cell Nyquist figure. (a) AC impedance results of untreated electrode, (b) AC impedance results of the treated electrode.
Coatings 11 00736 g006
Figure 7. Structural analysis result by Raman spectroscopy. (a) Raman spectra of untreated electrode. (b) Raman spectra of treated electrodes.
Coatings 11 00736 g007
Figure 8. Results of crystal structure analysis by XRD: (a) unprocessed; (b) processed.
Coatings 11 00736 g008
Table 1. EDS Surface Element Analysis Results Comparison.
C Ka (%)O Ka (%)O/C
(a)87.2312.770.14
(b)91.488.520.09
Table 2. Constant Current Charge and Discharge Data (A: Untreated Carbon Felt; B: Treated Carbon Felt).
100 mA/cm2200 mA/cm2300 mA/cm2400 mA/cm2
ABABABAB
IR (Ω)1.7150.651.340.561.250.61-0.68
EV (%)77.6390.9566.0284.7258.0382.61-75.35
EC (%)82.7388.1396.4792.5092.1782.61-88.31
OD (W/L)297.5326.5270.5314.75246.523750-283.5
ED (Wh/L)100.16255.7649.29129.4010.481253.47-53.55
EE (%)64.2280.1563.6978.3753.4968.24-66.54
Table 3. Calculated Results of Raman Analysis.
SampleD PeakG PeakID/IG
(Area)
Raman Shift
(cm−1)
FWHM
(cm−1)
Raman Shift
(cm−1)
FWHM
(cm−1)
a1252307.331487147.811.038
b125571.90149152.010.97
Table 4. XRD Patterns of Untreated and Treated Carbon Felts (a: Untreated; b: Treated Carbon Felts).
CFC (002) Crystallographic PlaneC (100) Crystallographic Plane
2θd/nmβ/radLc/nm2θd/nmβ/radLa/nm
a25.60.3560.1411.05442.80.2281.3850.221
b25.80.3540.1001.48843.40.2241.2370.246
Publisher’s Note: MDPI stays neutral with regard to jurisdictional claims in published maps and institutional affiliations.

