
Numerical Simulation of Plasma Jet Characteristics under Very Low-Pressure Plasma Spray Conditions


Abstract
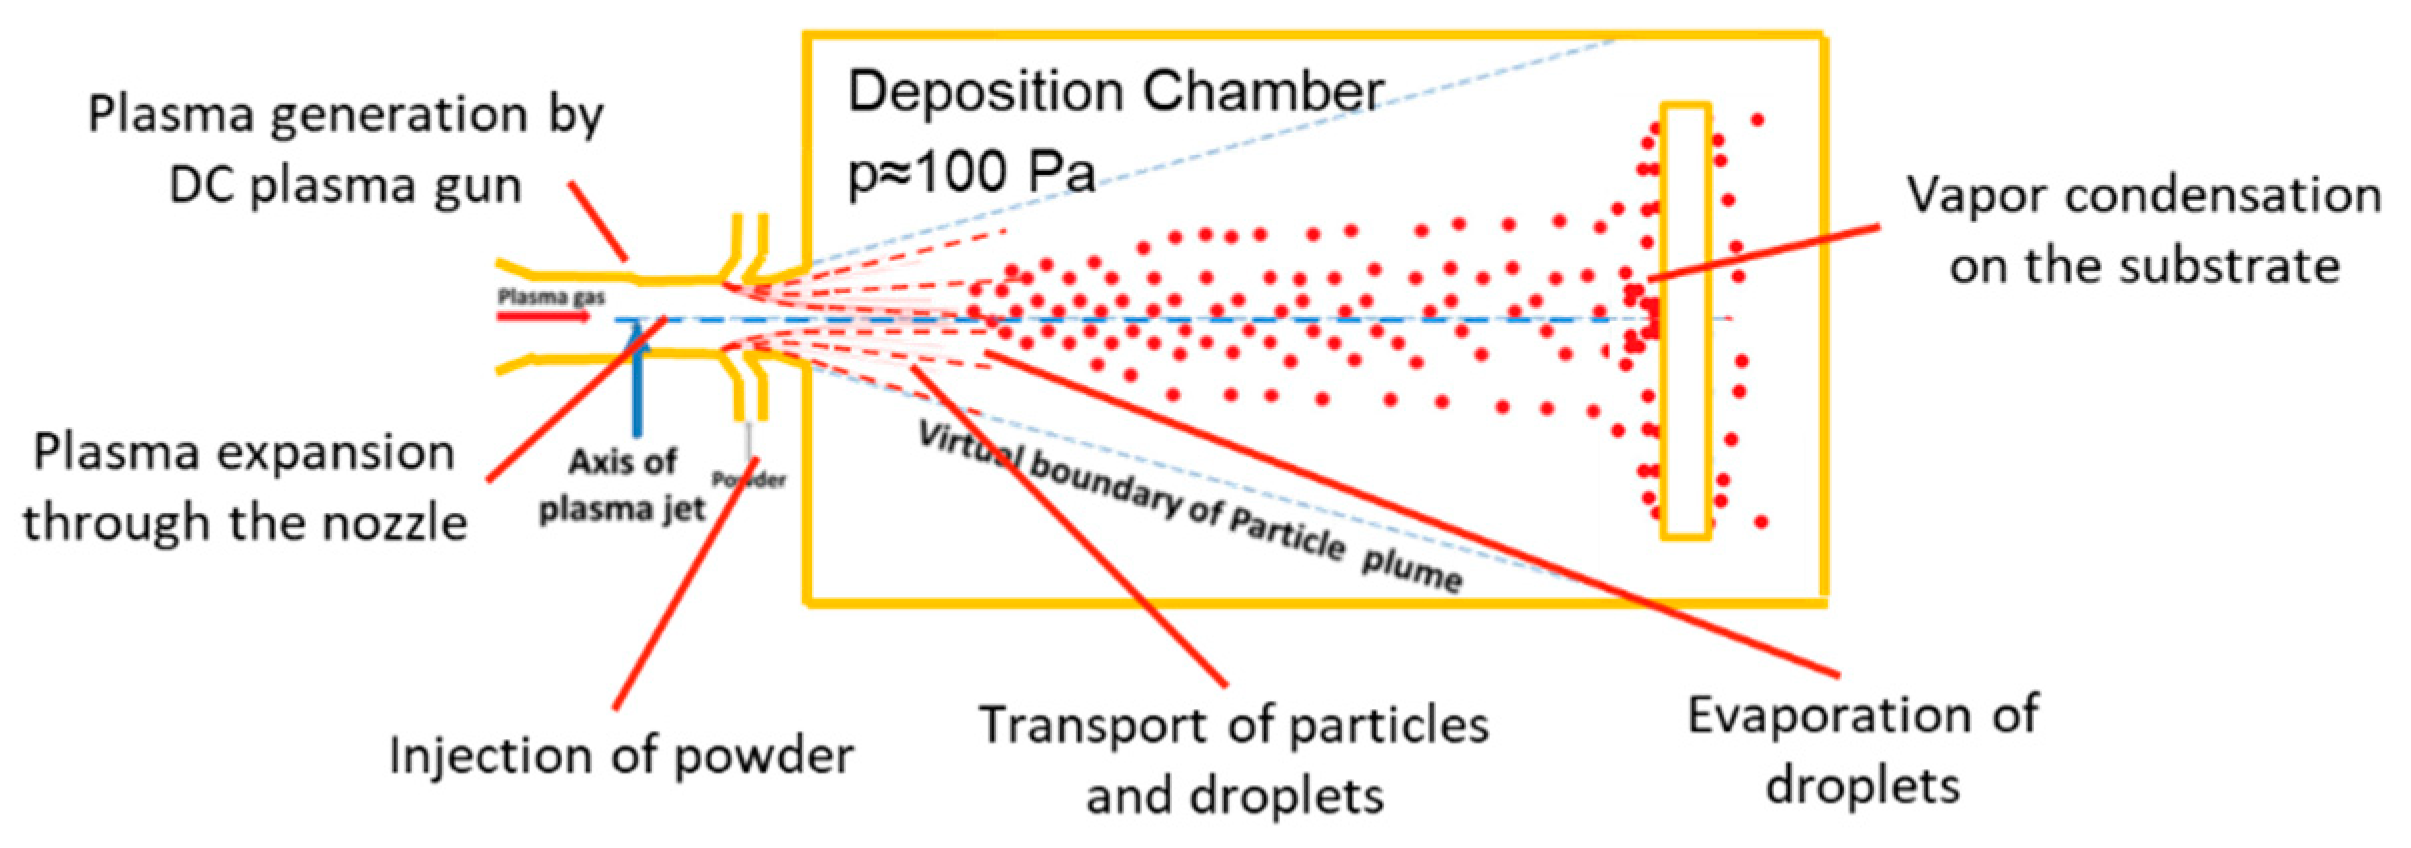
1. Introduction
2. CFD Methods
2.1. Basic Assumptions of the Model and Governing Equations
- -
- The plasma and environmental gas in the deposition chamber were the same;
- -
- The plasma properties depended on both temperature and pressure;
- -
- The plasma jet was stationary, compressible and 2D axi-symmetrical. An axisymmetric model was used due to the azimuthal uniformity of the flows inside the expansion nozzle and downstream from it;
- -
- The plasma was optically thin and in local thermodynamic equilibrium (LTE).
2.2. Operating Conditions of the PS-PVD System and Gas Thermodynamic and Transport Properties
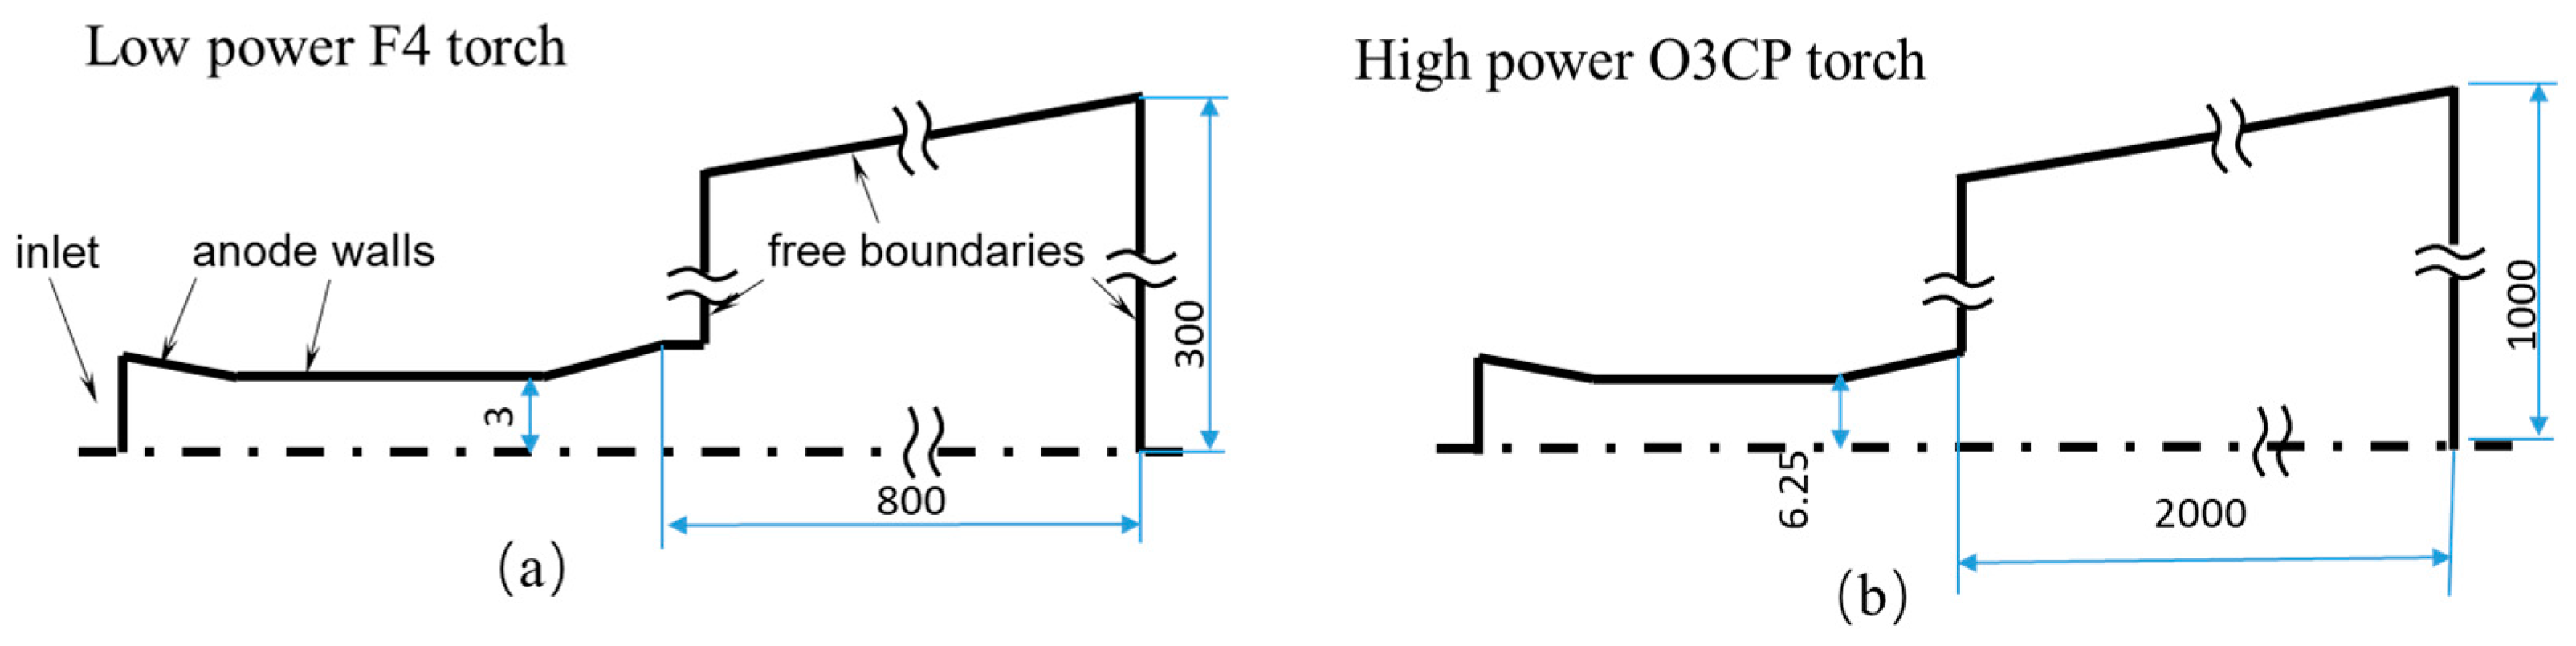
2.3. Computational Domain and Boundary Conditions
2.4. Continuum Breakdown Parameter
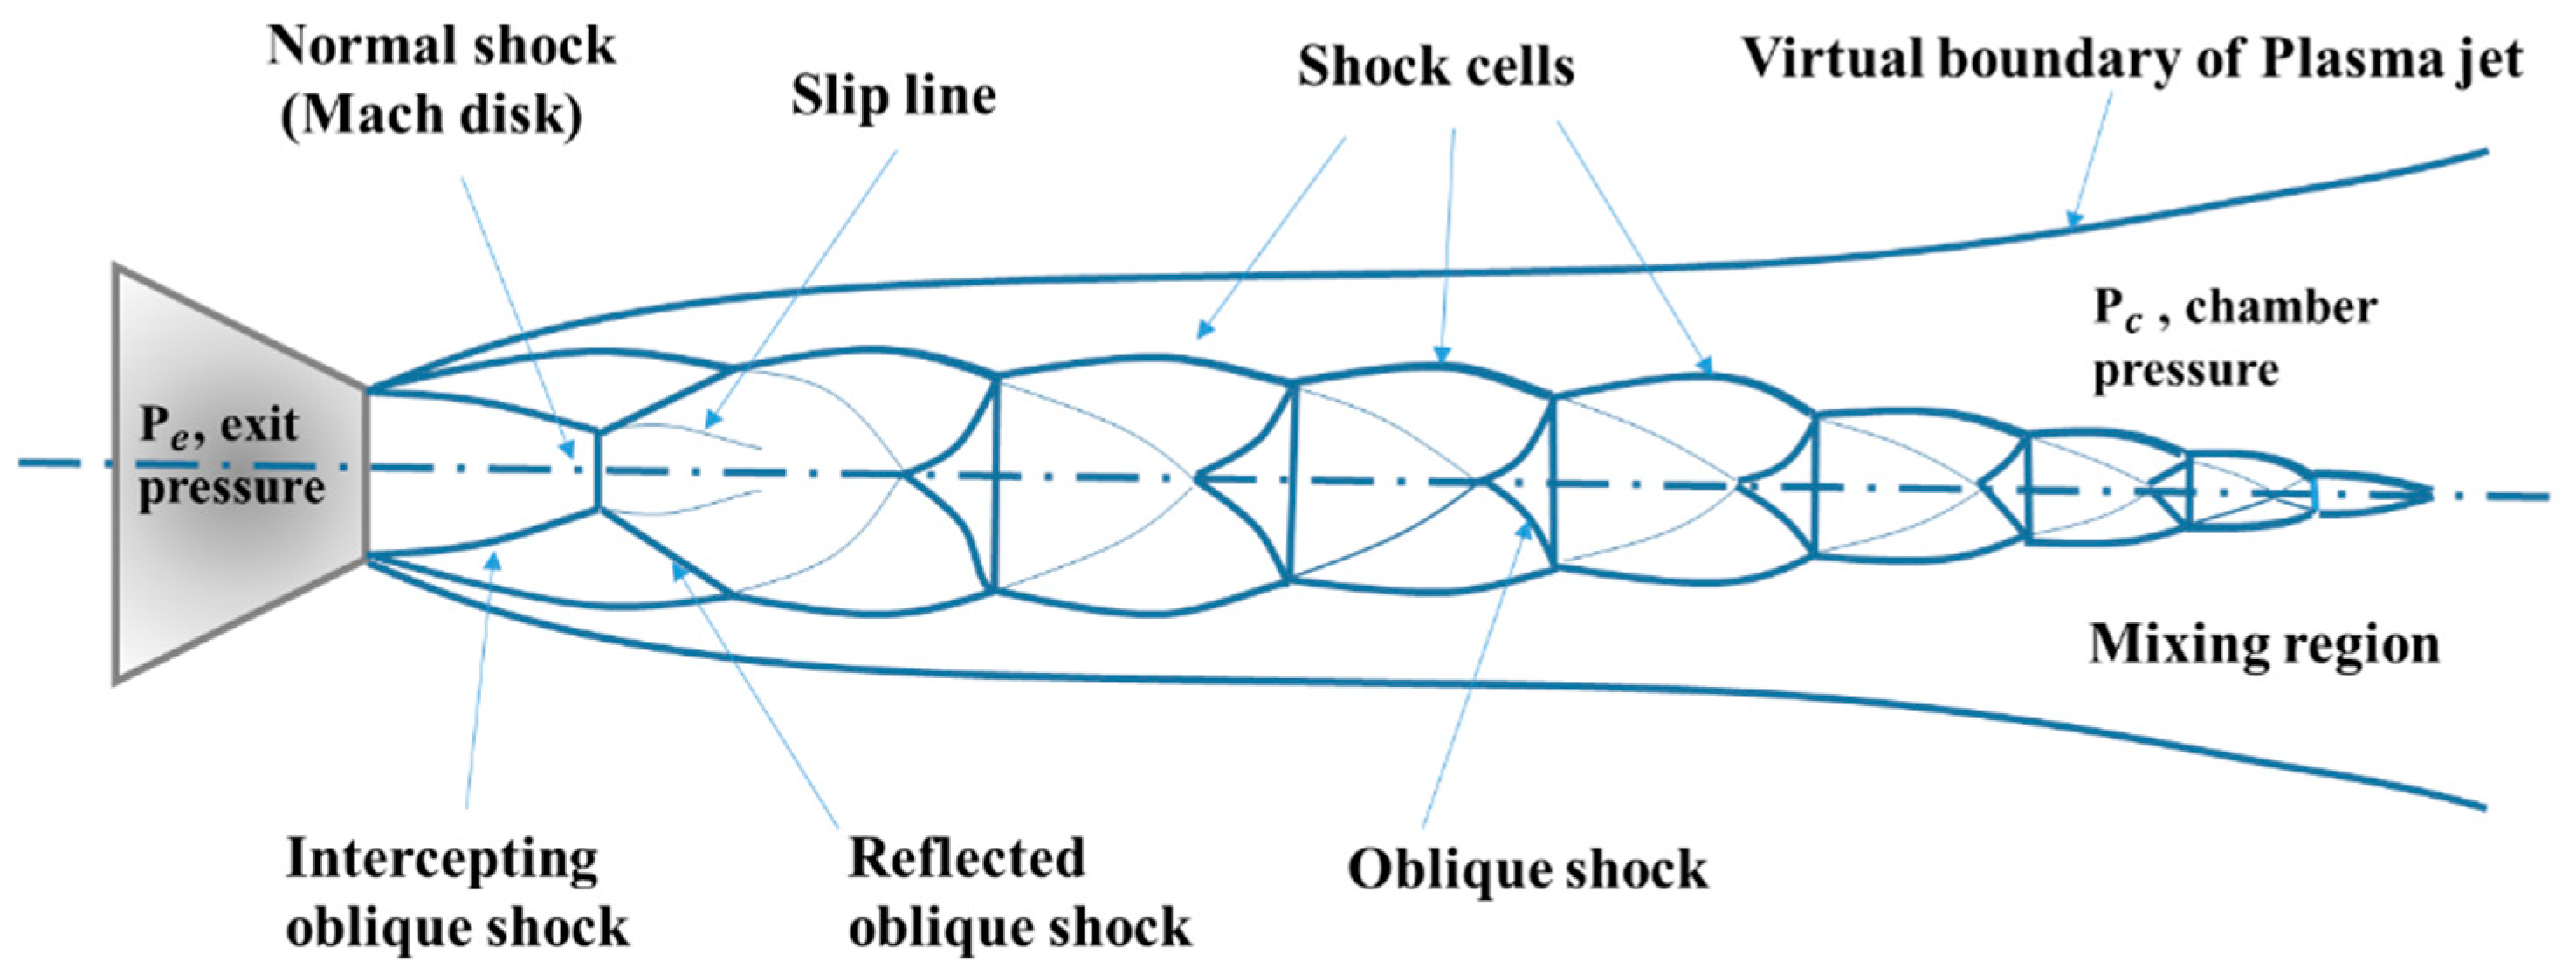
3. Results and Discussion
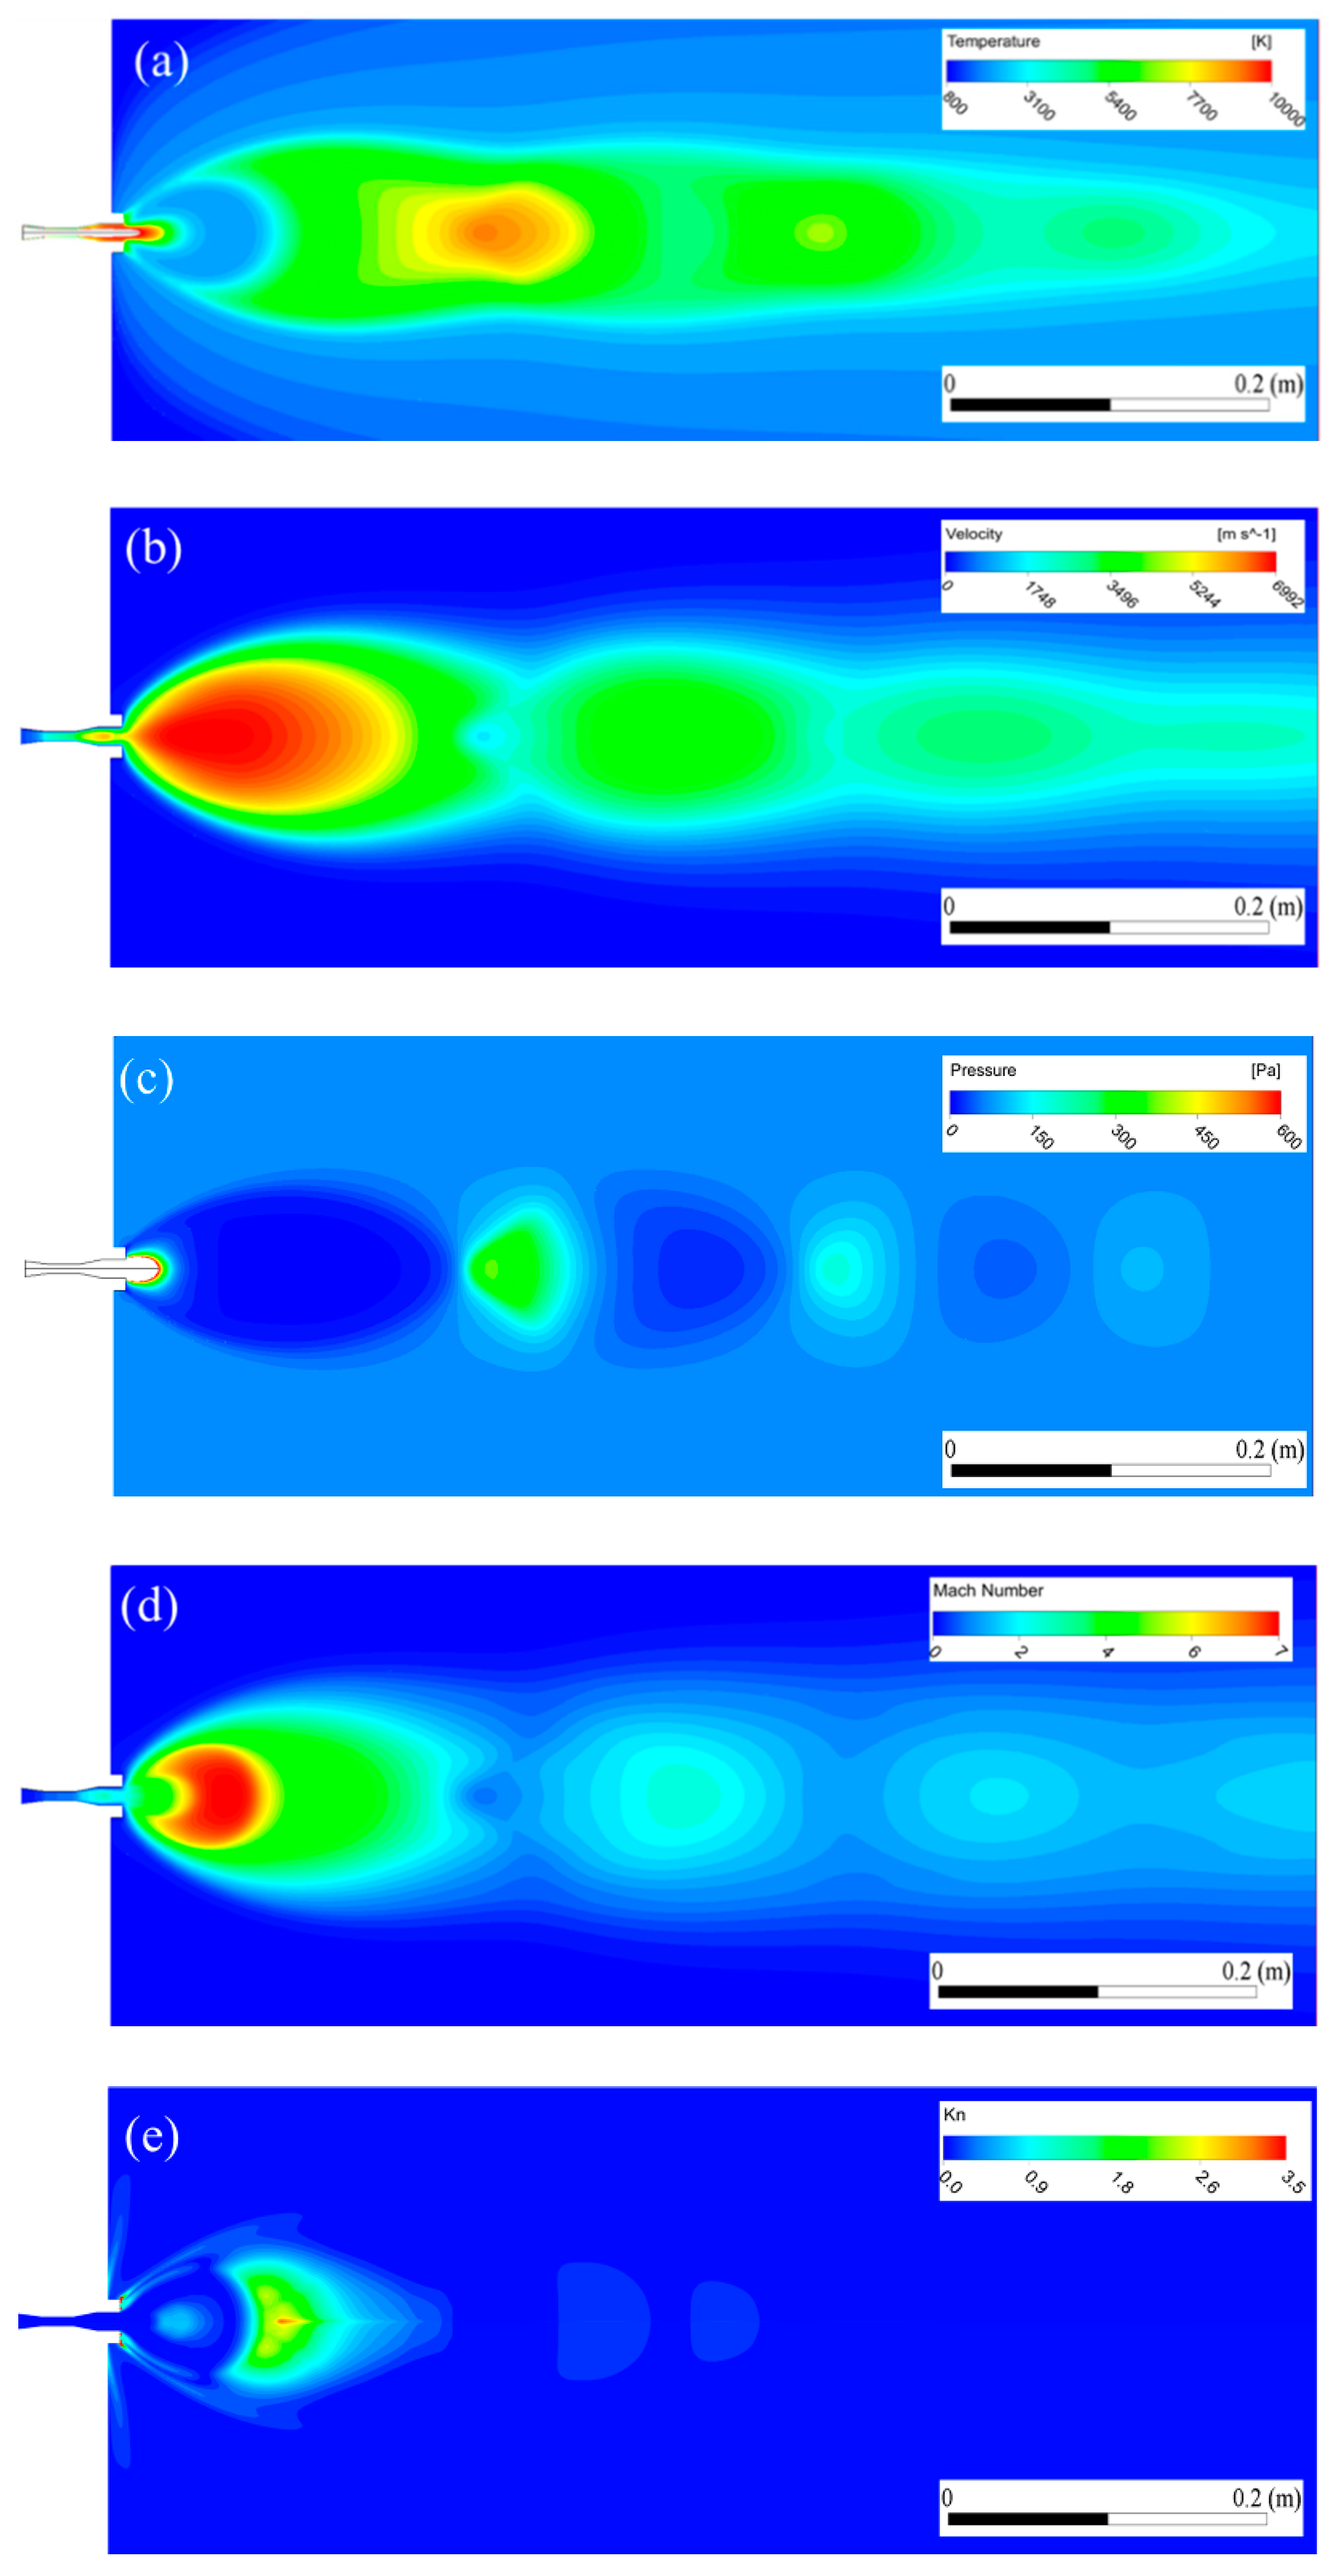
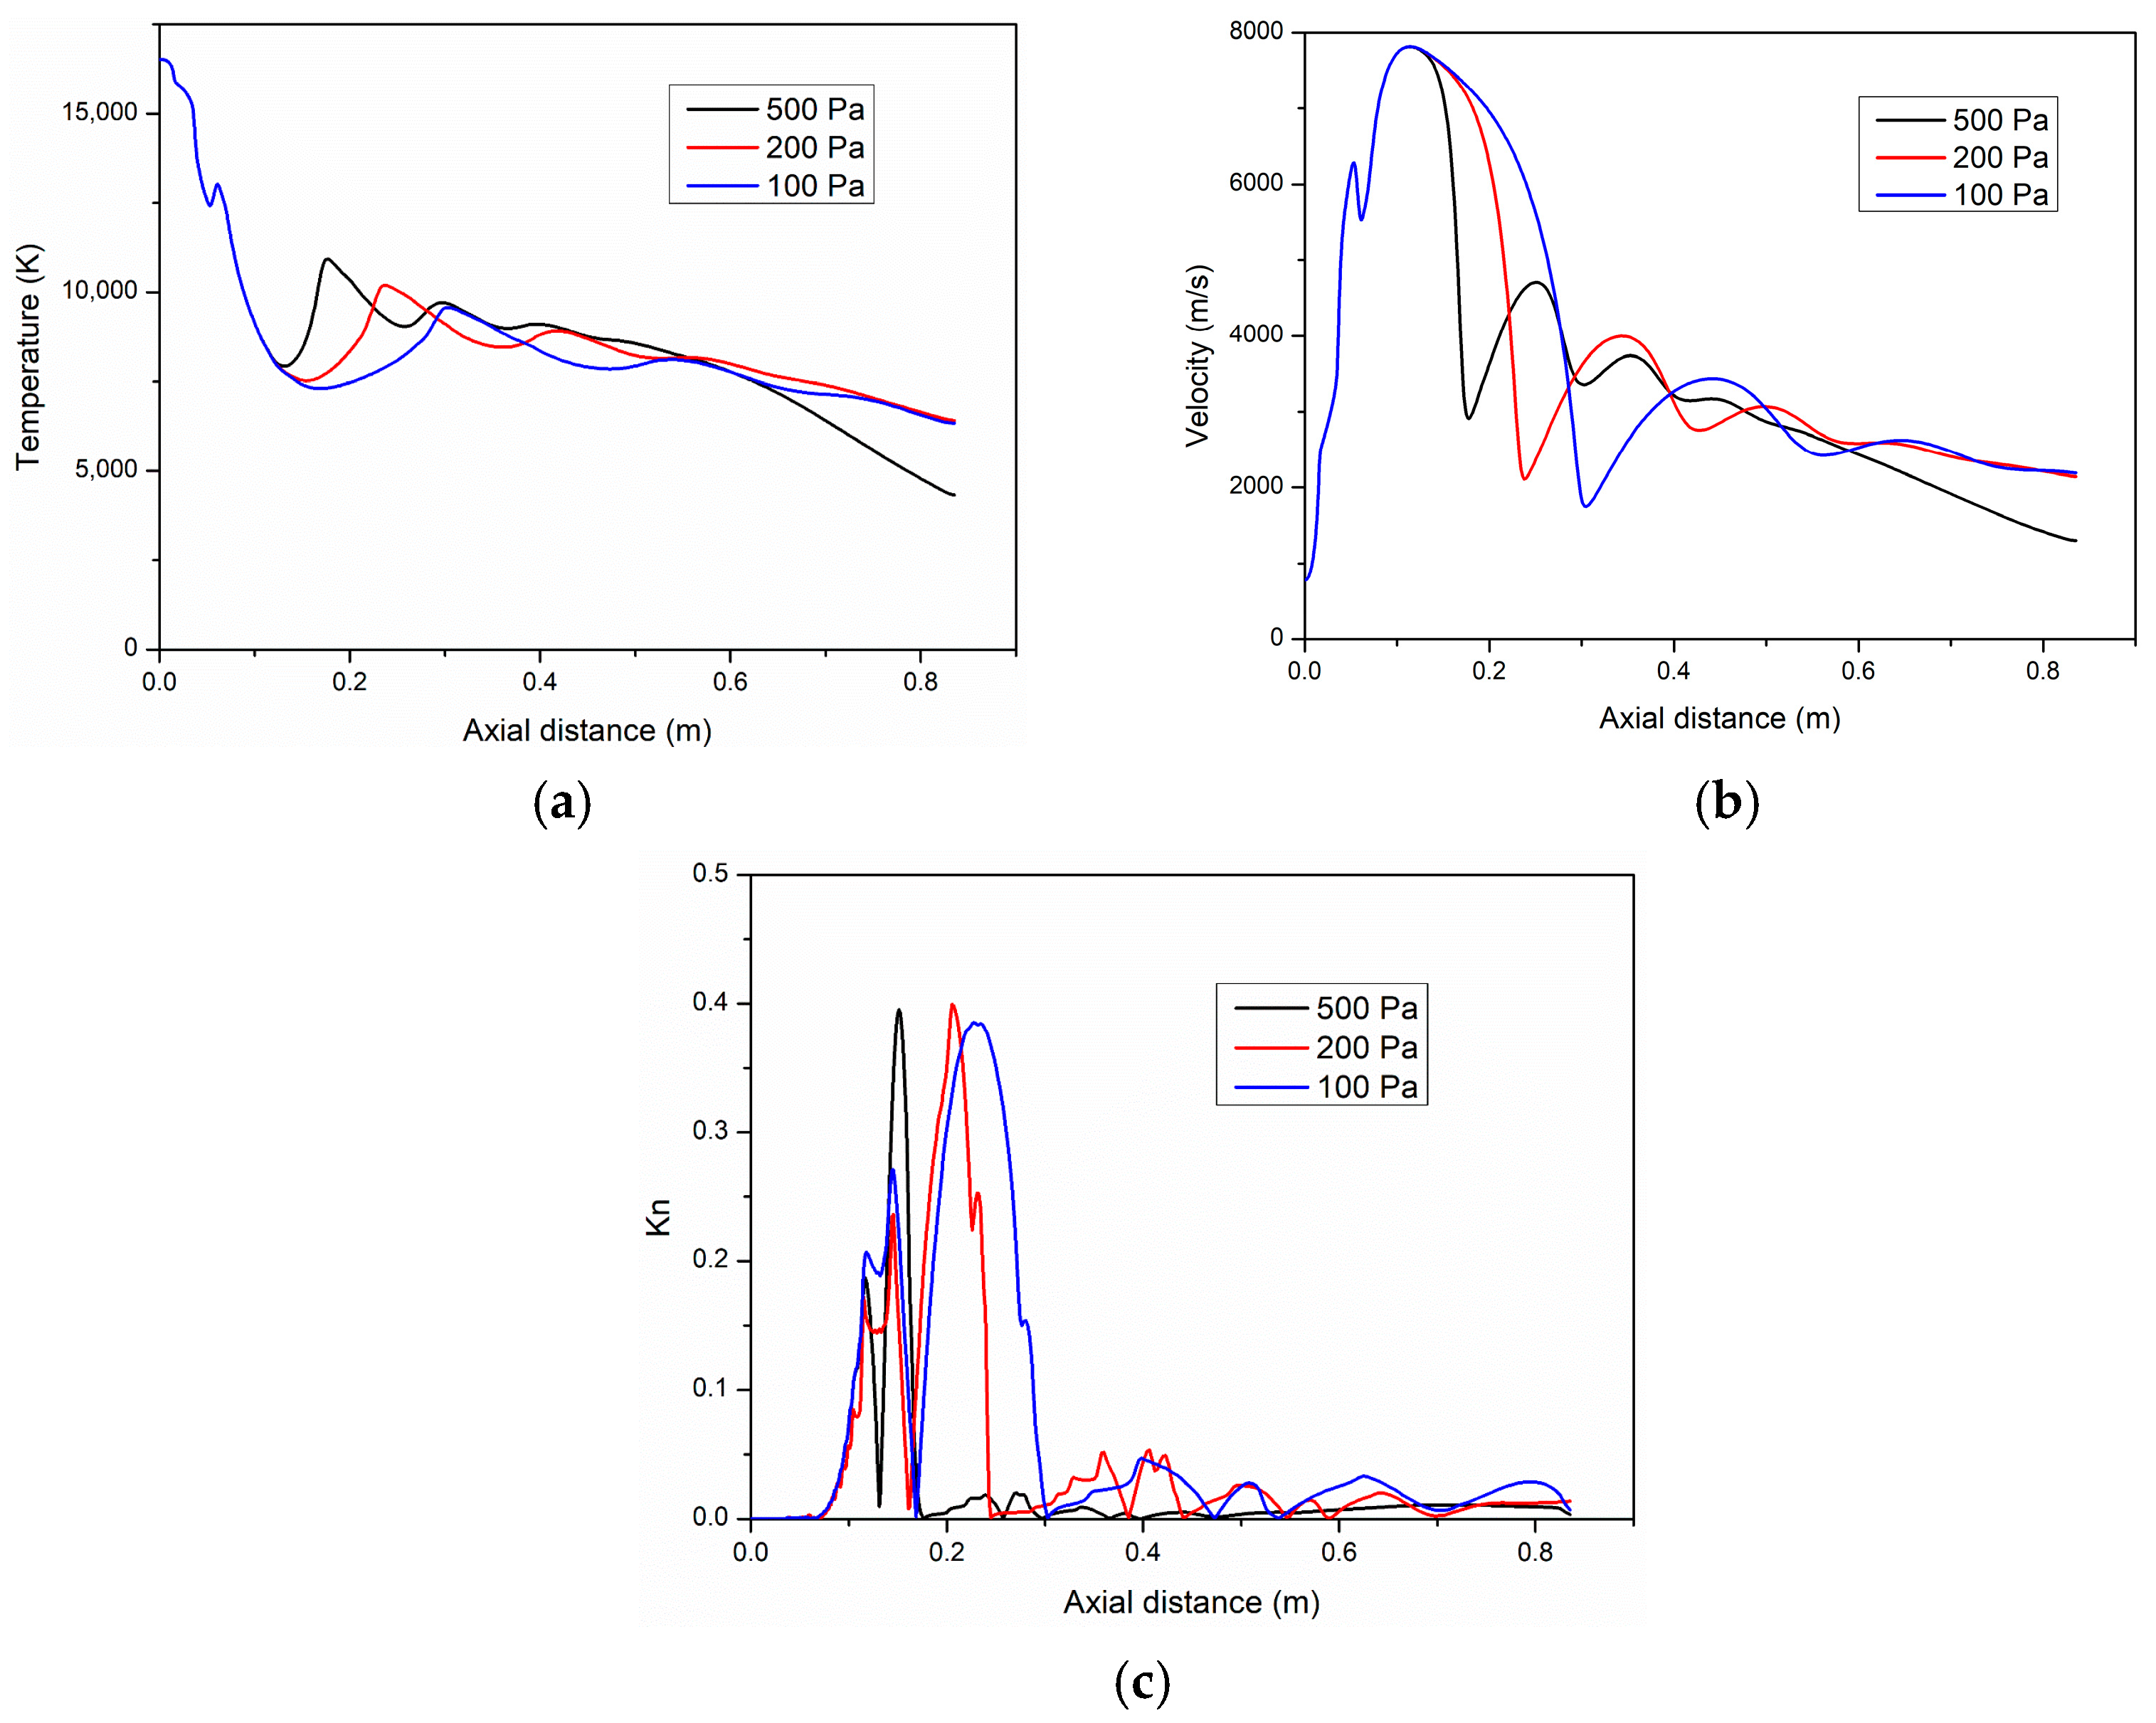
3.1. Characteristic Features of Plasma Jets at 100 Pa
3.1.1. Ar–H2 Plasma Jet
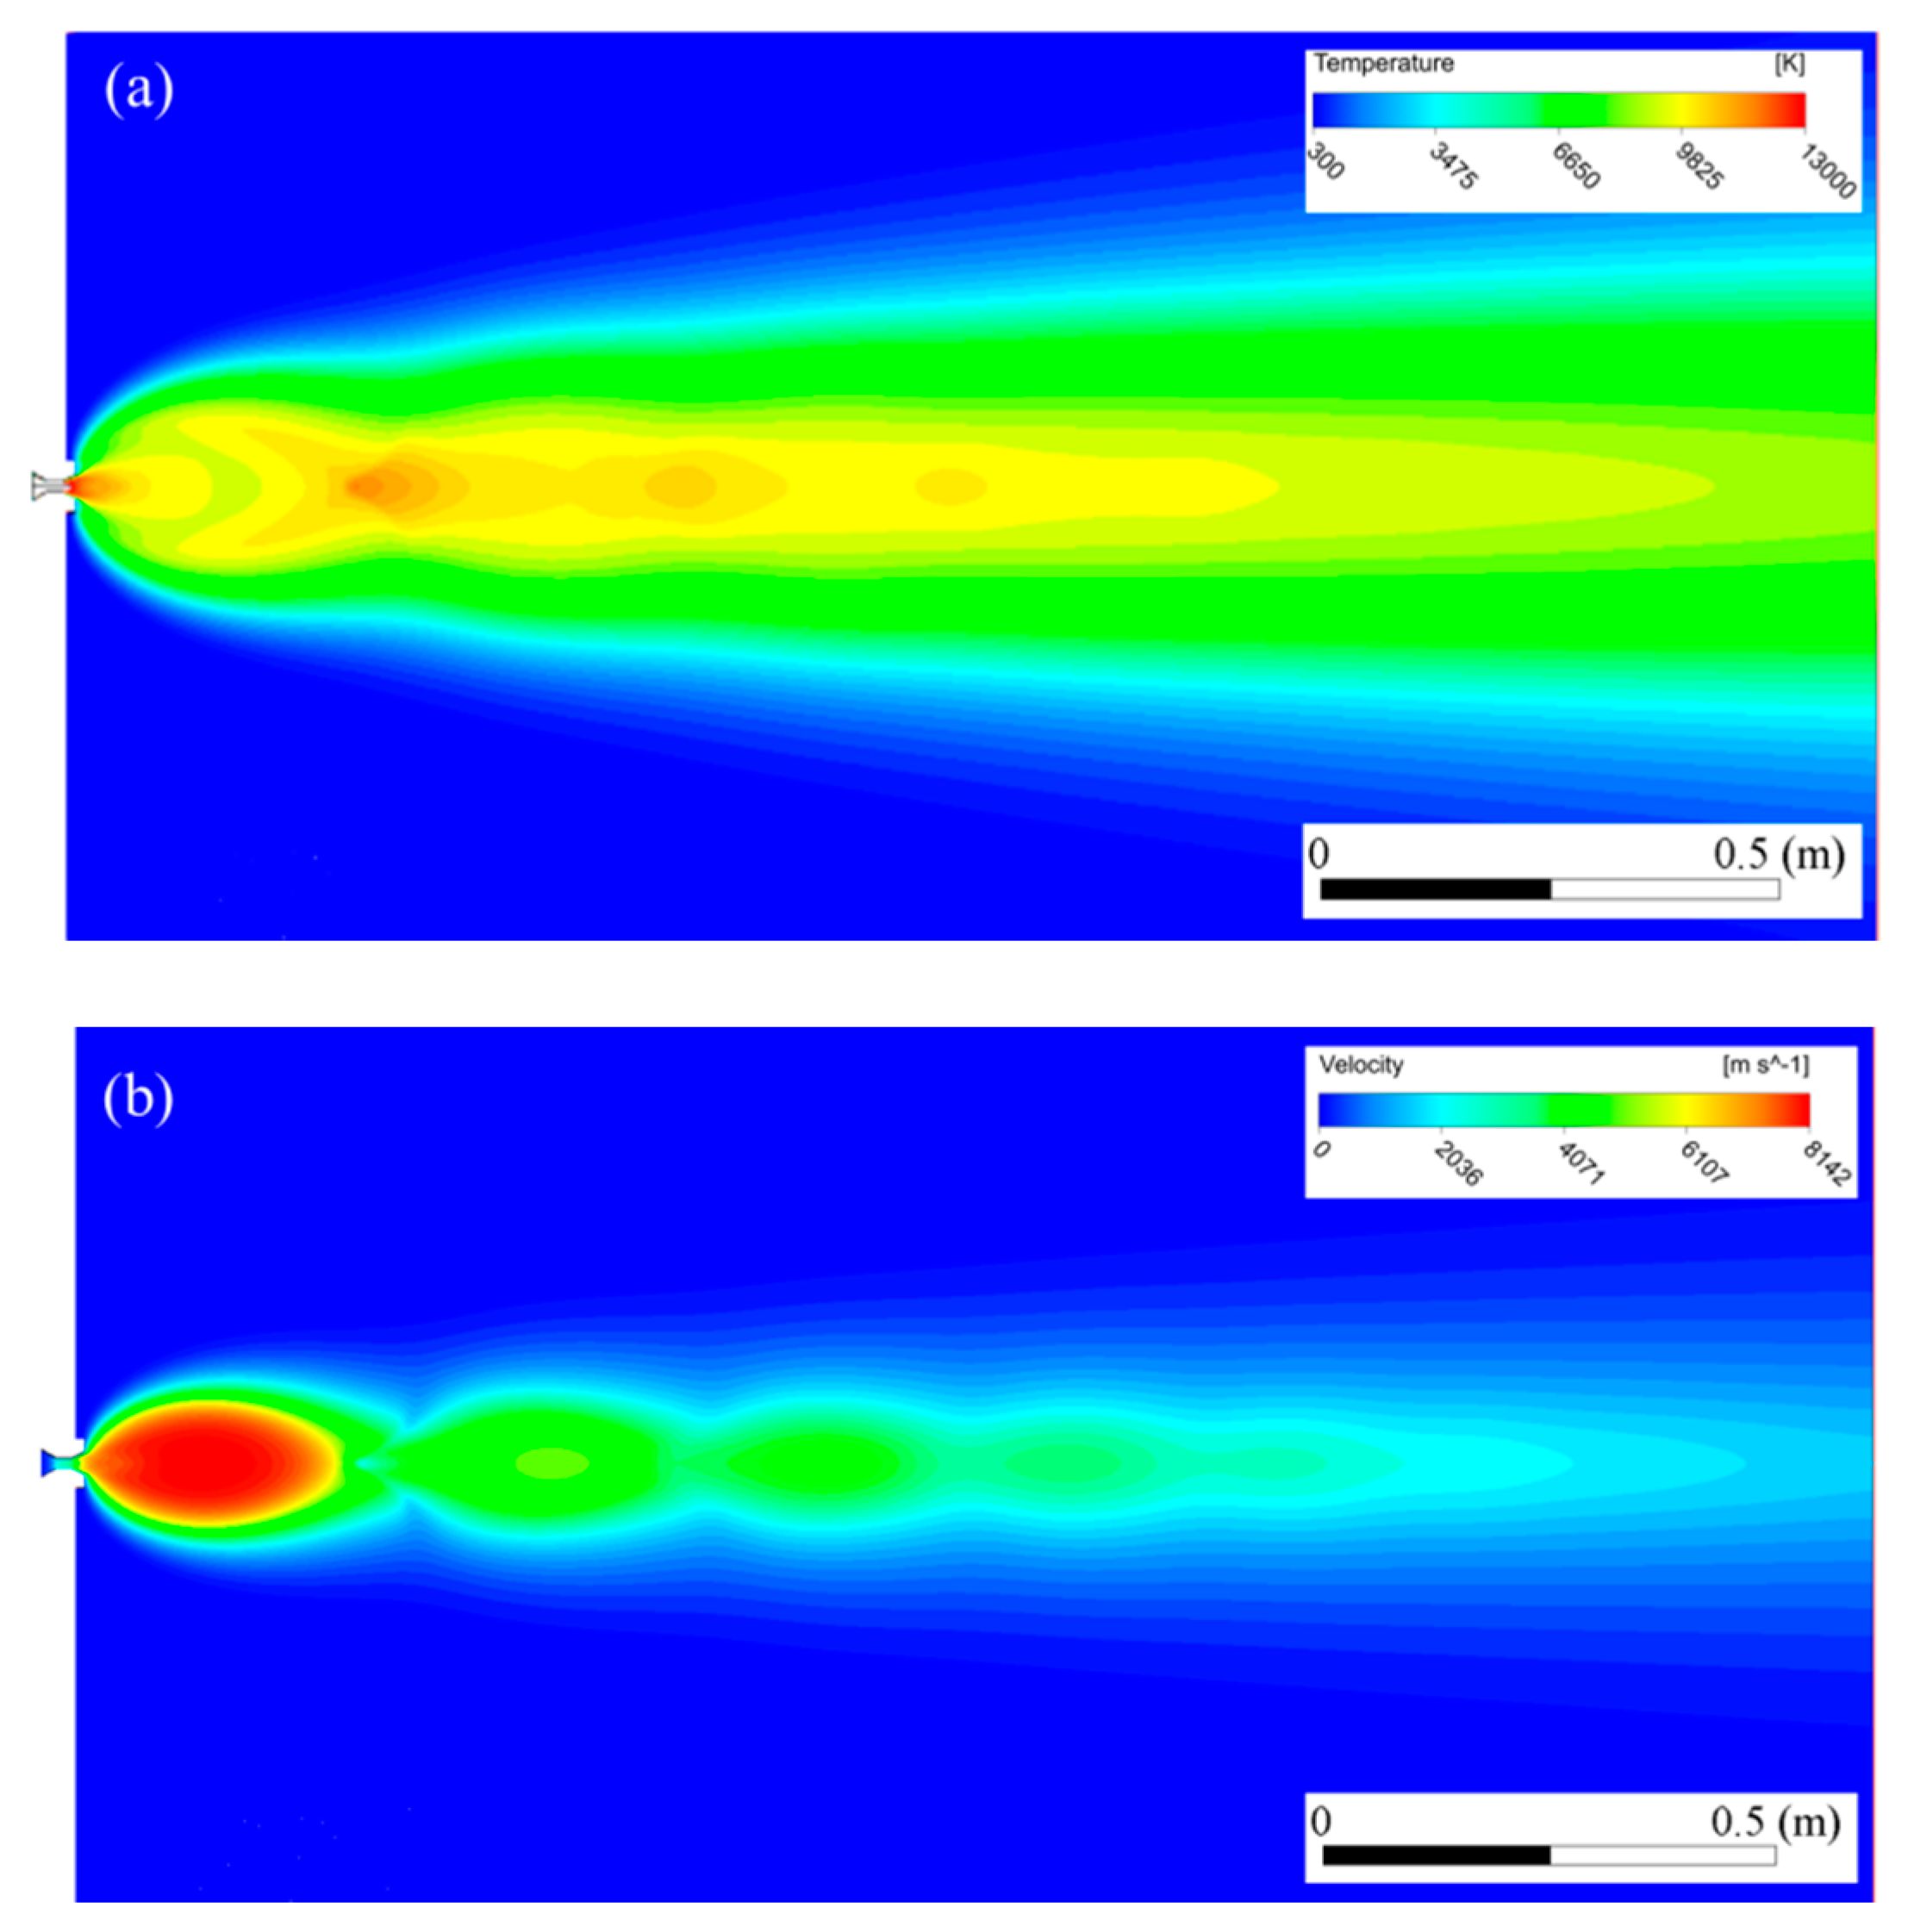
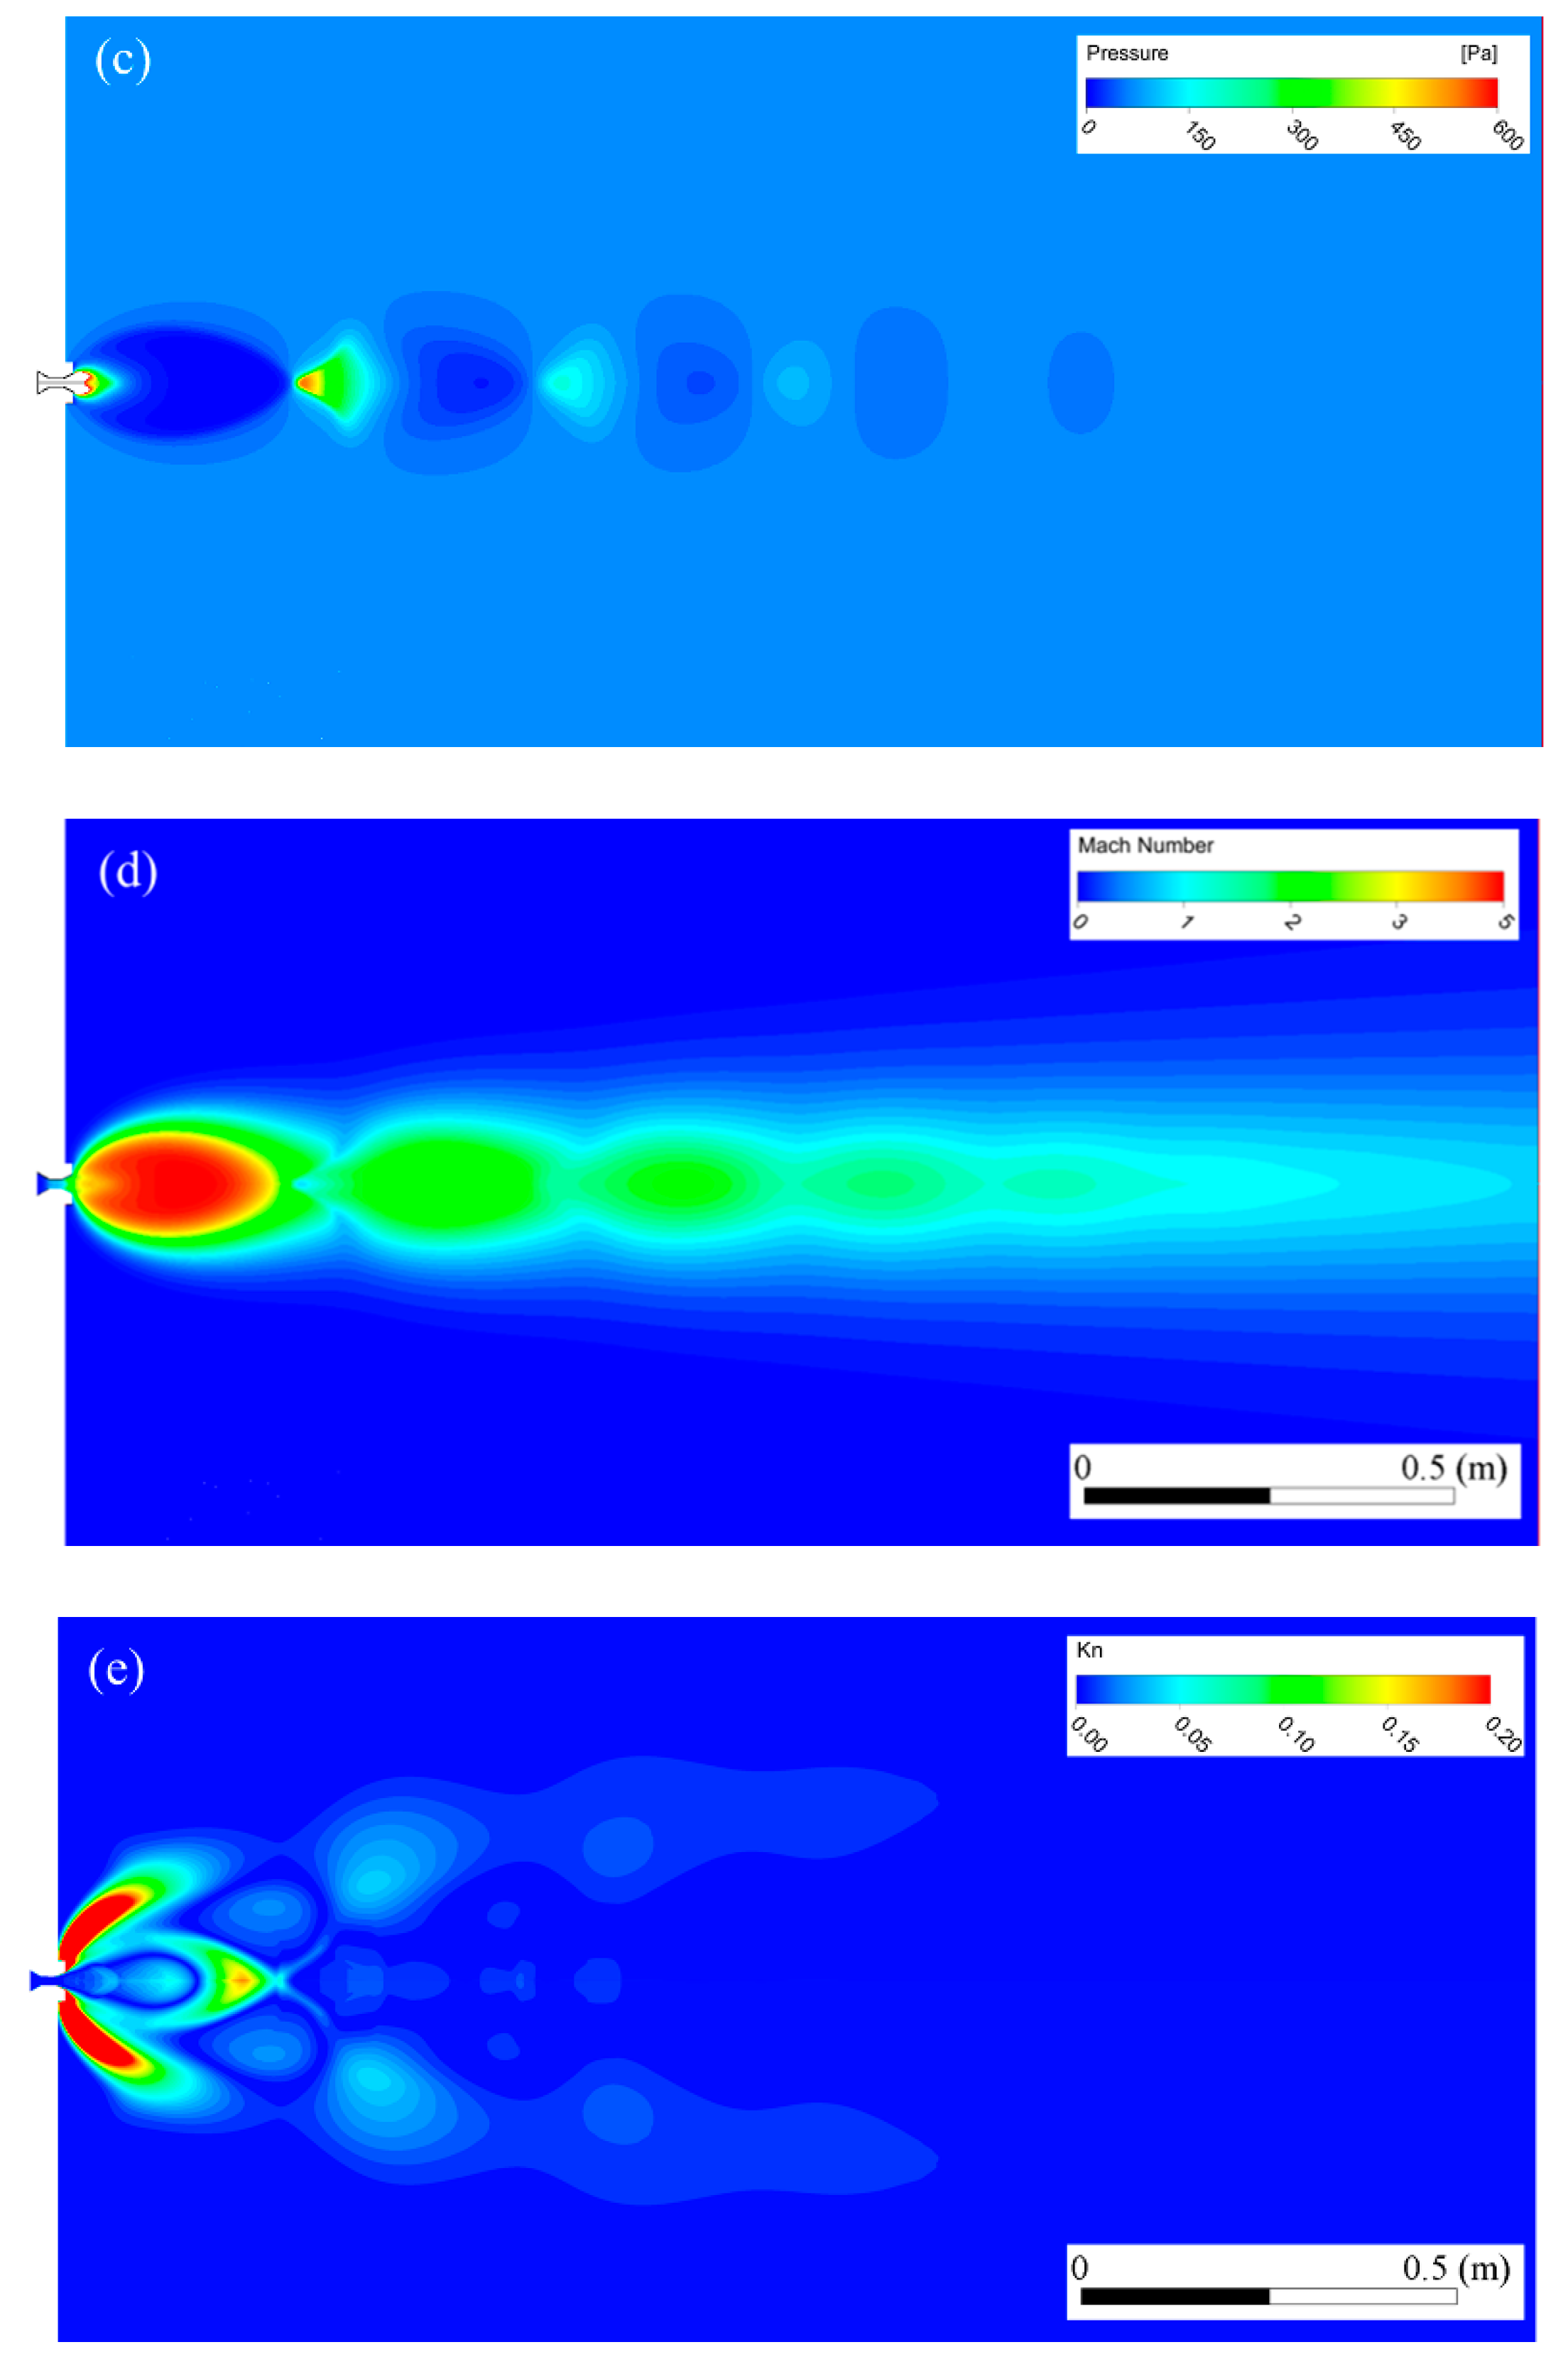
3.1.2. Ar–He Plasma Jet
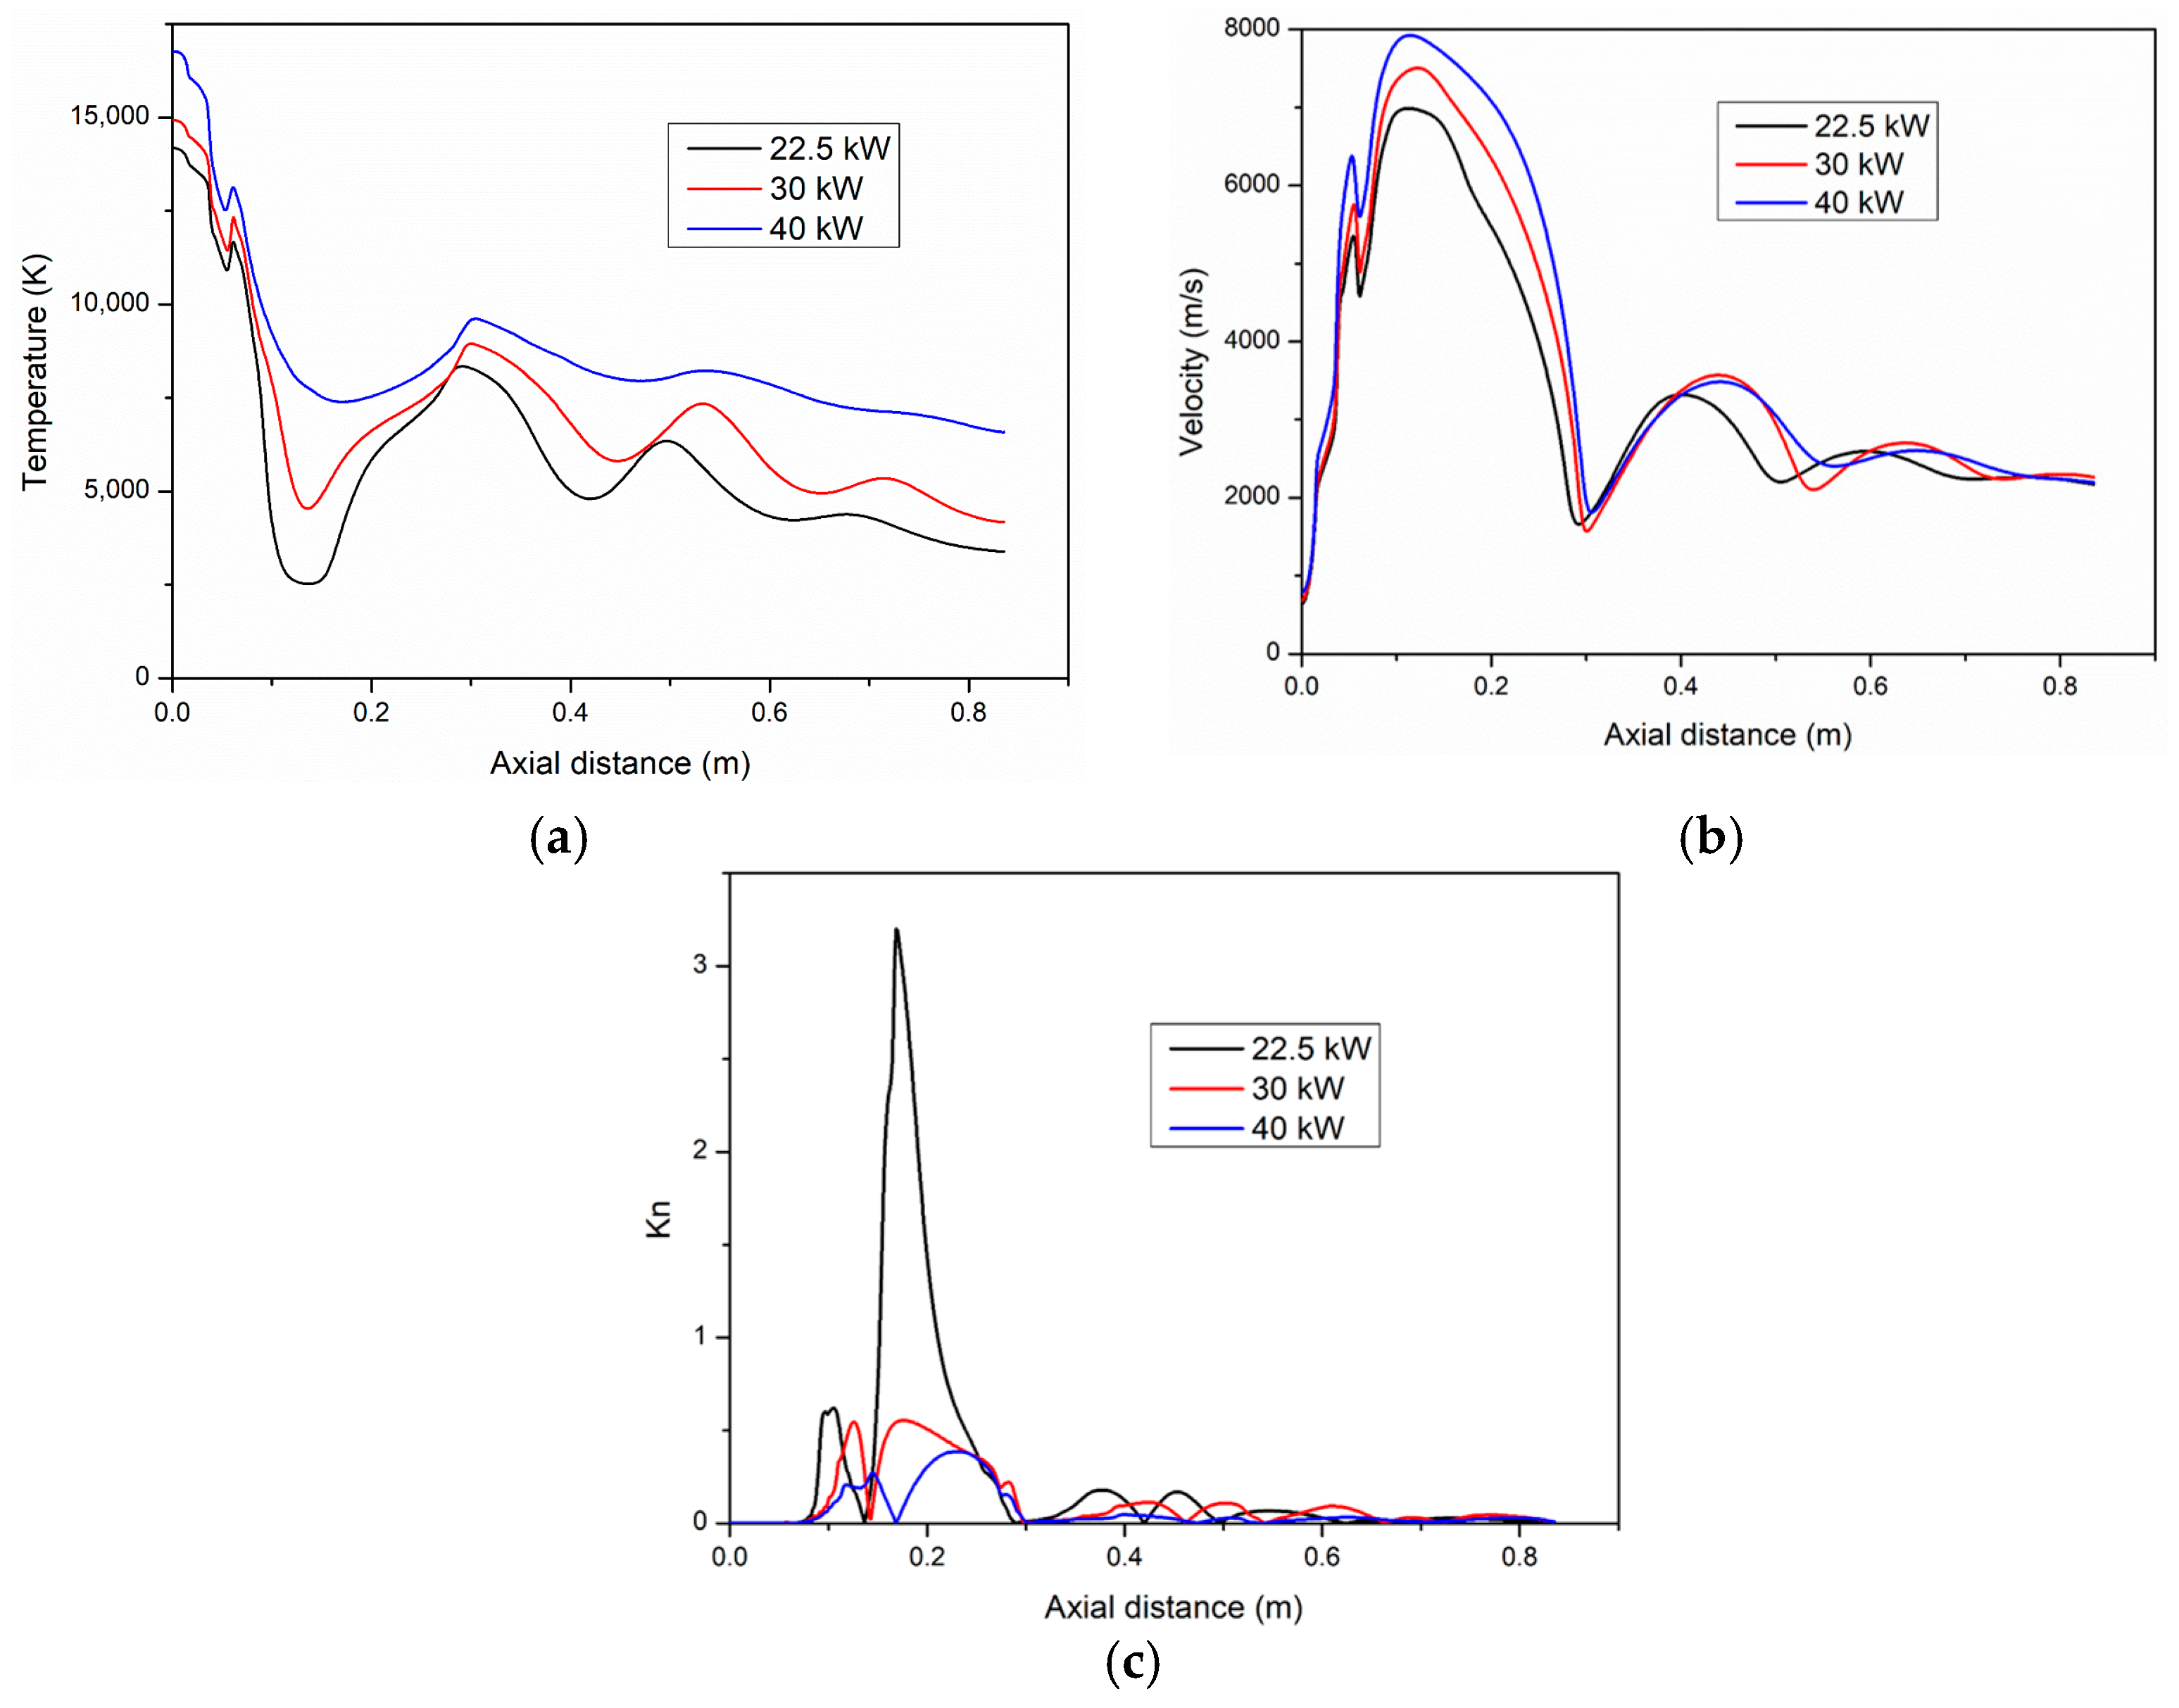
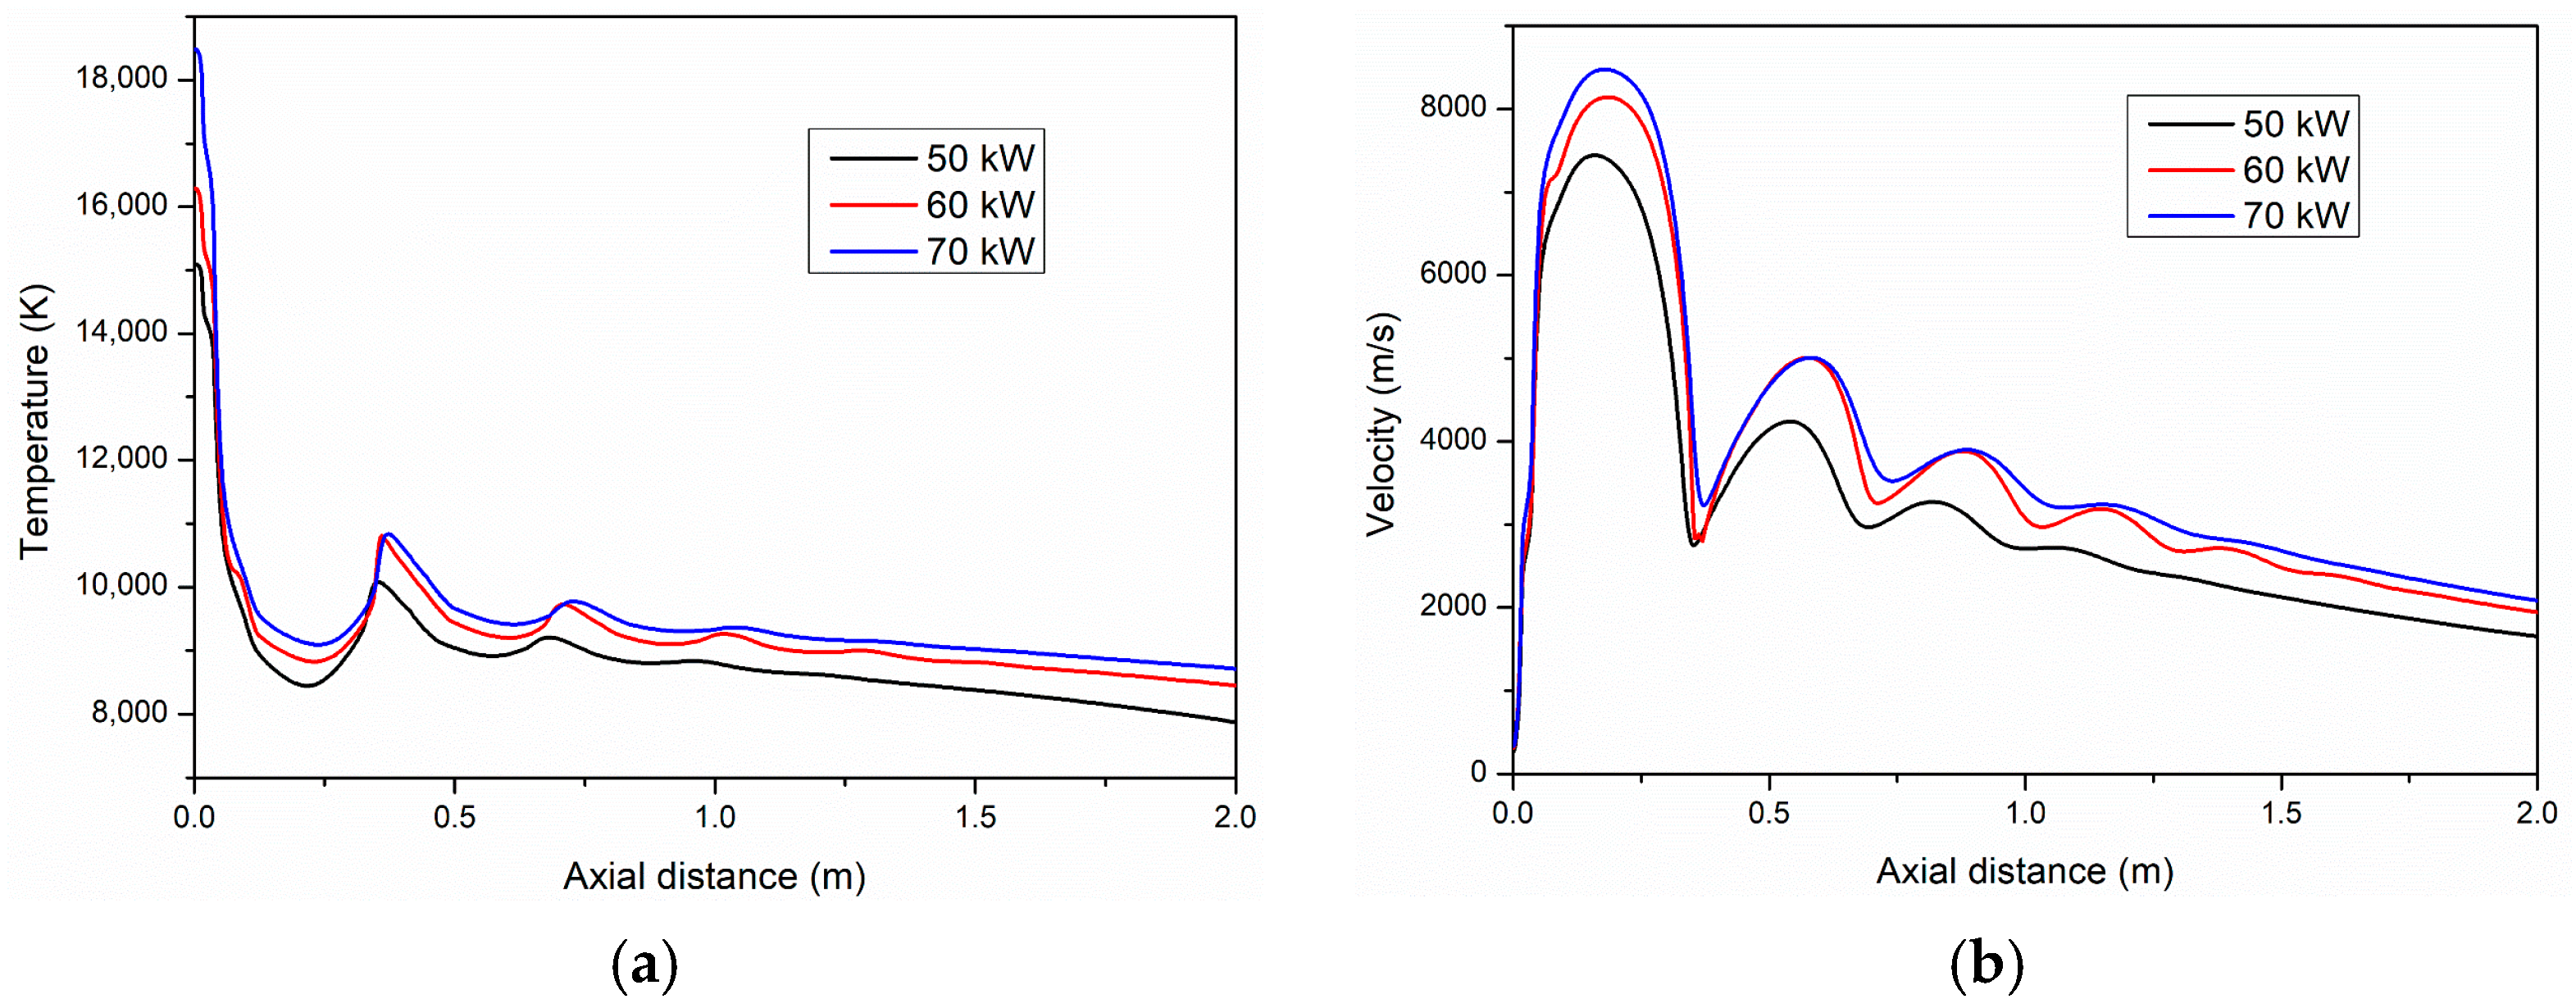
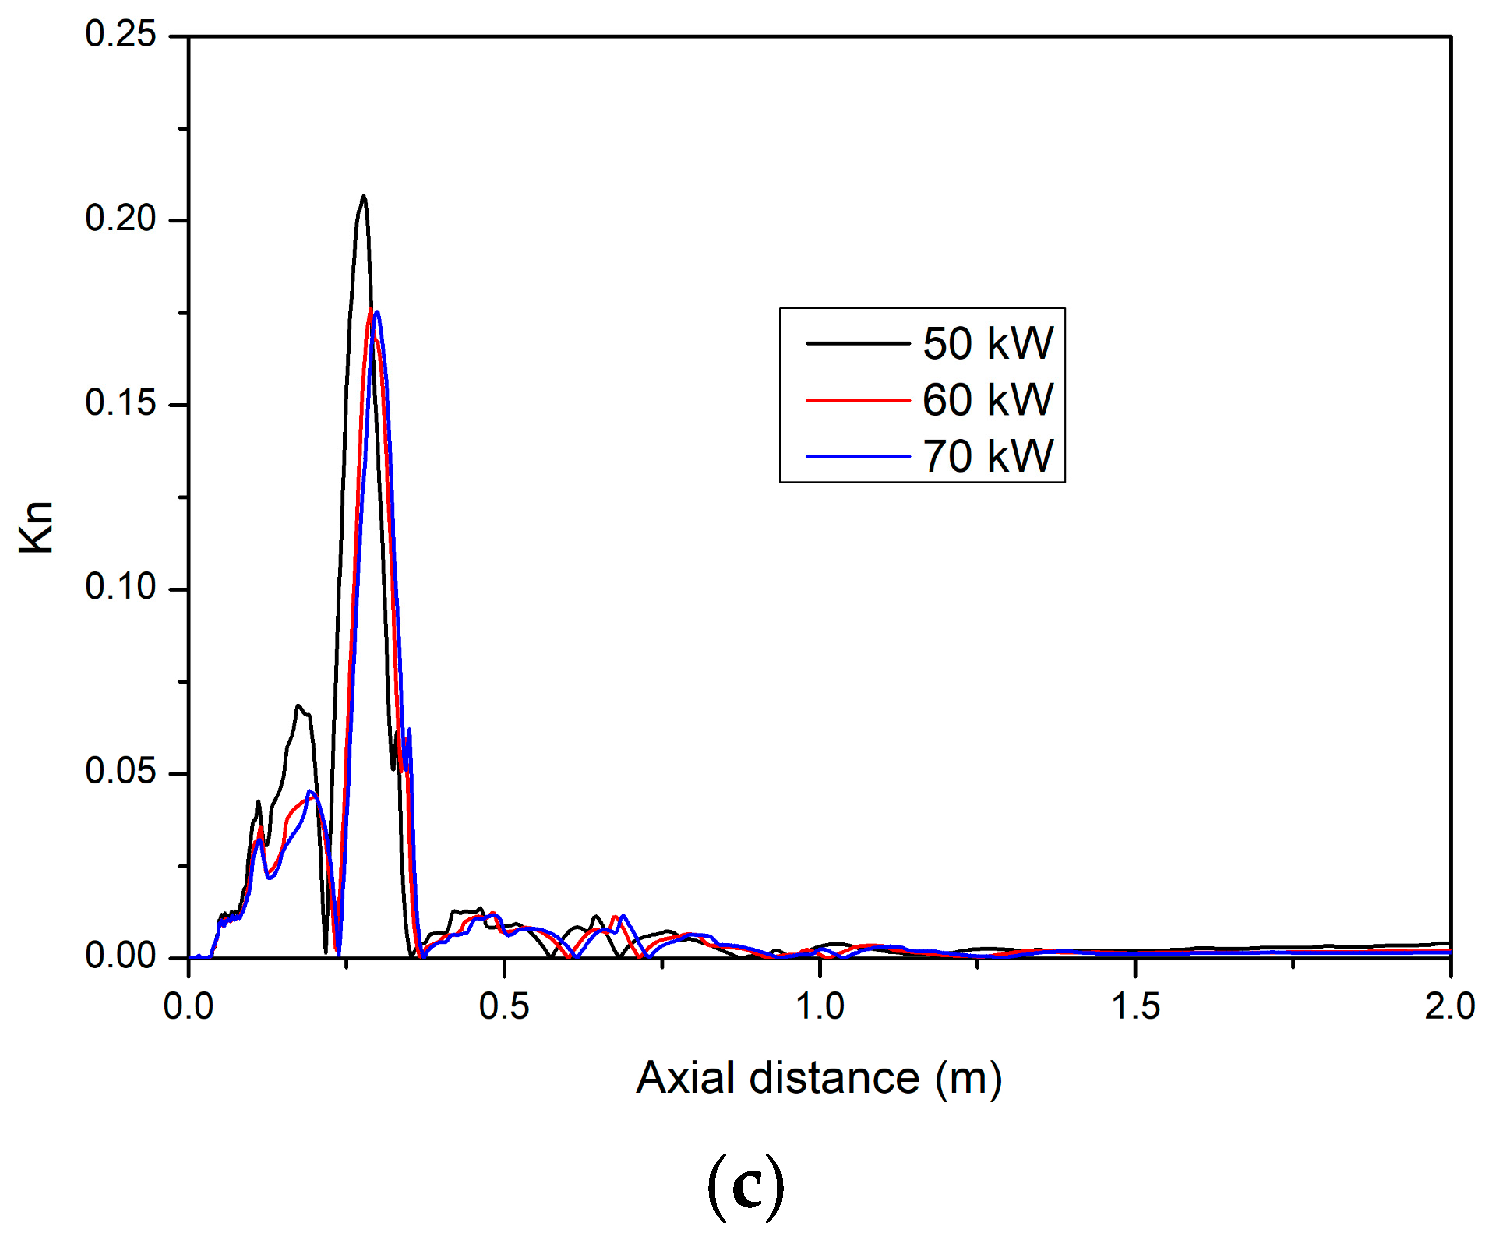
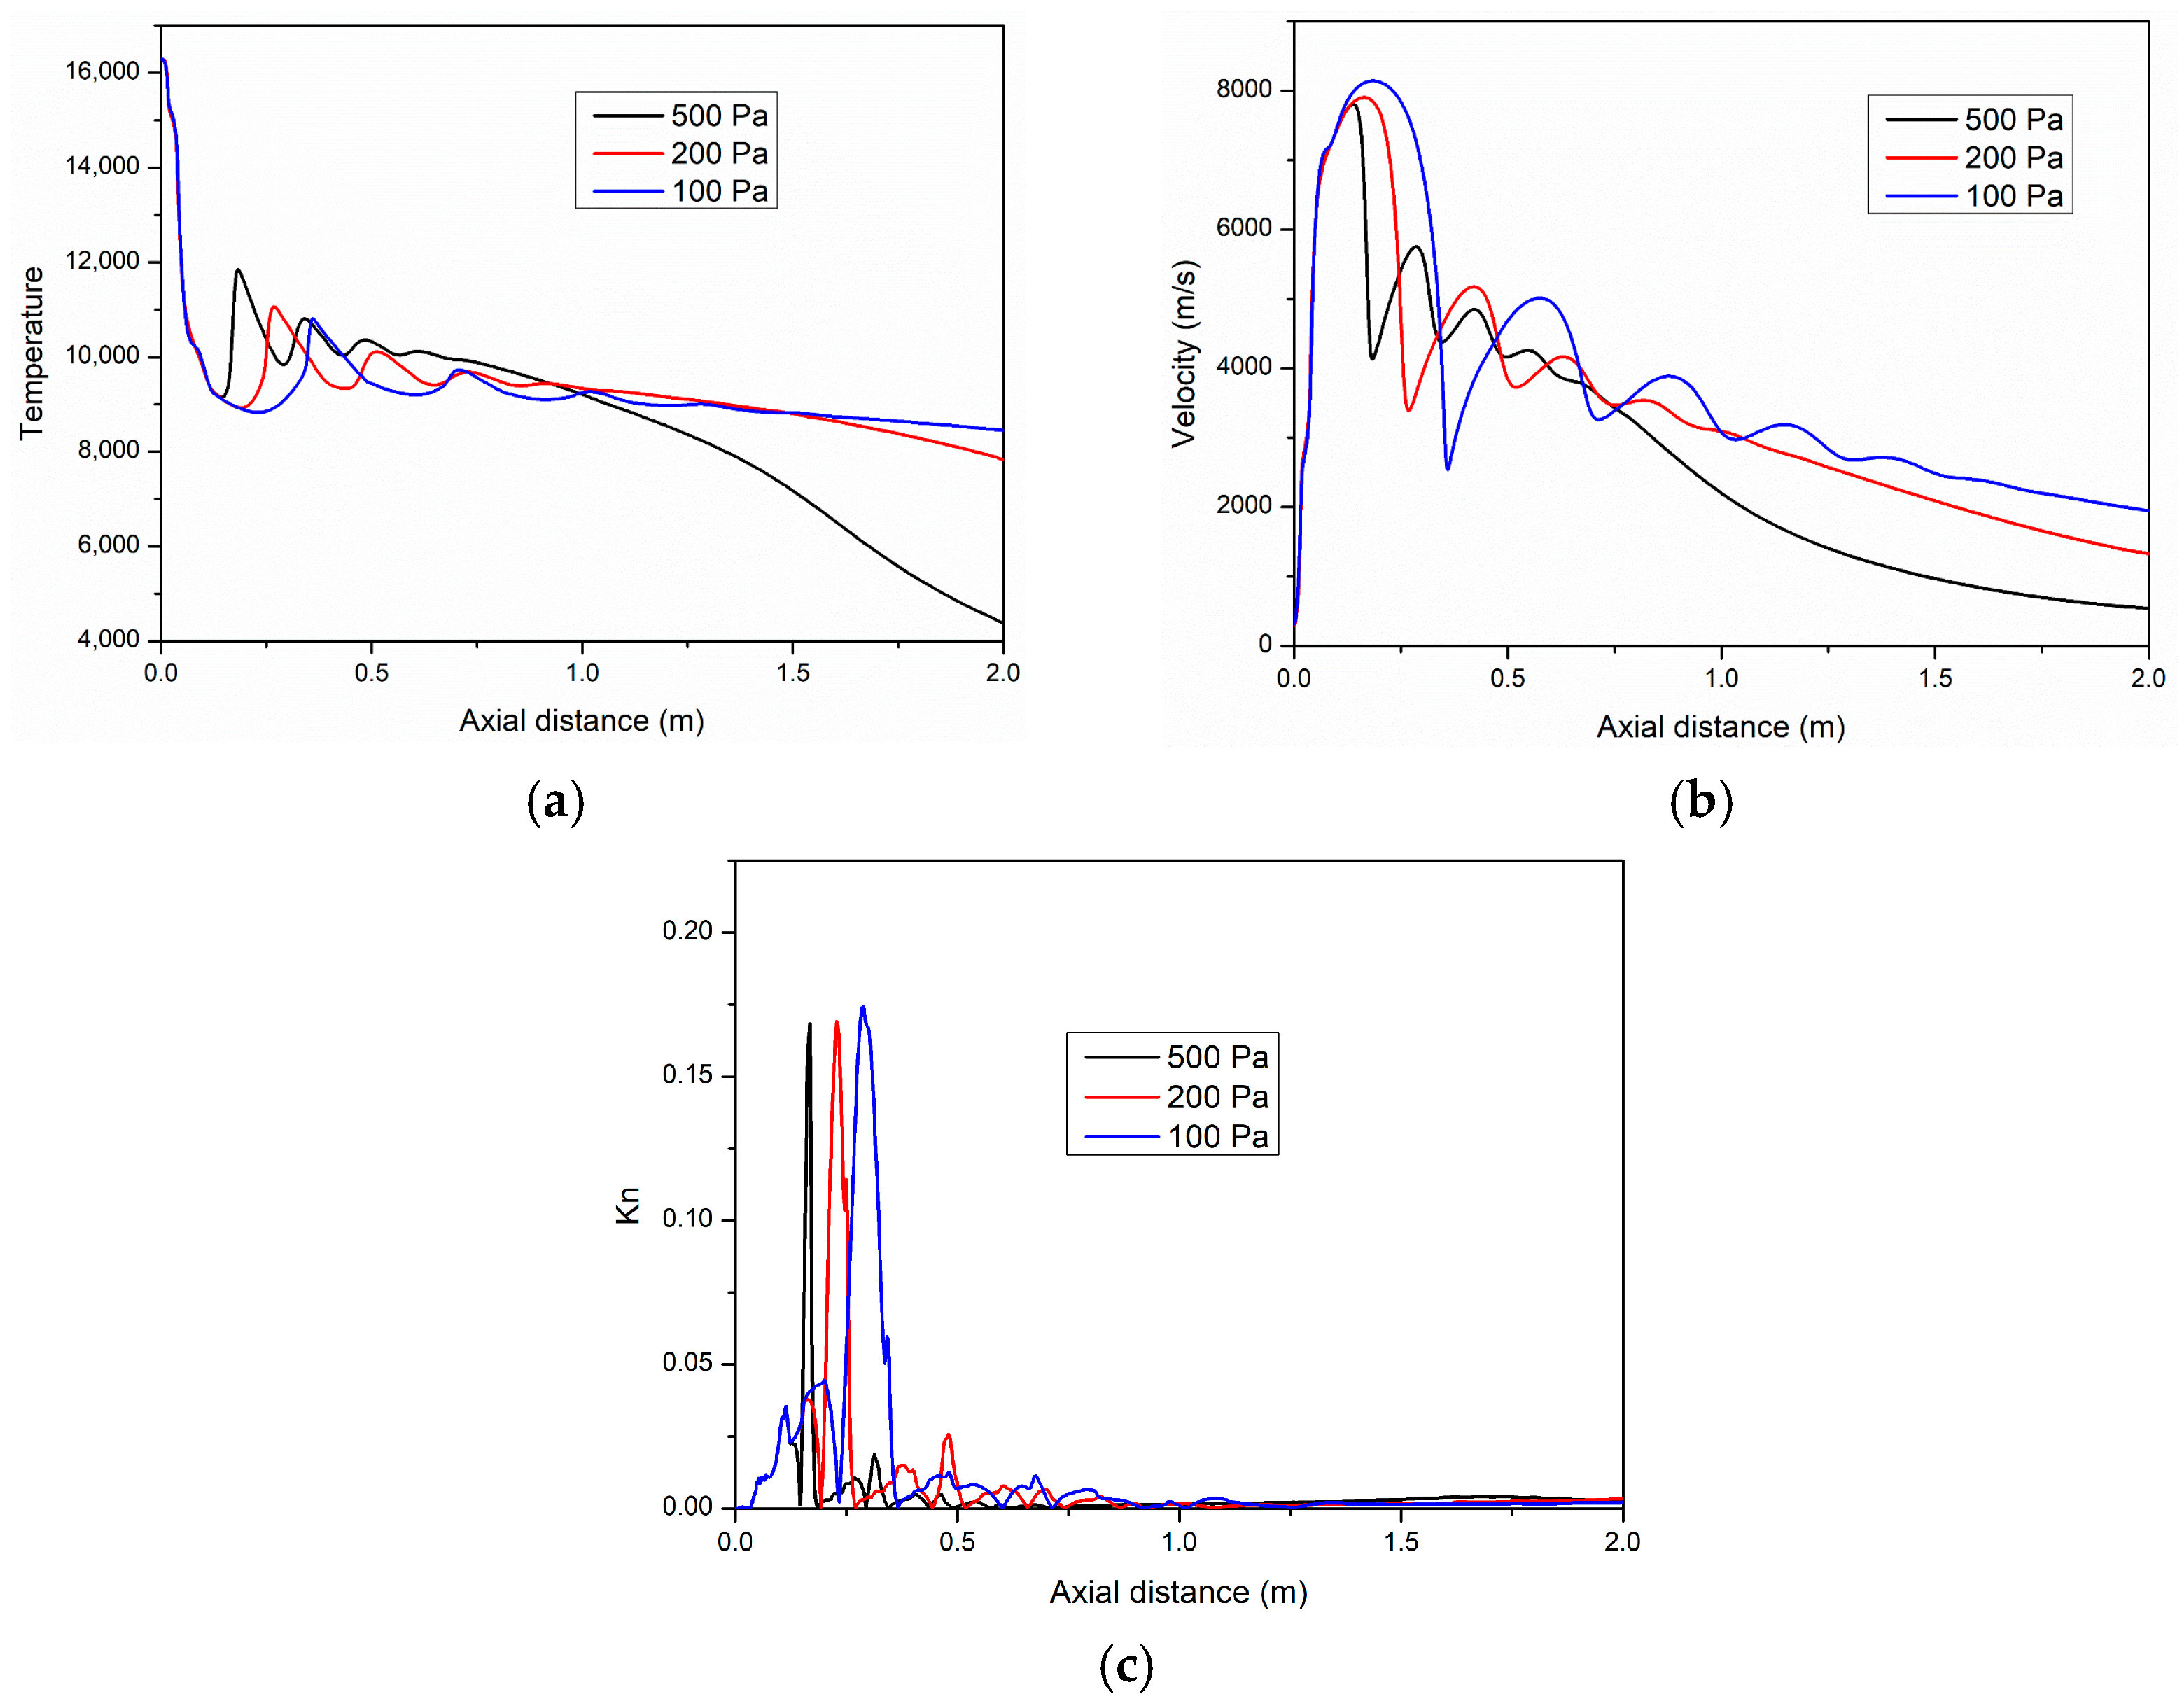
3.2. Effect of the Net Power Input to the Torch and Chamber Pressure
3.2.1. Ar–H2 Plasma Jet
3.2.2. Ar-He Plasma Jet
3.3. Effect of the Chamber Pressure and Plasma Arc Power on the Continuum Breakdown
4. Conclusions
Author Contributions
Funding
Institutional Review Board Statement
Informed Consent Statement
Data Availability Statement
Acknowledgments
Conflicts of Interest
References
- Goral, M.; Kotowski, S.; Nowotnik, A.; Pytel, M.; Drajewicz, M.; Sieniawski, J. PS-PVD deposition of thermal barrier coatings. Surf. Coat. Tech. 2013, 237, 51–55. [Google Scholar] [CrossRef]
- Mauer, G.; Jarligo, M.O.; Rezanka, S.; Hospach, A.; Vassen, R. Novel opportunities for thermal spray by PS-PVD. Surf. Coat. Tech. 2015, 268, 52–57. [Google Scholar] [CrossRef]
- von Niessen, K.; Gindrat, M.; Refke, A. Vapor phase deposition using plasma spray-PVD (TM). J. Therm. Spray Technol. 2010, 19, 502–509. [Google Scholar] [CrossRef]
- Smith, M.F.; Hall, A.C.; Fleetwood, J.D.; Meyer, P. Very low pressure plasma spray—a review of an emerging technology in the thermal spray community. Coatings 2011, 1, 117–132. [Google Scholar] [CrossRef]
- Wen, J.; Song, C.; Liu, T.; Deng, Z.; Niu, S.; Zhang, Y.; Liu, L.; Liu, M. Fabrication of dense gadolinia-doped ceria coatings via very-low-pressure plasma spray and plasma spray physical vapor deposition process (vol 9, 717, 2019). Coatings 2020, 10, 292. [Google Scholar] [CrossRef]
- He, W.T.; Mauer, G.; Schwedt, A.; Guillon, O.; Vassen, R. Advanced crystallographic study of the columnar growth of YZS coatings produced by PS-PVD. J. Eur Ceram. Soc. 2018, 38, 2449–2453. [Google Scholar] [CrossRef]
- Anwaar, A.; Wei, L.; Guo, Q.; Zhang, B.; Guo, H. Novel prospects for plasma spray–physical vapor deposition of columnar thermal barrier coatings. J. Therm. Spray Technol. 2017, 26, 1810–1822. [Google Scholar] [CrossRef]
- He, W.T.; Mauer, G.; Vaßen, R. Excitation temperature and constituent concentration profiles of the plasma jet under plasma spray-pvd conditions. Plasma Chem. Plasma Process. 2017, 37, 1293–1311. [Google Scholar] [CrossRef]
- Shinozawa, A.; Eguchi, K.; Kambara, M.; Yoshida, T. Feather-like structured ysz coatings at fast rates by plasma spray physical vapor deposition. J. Therm. Spray Technol. 2010, 19, 190–197. [Google Scholar] [CrossRef]
- Mauer, G. numerical study on particle-gas interaction close to the substrates in thermal spray processes with high-kinetic and low-pressure conditions. J. Therm. Spray Technol. 2019, 28, 27–39. [Google Scholar] [CrossRef]
- Chen, Q.-Y.; Li, C.-X.; Zhao, J.-Z.; Yang, G.-J.; Li, C.-J. Microstructure of YSZ coatings deposited by PS-PVD using 45 kW shrouded plasma torch. Mater. Manuf. Process. 2015, 31, 1183–1191. [Google Scholar] [CrossRef]
- Zhang, N.; Sun, F.; Zhu, L.; Planche, M.P.; Liao, H.; Dong, C.; Coddet, C. Measurement of specific enthalpy under very low pressure plasma spray condition. J. Therm. Spray Technol. 2012, 21, 489–495. [Google Scholar] [CrossRef]
- Gao, Y.; Yang, D.M.; Gao, J.Y. Characteristics of a plasma torch designed for very low pressure plasma spraying. J. Therm. Spray Technol. 2012, 21, 740–744. [Google Scholar] [CrossRef]
- Schmitt, M.P.; Harder, B.J.; Wolfe, D.E. Process-structure-property relations for the erosion durability of plasma spray-physical vapor deposition (PS-PVD) thermal barrier coatings. Surf. Coat. Tech. 2016, 297, 11–18. [Google Scholar] [CrossRef]
- Mauer, G.; Vaßen, R. Plasma Spray-PVD: Plasma characteristics and impact on coating properties. J. Phys. Conf. Ser. 2012, 406, 012005. [Google Scholar] [CrossRef]
- Mao, J.; Liu, M.; Deng, C.G.; Deng, C.M.; Zhou, K.S.; Deng, Z.Q. preparation and distribution analysis of thermal barrier coatings deposited on multiple vanes by plasma spray-physical vapor deposition technology. J. Eng. Mater. Technol. 2017, 139, 041003. [Google Scholar] [CrossRef]
- Ivchenko, D.; Mariaux, G.; Vardelle, A.; Goutier, S.; Itina, T.E.; Andre, P. Feasibility study of an adaptive-pressure plasma coating process-part 1: Model description. J. Therm. Spray Technol. 2020, 29, 25–37. [Google Scholar] [CrossRef]
- Mauer, G. Plasma characteristics and plasma-feedstock interaction under ps-pvd process conditions. Plasma Chem. Plasma Process.. 2014, 34, 1171–1186. [Google Scholar] [CrossRef]
- Liu, M.-J.; Zhang, M.; Zhang, Q.; Yang, G.-J.; Li, C.-X.; Li, C.-J. Gaseous material capacity of open plasma jet in plasma spray-physical vapor deposition process. Appl. Surf. Sci. 2018, 428, 877–884. [Google Scholar] [CrossRef]
- Ghalandari, M.; Mirzadeh Koohshahi, E.; Mohamadian, F.; Shamshirband, S.; Chau, K.W. Numerical simulation of nanofluid flow inside a root canal. Eng. Appl. Comput. Fluid Mech. 2019, 13, 254–264. [Google Scholar] [CrossRef]
- Ivchenko, D.; Zhang, T.; Mariaux, G.; Vardelle, A.; Goutier, S.; Itina, T.E. on the validity of continuum computational fluid dynamics approach under very low-pressure plasma spray conditions. J. Therm. Spray Technol. 2018, 27, 3–13. [Google Scholar] [CrossRef]
- Selezneva, S.E.; Boulos, M.I.; van de Sanden, M.C.M.; Engeln, R.; Schram, D.C. Stationary supersonic plasma expansion: Continuum fluid mechanics versus direct simulation monte carlo method. J. Phys. D Appl. Phys. 2002, 35, 1362–1372. [Google Scholar] [CrossRef]
- Abbate, G.; Kleijn, C.R.; Thijsse, B.J.; Engeln, R.; van de Sanden, M.C.M.; Schram, D.C. Influence of rarefaction on the flow dynamics of a stationary supersonic hot-gas expansion. Phys. Rev. E 2008, 77, 036703. [Google Scholar] [CrossRef] [PubMed]
- Vautherin, B.; Planche, M.P.; Bolot, R.; Quet, A.; Bianchi, L.; Montavon, G. Vapors and droplets mixture deposition of metallic coatings by very low pressure plasma spraying. J. Therm. Spray Technol. 2014, 23, 596–608. [Google Scholar] [CrossRef]
- Bird, G.A. breakdown of translational and rotational equilibrium in gaseous expansions. AIAA J. 1970, 8, 1998–2003. [Google Scholar] [CrossRef]
- Bird, G.A. Recent advances and current challenges for DSMC. Comput. Math. Appl. 1998, 35, 1–14. [Google Scholar] [CrossRef]
- Boyd, I.D. Predicting breakdown of the continuum equations under rarefied flow conditions. AIP Conf. Proc. 2003, 663, 899–906. [Google Scholar]
- Wang, W.L.; Boyd, I.D. Predicting continuum breakdown in hypersonic viscous flows. Phys. Fluids 2003, 15, 91–100. [Google Scholar] [CrossRef]
- Wang, W.L.; Sun, Q.H.; Boyd, I.D. Assessment of a hybrid method for hypersonic flows. AIP Conf. Proc. 2003, 663, 923–930. [Google Scholar]
- Granados-Ortiz, F.J.; Leon-Prieto, L.; Ortega-Casanova, J. Computational study of the application of al2o3 nanoparticles to forced convection of high-reynolds swirling jets for engineering cooling processes. Eng. Appl. Comput. Fluid Mech. 2020, 15, 1–22. [Google Scholar] [CrossRef]
- Ye, X.; An, X.; Zhang, H.; Guo, B. Numerical simulation on flow and evaporation characteristics of desulfurization wastewater in a bypass flue. Eng. Appl. Comput. Fluid Mech. 2020, 14, 411–421. [Google Scholar] [CrossRef]
- Murphy, A.B. Thermal plasmas in gas mixtures. J. Phys. D Appl. Phys. 2001, 34, R151–R173. [Google Scholar] [CrossRef]
- Murphy, A.B. Transport coefficients of helium and argon-helium plasmas. IEEE Trans. Plasma Sci. 1997, 25, 809–814. [Google Scholar] [CrossRef]
- Murphy, A.B. Transport coefficients of hydrogen and argon-hydrogen plasmas. Plasma Chem. Plasma Process. 2000, 20, 279–297. [Google Scholar] [CrossRef]
- Gordon, S. Computer program for calculation of complex chemical equilibrium-analysis. NASA Ref. Publ. 1994, 1311, 1–64. [Google Scholar]
- Mariaux, G.; Vardelle, A. 3-D time-dependent modelling of the plasma spray process. Part 1: Flow modelling. Int. J. Therm. Sci. 2005, 44, 44–357. [Google Scholar] [CrossRef]
- Bird, G.A. definition of mean free-path for real gases. Phys. Fluids 1983, 26, 3222–3223. [Google Scholar] [CrossRef]
- Burt, J.M.; Boyd, I.D. A hybrid particle approach for continuum and rarefied flow simulation. J. Comput. Phys. 2009, 228, 460–475. [Google Scholar] [CrossRef]
- Buchmann, N.A.; Atkinson, C.; Soria, J. Ultra-high-speed tomographic digital holographic velocimetry in supersonic particle-laden jet flows. Meas. Sci. Technol. 2013, 24, 024005. [Google Scholar] [CrossRef]
- Han, P.; Chen, X. Modeling of the supersonic argon plasma jet at low gas pressure environment. Thin Solid Film. 2001, 390, 181–185. [Google Scholar] [CrossRef]
- Pateyron, B.; Elchinger, M.F.; Delluc, G.; Fauchais, P. Sound velocity in different reacting thermal plasma systems. Plasma Chem. Plasma Process. 1996, 16, 39–57. [Google Scholar] [CrossRef]
- Mazouffre, S.; Boogaarts, M.G.H.; Bakker, I.S.J.; Vankan, P.; Engeln, R.; Schram, D.C. Transport of ground-state hydrogen atoms in a plasma expansion. Phys. Rev. E 2001, 64, 016411. [Google Scholar] [CrossRef] [PubMed]


| Variable | Equation |
|---|---|
| Mass | |
| Momentum | |
| Energy |
| Spray Parameter | Low-Power Plasma Torch | High-Power Plasma Torch |
|---|---|---|
| Net electric power input to the gas, kW | 22.5–40 | 50–70 |
| Plasma gas flow rate, slpm | 40 Ar/8 H2 | 60 Ar/30 He |
| Torch Nozzle diameter, mm | 6 | 12.5 |
| Chamber pressure, Pa | 100–500 | 100–500 |
| Spray distance, m | ~0.4 | ~1 |
| Torch Net Power, kW | Boundary Type | Torch Type | Temperature, K | Pressure, Pa | Mass Flow Rate, kg/s |
|---|---|---|---|---|---|
| 22.5, 30, 40 50, 60, 70 | Inlet | F4 O3CP | 14,200, 14,950, 16,550 15,100, 16,300, 18,500 | – | 0.0012 0.00187 |
| – | Torch anode wall | F4 O3CP | 1473 1000 | – | – |
| – | Free boundaries outlet | F4 O3CP | 873 300 | 100, 200, 500 | – |
Publisher’s Note: MDPI stays neutral with regard to jurisdictional claims in published maps and institutional affiliations. |
© 2021 by the authors. Licensee MDPI, Basel, Switzerland. This article is an open access article distributed under the terms and conditions of the Creative Commons Attribution (CC BY) license (https://creativecommons.org/licenses/by/4.0/).
Share and Cite
Zhang, T.; Mariaux, G.; Vardelle, A.; Li, C.-J. Numerical Simulation of Plasma Jet Characteristics under Very Low-Pressure Plasma Spray Conditions. Coatings 2021, 11, 726. https://doi.org/10.3390/coatings11060726
Zhang T, Mariaux G, Vardelle A, Li C-J. Numerical Simulation of Plasma Jet Characteristics under Very Low-Pressure Plasma Spray Conditions. Coatings. 2021; 11(6):726. https://doi.org/10.3390/coatings11060726
Chicago/Turabian StyleZhang, Tao, Gilles Mariaux, Armelle Vardelle, and Chang-Jiu Li. 2021. "Numerical Simulation of Plasma Jet Characteristics under Very Low-Pressure Plasma Spray Conditions" Coatings 11, no. 6: 726. https://doi.org/10.3390/coatings11060726
APA StyleZhang, T., Mariaux, G., Vardelle, A., & Li, C.-J. (2021). Numerical Simulation of Plasma Jet Characteristics under Very Low-Pressure Plasma Spray Conditions. Coatings, 11(6), 726. https://doi.org/10.3390/coatings11060726