Review

High Pressure X-ray Diffraction as a Tool for Designing Doped Ceria Thin Films Electrolytes

by
Sara Massardo
1,
Alessandro Cingolani
1 and
Cristina Artini
1,2,*
1
Department of Chemistry and Industrial Chemistry, University of Genova, Via Dodecaneso 31, 16146 Genova, Italy
2
Institute of Condensed Matter Chemistry and Technologies for Energy, National Research Council, CNR-ICMATE, Via De Marini 6, 16149 Genova, Italy
*
Author to whom correspondence should be addressed.
Coatings 2021, 11(6), 724; https://doi.org/10.3390/coatings11060724
Submission received: 6 May 2021 / Revised: 8 June 2021 / Accepted: 12 June 2021 / Published: 16 June 2021

Abstract

:
Rare earth-doped ceria thin films are currently thoroughly studied to be used in miniaturized solid oxide cells, memristive devices and gas sensors. The employment in such different application fields derives from the most remarkable property of this material, namely ionic conductivity, occurring through the mobility of oxygen ions above a certain threshold temperature. This feature is in turn limited by the association of defects, which hinders the movement of ions through the lattice. In addition to these issues, ionic conductivity in thin films is dominated by the presence of the film/substrate interface, where a strain can arise as a consequence of lattice mismatch. A tensile strain, in particular, when not released through the occurrence of dislocations, enhances ionic conduction through the reduction of activation energy. Within this complex framework, high pressure X-ray diffraction investigations performed on the bulk material are of great help in estimating the bulk modulus of the material, and hence its compressibility, namely its tolerance toward the application of a compressive/tensile stress. In this review, an overview is given about the correlation between structure and transport properties in rare earth-doped ceria films, and the role of high pressure X-ray diffraction studies in the selection of the most proper compositions for the design of thin films.

Graphical Abstract

1. Introduction

Ceria doped by trivalent rare earth (RE) ions forms a wide family of mixed oxides of major relevance for their remarkable properties of ionic conductivity [1]. The partial substitution of Ce4+ by RE3+ induces in fact the formation of oxygen vacancies which at a sufficiently high temperature are able to migrate through the lattice by hopping from one to another oxygen site [2]. In the presence of an oxygen gradient, such as the one existing between the air and the fuel electrode in a solid oxide cell, the described movement gives rise to an organized and net flow of oxygen ions, thus making RE-doped ceria an ideal class of electrolytes for solid oxide cells. Nevertheless, this is not the only employment of the studied material, being it also used as an ionic conductivity enhancer in mixed ionic electronic conductors (MIECs), namely the perovskite-based materials used for both air and fuel electrodes in solid oxide cells [3]. Moreover, RE-doped ceria is also the active material in many gas sensors [4,5] and memristive systems [6].
The current and increasing need for portable devices makes miniaturization a forefront topic in the materials science research; in this respect, the deposition of thin films having the same or even better properties than the bulk material is one of the main goals connected with the realization of small-scale devices. The issue related to the thin films vs. bulk properties is a crucial point, since the 2D dimensionality, as well as the presence of the film/substrate interface, make the former constitutionally different from the latter, and the properties of thin films unpredictable on the sole basis of the bulk properties. Ionic conductivity in doped ceria films is well known to be affected by crystallographic parameters, such as the oxide/substrate lattice mismatch, which determine the interfacial strain [7,8], and by the amount and the nature of defects [9]. An effective approach aimed at avoiding the experimental difficulties associated to the study of interfaces consists in the investigation of the high pressure behaviour of bulk samples to simulate the interfacial strain [10] and deduce the material compressibility. Following this idea, recently, several high pressure X-ray diffraction studies were performed by this [11,12,13] and other research groups [10] with the aim to determine the bulk modulus of several samples belonging to different RE-doped ceria systems, and finally to gain useful hints for the selection of the most proper compositions in the design of thin films.
The review is divided into three main parts. In Section 2, an overview is given about the application areas of RE-doped ceria thin films. Starting from Section 3, the focus moves to the employment of doped ceria in solid oxide cells; this section is devoted to the correlations between structural and transport properties both in bulk and thin films. Finally, in Section 4, a common set-up of high pressure synchrotron X-ray diffraction experiments is described; then, a review of the results obtained from the application of this technique to different bulk doped ceria systems in terms of zero pressure bulk modulus is addressed, and the conclusions to be drawn from this outcome are discussed.

2. Rare Earth-Doped Ceria Thin Films: A Versatile Material to Be Used in Many Fields

As aforementioned, ionic conductivity is the most relevant physical property of RE-doped ceria systems, and the most exploitable one in terms of applications; its maximization, which depends on several different issues, such as composition, RE chemical nature, microstructure, and also extrinsic factors, like the synthesis conditions, plays a central role in driving the research on this material [14]. The occurrence of significant values of ionic conduction, generally ranging between 0.01 and 0.1 S cm−1 at 873 K [15], makes doped ceria more desirable in solid oxide cells than yttria-stabilized zirconia (YSZ), which effectively works only at higher temperatures. The employment of doped ceria allows in fact the reduction of the operating temperature of the cell, thus favoring a lengthening of the device lifetime.
The first and foremost employment of RE-doped ceria (in particular for RE ≡ Gd and Sm) is thus in solid oxide cells, either fuel (SOFCs) or electrolysis (SOECs) cells, where it is used mainly as a solid electrolyte [16,17]. To this purpose, it is generally fabricated as a highly dense and thin pellet, in order to favor the movement of oxygen ions through the material. In addition, it is also often mixed, either by co-electrospinning [18] or by infiltration [3,19], to the electrode material with the aim to improve the electrochemical activity of the latter by enhancing its ionic conductivity. In SOFCs, for instance, the presence of Gd- or Sm-doped ceria within the electrode material allows the oxygen reduction reaction (ORR) to take place not only at the triple phase electrolyte/oxygen/air electrode boundary (TPB), but also in the electrode interior [20]. While, in fact, the electrode material is characterized by a high electric conductivity, it has mostly a negligible ionic conductivity, such as in the case of lanthanum strontium manganite (LSM), which is one of the most studied and used cathode materials in SOFCs [21]. Even in the case of lanthanum, strontium, cobalt ferrite (LSCF), presenting a higher ionic conductivity, the addition of some doped ceria significantly improves the material performance [20]. Again, in SOFCs it is also sometimes added to the perovskite fuel electrode material, with the aim to enhance charge transfer under reducing conditions, and in general to improve the electrode morphological stability [3,22]. In Figure 1, taken from [18], the arrangement of a SOFC cathode is shown: the Gd-doped ceria (GDC) electrolyte is in contact with the GDC/LSCF co-electrospun cathode. The EAT (electrochemical active thickness) is the thin layer of electrode where the ORR takes place. The so-formed electrons move through the GDC fibers toward the GDC electrolyte. The gold mesh acts as a current collector, and Pt ensures the contact between gold and the cell.
For sake of completeness, it cannot be overlooked that ceria is also widely studied for its gas sensing properties, thanks to its ability to release or incorporate oxygen as a result of changes in the ambient oxygen concentration [4,5], and to respond to the presence of volatile organic compounds (VOCs) [23]. The partial substitution of Ce4+ by a trivalent ion, such as Sm3+, was proven to induce an augmented sensitivity to oxygen of the resulting sensor [24]; the deposition of a Pr-doped ceria film on the yttria-stabilized zirconia-based gas sensor, for instance, is reported to be a valid enhancer of the toluene-sensing properties of the device [25].
A further and more recent application of RE-doped ceria applies to non-volatile memories employing ions in place of electrons as carriers, namely memristive systems [6]. These devices are resistive switches consisting in a switching material interposed between two electrodes; within the cited material a redox reaction takes place, thus giving rise to a resistivity variation. The application of a voltage promotes the flow of O2− ions through the device. Among switching materials, CeO2−x [26] and Ce1−xGdxO2−x/2 [27,28] are widely studied.

3. Ionic Conductivity in Doped Ceria Bulk and Thin Films: Correlations between Structure, Microstructure and Transport Properties

3.1. Ionic Conductivity in Bulk Doped Ceria

Ionic conductivity in ceria doped by a trivalent RE ion occurs through hopping of oxygen ions toward oxygen unoccupied crystallographic sites; or, in other words, through the movement of oxygen vacancies from one to another oxygen site. The occurrence of empty oxygen positions takes place to ensure electroneutrality as a consequence of the partial replacement of Ce4+ by RE3+. The described phenomenon becomes significant above a certain temperature: Sm- and Gd-doped ceria, namely two of the most effective systems in terms of ionic conduction, are commonly used in solid oxide cells working in the intermediate temperature range, i.e., between 673 and 973 K (IT-SOC). The dependence of ionic conduction ( σ ) on temperature ( T ) is ruled by the Arrhenius Equation:
σ T = A e x p E a R T
where A is the pre-exponential factor, E a is the activation energy to ionic conductivity, and R the gas constant. E a can be thought as the sum of association energy ( E a s s ) and migration energy ( E m ), being the former the energy needed to separate an oxygen vacancy from a defect aggregate, and the latter the energy needed by vacancies to move through the lattice. Vacancies are in fact free to move only until RE3+ ions are incorporated into the CeO2 crystal structure as isolated R E C e defects and oxygen vacancies randomly distributed within the matrix, both acting as guests of a CeO2-based solid solution [14]. Above a certain RE amount vacancies are partly blocked within defect aggregates.
The reasons behind this behavior can be found in the structural arrangement of both the CeO2-based solid solution and defect aggregates. CeO2 crystallizes in a fluorite-like cubic structure (called F) belonging to the F m 3 ¯ m space group [29] containing four formula units per cell; Ce and O are hosted at the two atomic positions 4 a (0,0,0) and 8 c (1/4, 1/4, 1/4), respectively, and Ce is eight-coordinated to O. As aforementioned, up to a certain RE3+ amount, R E C e defects and oxygen vacancies occupy the 4 a and 8 c sites respectively, with vacancies being independent of their ionic counterpart and free to move at sufficiently high temperature. With increasing the RE3+ content, doping ions and vacancies are stabilized by assuming the cubic atomic arrangement (called C) of the RE2O3 sesquioxides of the heaviest rare earths (RE ≡ Gd-Lu) (space group: I a 3 ¯ ), where RE is six-coordinated to O [30]; in this configuration, vacancies cannot flow through the lattice, unless E a s s is provided to the system in order to dislodge them from defect clusters. In Figure 2 the atomic arrangements of the F and the C phase are represented.
From this perspective, it is possible to understand why in many doped ceria systems two different values of activation energy can be recognized from the Arrhenius plot, with the lower one at higher temperature [32,33,34,35]. This is quite a common feature in doped ceria systems, and it is ascribable to the occurrence of at least two different defect aggregates, namely 1 V O R E C e positively charged dimers and 1 V O 2 R E C e neutral trimers [36]. In general, a higher binding energy is calculated for dimers rather than for trimers [37]: as a consequence, the latter, due to their lower configurational entropy, become progressively less stable with increasing temperature, and their dissociation at a sufficiently high temperature induces the release of oxygen vacancies which become able to migrate, thus reducing the activation energy value. The crossover temperature results to be roughly the same for all the systems, and it was observed around 750 K [34]; in Figure 3, reproduced from [34], the trend of the activation energy below and above 750 K, as well as the pre-exponential factor A appearing in Equation (1), are reported as a function of the ionic size of the doping ion.
In spite of the large differences in ionic conductivity existing between systems doped with different RE3+ [34], the maximum in σ ( σ m a x ) occurs within a narrow compositional interval, namely at x (in Ce1−xRExO2−x/2) ranging between 0.10 and 0.25 for the majority of the studied systems, such as for RE ≡ Gd [2], Sm [38], Lu [39], as well as (Nd,Tm) [33]. At higher x, ionic conductivity significantly drops, and its absolute value becomes no more significant for any application; nevertheless, even heavily RE-doped systems are of great interest in fundamental research, since they allow to correlate subtle structural details to transport properties [31,32,40,41,42]. The substantial coincidence of the position of σ m a x in different systems suggests that the appearance in diffraction patterns of peaks attributable to defect clusters at largely different x values for different RE ions, does not mean that the F phase has a different extent according to the RE identity; on the contrary, C defect aggregates are present and stable even at very low RE concentration, but due to their different spatial correlation, they can be identified by X-ray diffraction at different x values [33].
In addition to the numerous studies performed on singly-doped ceria systems, also a large number of doubly- and multiply-doped systems has been investigated, such as Gd/Y- [43], Gd/Sm- [44], La/Sm- [35], Sm/Nd- [45], Nd/Gd- [46], La/Dy- [47], Gd/Sm/La [48]. A general lowering of activation energy [33] and an improvement of the ionic conductivity properties [43,49,50] with respect to singly-doped ceria is often observed.

3.2. Ionic Conductivity in Doped Ceria Thin Films

When approaching thin films, the first and foremost character to be taken into account is their 2D nature, which strongly affects all their properties. Going into detail of the particular case of doped ceria, ionic conductivity results to be specifically driven, in addition to the factors mentioned in the previous paragraph, also valid for the material in bulk form, by the strain arising at the film/substrate interface, and by the dislocations content.
The unavoidable lattice mismatch occurring at the film/substrate interface is responsible for the former item, namely for the occurrence of strain. Tensile strain, in particular, is believed to operate a decrease in the activation energy to ionic conduction, and therefore an improvement of this property, while the opposite occurs when compressive strain arises [51,52]. This happens because a migrating oxygen ion, while hopping from one to another vacancy site, has to move through a narrow aperture, namely the space between two cations, which is generally much smaller than the oxygen ion radius. A tensile strain contributes to widen this aperture, thus favoring the movement of oxygen ions. As the activation energy to ionic conduction is directly correlated to the lattice perturbation needed to let the O2− ion through, a tensile strain helps to reduce this quantity. This evidence is further corroborated by the increase in the activation energy observed in buckled free-standing doped ceria membranes, which are subjected to a compressive stress due to the buckling itself [53]. For instance, an increase of 0.13 eV was observed in the activation energy of a Ce0.8Gd0.2O1.9 free-standing membrane as a response to a 1.78% compressive strain with respect to the flat substrate-supported thin film with the same composition [54]. Similarly, a multilayer oxide-based device consisting in alternating layers of Ce0.9Gd0.1O1.95 and Er2O3, where the number of individual layers was changed from 1 to 60 in order to vary the strain-activated volume, presents an increase in activation energy by 0.31 eV with enhancing the compressive strain by 1.16% [54].
The effect of strain on ionic conductivity is comparable to that of introducing doping ions into the ceria lattice: inducing strain by using a doping ion with a significantly different size than Ce4+ causes in fact a change in ionic conduction, due to the variation of internal pressure caused by the foreign ion [34]. Computational simulations performed on Ce1−xYxO2−x/2, for example, suggest that the application of isotropic strain to the bulk material induces an increase in ionic conductivity by three times at 1273 K for x = 0.18 [8]. It can be thus concluded that both doping and the existence of a lattice mismatch have to be carefully considered when designing doped ceria thin films. Therefore, the desired transport properties can be engineered as a combined result of internal and external strain.
In light of the previous considerations, the aforementioned film/substrate lattice mismatch comes as an ideal item, acting as a strain source; coherently grown films, in particular, are especially affected. Nonetheless, provided that the lattice mismatch, if exerting a tensile strain, plays a positive role in improving ionic conductivity, it should never overcome a certain threshold, which primarily depends on the elastic properties of the material; otherwise, the excess strain is released through the formation of dislocations. The segregation of both trivalent cations and oxygen vacancies in the vicinity of the dislocation satisfies the natural tendency to reduction of elastic energy around these defects, and it necessarily reduces ionic conductivity [55]. For this reason, a direct growth of doped ceria on a MgO substrate is not recommended: the 8.62% lattice misfit ε ( ε = a c e r i a a s u b s t r a t e a c e r i a · 100 , with a the lattice parameter) is too large to ensure a proper substrate/film match [56]. If, on the contrary, a SrTiO3 buffer layer is interposed between MgO and the film, in the particular case of Sm-doped ceria ε is reduced to 1.62% if the cubic axis of the growing film is rotated by 45° with respect to the one of the substrate, thus allowing to take advantage of a significant ionic conductivity increase. Moreover, the lattice mismatch lies at the root of the often observed columnar growth of the film, which takes place as an attempt to accommodate interfacial strain [57].
That being said, the literature provides a large amount of even not entirely agreeing data; nevertheless, even if the colossal ionic conductivity increase by a factor 108 observed in YSZ grown on SrTiO3 and ascribed to the very large tensile strain [58] does not take place in doped ceria, most studies point at an increase in ionic conductivity of strained films with respect to their bulk unstrained counterpart. This evidence is generally deemed as a direct consequence of the increase of mobile ions at the strained interface [59]. Ce0.8Gd0.2O1.9 thin films grown on a MgO crystal, for instance, are reported to present very similar values of ionic conductivity and activation energies as the corresponding bulk material, perhaps due to the very large lattice mismatch [60], while Ce0.8Sm0.2O1.9 films grown on SrTiO3-buffered MgO present at 973 K a σ value of 0.07 S·cm−1, to be compared to σ = 0.02 S·cm−1 deriving from dense polycrystalline pellets [57] an even larger ionic conductivity enhancement takes place in Sm-doped ceria/YSZ films deposited on the same substrate [60]. A clear increase in ionic conductivity with increasing strain was observed at each temperature considered in the range 723–1123 K in epitaxial Ce0.9Gd0.1O0.95 thin films grown on SrTiO3-buffered MgO [7].
It is the interplay between two main parameters which rules the dependence of ionic conductivity on strain: film thickness and grain size. The former can be understood in terms of volume fraction of strained material: the thinner the film, the larger the strained volume fraction. A strong increase in ionic conductivity for instance was observed in epitaxial grown Sm-doped ceria/YSZ films with reducing film thickness [61]; moreover, an ideal film thickness of ~80 nm was suggested to achieve the maximum ionic conductivity in Ce0.8Gd0.2O0.9 films deposited by pulsed laser deposition on single crystal (0001) Al2O3 substrates, as the best compromise between the strain induced by lattice misfit and the grain boundary conduction associated to grain size [62]. Nevertheless, even the thickness of the buffer layer plays a role: a controlled reduction of the SrTiO3 layer implies a weaker compensation of the ceria/MgO lattice mismatch, thus leading to an enhancement of ionic conductivity, as experimentally observed in epitaxial Ce0.9Gd0.1O0.95 thin films [63]. Finally, it is noteworthy that an increase in ionic conductivity is also observed in doubly-layered Sm-doped ceria/YSZ films with increasing the amount of bilayers and keeping constant the overall film thickness [62].
As aforementioned, even the grain size is a relevant item when discussing the ionic conductivity of doped ceria films. Generally speaking, the reduction of the grain size always implies an increase in the grain boundary volume and, as a consequence, a progressively larger contribution to transport properties of the latter. This normally translates into a conductivity decrease, at least in bulk materials. In ionic conducting thin films, something different happens. As already observed and discussed by Christie and Berkel [63], in such films a grain size decrease induces an increase in the grain boundary conductivity. An increase in σ , for example, was observed in Ce0.8Gd0.2O0.9 films deposited by spin-coating on a sapphire substrate with decreasing the grain size, most probably due to the reduction of the activation energy as a consequence of the segregation of impurities within the grain boundary volume [64,65]. This is a general achievement; despite the scatter among absolute conductivity values reported in different papers [66,67,68], it seems to be correlated to the decrease in activation energy, occurring irrespective of the different deposition techniques. Anyway, since films containing smaller grains display larger strain [66], the described evidence is a further clear indication toward a direct correlation between strain and ionic conductivity.

3.3. Thin Films Deposition Processes

Deposition techniques useful to prepare doped ceria thin films can be divided into two main groups, namely the vacuum- and the precipitation-based ones. To the former belong all techniques making use of a target consisting in a sintered pellet; the latter, on the contrary, rely on the employment of solvents.
To obtain dense thin films of doped ceria, sputtering and pulsed laser deposition (PLD) are widely used, since they allow to obtain thin doped ceria layers, starting from the precursors powders. For instance, Liu et al. [26] used the rf magnetron sputtering method to deposit a ~16 ± 2 nm film on a Pt/Ti/SiO2/Si substrate for the use in memristive devices, working at room temperature, and starting from a CeO2-x ceramic target, under ultra-fine Ar atmosphere. Recently, Kumar et al. [16] employed pulsed laser deposition to deposit Sm-Gd co-doped ceria films on Si (111), starting from a dense sintered pellet of Gd2O3, Sm2O3 and CeO2 in the molar ratio 1:1:8; the deposition process was performed under different oxygen pressure conditions, to determine the effect of pO2 on the structural and morphological properties of the grown films.
However, the sputtering and PLD methods are generally not so cost-effective, since they require very complex apparatuses, therefore making the scaling-up of the thin films production process very difficult to achieve. Schlupp et al. [69] proposed an efficient and cheap way to obtain Gd-doped ceria films by aereosol assisted chemical vapor deposition, starting from stoichiometrically mixed precursors solutions of cerium (IV) and gadolinium (III) 2,2,6,6-tetramethylheptanedionate, and performing the deposition on Si (100) and sapphire single crystals. Lair et al. [70] carried out a study on the structural and morphological properties of electrodeposited samaria-doped ceria films, to determine their possible use in μ-SOFCs. In the mentioned experiment, thin films were deposited on a stainless steel substrate at room temperature (303 K), from aqueous electrolytic solutions in which a supporting electrolyte (NaNO3 0.1 M) and stoichiometric amounts of Ce(NO3)3·6H2O and Sm(NO3)3·6H2O were dissolved.
In this section, only a few possible techniques for the ceria-based thin films preparation are presented, but several others can be found in literature [71]: a more detailed discussion is beyond the aim of the present paper.

4. High Pressure Diffraction Studies on Bulk Doped Ceria: A Bridge between Bulk and Thin Films

4.1. Why High Pressure X-ray Diffraction?

X-ray diffraction is well known to be a powerful experimental technique, which provides a fundamental contribution to the comprehension of structure [41], microstructure [72], occurrence of defects [13], and crystallinity [73]. In the particular case of doped ceria, it is evident that strain contributes in a fundamental way to ionic conduction of thin films. As aforementioned, tensile strain has to be high enough to enable a significant reduction of the activation energy to ionic conduction, but at the same time it should not exceed a certain threshold, in order to avoid the appearance of dislocations. In this respect, thin film compositions able to accommodate a large strain are potential promising candidates ionic conductors. The ability of a material to accommodate strain is expressed by the compressibility of the material ( k ), namely its ability to modify its volume as a response to a pressure change. Its reciprocal, the isothermal bulk modulus B 0 , is defined as:
B 0 = V 0 P V P = 0
where V 0 is the cell volume at ambient conditions. If, as it is desirable, k is large, B 0 obviously assumes a small value. The latter condition is also advantageous because it implies a small volume elastic energy, and a substantial suppression of the dislocations generation.
The investigation of strain and strain-related phenomena in thin films is experimentally quite difficult due to the need to exclude the contribution of the substrate from the measurement of any property. Within this framework, in-situ high pressure X-ray diffraction applied to bulk samples of doped ceria comes to aid, allowing to determine for each composition the isothermal bulk modulus B 0 by properly treating the refined cell volumes, and hence k . In this work, the calculation is conveniently limited to the F phase, since this is the atomic arrangement where ionic conduction takes place, but it could be in principle extended even to C. In order to gain an idea of the correspondence between applied pressure and strain, it is interesting to notice that applying a pressure of ~20 GPa to a Gd-doped ceria bulk sample causes a compressive strain of around 5%, while the application of 5 GPa roughly corresponds to a 1% compressive strain [7].

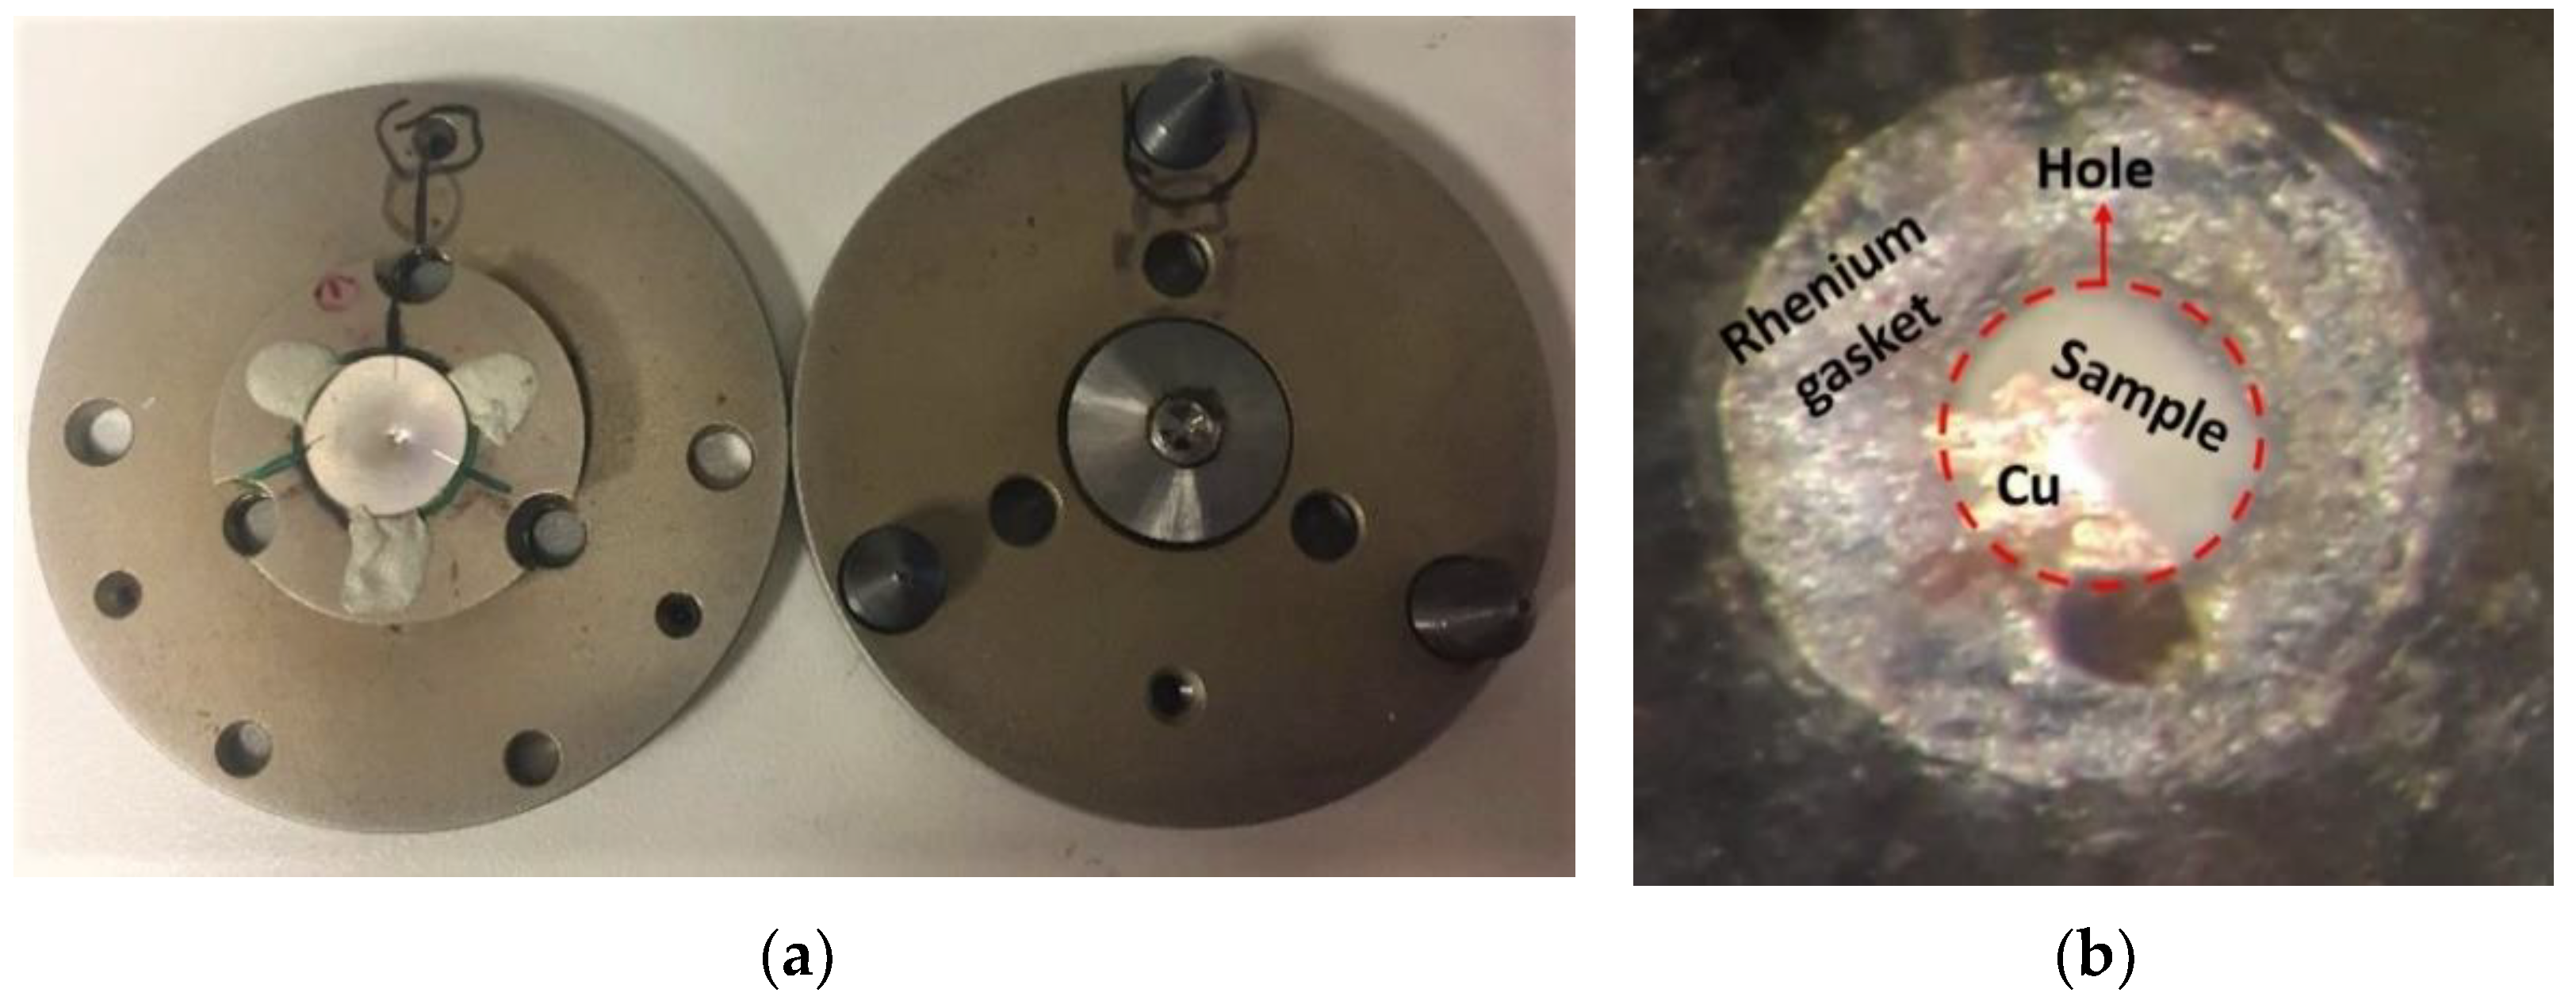
4.2. Fundamentals on the Experimental Method

Diamond anvil cells (DACs) are generally used to apply pressure on a selected sample by pressing it between two perfectly aligned diamond culets that slowly move closer to each other thanks to a gear-driven mechanism: the maximum achievable pressures can vary a lot, mainly depending on the DAC model. The present devices can be used to apply pressure on a given sample either anisotropically or isotropically. In the former case, uniaxial pressure is applied to the sample simply pressing it between the diamonds; in the latter, sample powders are loaded inside the pressure chamber of a specific metallic sample-holder (the so-called gasket), and a pressure transmitting medium (PTM) is required to uniformly distribute pressure within the chamber. Silicon oil, NaCl powders and Ar (in membrane-DACs) are examples of widely used PTM: to ensure the hydrostatic distribution of pressure inside the chamber, an ideal sample:PTM volume ratio of 20:80 is generally needed. In any case, in order to determine the effective pressure exerted on the sample, an internal standard is required: generally, a material with a well known high-pressure structural behaviour (e.g., Cu).
Electromagnetic waves enter the cell passing through the diamonds, and interact with the pressed sample: therefore, the described device is potentially compatible with many experimental techniques, mainly depending on the DAC model and characteristics (e.g., DAC with ultra low fluorescence diamonds for Raman spectroscopy).
As aforementioned, the maximum achievable pressure is strongly influenced by the diamond culet size employed: the lower the culet diameter, the higher the maximum pressure. For instance, a cell with Boehler-Almax designed diamonds with a Ø > 1 mm culet allows to reach a maximum pressure of 5 GPa, meanwhile in principle, with a Ø = 200 μm diamond, pressures higher than 100 GPa can be reached. However, also the gasket preparation process must be performed with the utmost care. In fact, the sample chamber consists in a hole drilled throughout a metallic disc that has been previously thinned by being pressed between the diamonds of the cell: an excessive gasket thickness, a non-circular hole or a hole which is not drilled at the centre of the diamond culets impression, or even an overfilled sample chamber can affect the maximum achievable pressure. Moreover, the hydrostatic limit of the selected PTM is also very important: for instance, a 4:1 mixture by volume of methanol and ethanol, which is one of the most commonly used liquid PTM, allows to work in hydrostatic conditions up to 10 GPa, while argon allows to reach higher pressures, since it causes a very small pressure gradient (<1.5%) at 80 GPa [74]. The silicon oil employed in the experiments by the present research group ensured the hydrostatic working conditions up to 10 GPa, therefore covering the whole considered pressure range.
The authors’ research group focused on RE-doped ceria systems containing RE ≡ Lu [11], Sm [12] and a mixture of Nd/Tm ions [13]. In particular, the last-mentioned system was synthesized using a Nd/Tm = 0.74/0.26 ratio, in order to reproduce the average ionic size of Sm3+ (C.N. 8), being Sm-doped ceria one of the most promising electrolytes for solide oxides cells [75]: Ce0.8Sm0.2O1.90, for example, reaches the remarkable σ value of 10−2 S cm−1 at 773 K [38]. All the samples were prepared by coprecipitation of the corresponding mixed oxalates, and by subsequent thermal treatment at 1173 K for 3 days in order to obtain a high crystallinity degree, as thoroughly described in [41,76]. Going into detail, authors studied Ce1−xRExO2−x/2 systems with x ranging between 0.1 and 0.4 for RE ≡ Lu [11], 0.2 and 0.6 for RE ≡ Sm [12], and 0.1 and 0.6 RE ≡ (Nd,Tm) [13]. Moreover, regarding the Lu-doped ceria system, even the composition having x = 0.8 was studied. Samples are named according to the RE doping ion identity and to its percentage amount with respect to the total lanthanide content. For example, the name Sm20 corresponds to the composition Ce0.8Sm0.2O1.9.
High pressure X-ray diffraction data of the aforementioned systems were collected at the Xpress beamline of the Elettra synchrotron facility, located in Basovizza (Trieste, Italy). Pressure was applied to all the doped ceria powders up to ~7 GPa, thus obtaining comparable data for all the considered systems; at least six different pressure values were taken into account for each sample. Powders were loaded in a gear-driven Boehler-Almax plate DAC equipped with diamonds with a 300, 500 or 600 µm culet size (respectively for RE ≡ Nd/Tm, Sm and Lu), and characterized by a large X-ray aperture. For instance, the 300 µm culets DAC is characterized by an angular aperture of 60°, thus allowing to collect the image of the diffraction rings in the angular range from –30° to 30°. The pressure chambers were settled by drilling hole with a diameter of 100, 200 or 150 µm (respectively for RE ≡ Nd/Tm, Sm and Lu) through spark-erosion in several 200-µm-thick rhenium gaskets, which had been previously indented to reduce their thickness below 110 µm (70 for RE ≡ Lu, for which stainless steel gaskets were employed). Silicone oil was used as the pressure transmitting medium, and pressure calibration was performed by two different methods: either by placing Cu foils into the sample chamber (as depicted in Figure 4), and taking into account the displacement of the (111) diffraction peak with increasing pressure, or by using ruby chips, studying the displacement of their fluorescence lines. All the diffraction analyses were performed in hydrostatic conditions.
The Xpress beamline is equipped with a MAR345 image plate detector allowing to collect images of the diffraction rings, which are subsequently converted into the typical 2 ϑ -intensity diffraction patterns by the Fit2D software [77]. The 2 ϑ range spanned between 5° and 24° for RE ≡ Nd/Tm, between 6° and 36° for RE ≡ Lu, and between 4° and 30° for RE ≡ Sm. The FullProf Suite [78] was used to refine by the Rietveld method [79] the structural models reported in Section 3.1, which describe the obtained diffraction patterns.

4.3. Fundamentals on Data Analysis

Diffractograms were treated through the Rietveld method by refinement of the structural models which better describe experimental data. As elucidated in Section 3.1, RE-doped ceria crystallizes in the F structure up to a certain RE3+ doping ion amount; beyond this limit, defect aggregates characterized by the C structure appear. If Ce4+ and RE3+ are sufficiently close in size, the cited C defect clusters act as guests of the CeO2-based solid solution. Since C is a superstructure of F, and due to the aforementioned Ce4+/RE3+ close size similarity, such as in the case of RE ≡ Gd3+ and Sm3+ (Ce4+, CN:8, r = 0.97 Å; Sm3+, CN:6, r = 0.958 Å; Gd3+, CN:6, r = 0.938 Å [80]), diffraction patterns of C and F only differ by the superstructure peaks, while all the other ones coincide. The exactly double length of the C cell parameter with respect to the one of F is a further proof of that. As the amount of C defect aggregates gradually grows with increasing the RE3+ content, neither the F nor the C model properly describe the real atomic arrangement; on the contrary, an intermediate or hybrid model (called H), is the best candidate. In H, structural parameters sensitive to the F/C passage, such as the x coordinate of the 24d site, occupied by Ce and RE, and the occupancy factor of the 16c site, populated by O, display a progressive transition from the values typical of F to the ones of C with increasing the RE content. If, on the contrary, Ce4+ and RE3+ are too different in size, namely starting from RE ≡ Tm and going toward smaller RE elements [81], a two-phase field (F + C) becomes stable beyond the stability region of the CeO2-based solid solution. In the light of these considerations, among the studied systems, while Sm- and (Nd,Tm)-doped ceria show the hybrid region, in Lu-doped ceria the biphasic (F + C) field appears. Relying on the occurrence of diffraction peaks, in Ce1−xRExO2−x/2 the F region extends up to x = 0.3, 0.4 and 0.5 for RE ≡ Sm, Lu, and (Nd,Tm), respectively. This means for instance that in sample Lu80 a mixture of the F and C phase is present, with C largely prevailing over F [42]. Structural models were refined accordingly; for sake of clarity, the F, C and H structural models are reported in the Supplementary Materials (Table S1).
In order to elaborate each diffraction pattern, the peak profile was optimized by the pseudo-Voigt function, while the background was refined by linear interpolation of a set of ~70 experimental points. In the last refinement cycle, structural parameters (cell parameters, and for the H phase the Ce/RE1 x coordinate, the O1 x, y and z coordinates, and both the occupancy factor and the x coordinate of O2), atomic displacement parameters, the scale factor, five peak parameters and the background points were allowed to vary. For each sample, high pressure data were refined using as starting parameters the optimized values of atomic positions found at ambient pressure. In compositions containing Cu as internal standard, angular regions where peaks of Cu occur were excluded from refinements. In Figure 5, the Rietveld plot of sample Sm60 at 4.11 GPa is reported as a representative example. The diffraction pattern presents the so called hybrid structure (H), resulting from the intimate intergrowth of the F and the C lattices (see Section 4.3), where C is a superstructure of F. The main peaks detectable in the diffraction pattern are the ones common to F and C; the minor peaks, on the contrary, can be ascribed to the C phase contribution.
Performing high pressure X-ray diffraction analyses on a given system allows to determine the equation of state (EoS) by studying the evolution of the refined unit cell volumes under the effect of an applied pressure. The isothermal EoS of a solid is quite complex, and it is generally satisfactorily described by a refinable model; among all the possibilities, the four most common equations are Murnaghan [82], Birch-Murnaghan [83] natural strain [84], and Rose-Vinet [85]. All of them express the relation between the unit cell volume of the material at ambient conditions ( V 0 ) and pressure ( P ), in terms of bulk modulus at zero applied pressure and its first pressure derivative ( B 0 and B 0 , respectively). The Murnaghan EoS [82], in particular, relies on the assumption that the bulk modulus linearly varies with pressure; according to it, the dependence of pressure on volume can be written as:
P V = B 0 B 0 V 0 V B 0 1
A further development of this theory is represented by the work of Birch [83], who concentrated on the application to a cubic cell of strain consisting in a hydrostatic compression plus a homogeneous infinitesimal strain. The treatment gives rise to the following form of P V :
P V = 3 B 0 2 V 0 V 7 3 V 0 V 5 3 1 + 3 4 B 0 4 V 0 V 2 3 1
The Natural Strain EoS, which was elaborated by Poirier and Tarantola [84], is a logarithmic equation expected to be valid for a wider pressure range than the aforementioned ones, and it can be expressed as follows:
P V = B 0 V 0 V l n V 0 V + B 0 2 2 l n V 0 V 2
Finally, the Rose-Vinet EoS [85] was originally thought to predict the high temperature response of a material to the application of an external pressure; to accomplish this goal, the knowledge at each different temperature of B 0 , B 0 , V 0 and of the coefficient of thermal expansion (CTE) at zero pressure, are needed. Following the proposed approach, it is possible to provide an estimation of the temperature dependence of CTE, B 0 and B 0 . The expression of P V follows.
P V = 3 B 0 X 2 1 X e x p η 0 1 X
with
X = V V 0 1 / 3
and
η 0 = 3 2 B 0 1
Starting from the refined unit cell volumes of the F phase, the most suitable EoS was determined for each sample by using the EoSFit7_GUI software [86]. In particular, for all the considered systems, different EoS were tested, and in spite of the generally negligible discrepancies among the results deriving from different equations, the best results were always reached using the third order Rose-Vinet equation.
Refinements of the equation of state through the described Rose-Vinet model provided the results reported in Table 1.

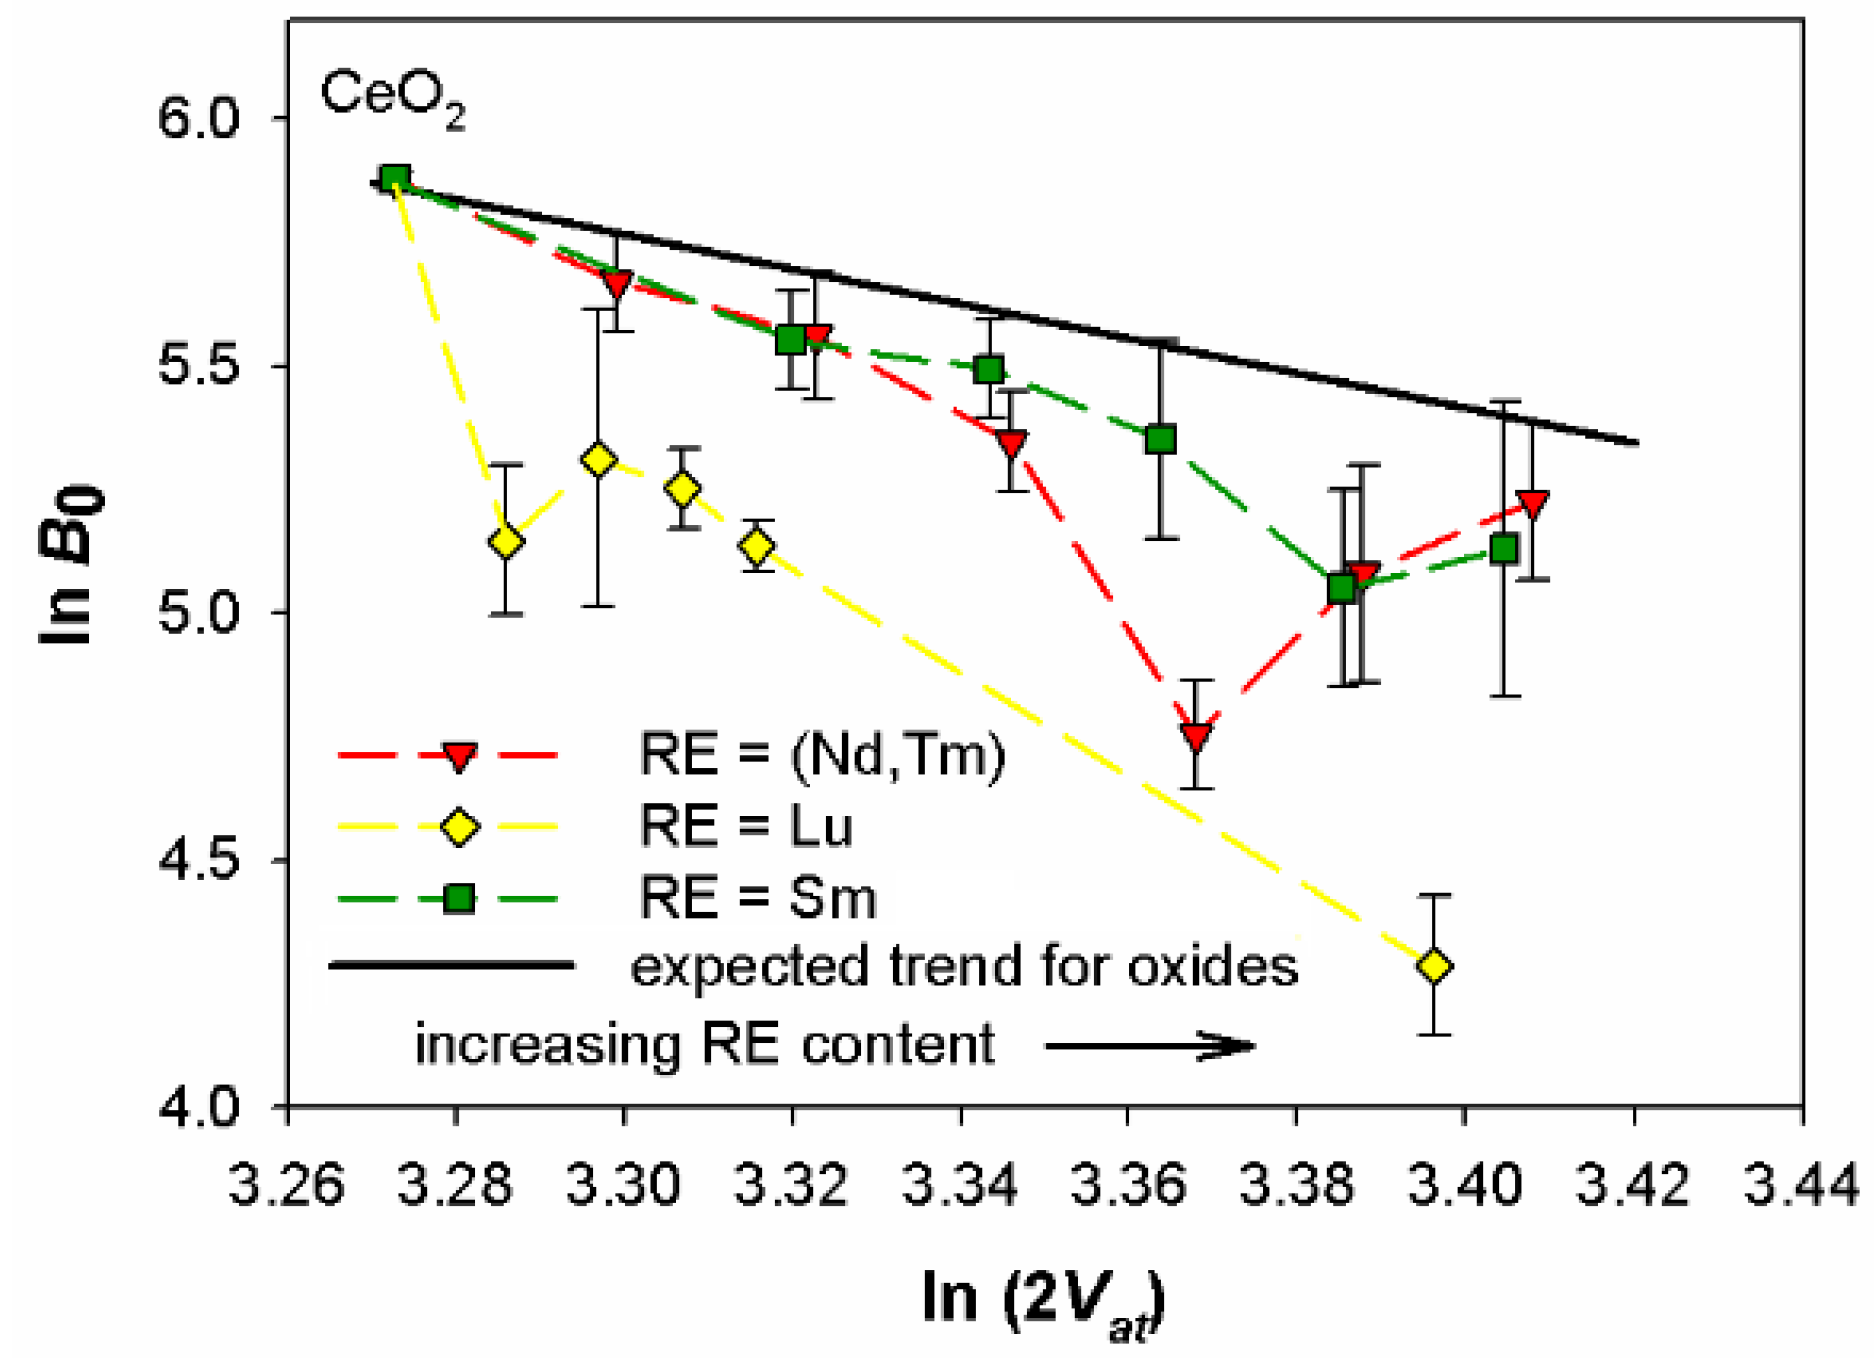
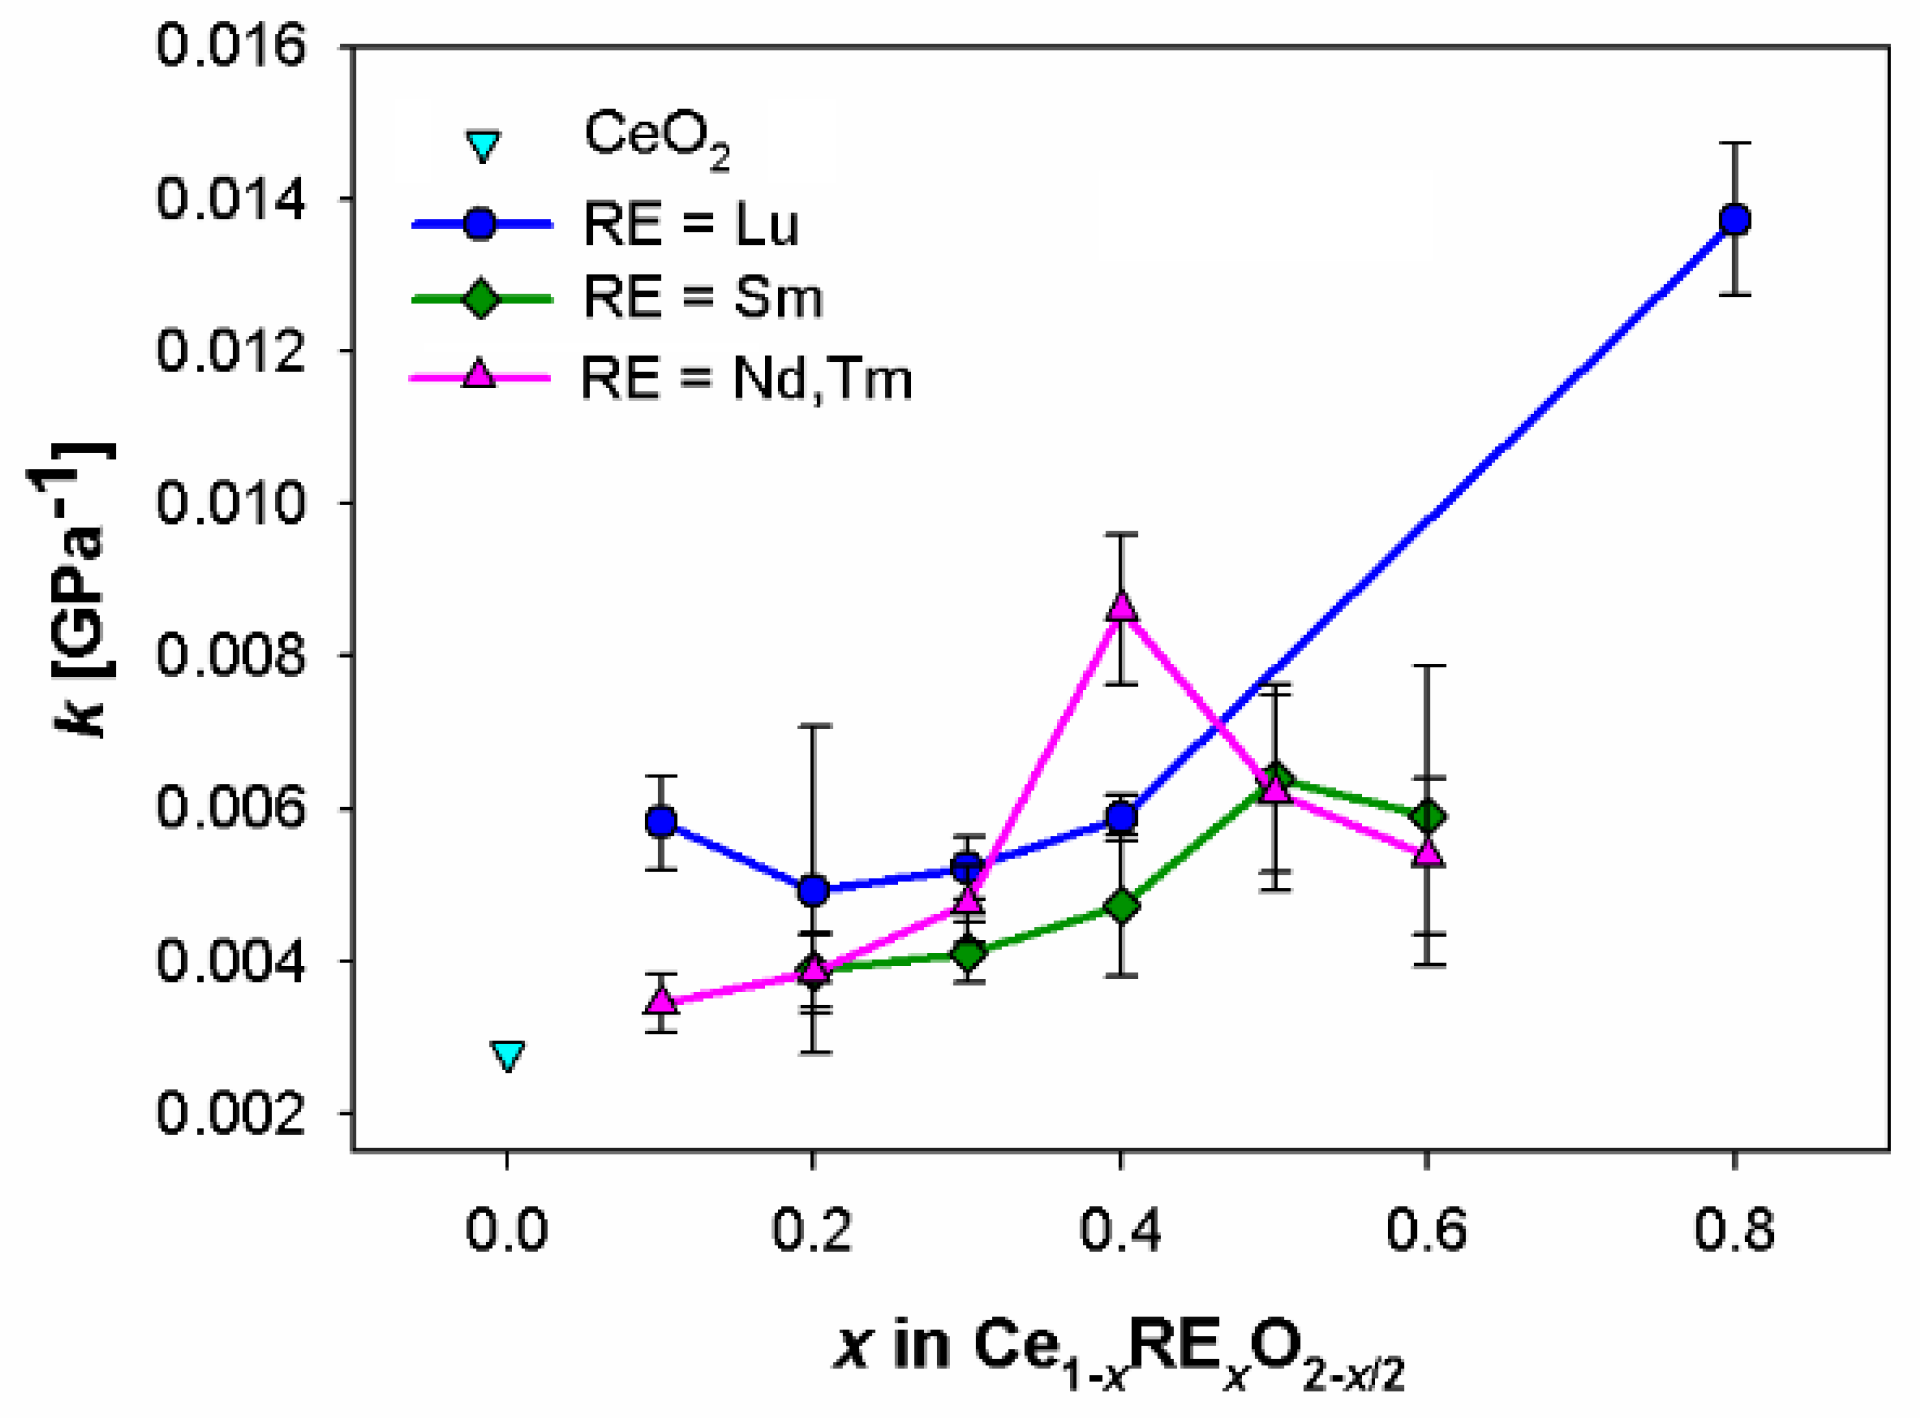
4.4. High Pressure X-ray Diffraction Studies on Sm-, Lu-, and (Nd,Tm)-Doped Ceria: How They Can Drive the Design of Thin Films

The examination of data reported in Table 1 reveals in each system a generally decreasing trend of B 0 of the F phase with increasing the RE content. This finding is in good agreement with the results presented by Rainwater et al. [10] on Sm-doped ceria: notwithstanding the slight different absolute B 0 values, a significant decrease of bulk modulus with increasing the doping ion content occurs even in their data.
The described behavior can be interpreted in the light of the masterly work by Anderson and Nafe [87], who in 1965 studied the correlation between bulk modulus and mean atomic volume ( V a t ) of covalent crystals and oxides. They moved from the observation that ln B 0 shows a linear correlation to ln 2 V a t , which is obeyed by a huge variety of compounds, and finally accomplished the development of the following empirical law:
ln B 0 = m ln 2 V a t + c o n s t a n t
Equation (9) is valid both for covalent crystals and oxides, with the only difference that m assumes the value 4 / 3 in the former compounds, while it ranges between 3 and 4 in the latter. It suggests that oxides are characterized by a much stronger decrease of B 0 with increasing V a t with respect to covalent compounds.
In Figure 6, the trend of ln B 0 vs. ln 2 V a t is reported for all the studied systems, together with the line representing the expected trend for oxides according to Anderson and Nafe; the latter was built attributing to m the intermediate value 3.5. At first sight it can be observed that qualitatively even doped ceria follows the trend common to oxides. V a t is defined as the lattice volume divided by the number of atoms therein contained; it is, therefore, noteworthy that with increasing the content of the trivalent doping ion, the oxygen amount, and hence the total number of atoms per formula unit, proportionally decreases. It results thus clear that within the considered systems, an increase in V a t derives from an increase in the RE3+ content. A closer observation of the diagram reveals that, even if the trend of doped ceria systems roughly complies with that of other oxides, the decreasing rate is higher for the former, being for instance m ~6 for both Sm- and (Nd,Tm)-doped ceria at low doping content. Moreover, it can also be observed that the deviation from the expected trend becomes progressively larger on going from Sm- to (Nd,Tm)- to Lu-containing systems, i.e., with introducing progressively smaller doping ions. This evidence finds an explanation considering that the binding energy, and thus the stability, of C defect aggregates becomes larger with decreasing the RE3+ size [37]; therefore, at a given x in Ce1−xRExO2−x/2, for RE ≡ Lu the amount of C defect associates is higher than for RE ≡ (Nd,Tm) and Sm. The case of doubly-doped ceria is particularly intriguing, because out of Nd3+ and Tm3+, the latter preferentially and in large amount enters C defect clusters, being Tm3+ the smaller of the two ions. This item leads the (Nd,Tm)-doped system to present lower B 0 values than the Sm-containing system, notwithstanding the identical average ionic size of doping ions in the two systems.
The subtraction of RE ions from the F matrix through the formation of C domains implies that the total number of atoms/unit formula of the F phase is overestimated if the nominal stoichiometry of the overall oxide is taken into consideration. This issue explains the discrepancy between the expected and the experimental trend of ln B 0 vs. ln 2 V a t , and it is thoroughly discussed in [13], where an estimate of the defect clusters amount is also provided.
The significant difference in B 0 between different systems at a given x, clearly visible in Figure 3, is also revealed in compressibility. Figure 7 depicts the behavior of compressibility k as a function of the doping ion amount x. A general increasing trend can be appreciated with increasing x for each system, but even more interestingly, the presence of smaller doping ions promotes the occurrence of larger compressibility values at each given x.
These findings have some important implications in the framework of the design of thin films. As previously discussed, ionic conductivity in thin films is strictly dependent, in addition to other factors, also on the amount of tensile interfacial strain which can be accommodated without releasing it through the formation of dislocations; in other words, it strongly depends on the material compressibility. Therefore, the results presented in this work suggest that, in terms of compressibility, the employment of (a) small doping ions and (b) high doping contents are to be preferred. These guidelines need of course to be reconciled with other parameters contributing to ionic conduction, such as the effect of the RE chemical identity, and the observed drop beyond a certain x value. Nevertheless, they can be considered as a further reference point to be taken into account when designing doped ceria thin films to be used as electrolytes in solid oxide microdevices.

5. Conclusions

This work critically reviews papers recently appeared in the literature dealing with the use of in situ high pressure X-ray diffraction in the design of doped ceria thin films to be mainly used as solid electrolytes in solid oxide electrochemical microdevices; it discusses the results therein reported highlighting the role of the bulk modulus of the bulk material in the choice of the most proper compositions of films.
The tensile strain possibly arising at the film/substrate interface gives a significant contribution to ionic conduction in doped ceria thin films, provided that it is not released through the occurrence of dislocations; compressibility is therefore a measure of the strain amount which can be tolerated by the structure. Within this scenario, the evaluation of bulk modulus through the refinement of the material equation of state, and hence of compressibility, is of help. Results obtained from Sm-, (Nd,Tm)- and Lu-doped ceria show that the smaller the doping ions, the higher compressibility, as a consequence of the higher binding energy of defect clusters containing smaller rare earths.

Supplementary Materials

The following are available online at https://www.mdpi.com/article/10.3390/coatings11060724/s1, Table S1: Hybrid structural model compared to the F model typical of CeO2 and the C model typical of sesquioxides of heavy rare earths, such as Tm2O3.

Author Contributions

Conceptualization, C.A.; methodology, S.M. and C.A.; investigation, S.M.; resources, C.A.; writing—original draft preparation, S.M., A.C. and C.A.; writing—review and editing, S.M., A.C. and C.A.; project administration, C.A.; funding acquisition, C.A. All authors have read and agreed to the published version of the manuscript.

Funding

This research was funded by Compagnia di San Paolo, in the frame of the project COELUS—ID ROL: 32604.

Institutional Review Board Statement

Not applicable.

Informed Consent Statement

Not applicable.

Data Availability Statement

No new data were created or analyzed in this study. Data sharing is not applicable to this article.

Acknowledgments

Authors would like to thank the Elettra synchrotron facility for the provision of beamtime.

Conflicts of Interest

The authors declare no conflict of interest. The funders had no role in the design of the study; in the collection, analyses, or interpretation of data; in the writing of the manuscript, or in the decision to publish the results.

References

  1. Mogensen, M.; Sammes, N.M.; Tompsett, G.A. Physical, chemical and electrochemical properties of pure and doped ceria. Solid State Ion. 2000, 129, 63–94. [Google Scholar] [CrossRef]
  2. Steele, B.C.H. Appraisal of Ce1−yGdyO2−y/2 electrolytes for IT-SOFC operation at 500 °C. Solid State Ion. 2000, 129, 95–110. [Google Scholar] [CrossRef]
  3. Spiridigliozzi, L.; Di Bartolomeo, E.; Dell’Agli, G.; Zurlo, F. GDC-based infiltrated electrodes for solid oxide electrolyzer cells (SOECs). Appl. Sci. 2020, 10, 3882. [Google Scholar] [CrossRef]
  4. Beie, H.-J.; Gnörich, A. Oxygen gas sensors based on CeO2 thick and thin films. Sens. Actuators B Chem. 1991, 4, 393–399. [Google Scholar] [CrossRef]
  5. Gerblinger, J.; Lohwasser, W.; Lampe, U.; Meixner, H. High temperature oxygen sensor based on sputtered cerium oxide. Sens. Actuators B Chem. 1995, 26, 93–96. [Google Scholar] [CrossRef]
  6. Yang, J.J.; Strukov, D.B.; Stewart, D.R. Memristive devices for computing. Nat. Nanotechnol. 2013, 8, 13–24. [Google Scholar] [CrossRef] [PubMed]
  7. Kant, K.M.; Esposito, V.; Pryds, N. Strain induced ionic conductivity enhancement in epitaxial Ce0.9Gd0.1O2−δ thin films. Appl. Phys. Lett. 2012, 100, 033105. [Google Scholar] [CrossRef] [Green Version]
  8. Burbano, M.; Marrocchelli, D.; Watson, G.W. Strain effects on the ionic conductivity of Y-doped ceria: A simulation study. J. Electroceramics 2014, 32, 28–36. [Google Scholar] [CrossRef] [Green Version]
  9. Rupp, J.L.; Infortuna, A.; Gauckler, L.J. Thermodynamic stability of gadolinia-doped ceria thin film electrolytes for micro-solid oxide fuel cells. J. Am. Ceram. Soc. 2007, 90, 1792–1797. [Google Scholar] [CrossRef]
  10. Rainwater, B.H.; Velisavljevic, N.; Park, C.; Sun, H.; Waller, G.H.; Tsoi, G.M.; Vohra, Y.K.; Liu, M. High pressure structural study of samarium doped CeO2 oxygen vacancy conductor—Insight into the dopant concentration relationship to the strain effect in thin film ionic conductors. Solid State Ion. 2016, 292, 59–65. [Google Scholar] [CrossRef] [Green Version]
  11. Artini, C.; Joseph, B.; Costa, G.A.; Pani, M. Crystallographic properties of the Ce1-xLuxO2−x/2 system at pressures up to 7 GPa. Solid State Ion. 2018, 320, 152–158. [Google Scholar] [CrossRef]
  12. Artini, C.; Massardo, S.; Carnasciali, M.M.; Joseph, B.; Pani, M. In situ high pressure structural investigation of sm-doped ceria. Energies 2020, 13, 1558. [Google Scholar] [CrossRef] [Green Version]
  13. Artini, C.; Massardo, S.; Carnasciali, M.M.; Joseph, B.; Pani, M. Evaluation of the defect cluster content in singly and doubly doped ceria through in situ high-pressure X-ray diffraction. Inorg. Chem. 2021, 60, 7306–7314. [Google Scholar] [CrossRef]
  14. Artini, C. RE-doped ceria systems and their performance as solid electrolytes: A puzzling tangle of structural issues at the average and local scale. Inorg. Chem. 2018, 57, 13047–13062. [Google Scholar] [CrossRef] [Green Version]
  15. Inaba, H.; Tagawa, H. Ceria-based solid electrolytes. Solid State Ion. 1996, 83, 1–16. [Google Scholar] [CrossRef]
  16. Kumar, S.A.; Kuppusami, P.; Yen-Pei, F. Structural, morphological and electrical properties of Sm-Gd Co-doped ceria thin films for micro-solid oxide fuel cells. Mater. Lett. 2020, 275, 128110. [Google Scholar] [CrossRef]
  17. Bastakys, L.; Kalyk, F.; Marcinauskas, L.; Čyvienė, J.; Abakevičienė, B. Structural investigation of gadolinia-ceria multilayered thin films deposited by reactive magnetron sputtering. Mater. Lett. 2020, 271, 127762. [Google Scholar] [CrossRef]
  18. Sanna, C.; Zhang, W.; Costamagna, P.; Holtappels, P. Synthesis and electrochemical characterization of La0.6Sr0.4Co0.2Fe0.8O3–δ/Ce0.9Gd0.1O1.95 co-electrospun nanofiber cathodes for intermediate-temperature solid oxide fuel cells. Int. J. Hydrog. Energy 2021, 46, 13818–13831. [Google Scholar] [CrossRef]
  19. Brito, M.E.; Morishita, H.; Yamada, J.; Nishino, H.; Uchida, H. Further improvement in performances of La0.6Sr0.4Co0.2Fe0.8O3−δ—doped ceria composite oxygen electrodes with infiltrated doped ceria nanoparticles for reversible solid oxide cells. J. Power Sour. 2019, 427, 293–298. [Google Scholar] [CrossRef]
  20. Jiang, S.P. Development of lanthanum strontium cobalt ferrite perovskite electrodes of solid oxide fuel cells—A review. Int. J. Hydrog. Energy 2019, 44, 7448–7493. [Google Scholar] [CrossRef]
  21. Jiang, S.P. Development of lanthanum strontium manganite perovskite cathode materials of solid oxide fuel cells: A review. J. Mater. Sci. 2008, 43, 6799–6833. [Google Scholar] [CrossRef]
  22. Marcucci, A.; Zurlo, F.; Sora, I.N.; Placidi, E.; Casciardi, S.; Licoccia, S.; Di Bartolomeo, E. A redox stable Pd-doped perovskite for SOFC applications. J. Mater. Chem. A 2019, 7, 5344–5352. [Google Scholar] [CrossRef]
  23. Kumar, K.L.A.; Durgajanani, S.; Jeyaprakash, B.G.; Rayappan, J.B.B. nanostructured ceria thin film for ethanol and triethylamine sensing. Sens. Actuators B Chem. 2013, 177, 19–26. [Google Scholar] [CrossRef]
  24. Gupta, S.; Kuchibhatla, S.; Engelhard, M.; Shutthanandan, V.; Nachimuthu, P.; Jiang, W.; Saraf, L.; Thevuthasan, S.; Prasad, S. Influence of samaria doping on the resistance of ceria thin films and its implications to the planar oxygen sensing devices. Sens. Actuators B Chem. 2009, 139, 380–386. [Google Scholar] [CrossRef]
  25. Ueda, T.; Defferriere, T.; Hyodo, T.; Shimizu, Y.; Tuller, H.L. Nanostructured Pr-doped Ceria (PCO) thin films as sensing electrodes in solid-electrolyte type gas sensors with enhanced toluene sensitivity. Sens. Actuators B Chem. 2020, 317, 128037. [Google Scholar] [CrossRef]
  26. Liu, L.; Zang, C.; Wang, B.; Su, W.; Xiao, H.; Zhang, D.; Zhang, Y. Ceria thin film memristive device by magnetron sputtering method. Vacuum 2020, 173, 109128. [Google Scholar] [CrossRef]
  27. Schmitt, R.; Spring, J.; Korobko, R.; Rupp, J.L. Design of oxygen vacancy configuration for memristive systems. Acs Nano 2017, 11, 8881–8891. [Google Scholar] [CrossRef]
  28. Schweiger, S.; Pfenninger, R.; Bowman, W.J.; Aschauer, U.; Rupp, J.L.M. Designing strained interface heterostructures for memristive devices. Adv. Mater. 2017, 29, 1605049. [Google Scholar] [CrossRef]
  29. Eyring, L. The binary rare earth oxides. In Handbook on the Physics and Chemistry of Rare Earths; Gschneidner, K.A., Jr., Eyring, L., Eds.; North Holland: Amsterdam, The Netherlands, 1979; Volume 3, pp. 337–399. [Google Scholar]
  30. Costa, G.A.; Artini, C.; Ubaldini, A.; Carnasciali, M.M.; Mele, P.; Masini, R. Phase stability study of the pseudobinary system Gd2O3-Nd2O3 (T≤1350 °C). J. Therm. Anal. Calorim. 2008, 92, 101–104. [Google Scholar] [CrossRef]
  31. Artini, C.; Costa, G.A.; Pani, M.; Lausi, A.; Plaisier, J. Structural characterization of the CeO2/Gd2O3 mixed system by synchrotron X-ray diffraction. J. Solid State Chem. 2012, 190, 24–28. [Google Scholar] [CrossRef]
  32. Artini, C.; Presto, S.; Massardo, S.; Pani, M.; Carnasciali, M.M.; Viviani, M. Transport properties and high temperature raman features of heavily Gd-doped ceria. Energies 2019, 12, 4148. [Google Scholar] [CrossRef] [Green Version]
  33. Artini, C.; Presto, S.; Viviani, M.; Massardo, S.; Carnasciali, M.M.; Gigli, L.; Pani, M. The role of defects association in structural and transport properties of the Ce1-x(Nd0.74Tm0.26)xO2−x/2 system. J. Energy Chem. 2021, 60, 494–502. [Google Scholar] [CrossRef]
  34. Omar, S.; Wachsman, E.D.; Jones, J.L.; Nino, J.C. Crystal structure-ionic conductivity relationships in doped ceria systems. J. Am. Ceram. Soc. 2009, 92, 2674–2681. [Google Scholar] [CrossRef]
  35. Gupta, M.; Shirbhate, S.; Ojha, P.; Acharya, S. Processing and conductivity behavior of La, Sm, Fe singly and doubly doped ceria: As electrolytes for IT-SOFCs. Solid State Ion. 2018, 320, 199–209. [Google Scholar] [CrossRef]
  36. Minervini, L.; Zacate, M.O.; Grimes, R.W. Defect cluster formation in M2O3-doped CeO2. Solid State Ion. 1999, 116, 339–349. [Google Scholar] [CrossRef]
  37. Li, Z.-P.; Mori, T.; Zou, J.; Drennan, J. Defects clustering and ordering in di- and trivalently doped ceria. Mater. Res. Bull. 2013, 48, 807–812. [Google Scholar] [CrossRef]
  38. Presto, S.; Artini, C.; Pani, M.; Carnasciali, M.M.; Massardo, S.; Viviani, M. Ionic conductivity and local structural features in Ce1-xSmxO2−x/2. Phys. Chem. Chem. Phys. 2018, 20, 28338–28345. [Google Scholar] [CrossRef] [PubMed]
  39. Koettgen, J.; Dück, G.; Martin, M. The oxygen ion conductivity of Lu doped ceria. J. Phys. Condens. Matter 2020, 32, 265402. [Google Scholar] [CrossRef]
  40. Artini, C.; Pani, M.; Lausi, A.; Masini, R.; Costa, G.A. High temperature structural study of Gd-doped ceria by synchrotron X-ray Diffraction (673 K ≤ T ≤ 1073 K). Inorg. Chem. 2014, 53, 10140–10149. [Google Scholar] [CrossRef]
  41. Artini, C.; Pani, M.; Carnasciali, M.M.; Buscaglia, M.T.; Plaisier, J.R.; Costa, G.A. Structural features of Sm- and Gd-doped ceria studied by synchrotron X-ray diffraction and μ-Raman spectroscopy. Inorg. Chem. 2015, 54, 4126–4137. [Google Scholar] [CrossRef]
  42. Artini, C.; Pani, M.; Carnasciali, M.M.; Plaisier, J.R.; Costa, G.A. Lu-, Sm-, and Gd-doped ceria: A comparative approach to their structural properties. Inorg. Chem. 2016, 55, 10567–10579. [Google Scholar] [CrossRef] [PubMed]
  43. Guan, X.; Zhou, H.; Liu, Z.; Wang, Y.; Zhang, J. High performance Gd3+ and Y3+ co-doped ceria-based electrolytes for intermediate temperature solid oxide fuel cells. Mater. Res. Bull. 2008, 43, 1046–1054. [Google Scholar] [CrossRef]
  44. Coles-Aldridge, A.V.; Baker, R. Ionic conductivity in multiply substituted ceria-based electrolytes. Solid State Ion. 2018, 316, 9–19. [Google Scholar] [CrossRef] [Green Version]
  45. Omar, S.; Wachsman, E.D.; Nino, J.C. Higher conductivity Sm3+ and Nd3+ co-doped ceria-based electrolyte materials. Solid State Ion. 2008, 178, 1890–1897. [Google Scholar] [CrossRef]
  46. Arabaci, A.; Altınçekiç, T.G.; Der, M.; Öksüzömer, M.A.F. Preparation and properties of ceramic electrolytes in the Nd and Gd co-doped ceria systems prepared by polyol method. J. Alloys Compd. 2019, 792, 1141–1149. [Google Scholar] [CrossRef]
  47. Venkataramana, K.; Madhuri, C.; Madhusudan, C.; Reddy, Y.; Bhikshamaiah, G.; Reddy, C. Investigation on La3+ and Dy3+ co-doped ceria ceramics with an optimized average atomic number of dopants for electrolytes in IT-SOFCs. Ceram. Int. 2018, 44, 6300–6310. [Google Scholar] [CrossRef]
  48. Venkataramana, K.; Madhuri, C.; Madhusudan, C.; Reddy, Y.S.; Reddy, C.V. Investigation on micro-structural, structural, electrical and thermal properties of La3+, Sm3+ & Gd3+ triple-doped ceria as solid-electrolyte for intermediate temperature-solid oxide fuel cell applications. J. Appl. Phys. 2019, 126, 144901. [Google Scholar] [CrossRef]
  49. Rai, A.; Mehta, P.; Omar, S. Ionic conduction behavior in SmxNd0.15−xCe0.85O2−δ. Solid State Ion. 2014, 263, 190–196. [Google Scholar] [CrossRef]
  50. Spiridigliozzi, L.; Dell’Agli, G.; Marocco, A.; Accardo, G.; Pansini, M.; Yoon, S.P.; Ham, H.C.; Frattini, D. Engineered coeprecipitation chemistry with ammonium carbonate for scalable synthesis and sintering of improved Sm0.2Ce0.8O1.90 and Gd0.16Pr0.04Ce0.8O1.90 electrolytes for IT-SOFCs. J. Ind. Eng. Chem. 2018, 59, 17–27. [Google Scholar] [CrossRef]
  51. Harrington, G.F.; Kim, S.; Sasaki, K.; Tuller, H.L.; Grieshammer, S. Strain-modified ionic conductivity in rare-earth substituted ceria: Effects of migration direction, barriers, and defect-interactions. J. Mater. Chem. A 2021, 9, 8630–8643. [Google Scholar] [CrossRef]
  52. De Souza, R.A.; Ramadan, A.; Hörner, S. Modifying the barriers for oxygen-vacancy migration in fluorite-structured CeO2 electrolytes through strain: A computer simulation study. Energy Environ. Sci. 2011, 5, 5445–5453. [Google Scholar] [CrossRef]
  53. Shi, Y.; Garbayo, I.; Muralt, P.; Rupp, J.L.M. Micro-solid state energy conversion membranes: Influence of doping and strain on oxygen ion transport and near order for electrolytes. J. Mater. Chem. A 2017, 5, 3900–3908. [Google Scholar] [CrossRef]
  54. Schweiger, S.; Kubicek, M.; Messerschmitt, F.; Murer, C.; Rupp, J.L.M. A microdot multilayer oxide device: Let us tune the strain-ionic transport interaction. ACS Nano 2014, 8, 5032–5048. [Google Scholar] [CrossRef] [PubMed]
  55. Sun, L.; Marrocchelli, D.; Yildiz, B. Edge dislocation slows down oxide ion diffusion in doped CeO2 by segregation of charged defects. Nat. Commun. 2015, 6, 6294. [Google Scholar] [CrossRef] [PubMed] [Green Version]
  56. Sanna, S.; Esposito, V.; Pergolesi, D.; Orsini, A.; Tebano, A.; Licoccia, S.; Balestrino, G.; Traversa, E. Fabrication and electrochemical properties of epitaxial samarium-doped ceria films on SrTiO3-buffered MgO substrates. Adv. Funct. Mater. 2009, 19, 1713–1719. [Google Scholar] [CrossRef]
  57. Korte, C.; Keppner, J.; Peters, A.; Schichtel, N.; Aydin, H.; Janek, J. Coherency strain and its effect on ionic conductivity and diffusion in solid electrolytes—An improved model for nanocrystalline thin films and a review of experimental data. Phys. Chem. Chem. Phys. 2014, 16, 24575–24591. [Google Scholar] [CrossRef] [PubMed] [Green Version]
  58. Garcia-Barriocanal, J.; Rivera-Calzada, A.; Varela, M.; Sefrioui, Z.; Iborra, E.; Leon, C.; Pennycook, S.J.; Santamaria, J. Colossal ionic conductivity at interfaces of epitaxial ZrO2:Y2O3/SrTiO3 heterostructures. Science 2008, 321, 676–680. [Google Scholar] [CrossRef] [Green Version]
  59. Kilner, J.A. Feel the strain. Nat. Mater. 2008, 7, 838–839. [Google Scholar] [CrossRef]
  60. Chen, L.; Chen, C.L.; Chen, X.; Donner, W.; Liu, S.W.; Lin, Y.; Huang, D.X.; Jacobson, A.J. Electrical properties of a highly oriented, textured thin film of the ionic conductor Gd:CeO2-δ on (001) MgO. Appl. Phys. Lett. 2003, 83, 4737–4739. [Google Scholar] [CrossRef]
  61. Sanna, S.; Esposito, V.; Tebano, A.; Licoccia, S.; Traversa, E.; Balestrino, G. Enhancement of ionic conductivity in Sm-doped ceria/yttria-stabilized zirconia heteroepitaxial structures. Small 2010, 6, 1863–1867. [Google Scholar] [CrossRef]
  62. Jiang, J.; Shen, W.; Hertz, J. Structure and ionic conductivity of nanoscale gadolinia-doped ceria thin films. Solid State Ion. 2013, 249, 139–143. [Google Scholar] [CrossRef]
  63. Christie, G.M.; van Berkel, F.P.F. Microstructure—ionic conductivity relationships in ceria-gadolinia electrolytes. Solid State Ion. 1996, 83, 17–27. [Google Scholar] [CrossRef]
  64. Suzuki, T.; Kosacki, I.; Anderson, H.U. Microstructure—electrical conductivity relationships in nanocrystalline ceria thin films. Solid State Ion. 2002, 151, 111–121. [Google Scholar] [CrossRef]
  65. Rupp, J.L.M.; Gauckler, L.J. Microstructures and electrical conductivity of nanocrystalline ceria-based thin films. Solid State Ion. 2006, 177, 2513–2518. [Google Scholar] [CrossRef]
  66. Karageorgakis, N.I.; Heel, A.; Rupp, J.L.M.; Aguirre, M.H.; Graule, T.; Gauckler, L.J. Properties of flame sprayed Ce0.8Gd0.2O1.9 electrolyte thin films. Adv. Funct. Mater. 2010, 21, 532–539. [Google Scholar] [CrossRef]
  67. Joo, J.H.; Choi, G.M. Electrical conductivity of thin film ceria grown by pulsed laser deposition. J. Eur. Ceram. Soc. 2007, 27, 4273–4277. [Google Scholar] [CrossRef]
  68. Chiodelli, G.; Malavasi, L.; Massarotti, V.; Mustarelli, P.; Quartarone, E. Synthesis and characterization of Ce0.8Gd0.2O2−y polycrystalline and thin film materials. Solid State Ion. 2005, 176, 1505–1512. [Google Scholar] [CrossRef]
  69. Schlupp, M.V.F.; Kurlov, A.; Hwang, J.; Yáng, Z.; Döbeli, M.; Martynczuk, J.; Prestat, M.; Son, J.W.; Gauckler, L.J. Gadolinia doped ceria thin films prepared by aerosol assisted chemical vapor deposition and applications in intermediate-temperature solid oxide fuel cells. Fuel Cells 2013, 5, 658–665. [Google Scholar] [CrossRef]
  70. Lair, V.; Živković, L.S.; Lupan, O.; Ringuedé, A. Synthesis and characterizathion of electrodeposited samaria and samaria-doped ceria thin films. Electrochim. Acta 2011, 56, 4638–4644. [Google Scholar] [CrossRef]
  71. Lee, Y.H.; Chang, I.; Cho, G.Y.; Park, J.; Yu, W.; Tanveer, W.H.; Cha, S.W. Thin film solid oxide fuel cells operating below 600 C: A review. Int. J. Precis. Eng. Manuf. 2018, 5, 441–453. [Google Scholar] [CrossRef]
  72. Artini, C.; Cingolani, A.; Anselmi Tamburini, U.; Valenza, F.; Latronico, G.; Mele, P. Effect of the sintering pressure on structure and microstructure of the filled skutterudite Smy (FexNi1-x)4Sb12. Mater. Res. Bull. 2021, 139, 111261. [Google Scholar] [CrossRef]
  73. Ghadiri, M.; Kang, A.K.; Gorji, N.E. XRD characterization of graphene-contacted perovskite solar cells: Moisture degradation and dark-resting recovery. Superlattices Microstruct. 2020, 146, 106677. [Google Scholar] [CrossRef]
  74. Shen, Y.; Kumar, R.S.; Pravica, M.; Nicol, M.F. Characteristics of silicone fluid as a pressure transmitting medium in diamond anvil cells. Rev. Sci. Instrum. 2004, 75, 4450–4454. [Google Scholar] [CrossRef]
  75. Artini, C.; Carnasciali, M.; Viviani, M.; Presto, S.; Plaisier, J.; Costa, G.; Pani, M. Structural properties of Sm-doped ceria electrolytes at the fuel cell operating temperatures. Solid State Ion. 2018, 315, 85–91. [Google Scholar] [CrossRef]
  76. Ubaldini, A.; Artini, C.; Costa, G.A.; Carnasciali, M.M.; Masini, R. Synthesis and thermal decomposition of mixed Gd-Nd oxalates. J. Therm. Anal. Calorim. 2008, 91, 797–803. [Google Scholar] [CrossRef]
  77. Hammersley, A.P. FIT2D: An Introduction and Overview. ESRF Internal Report; ESRF: Grenoble, France, 1997; ESRF97HA02T. [Google Scholar]
  78. Rodríguez-Carvajal, J. Recent advances in magnetic structure determination by neutron powder diffraction. Phys. B Condens. Matter 1993, 192, 55–69. [Google Scholar] [CrossRef]
  79. Rietveld, H.M. A profile refinement method for nuclear and magnetic structures. J. Appl. Cryst. 1969, 2, 65–71. [Google Scholar] [CrossRef]
  80. Shannon, R.D. Revised effective ionic radii and systematic studies of interatomic distances in halides and chalcogenides. Acta Crystallogr. 1976, 32, 751–767. [Google Scholar] [CrossRef]
  81. Artini, C.; Carnasciali, M.M.; Plaisier, J.R.; Costa, G.A.; Pani, M. A novel method for the evaluation of the Rare Earth (RE) coordination number in RE-doped ceria through Raman spectroscopy. Solid State Ion. 2017, 311, 90–97. [Google Scholar] [CrossRef]
  82. Murnaghan, F.D. The compressibility of media under extreme pressures. Proc. Natl. Acad. Sci. USA 1944, 30, 244–247. [Google Scholar] [CrossRef] [Green Version]
  83. Birch, F. Finite elastic strain of cubic crystals. Phys. Rev. 1947, 71, 809–824. [Google Scholar] [CrossRef]
  84. Poirier, J.-P.; Tarantola, A. A logarithmic equation of state. Phys. Earth Planet. Inter. 1998, 109, 1–8. [Google Scholar] [CrossRef]
  85. Vinet, P.; Smith, J.R.; Ferrante, J.; Rose, J.H. Temperature effects on the universal equation of state of solids. Phys. Rev. B 1987, 35, 1945–1953. [Google Scholar] [CrossRef] [Green Version]
  86. Gonzalez-Platas, J.; Alvaro, M.; Nestola, F.; Angel, R. EosFit7-GUI: A new graphical user interface for equation of state calculations, analyses and teaching. J. Appl. Cryst. 2016, 49, 1377–1382. [Google Scholar] [CrossRef]
  87. Anderson, O.L.; Nafe, J.E. The bulk modulus-volume relationship for oxides compounds and related geophysical problems. J. Geophys. Res. 1965, 70, 3951–3963. [Google Scholar] [CrossRef]
  88. Hill, S.; Catlow, C. A hartree-fock periodic study of bulk ceria. J. Phys. Chem. Solids 1993, 54, 411–419. [Google Scholar] [CrossRef]
Figure 1. Scheme of a GDC/LSCF co-electrospun electrode. The EAT is the electrochemical active thickness, namely the layer of the electrode where the charge transfer reaction occurs. Reprinted with permission from ref [18]. Copyright 2021 Elsevier License Terms And Conditions.
Coatings 11 00724 g001
Figure 2. Crystal structures of (a) CeO2 (F phase) and (b) Gd2O3 (C phase). To make the comparison easier, only one eighth of the Gd2O3 unit cell is drawn. The lanthanide element is located at the center of each polyhedron. Reprinted with permission from ref [31]. Copyright 2021 Elsevier License Terms And Conditions.
Coatings 11 00724 g002
Figure 3. Behaviour of the activation energy E a below and above 750 K, and of the pre-exponential factor A as a function of the ionic size of the doping ion. Reprinted with permission from ref [34]. Copyright 2021 John Wiley and Sons License Terms and Conditions.
Coatings 11 00724 g003
Figure 4. (a) Lower (on the left) and upper (on the right) plate of the 300 μm DAC by Boehler-Almax. The upper diamond is observable, meanwhile the lower one is covered by the gasket, which is fixed onto its holder by using some play dough. (b) The pressure chamber filled with the sample powders. The internal standard (Cu) and the PTM are present.
Coatings 11 00724 g004
Figure 5. Rietveld refinement plot of sample Sm60_4.11. The red and the black lines are the experimental and the calculated diffraction pattern, respectively; the blue line is the difference curve; vertical bars indicate the calculated positions of Bragg peaks.
Coatings 11 00724 g005
Figure 6. Trend of l n B 0 vs. l n 2 V a t for all the studied systems. Data of CeO2 are taken from [88], while the ones of the Sm- and (Nd,Tm)-containing systems derive from [13]; experimental points of Lu-doped ceria are taken from [12]. Cell volumes of samples crystallizing in the F phase are multiplied by 8 in order to make them comparable with those crystallizing in the C structure.
Coatings 11 00724 g006
Figure 7. Compressibility k as a function of the doping ion amount x for each studied system.
Coatings 11 00724 g007
Table 1. B 0 and B 0 values obtained from the refinement of the third order Rose-Vinet equation of state applied to the three studied systems.
Sample B 0 [ GPa ] B 0
Sm20258(31)−2(2)
Sm30243(23)23(2)
Sm40211(40)68(6)
Sm50156(29)39(2)
Sm60169(51)46(2)
Lu10172(18)24(6)
Lu20203(76)13(2)
Lu30191(15)7(1)
Lu40170(9)5(3)
Lu8073(10)85(4)
NdTm10290(32)34(14)
NdTm20260(35)18(3)
NdTm30194(20)31(12)
NdTm40107(11)121(17)
NdTm50161(32)7(9)
NdTm60186(34)37(16)
Publisher’s Note: MDPI stays neutral with regard to jurisdictional claims in published maps and institutional affiliations.

