1. Introduction
As we all know, corrosion is a common phenomenon and is also one of the main failure forms of metal. Corrosion will not only cause economic losses, but also endangers our safety [
1]. Therefore, the establishment of methods to effectively avoid corrosion has become more and more important. Because corrosion usually begins on the surface of the parts, the use of coatings is a reliable and effective means to slow down the corrosion rate. Generally, there are many kinds of coatings, including organic, inorganic and metallic. Among these, the amorphous material coatings are widely recognized for their excellent comprehensive performance. There are many kinds of amorphous alloys, including Fe-based alloys [
2,
3], Cu-based alloys [
4,
5] and Al-based alloys [
6,
7]. Among these amorphous alloy (FAA) coating systems, Fe-based amorphous alloy is the cheapest one, and it has good mechanical properties, such as high strength, high hardness, and excellent wear resistance and corrosion resistance, due to which it is considered to be a material with high potential in harsh environments, showing strong anticorrosion and antiabrasion properties [
8,
9].
At present, the main preparation methods of FAA coating include plasma spraying, arc spraying, flame spraying, laser cladding, etc. [
10,
11,
12]. However, it is more and more difficult to obtain dense coating as the materials become harder and harder. CS is considered to be a potential technology for use in the depositing of dense FAA coatings due to its high impacting energy and low crystallinity. Some studies indicate that dense FAA coating can be obtained through CS [
13,
14,
15]. However, this is applicable for relative soft FAA powders below 500.0 HV/100.0/20–700.0 HV/100/20, since the deformability is determined by the hardness. When the hardness of FAA exceeds 800.0 HV/100/20, dense coating cannot be achieved at the highest spraying parameters of the Plasma Gicken system (about 6.5 MPa and 1000.0 °C). Densifying is necessary in order to achieve ideal anti-corrosion performance [
16,
17,
18].
Re-melting technology is usually used to densify spraying coatings. The common re-melting technologies are argon tungsten arc re-melting, induction re-melting, laser re-melting and electron beam re-melting. Laser re-melting is a kind of prefabricated laser deposition described in other studies, that is, coating is prepared on the substrate by spraying technology, and then the coating surface is scanned and melted by laser beam under the protection of inert gas. Compared with the traditional carburizing and nitriding heat treatment, laser technology has the characteristics of controllable region, small thermal deformation, and less impact on the internal toughness. Some studies have investigated the effects of laser re-melting on the properties of thermal sprayed and cold sprayed FAA coating. The results inferred that laser re-melting can eliminate the defects such as pores and cracks, increase the number of grain boundaries, obtain fine grain structure and enhance the bonding strength [
19,
20,
21]. However, high energy laser re-melting can significantly reduce the amorphous content of the FAA coating because of the large heat input. The fast solidification of the melting pool can produce large scale residual stress; the stress is sufficient to produce cracks on the surface.
Thus, based on these disadvantages, we propose a low energy density laser re-melting method to densify ultra-hard FAA coating. We anticipate that cracks and defects will not be caused by this method; thus, the corrosion and abrasion performance of FAA coatings can be improved simultaneously [
22,
23]. In this study, three degrees of laser re-melting power were used to re-melt the CS FAA coating. The influence of these different degrees of power on the corrosion resistance, microstructure and hardness of the coating were studied.
2. Materials and Methods
2.1. Feedstock Powders and Substrate
The powder was provided by a commercial powder company (Wandun amorphous materials company, Guangzhou, China), and it has smooth surface and good fluidity. The powder morphologies were observed under a field-emission scanning electron microscopy (Ultra55, FE-SEM, Heidenheim, Germany) with a beam energy of 5.0 kV. It can be seen from
Figure 1a that the FAA powders have spherical shape; this shape is a typical feature of ion gas atomization powder. The size of the powder particles is about 2.0~25.0 μm. The elements content (
Figure 1b) was measured by using a scanning electron microscope equipped energy dispersive X-ray spectroscopy (EDS, Oxford Instruments, X-max, Oxford, UK) at a beam energy of 20.0 kV. The results show that the powder is Fe-based amorphous powder with some extent oxidation on the surface.
2.2. Coating Preparation and Laser Re-Melting Treatment
The FAA coatings were deposited on the 40Cr steel substrate (20 mm × 20 mm × 5 mm) surface with a commercial cold spraying system (PCS-1000 high-pressure CS system, Plasma Giken company, Saitama, Japan), and the maximum working temperature of the equipment was 1000.0 °C and the pressure was 5.5 MPa, with N
2 as a carrier gas. Before spraying, the 40Cr base material was sandblasted for 15.0 min. The detailed CS parameters are shown in
Table 1.
A CO
2 laser micro-structural surface processing equipment produced by Shenzhen Botai Laser Technology limited company (Shenzhen, China) was used. Different degrees of laser power were used to re-melt the coatings. The melting parameters are shown in detail in
Table 2. Zhang et al. [
24] summarized the operation law of laser remelting, and the working diagram is shown in
Figure 2; the coating material is irradiated by laser to form an instantaneous molten pool, the depth of the molten pool is generally less than 1 mm. The front part of the molten pool is the melting zone, the solid phase is continuously melted, and the back part is the solidified zone. The liquid phase is re-solidified. Because the formation and solidification of the molten pool are completed in a very short time, it has a very high cooling rate of 1 × 10
5–1 × 10
6 K/s. The remelted coatings at 0%, 50%, 80% and 100% power are numbered as 1#, 2#, 3#, 4#.
2.3. Coating Characterization
The re-melted samples were cut into 10.0 mm × 10.0 mm small pieces by electrical discharge wire cutting. Then, the samples were sealed with hot mounting machine and only the cross-sections were left for examination. The cross-sections were abraded with 100#, 400#, 800# and 1200#, 2000# sand paper in sequence. After that, the coatings were cleaned with water, wiped with alcohol, and dried with an air dryer. Finally, the micro morphologies of the coatings were observed with a SEM.
The surface and cross-section of the coatings were observed by field emission scanning electron microscopy (FE-SEM, Zeiss, ultra55, Heidenheim, Germany), the working voltage was 5 keV, and the element composition of the coating was analyzed by energy scattering spectrum (EDS, Oxford Instruments, X-max, Oxford, UK), the test voltage is 20.0 keV. In order to determine the different amorphous content of FAA coating after laser re-melting with different degrees of power, the crystal phase was analyzed by X-ray diffraction (XRD, D/MAX-RB, Rigaku Cu Kα radiation, λ = 0.154056 nm). The working mode is continuous scanning, the target material is Cu and the working parameters are as follows: scanning range 5.0°~90.0°, step size 0.1°, voltage 40.0 kV, current 40.0 mA. After polishing the surface and cross section of the coating, threshold processing is carried out on the cross section images and surface images taken under the scanning electron microscope by PS software (PS6.0), and the porosity of the coating can be roughly calculated by calculating the pore part and the proportion of the whole pixel area by Image Pro Plus 6.0 software. The crystallinities, after laser re-melting with different degrees of power, were calculated using Jade software (Mdi-Jade 5.0, Beijing, China); the calculation formula of amorphous content is: amorphous content = 100% * diffraction peak intensity/total intensity.
2.4. Coating Performance Evaluation
An automatic turret digital micro-hardness tester (HXD-1000 digital hardness tester, Shanghai Tai Ming, Shanghai, China) was used to measure the micro-hardness. The indenter of the hardness tester is tetragonal diamond. The test was conducted according to the GB/T 4340.1-2009 [
25] “Metal Micro Vickers Hardness Test Method”. The calculation formula of Vickers hardness is shown in Equation (1), F is the load (Newton force), S is the indentation surface area (square millimeter), α is the angle (136°), D is the average indentation diagonal length (mm). The loading force was 100 gF and the loading time was 20.0 s. Starting from a position close to the surface of the coating, the hardness values were tested at intervals of 20.0 μm along the polished cross-section of the coating until the test reaches the substrate.
The abrasive performance was tested by a UMT-3 friction and abrasion tester, the loading force is 20.0 N, the friction pair was reciprocated within a distance of 1.0 cm. the friction pairs ball is a silicon carbide ball with diameter of 2.0 mm. A total of 2000.0 cycles were repeated before observing the surface morphologies, the mass and depth loss.
The corrosion resistance of the coating was evaluated by electrochemical polarization measurements in 3.5 wt.% NaCl solution (ASTM G31-72 Standard) [
25]. An EG&G Princeton Applied Research PARSTA T 2273 potentiostat with EG&G PowerSuite software (v1.0 Princeton Applied Research, Oak, TN, USA) with a conventional three-electrode system was used to conduct the electrochemical test. A saturated calomel electrode was used as the reference electrode, and a platinum electrode was used as the counter electrode. The specific parameters are set as follows: the scanning speed was 5.0 mV/min, and the measurement range was—250.0 to 500.0 mV (VS. OPC). In the process of the experiment, the surface of the conductor and the sample not involved in the test was sealed with epoxy resin, leaving 10.0 mm × 10.0 mm exposed area for electrochemical test. The measurement was started when the corrosion current was stable (amplitude of fluctuation within ±5.0 mV in 5.0 min). In order to observe the corrosion morphology and products of the coating after different degrees of power of laser re-melting, the coatings were corroded by neutral salt spray for 5.0 days. The corrosion morphology of the coating was analyzed by SEM with a beam energy of 5.0 kV. The corrosion products were analyzed using a scanning electron microscope equipped with an energy dispersive X-ray spectrometer at a beam energy of 15.0 kV.
3. Results
3.1. XRD and Phase Content
Figure 3 shows the XRD spectrum and amorphous content of the raw powder and coatings. It can be seen from
Figure 3 that the FAA powder and coatings have obvious broad peaks, also known as “steamed bread” peaks, and the diffusion peaks in this pattern are typical characteristics of amorphous materials. The weak crystal diffraction peak at 2θ = 52° indicates that there is still a small amount of crystal (c0.08fe1.92 compound) in the amorphous powder and coating, and the powder is not 100% amorphous. In addition, the composition and amorphous content (crystallinity) of the coating were obtained by analyzing XRD data with jade software. The positions of all the peaks of coatings match with diffraction peaks of standard α-Fe (PDF#01-1267) and Fe
2O
3 (PDF#99-0060). Due to the high temperature in the process of cold spraying, the particles crystallized in the process of acceleration and impact, the FAA is slightly crystallized, and the amorphous content is 97.63% in CS FAA coating. In
Figure 3b, the XRD patterns of the surface re-melting layer with different degrees of laser power show that the diffuse scattering peak of amorphous phase still appears.
At the angle of 52.0°, the “steamed bread peak” that characterizes the amorphous phase is sharpened more severely as the powder density increases. More diffraction peaks appear for high power re-melting than for low power re-melting. This means that the FAA coatings were crystallized during the re-melting process. The duration of the molten pool is prolonged, the cooling rate is decreased, and the atomic reordering and crystal grain have more time and opportunity to increase. After calibration, it is known that these phases are mainly Fe, Cr and FeCr compound phases. Jade software was used to calculate the amorphous content of the coating after re-melting, and the amorphous phase content of the re-melted layer was 96.51%, 95.05% and 88.87%, respectively, as shown in
Figure 3c. It can be seen that no serious crystallization occurred during low density laser re-melting.
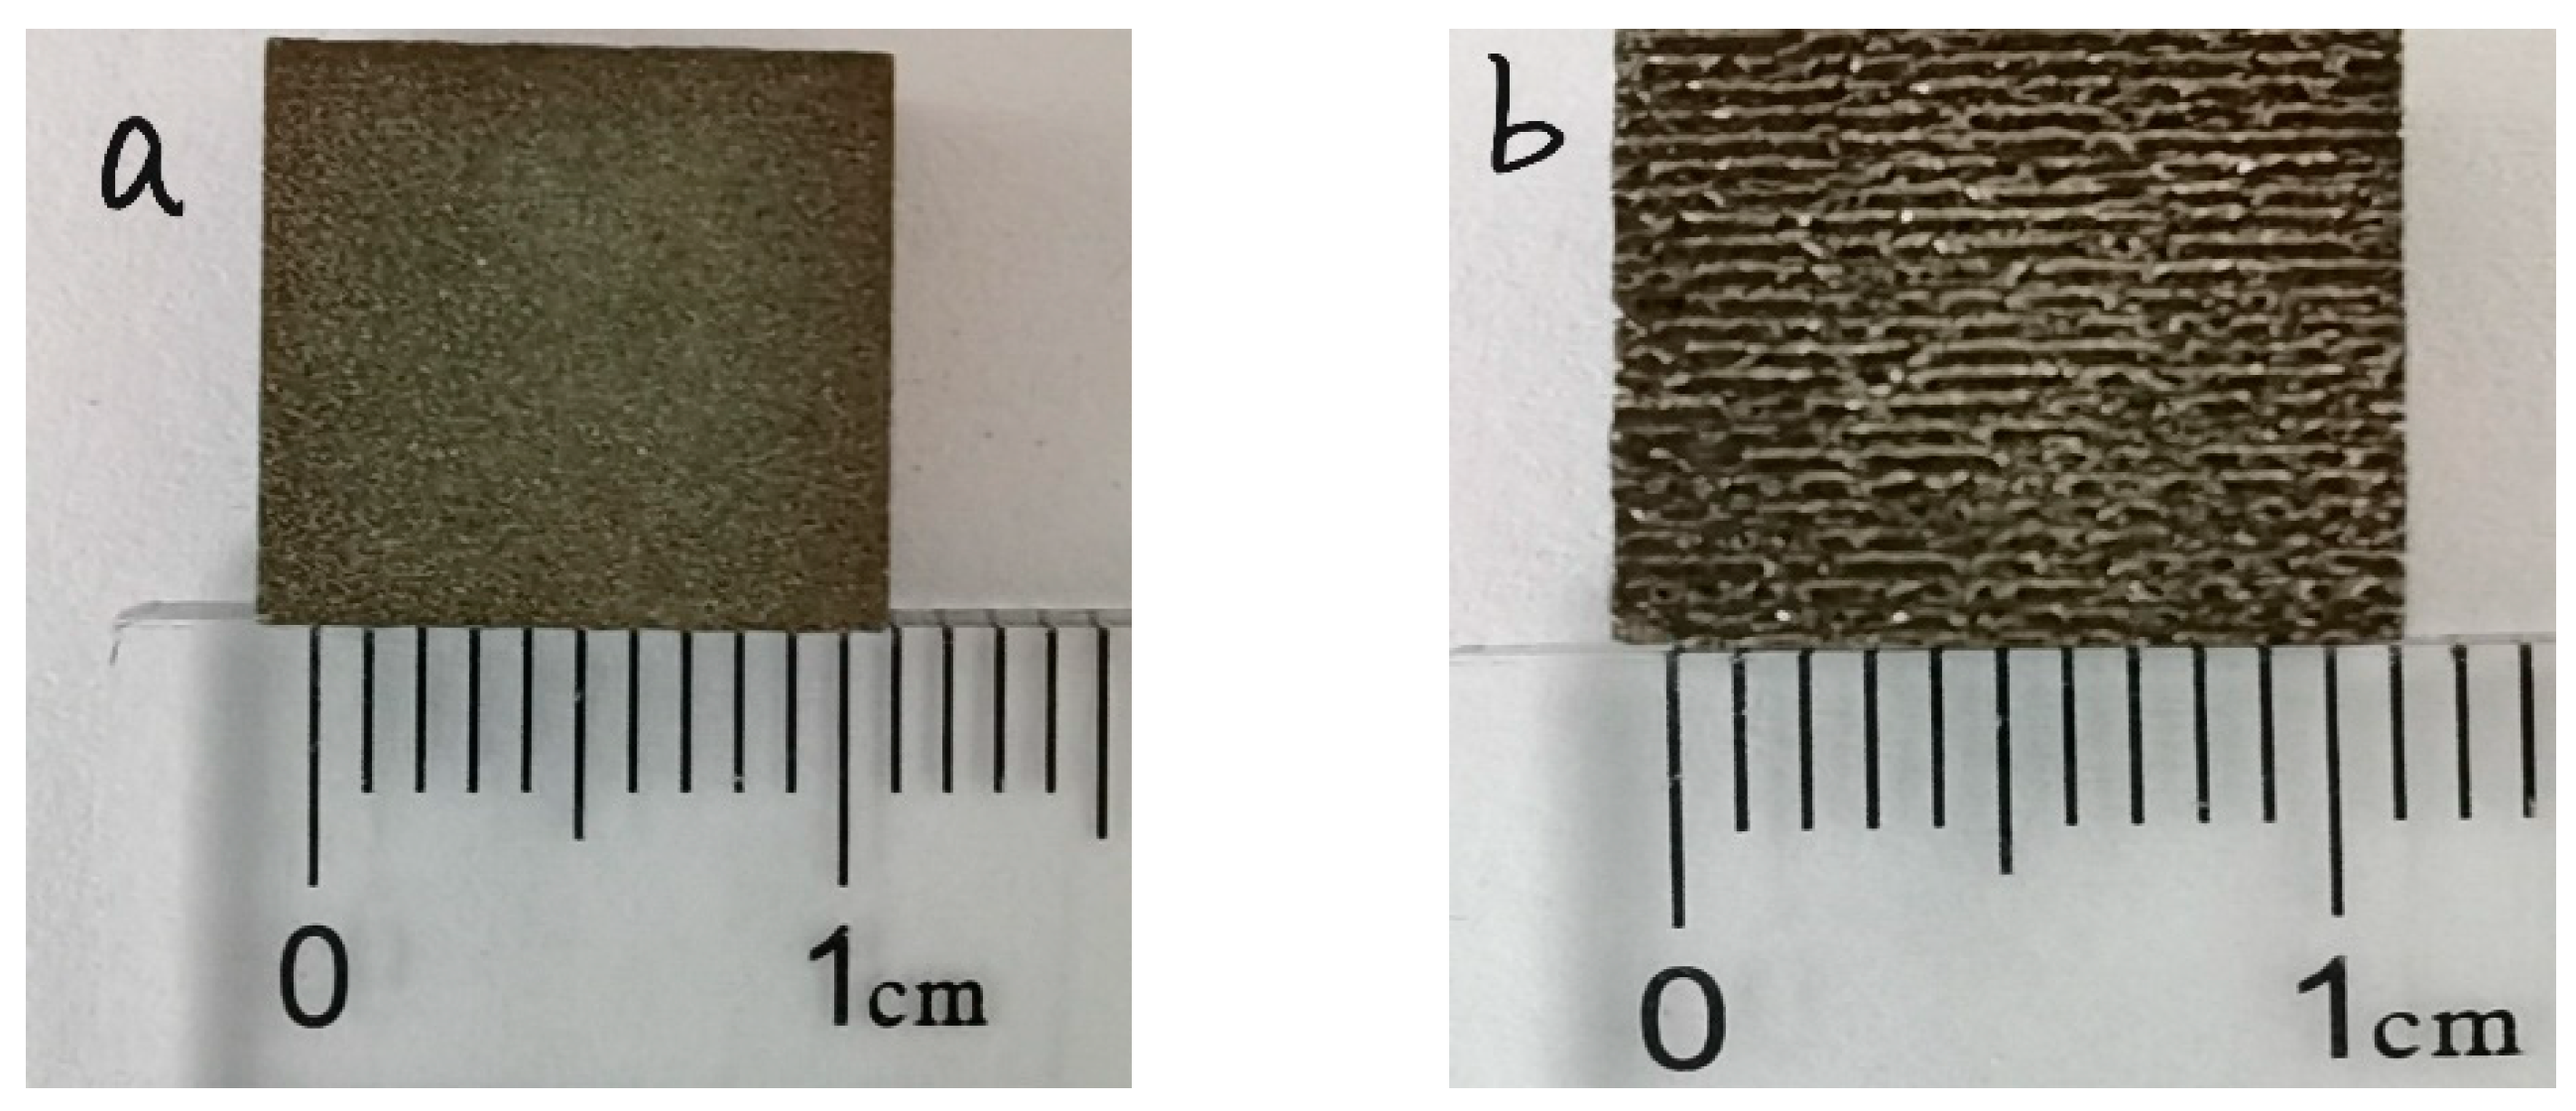
3.2. Macro-Morphology of FAA Coating
Figure 4 shows the macroscopic morphology of the coating before and after laser re-melting, under different degrees of power, taken by the camera. As shown in
Figure 4a, the CS FAA coating is bright white, the coating surface is smooth, without obvious large pits, cracks and other obvious defects, and the surface is uniform; these phenomena indicate that the spraying powder has good mechanical bonding with the substrate. It can be seen from
Figure 4 that the surface of the 1#, 2#, 3# and 4# FAA coating is smooth and has no obvious cracks that can be identified by eyesight. Furthermore, there are many obvious melting channels formed on the surface, which are known as weld beads. The low density power laser inputs a very small amount energy to the coating to form a small melting pool. As the laser moves on, the pool behind cools down immediately and forms a weld bead. Since the laser is a pulse energy input, the melting pool shrinks, leaving a high level of residual stress. This is also the reason that the weld beads cannot connect with each other.
3.3. Microstructure of FAA Coating
The micro-morphology of the amorphous coatings, after being subjected to re-melting with different degrees of laser power, are shown in
Figure 5. It can be seen from
Figure 5a that the whole coating is formed by accumulated deformed and under-deformed particles, and that most of the spherical particles have been deformed, the particle deformation varies in size, and the degree of deformation depends on the impact speed of the particles. The deformation of some particles is very large—this phenomenon is similar to the sputtering characteristics of thermal spraying particles—and the edges of the particles are also similar to the sputtering curl caused by the impact of molten particles. There are no obvious cracks on the surface of the coating and the surface is relatively dense. It can be seen from
Figure 5b that a weld with smaller height and narrow width is formed on the surface of 2# coating, and cracks appear on and around the weld. Many spherical particles smaller than 1 μm can be found on the surface around the weld bead, which is probably caused by the splashing phenomenon of the melting pool.
Figure 5c,d show that the weld height of the 3# and 4# coatings increases with the increase in power, and the weld bead becomes wider and more continuous. Because of the excessive energy, more defects appear on the surface of the weld. There are many pores in the 3# and 4# coatings during re-melting, which is mainly due to the shrinkage effect of the weld bead.
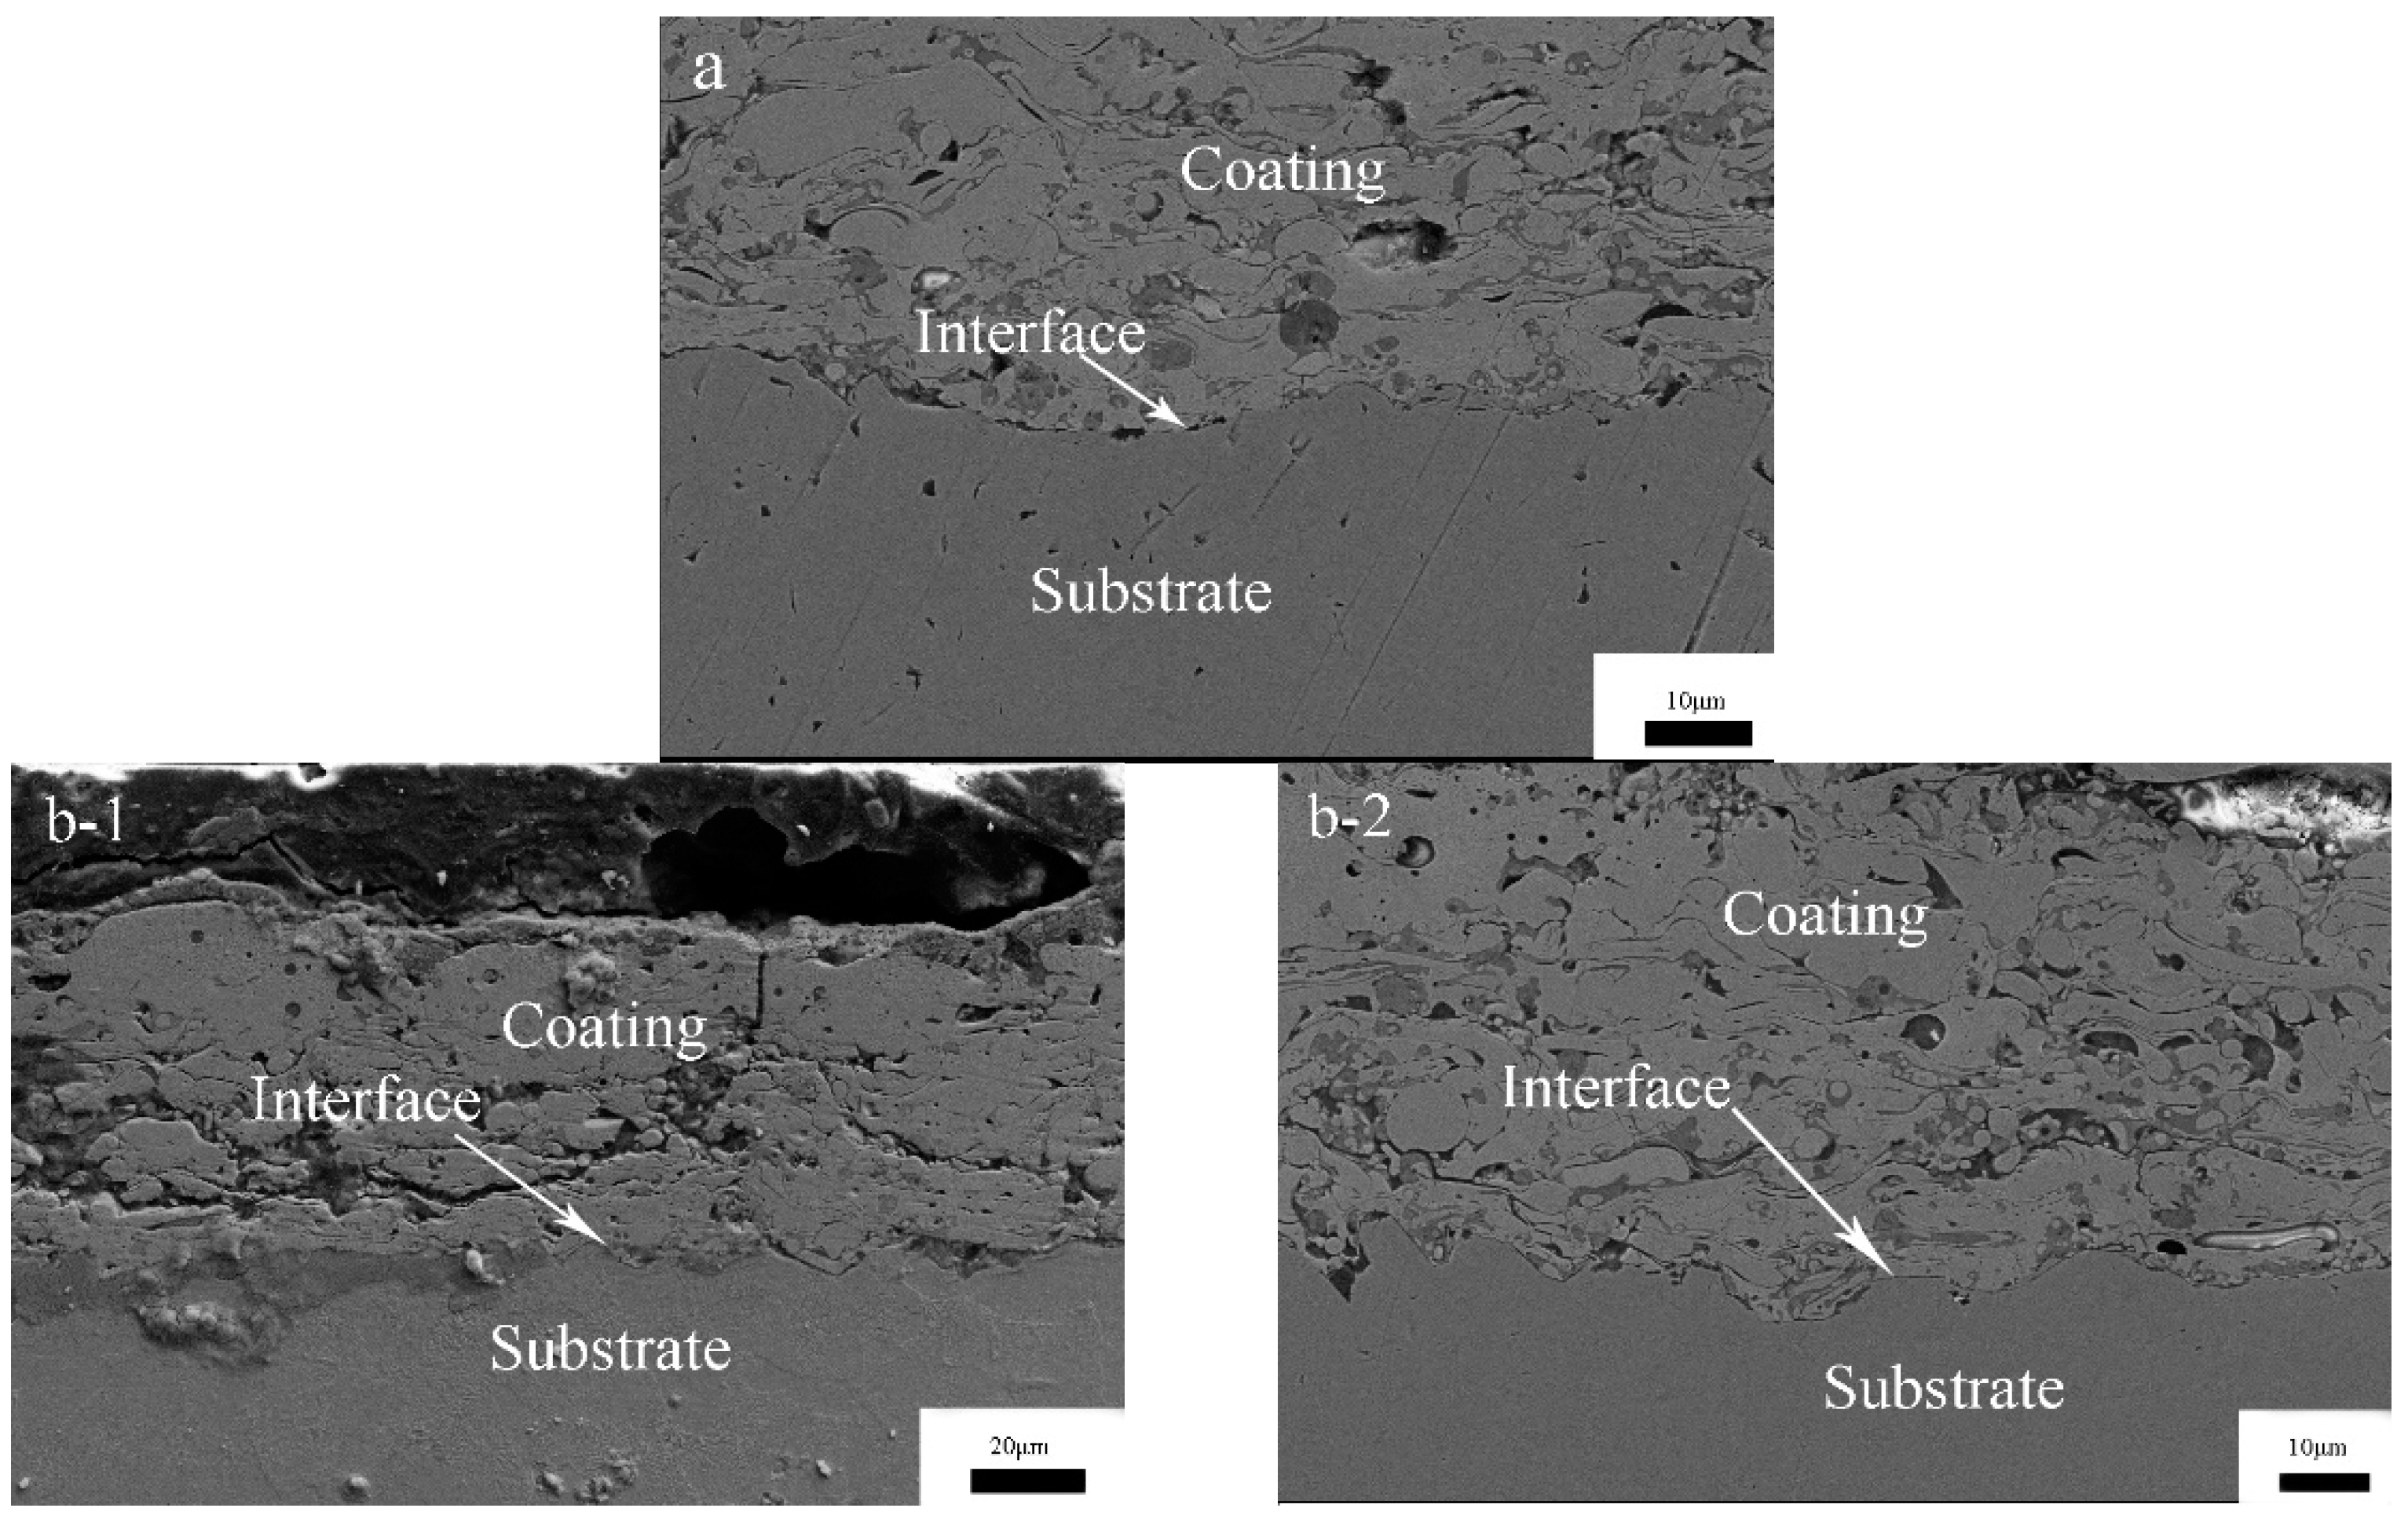
The cross-sectional morphologies of the coatings, after re-melting with different degrees of laser power, are shown in
Figure 6. It can be seen from the cross-section that there is a small number of voids and a weak bonding interface, and the coating near the interface is denser than that near the surface in
Figure 6a for CS FAA coating. This is due to the subsequent impact of the latter particles; this process results in the densification of the front deposition layer by extrusion and rearrangement of the particles. This densification leads to the difference between the interface and the surface of the coating [
26]. The coating thickness is about 150 μm.
Figure 6b–d show the cross section morphology of the coating after laser re-melting. It can be seen that the cross-section morphology of the re-melting zone can be divided into three zones from the surface to the substrate: the melting zone, the heat affected zone, and the unaffected substrate. Laser re-melting eliminates the layered structure and pore defects of the sprayed coating within the melting pool (weld bead), so it is more compact. However, there are large cracks between the substrate and the coating, and with the increase in power, there are vertical cracks throughout the coating, and the thickness of the coating gradually decreases. During laser re-melting, the surface layer of coating is rapidly melted and solidified by high energy laser input, the temperature gradient between the substrate and coating is large, and the residual stress is large. The stress concentration occurs at the joint of the coating and substrate, and the stress type is tensile stress and exceeds the adhesion and cohesion strength, and cracks occur on the coating at the weak point. In order to show the porosity of the surface and cross-section before and after laser re-melting more intuitively, the optical microscope method was used in this experiment. The coating sample is made into a metallographic sample, using 200.0 times magnification on an optical microscope with a digital image acquisition system, and 5.0 sections are randomly cut on the surface and the cross section as the test area. Photoshop image processing software was used to threshold the captured image. The size distribution of pores is expressed by the area distribution of pores on a two-dimensional plane: porosity (area occupied by pores/total surface of coating) × 100%. The experimental results are shown in
Table 3. The CS FAA coating has an average porosity about 7.33% at the surface and 5.37% at the cross-section. The laser re-melted CS FAA coating has an average porosity about 3.00% at the surface and 2.00% at the cross-section. It can be seen that laser re-melting can densify the thin layer of the coating at the melting pool area. However, it worth noting that many through-thickness pores or cracks existed at the cross-section surface after re-melting. The melting layer is only about 10.0 μm.
3.4. Hardness and Wear Behaviors
Figure 7 shows the variation of micro hardness from the substrate to the coating surface of the CS and laser re-melted CS FAA coatings. It can be seen from
Figure 7 that the micro hardness of the coating after laser re-melting is slightly improved. The maximum surface hardness of the original coating is 827.2 HV/100/20 (Vickers hardness), and the maximum surface hardness of the 2#, 3# and 4#, coating is 1050.2 HV/100/20, 1102.8 HV/100/20 and 1130.1 HV/100/20, respectively. With the increase in laser power, the surface hardness of the coating also increases. This is because the elimination of some holes in the coating makes the coating denser. In the process of laser re-melting, crystallization occurs, and more nanocrystals and microcrystals are precipitated from amorphous phases. The high-density grain boundary hinders the movement of dislocations; this process results in higher hardness. At the same time, the heat affected zone also has a higher hardness than its original state.
CS FAA coating and laser-remelted CS FAA coating were subjected to abrasion experiments to test their wear performance. The coating surface was abraded to smooth and a shallow furrow was produced. The friction efficiency of CS FAA coatings all increased from 0.1 to 0.4, and then reached a stable value. During this period, the friction efficiency fluctuated because the roughness of the coating; as the rough surface was abraded to plane state, the friction efficiency became stable. The friction and wear tests of 40Cr and other coating samples were carried out by using an SiC ball. The mass losses of different samples are listed in
Table 4. It can be seen that all coatings can reduce mass loss by about 60% compared to the 40Cr substrate, and the wear relationship of the four coatings is as follows: 2# > 4# > 1# > 3#. Compared with CS FAA coating, the mass loss of laser re-melted CS FAA coating can be reduced by about 1.0–18.2%. The wear loss of the three kinds of coating is as follows: 2# > 4# > 3#.
The results show that the wear resistance of 2# coating is the best, followed by 1# coating, and the wear resistance of 3# coating is the worst. Generally, the hardness of the material is closely related to its wear resistance. The higher the hardness, the better the wear resistance. However, the wear resistance of the 3# coating decreases, which may be due to the high heat input during the re-melting process, which reduces the adhesion between the coatings.
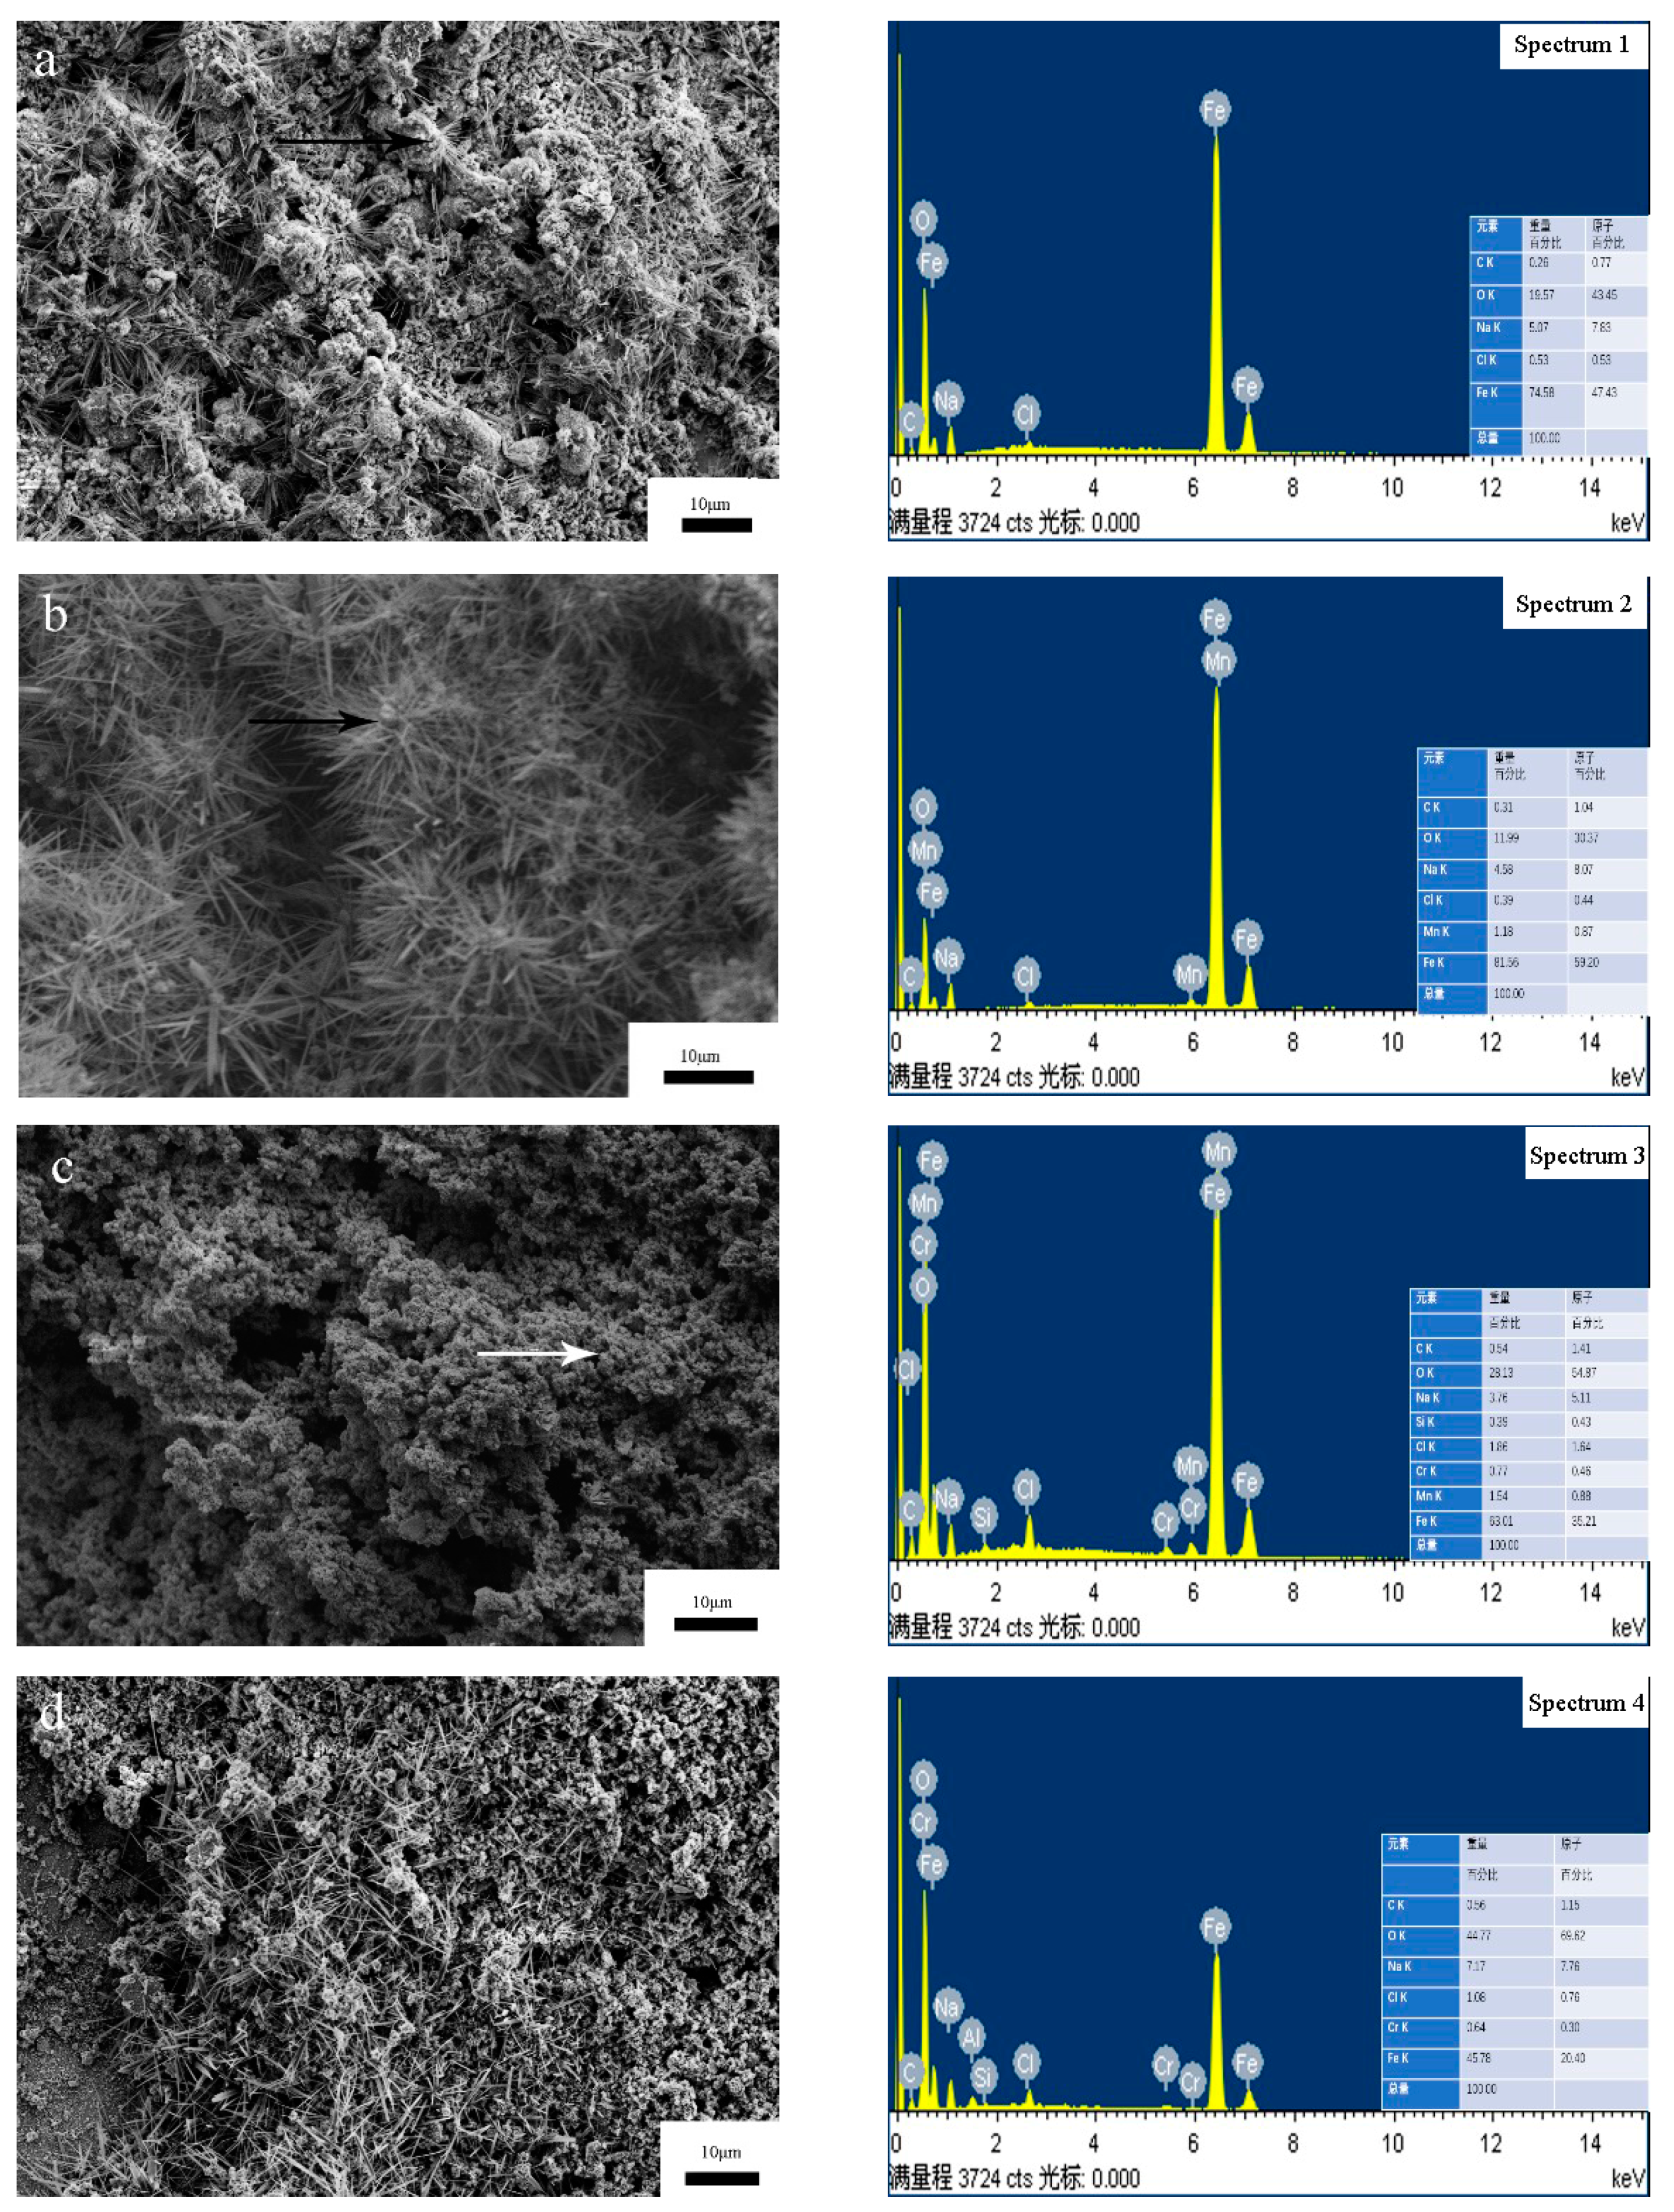
3.5. Corrosion Behavior of Coatings
Figure 8 is the SEM image and energy spectrum analysis of different coating morphologies after a salt spray test. The corrosion products of FAA coating are in fluffy cotton structure. It can be seen that the corrosion mainly occurs at the loose part of the coating, around the pores and cracks, and the corrosion in other areas is relatively light. This is because, in the corrosion environment, micro galvanic corrosion and micro crevice corrosion occur easily in the pores, and the pores act as the propagation channel of corrosion medium, causing internal corrosion of coating and even substrate corrosion. Zhang et al. analyzed the pore volume and size distribution in the Fe-based amorphous coating using 3D XRT technology, and studied the relationship between porosity and corrosion resistance. The results show that the pores seriously weaken the corrosion resistance of the amorphous coating, and the existence of three-dimensional through-thickness pores leads to the corrosion of the substrate [
22].
Figure 9 shows the XRD images of different coatings after a salt spray test. The positions of the peaks of the coatings match the standard diffraction peaks of Fe
2O
3 (PDF#99-0060) and Fe + 30 (OH) (PDF#01-0136). It shows that the reaction between O and Fe produces Fe
2O
3. The results of energy spectrum analysis in
Figure 8 and
Table 5 show the atomic percentages of the four coatings. The results show that, in addition to the element composition of amorphous alloy, there are high contents of O and Cl elements, and the density of these non-metallic elements is low, so the corrosion products of the coating are in loose structure; the result indicates that oxidized Fe is the main corrosion product of the coating. In the process of electrochemical corrosion, oxygen reacts with metal elements in the coating to form dense and stable oxides; the generation of oxides will hinder the contact between corrosion medium and coating or substrate, and will decrease the corrosion rate of the coating. There are also some black spots on the coating surface for all kinds of samples; this is probably the corrosion product of amorphous materials, since most of the corrosion products of Fe are yellow.
Figure 10 shows the potentiodynamic polarization curves of the substrate, CS coating and laser re-melted coatings. It can be seen from
Figure 10 that the corrosion rate is rather low. Furthermore, there is no oxygen diffusion limited current density at the cathode part. According to the anodic polarization curve, the corrosion current increases slowly with the increase in corrosion potential; this phenomenon indicates that passivation occurs for the CS FAA coating. After laser re-melting, it is found that the corrosion current increases more rapidly with the increase in potential than that of the original coating. The reason is that cracks appear on the surface of the coating after re-melting, and the occurrence of cracks destroys the continuity of the passivation film and causes severe corrosion. The corrosion current densities for four coatings are 5.62 × 10
−6, 11.17 × 10
−6, 12.46 × 10
−6, 8.33 × 10
−6 mA/cm
2, respectively. These are much lower than for 40Cr, but they are much higher than those of FAA materials. Thus, it can be concluded that activation controls the corrosion process of laser re-melted CS FAA coating. However, the diffusion path is blocked immediately, and the diffusion of the corrosion electrolyte becomes more difficult, which decreases the corrosion current of the laser re-melted CS FAA coatings.
4. Discussion
Dense coating can be obtained by means of dramatic deformation in CS. The density of the coating is closely related to the deformation of the particles. There is a critical deformation for perfect combination to obtain full dense coating. The deformation of the particle is influenced by many factors, such as final impacting velocity and angle, hardness, temperature, shape of the particle and the substrate/deposited layer. Specifically, the deformation of a particle under a certain degree of hardness is determined by its momentum (mass × velocity); the deformation of a particle under a certain momentum is determined by its hardness. Generally, harder materials need higher impacting velocity to obtain satisfying deformation and combination. For example, aluminum particle can obtain perfect deformation if the velocity is high enough. However, for some hard materials, such as WC-Co, CoNiCrAlY and Fe-based amorphous alloy, the thorough deformation is hard to attain. To obtain ideal coating, the spraying temperature needs to be elevated to increase the velocity and soften the particles. However, if the hardness of a material exceeds a certain value, full dense coating cannot be deposited through CS. Some research on Cr, Co and Fe materials also suggested this phenomenon. Roughly, if the hardness of a particle is softer than 500.0 HV/100/20, it is more likely to obtain dense coating, while, if the hardness is harder than 800 HV/100/20, it is not likely to obtain dense coating by CS. Since the density of a hard material cannot be improved, the anticorrosion performance is limited for thin coating. Sealing or ultra-thickness coating is necessary to guarantee the anticorrosion performance. Sealing with organic compound will change the friction efficiency, but it can also increase anticorrosion performance. Ultra-thickness will increase the cost and the mass of a component, and, in some cases, it is prohibited. In this paper, the laser re-melting method was investigated, and the results indicate that low power density laser re-melting cannot densify the FAA coating since the residual stress will lead to crack on the surface. If the power density of the laser is high enough, it will cause cracks between the interfaces of the coating. For normal ductile metal, dislocation and boundary shift can eliminate the energy of stress, but for rigid or fragile metal (amorphous metal), there is not enough shift to release the stress induced by quick solidification. The formation of cracks is a result of the releasing of residual stress. Although the melting process can eliminate pores within the melting area, cracks will be produced simultaneously, not only in the melting zone, but also in the bulk coating area. There is still a probability of through-thickness passage in the coatings. Further optimization should be performed to improve the anticorrosion performance for this method by eliminating cracks.
5. Conclusions
In this paper, FAA coatings were prepared by CS, and then re-melted by lasers with different power densities. The microstructure, hardness and corrosion resistance were studied. By analyzing the results, the following conclusions can be drawn:
CS can deposit FAA coating with excellent performance, which can keep the amorphous content unchanged. However, the coating has a high porosity about 7.33% for the surface and 5.37% at the cross-section.
Laser re-melting can eliminate the pores in CS FAA coating, but it will lead to cracks for residual stress; it cannot improve the anti-corrosion performance significantly.
Laser re-melting can elevate the hardness of the CS FAA coatings, and subsequently improve the anti-abrasive performance by about 18% at 150.0 and 300.0 W, but it decreases the anti-abrasive performance by about 1% at 240.0 W.
Low density laser re-melting cannot improve the anti-corrosion performance significantly. Further optimization of laser re-melting parameters should be performed to cut off the diffusion passage through the coating.
Author Contributions
Conceptualization, L.M.; methodology, C.H.; investigation, X.S., B.M., G.H. and C.H.; writing—original draft preparation, C.H.; writing—review and editing, G.H. All authors have read and agreed to the published version of the manuscript.
Funding
This research was funded by the foundation of State key laboratory of solid lubrication, Lanzhou Institute of Chemical Physics, Chinese Academy of Science, Grant NO. SLS 2018.
Institutional Review Board Statement
Not applicable.
Informed Consent Statement
Not applicable.
Data Availability Statement
Not applicable.
Acknowledgments
The author thanks Xudong Sui for providing the anti-abrasive test conditions. The author thanks Qingjun Chen for providing FAA powders.
Conflicts of Interest
The authors declare no conflict of interest.
References
- Guo, R.Q.; Zhang, C.; Yang, Y.; Peng, Y.; Liu, L. Corrosion and wear resistance of a Fe-based amorphous coating in underground environment. Intermetallics 2012, 30, 94–99. [Google Scholar] [CrossRef]
- Schuh, C.A.; Hufnagel, T.C.; Ramamurty, U. Mechanical behavior of amorphous alloys. Acta Mater. 2007, 55, 4067–4109. [Google Scholar] [CrossRef]
- Yang, B.; Liu, C.T.; Nieh, T.G. Unified equation for the strength of bulk metallic glasses. Appl. Phys. Lett. 2006, 88, 221911. [Google Scholar] [CrossRef]
- Lee, K.A.; Jung, D.J.; Park, D.Y.; Kang, W.G.; Lee, J.K.; Kim, H.J. Study on the fabrication and physical properties of cold-sprayed, Cu-based amorphous coating. J. Phys. Conf. Ser. 2009, 144, 012–113. [Google Scholar] [CrossRef]
- Inoue, A.; Zhang, W.; Zhang, T.; Kurosaka, K. High-strength Cu-based bulk glassy alloys in Cu–Zr–Ti and Cu–Hf–Ti ternary systems. Acta Mater. 2001, 49, 2645–2652. [Google Scholar] [CrossRef]
- Sun, C.; Zhou, X.; Xie, C. Effect of processing conditions on Al-based amorphous/nanocrystalline coating by cold-spraying. Surf. Coat. Technol. 2019, 362, 97–104. [Google Scholar] [CrossRef]
- Lahiri, D.; Gill, P.K.; Scudino, S.; Zhang, C.; Singh, V.; Karthikeyan, J. Cold sprayed aluminum based glassy coating: Synthesis, wear and corrosion properties. Surf. Coat. Technol. 2013, 232, 33–40. [Google Scholar] [CrossRef]
- Sury Anaray Ana, C.; Inoue, A. Iron-based bulk metallic glasses. Int. Mater. Rev. 2013, 58, 131–166. [Google Scholar] [CrossRef]
- Inoue, A.; Takeuchi, A. Recent development and application products of bulk glassy alloys. Acta Mater. 2011, 59, 2243–2267. [Google Scholar] [CrossRef]
- Cadney, S.; Brochu, M. Formation of amorphous Zr41.2Ti13.8Ni10Cu12.5Be22.5 coatings via the electrospark deposition process. Intermetallics 2008, 1, 1–6. [Google Scholar] [CrossRef]
- Liu, D.; Gao, W.; Li, Z. Electro-spark deposition of Fe-based amorphous alloy coatings. Mater. Lett. 2007, 61, 165–167. [Google Scholar] [CrossRef]
- Kojima, A.; Horikiri, H.; Makino, A. Soft magnetic properties of nanocrystalline BCC Fe-(Nb, Zr)-B bulk alloys consolidated by warm extrusion. Mater. Trans. JIM 1995, 36, 945–951. [Google Scholar] [CrossRef][Green Version]
- Tao, Y.; Xiong, T.; Sun, C. Effect of α-Al2O3 on the properties of cold sprayed Al/α-Al2O3 composite coatings on AZ91D magnesium alloy. Appl. Surf. Sci. 2009, 256, 261–266. [Google Scholar] [CrossRef]
- Papyrin, A. Cold spray technology. Adv. Mater. Process. 2001, 159, 49–51. [Google Scholar]
- Van Steenkiste, T.H. Kinetic spray coating. Surf. Coat. Technol. 1999, 111, 62–71. [Google Scholar] [CrossRef]
- Jr, V.C.; Kaplowitz, D.; Iii, V.K.C.; Howe, C.; West, M.K.; Mcnally, B. Dissimilar metal joining and structural repair of AE41A-T5 cast magnesium by the cold spray (cs) process. Mater. Manuf. Process. 2016. [Google Scholar] [CrossRef]
- Huang, G.; Wang, H.; Li, X.; Xing, L.; Zhou, J. Deposition efficiency of low pressure cold sprayed aluminum coating. Mater. Manuf. Process. 2017, 1–7. [Google Scholar] [CrossRef]
- Szkodo, M.; Bień, A.; Antoszkiewicz, M. Effect of plasma sprayed and laser re-melted Al2O3 coatings on hardness and wear properties of stainless steel. Ceram. Inter-national 2016, 42, 11275–11284. [Google Scholar] [CrossRef]
- Grum, J.; Slabe, J.M. Effect of laser-remelting of surface cracks on microstructure and residual stresses in 12Ni maraging steel. Appl. Surf. Sci. 2006, 252, 4486–4492. [Google Scholar] [CrossRef]
- Zhang, Z.; Lin, P.; Ren, L. Wear resistance of AZ91D magnesium alloy processed by improved laser surface re-melting. Opt. Lasers Eng. 2014, 55, 237–242. [Google Scholar] [CrossRef]
- Mateos, J.; Cuetos, J.M.; Fernández, E. Tribological behaviour of plasma-sprayed WC coatings with and without laser re-melting. Wear 2000, 239, 274–281. [Google Scholar] [CrossRef]
- Lima, M.S.F.; Folio, F.; Mischler, S. Microstructure and surface properties of laser re-melted titanium nitride coatings on titanium. Surf. Coat. Technol. 2005, 199, 83–91. [Google Scholar] [CrossRef]
- Dyshlovenko, S.; Pierlot, C.; Pawlowski, L. Experimental design of plasma spray and laser treatment of hydroxyapatite coatings. Surf. Coat. Technol. 2006, 201, 2054–2060. [Google Scholar] [CrossRef]
- Zhang, N.; Zhou, Y.; Wu, X. Research and development on the laser remelting technique of the spraying coating. Heat Treat. Technol. Equip. 2011, 32, 1–4. [Google Scholar]
- Wang, Z.; Ma, L.; Han, B.; Huang, G.; Cao, Q.; Sun, M. Influence of parameters on the cold spraying FeCoCrMoBCY amorphous coatings. Surf. Eng. 2020, 1, 1–13. [Google Scholar] [CrossRef]
- Zhang, S.D.; Zhang, W.L.; Wang, S.G. Characterisation of three-dimensional porosity in an Fe-based amorphous coating and its correlation with corrosion behaviour. Corros. Sci. 2015, 93, 211–221. [Google Scholar] [CrossRef]
| Publisher’s Note: MDPI stays neutral with regard to jurisdictional claims in published maps and institutional affiliations. |
© 2021 by the authors. Licensee MDPI, Basel, Switzerland. This article is an open access article distributed under the terms and conditions of the Creative Commons Attribution (CC BY) license (https://creativecommons.org/licenses/by/4.0/).


