Abstract
Synchronous measurement of full-field temperature and deformation at high temperature especially more than 1273 K is of much significance especially for part applications of turbine structures and materials. Non-contact optical methods attract more and more attention, however, current methods all face different challenges, such as strong light reflection on the surface of the specimen, disturbing radiation from environment, complex equipment setup, limited measured temperature not higher than 900 °C and so on. In this work, we develop an innovative technique to overcome some current problems. The measurement system employing an ultraviolet (UV) imaging system is composed of a scientific complementary metal oxide semiconductor (sCMOS) camera, a lens and a UV bandpass filter. The UV bandpass filter was used for thermal radiation elimination to acquire high quality images at elevated temperatures for deformation field calculation suitable for digital image correlation (DIC) method. The UV sensitive sCMOS camera without using active illumination was employed to collect enough UV radiation energy and eliminate the interference of the external ambient light, which is applicable for high accuracy temperature field measurement. Our system can realize the synchronous capture of image and temperature acquisition with passive UV imaging system at temperature not lower than 1473 K. The feasibility of the method was verified through heating molybdenum (Mo) and Ni-based superalloy IC21 materials. The temperature fields of Mo measured by the established imaging system up to 1835 K with error less than 0.25% showed the effectiveness for temperature measurement. The estimated deformation and temperature field of Ni-based superalloy IC21 up to 1473 K with measured temperature error less than 0.5% demonstrated well the great potential of the UV imaging system in simultaneous measurement of temperature and deformation fields at elevated temperatures.
1. Introduction
For the safe usage of high temperature structures and materials in aerospace application, it is often desirable and essential to know both the deformation and temperature fields of the specimen investigated in thermal-mechanical tests such as fatigue, creep and other thermomechanical behavior of superalloys and ceramics composites around 1073 K or more [1,2,3,4]. In such extreme environments of high temperature furnace, radiant heat flux or dynamic simulation wind tunnel [5,6], non-contact measurement techniques are preferred. For the deformation measurement, several non-contact techniques such as moiré interferometer (MI) [7], electronic speckle pattern interferometry (ESPI) [8], video extensometers [9], laser speckle correlation (LSC) [10], digital image correlation (DIC) etc. [11,12,13,14], have been proposed. Among which, DIC is more extensively used due to its simple optical arrangement in experimental set-up, easy specimen preparation and full-field deformation measurement. As for the full-field temperature measurement, the infrared thermography (IRT) and temperature-calibrated CCD cameras are usually employed. Combining with the above two techniques, synchronous full-field temperature and deformation measurement can be realized.
Saai et al. [15] used an infrared camera and CCD camera for this purpose. The front sample surface was simultaneously observed by visible and infrared digital cameras. However, the temperature measured was below 773 K due to thermal radiation disturbance when image was captured by visible cameras. Cholewa et al. [16] adopted an integrated IRT and three dimensional DIC (3D-DIC) for simultaneous measurement of spatial and temporal distributions of temperatures and displacements. However, a new technique needs to be developed previously to calibrate the IR thermal cameras with the 3D-DIC system and the measurements were carried out at lower temperature of 773 K. Moreover, considering the expensive infrared imaging sensors, CCD systems are usually used for the high temperature measurements instead. Bodelot et al. [17] proposed a technique at microscopic length scales. A dichroic mirror was used to split the infrared and visual radiation to an infrared and CCD camera, respectively. However, this setup did not allow simultaneous observation of the same area, a more step of transformation between coordinate systems should be considered. Ortreu et al. [18] proposed a method using temperature-calibrated CCD cameras to simultaneously measure full-field displacements/strains and temperatures. As sensor used was operated in the visible and near infrared (NIR) spectral band (0.7–1.1 μm), the measurement was conducted below 773 K. For higher temperature measurement, Su et al. [19] used a 3CCD camera to measure the 3D strain and temperature field of carbon fiber reinforced SiC matrix composite up to 1473 K. In this experiment, a blue channel was used for deformation measurement, while green and red channels (peak wavelength of λG = 540 nm and λR = 600 nm, respectively) were used for temperature measurement adopting a two-color method. Blue illuminations were used as the narrow-band light source. However, actually the spectral response function of wavelength bands R, G and B were partially overlapped in this experiment, leading to the inaccuracy of the finally results to some extent. More recently, Tang et al. [20] proposed a synchronous full-field measurement of temperature and deformation algorithm based on separated radiation and reflected light up to 1273 K. However, actual reflectivity of material at different wavelengths varies and the reflected light of the sample surface not only comes from the light source, but also from the heating source of flame, etc.
Although synchronous full-field temperature and strain measurement are attracting attentions, it faces several challenges:
- Most of the measurements are below 973 K. Above 973 K, thermal radiation would lead to decorrelation in deformation measurement due to the gradually glowing saturation.
- IR cameras record radiations from sample’s own emission, reflections of the surrounding environment and heaters used for heating samples. Insulation from the surrounding light sources is needed for more accurate temperature measurement. However, speckle pattern images with suitable contrast used for displacement and strain field calculation usually needs active illumination. Besides, heating methods usually have thermal radiation themselves. So, conflict exists about the need of surrounding light source.
- Sample surfaces with uniform emissivity is preferred for accurate temperature measurement, however, speckle pattern fabricated with different materials or variable surface states, which will result in inhomogeneous emissivity on the sample surface due to different gray values, are required for deformation calculation via DIC. So, it is also a conflict about the emissivity caused by speckle pattern for the synchronous temperature and strain measurement.
- From a practical point of view, combination of imaging systems composed of CCD cameras and IR cameras are generally complex and expensive.
Many researches have been done to solve the above problems. As for the first challenge, the powerful UV imaging proposed by Dong et al. [21,22] for high temperature observation and images acquisition available in DIC has been employed for deformation measurements in extreme environments such as infrared quartz lamp and arc-heated wind tunnel up to 2141 K [23,24]. However, the active UV illuminations which disturb temperature measurements were indispensable and utilized for all the deformation measurements [25,26,27]. Besides, blue illuminations and blue bandpass filter are also used. However, the high-quality images captured is limited to 1173 K due to the significant glowing [25,28]. For the third challenge, UV thermal radiation eliminating the effect of emissivity fluctuation benefits temperature measurement [29,30,31], however, the UV quantum efficiency of regular CCD camera was usually so low that an image intensifier was suggested to use to oscillate the radiance, which always caused more noises [32].
This work aims to address the challenges by designing and constructing a novel system for synchronous deformation and temperature measurement at temperatures higher than 1123 K. Based on the UV imaging system composed of a sCMOS camera, a lens and a UV bandpass filter, the requirement of high-quality images suitable for deformation measurement via DIC under extreme high temperature can be satisfied. Meanwhile, by choosing the UV sensitive sCMOS camera, collection of UV radiation energy can effectively measure the temperature field, before which, calibration of the UV imaging system was done using a blackbody furnace. Preliminary tests were carried out by measurement of Mo and IC21, respectively. To the author’s best knowledge, this is the first report regarding the application of UV imaging for simultaneous temperature and deformation measurement.
It is important to note that although the highest temperature measured up to 1473 K for IC21 superalloy and 1835 K for Mo in the preliminary tests, the proposed measurement technique has a great potential for higher temperature applications. And this technique can be largely attributed to the mechanism explanation for deformations and failures of superalloys and coatings during mechanical properties or in simulated service working environment and the phase transformation induced deformation and other situations relating to temperature and strain change.
2. UV Imaging for Deformation and Temperature Measurement
2.1. UV Imaging for Deformation Measurement by DIC
It is known that with temperature increasing, radiation energy is a function of temperature and wavelength, and can be mathematically described by the Planck’s radiation law [33].
where L (λ, T) is the radiation energy intensity, λ is wavelength, T is temperature, c1 is the first Planck’s constant (5.9548 × 10⁻¹⁷ W × m2) and c2 is the second Planck’s constant (0.014388 m K). According to the equation, the emitted light has higher intensity at longer wavelengths than it does at shorter wavelengths when the temperature of the specimen increases.
Thermal radiation from a heated object can significantly increase the brightness and decrease contrast of the images when the temperature increases to a degree according to the wavelength, which will lead to decorrelation of images in DIC, as a result, the deformation field will fail to be calculated [27,28]. For example, the white emitted light becomes bright enough and the sample surface shows significant glowing between 773 K and 873 K and blue light between 1073 K and 1173 K, while the UV-DIC used can still capture high quality images from the sample surface until 1260 °C [27,28]. Consequently, the combined use of monochromatic light with shorter wavelength and monochromatic light pass filter for acquiring images can be an effective solution to extend the temperature range of deformation field calculation with DIC as advocated by Grant et al. [34] and Dong et al [21]. The more detailed information can be referred [21,22,23,24,25,34].
It should be noted that the UV light source as an active illumination in the current UV-DIC systems [21,22,23,24,25] will not be used in the present UV imaging system.
2.2. UV Thermal Radiation for Temperature Measurement
Since a normal object is not considered to be an ideal blackbody, the luminance temperature measured with a radiation thermometer differs from the true temperature. That is to say, the relationship between the luminance temperature S (K) and the true temperature T (K) is expressed as follows [32]:
where e is emissivity, which is very difficult to estimate accurately because it is strongly dependent on the material, surface state and the aiming angle [35]. From Equation (2), S (K) at different wavelengths and absolute true temperatures with different emissivity values can be obtained as shown in Figure 1. It can be seen that S (K) approaches more to T (K) as the wavelength gets shorter no matter how the emissivity varies, which elucidates the shorter wavelength applied in the UV system has more advantage to decrease the measure errors between S (K) and T (K) at different emissivities.
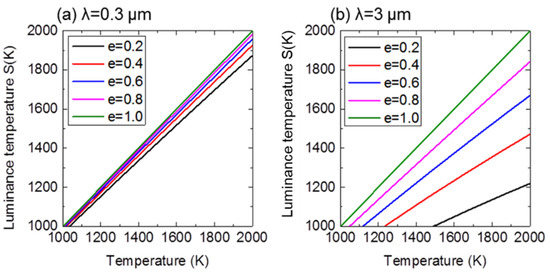
Figure 1.
Influence of light wavelength on the difference between S (K) and T (K) at different emissivities: (a) λ = 0.3 µm (b) λ = 3 µm.
That is to say, as the wavelength is shorter in UV range, the radiation energy or S (K) becomes highly sensitive to temperature and less sensitive to emissivity, which will also be explained from Equation (3) to Equation (5). As a result, the main measurement error associated with emissivity fluctuation occurred in IR thermography during temperature measurement can be eliminated by using UV thermal radiation.
The relationship between radiation energy intensity of T (K) and that of S (K) is expressed as follows [32]:
If ≤ 3000 µm K, combined with Equation (1), Equation (3) can be also simplified using Wien’s approximation [36]:
The thermometric effect, that is the sensitivity of the measurement is then obtained by differentiating Equation (4):
According to Equation (5), it is obviously that the change of radiant energy intensity caused by the same temperature change is relatively larger in the short UV band when e is the same, indicating L is more sensitivity to temperature change at shorter wavelength [37,38].
Also, it is noted that some of the radiant energy coming from the non-measured object and the ambient radiation during actual measurement process will definitely affect the measurement result, if the environmental radiation cannot be accurately estimated or the influence is eliminated. It also can be known by the Planck’s radiation law and the Wien’s displacement law [39,40] that the peak of wavelength shifts to short value with temperature increasing as shown by the black dotted line in Figure 2. As a result, compared with the ambient infrared radiation, the ambient ultraviolet radiation that can enter the detector is much smaller when the temperature is measured using UV radiation.
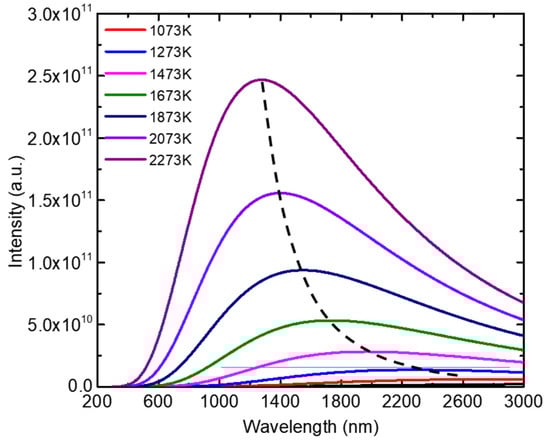
Figure 2.
Thermal radiation intensity at different wavelengths with increasing temperature according to Planck’s radiation law.
3. Methodology
3.1. Temperature Calibration
Figure 3 shows the schematic illustration of the setup for temperature and deformation measurement of passive UV imaging system which consists of an optical bandpass filter attached just before the fixed-focus lens and Photometrics Prime 95B sCMOS camera. Figure 3b gives the quantum efficiency of the sCMOS camera and transmittance of the UV filter being used. The sCMOS camera uses back illumination to reach near-perfect quantum efficiency (converting up to 95% of incident photons into a measurable signal) combined with low readout noise and large pixels, which provides the sensitivity required for weak and low-light imaging application [41]. The optical bandpass filter, with a center wavelength of 365 nm ± 2 nm and a full-width at half maximum (FWHM) value of approximately 15 nm, has a transmittance of 60% at 365 nm. Before the established system was used for temperature measurement, it was calibrated through a standard blackbody furnace using the model as follows [18]:
where I is the pixel gray level value registered by the camera, ti is the integration time of the camera, c2 is the second Planck’s constant. This model depends on 4 parameters (kw, a0, a1, a2) that are determined during the radiometric calibration process. Figure 4 shows the typical temperature calibration curve of gray level normalized by integration time (ti = 0.01 s) versus temperature. From the fitting curve, the parameter can be determined as: kw = 4.65 × 10⁸ gray level/s; a0 = 8.68 × 10⁵ m−1, a1 = 0 and a2 = 0.
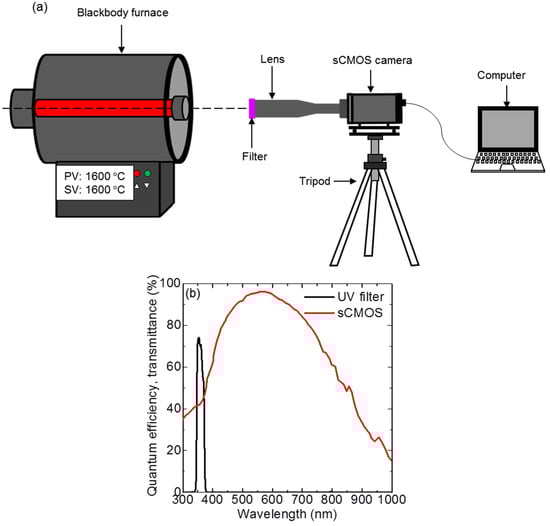
Figure 3.
(a) Schematic illustration of calibration of the UV imaging system for temperature measurement via a blackbody furnace and (b) optical properties of camera and filter used in the UV imaging system.
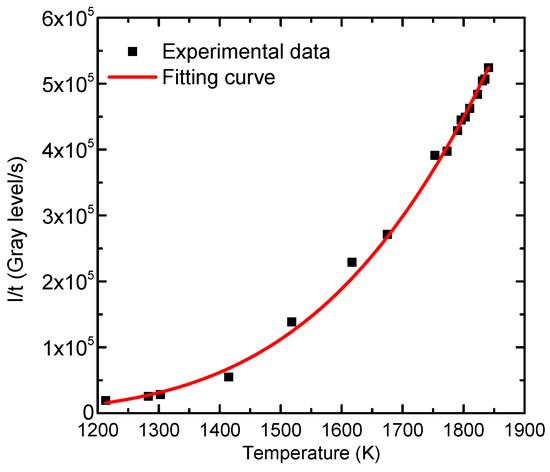
Figure 4.
A typical temperature calibration curve of I/ti (pixel intensity normalized by the integration time) versus temperature.
3.2. Experimental Setup
Figure 5 shows the experimental setup for simultaneous temperature and deformation measurement combining with the electro-thermomechanical testing system [42]. The specimens were heated by direction electric current heating system which offers the advantage that the thermal radiation only comes from the specimen itself eliminating the disturbance of ambient thermal radiation in heating environment such as furnace, quartz lamp heating, etc. A high vacuum environment about 10−4 Pa avoiding the oxidation of speckle pattern was provided by a vacuum system, which will improve DIC calculation accuracy. An infrared thermometer (CIT-1MD, Sciample, Institute of Automation, Chinese Academy of Sciences, Beijing, China) was used to measure the temperature of the specimen. To verify the accuracy of the proposed UV imaging system for temperature and deformation measurement, two types of experiments were conducted: (1) the Mo (Qinghe County Yuxuan Metal Materials Co., Ltd., Qinghe, China) specimens with surfaces polished with 100 # sandpaper and air sprayed toner powder mixing with alcohol to generate random speckle patterns were used to examine the effectiveness of temperature fields measurement; (2) A Ni-based single crystal superalloy IC21 with [001] orientation (deviated by 4°), and the nominal composition (wt.%) of (7.4–7.8) Al, (3.0–4.5) Ta, (8.9–9.3) Mo, (1.3–2.7) Cr, (1.4–1.6) Re and Ni the balance, was chosen for obtaining temperature and strain field simultaneously. Random speckle pattern was artificially fabricated onto the specimen surface to obtain the displacement and strain field via 2D-DIC [43,44]. The speckle pattern was made as follows: the polished IC21 was chemically etched for 10 s with a mixture of 35 wt.% hydrochloric acid and sulfuric acid, then the etched surface was air sprayed by toner and alcoholic mixture. During the heating process, a stable tensile stress of 300 MPa was applied to the specimen which was heated at a rate of 100 °C/s meanwhile the images were captured at 15 fps. The recorded images were subsequently processed by the well-established subset-based pattern matching algorithm to extract full-field displacements, and then were differentiated with pointwise least squares strain estimation algorithm to determine full-field strain distributions [45].
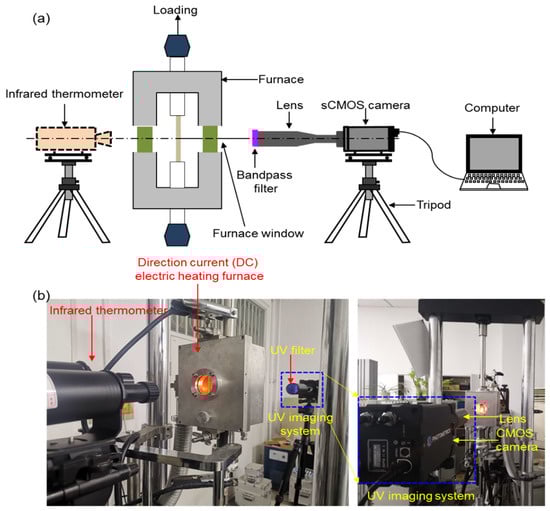
Figure 5.
(a) Schematic illustration and (b) the real experimental setup of temperature and deformation measurement system.
4. Results and Discussion
4.1. Temperature Field
Figure 6 shows the typical images of Mo specimen coated with toner captured at integration time of 0.01s by the UV imaging system during heating process. Utilizing the established temperature model, the temperature fields are shown in Figure 7. It can be seen that maximum temperature in the temperature field matched well with the results measured by the infrared thermometer with the maximum relative error less than 0.25% at 1835 K as shown in Table 1, verifying the accuracy of the proposed UV imaging system for temperature measurement.
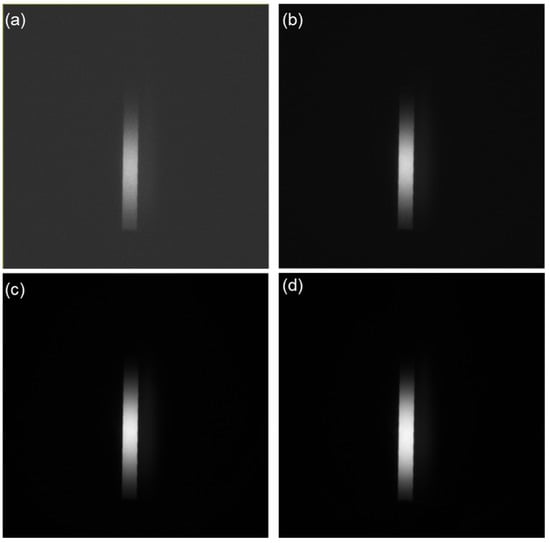
Figure 6.
Typical images captured at different temperatures: (a) 1213 K, (b) 1415 K, (c) 1753 K and (d) 1835 K.
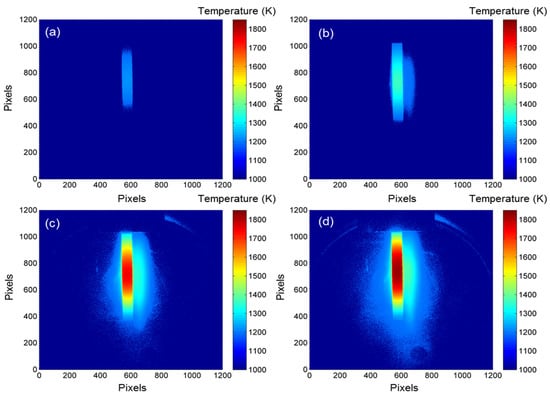
Figure 7.
Typical temperature fields obtained by established model at different temperatures: (a) 1213 K, (b) 1415 K, (c) 1753 K and (d) 1835 K.

Table 1.
Comparison of Measured and Calculated Temperature.
4.2. Temperature and Deformation Field
Figure 8 shows the typical surface image of IC21 specimen captured at 1073 K. It can be seen that the corroded pits zones are dark, which means the gray value is low. The toner layer zones with high gray values are bright. Although a layer of toner powder is sprayed to obtain a higher emissivity, the difference in surface height caused by etching may lead to emissivity dissimilarity. As a result, the intensity of thermal radiation emitted by the surface divergences.
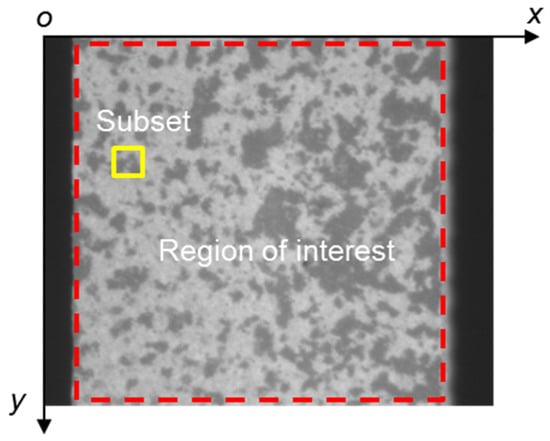
Figure 8.
The speckle pattern image captured at 1073 K, the specified region of interest (ROI) and the imposed yellow square of subset used.
Figure 9 shows the temperature fields at several typical temperatures. It can be seen that it varies in temperature field between the corroded and polished areas. In order to show the different temperatures at varied gray scales visually, a vertical line was randomly made between the coordinates of (1416 pixels, 590 pixels) and (1416 pixels, 1434 pixels) in the region of interest as shown in Figure 10a, and then the temperature changes with the variation of coordinates were obtained. The variation trend is consistent at different temperatures. In order to show the accuracy of temperature measurement results, relative error Er for certain positions of coordinates from (1416 pixels, 760 pixels) to (1416 pixels, 800 pixels) with high gray values were checked based on the relative error Er expression as follows:
where Er is the relative error, Tc is the calculated temperature and Tm is the measured temperature.
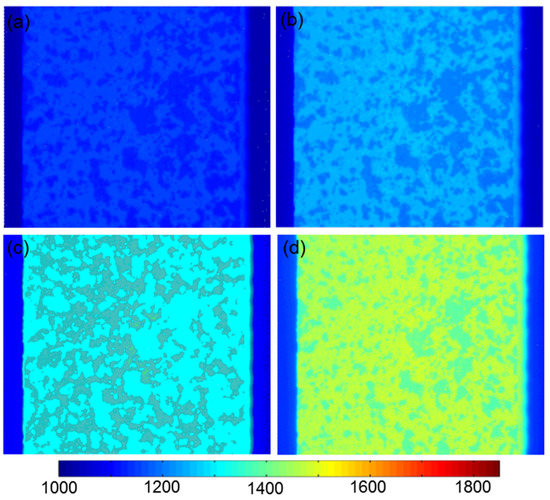
Figure 9.
Typical temperature fields at (a) 1173 K, (b) 1273 K, (c) 1373 K and (d) 1473 K.
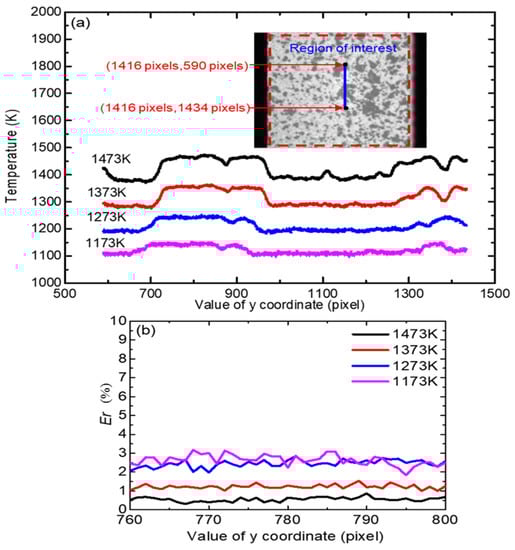
Figure 10.
Typical temperature variation with coordinate changing for a randomly selected line in the region of interest (a) and the relative error Er. at different temperatures (b).
Figure 10b shows that Er decreases with temperature increasing. The higher Er (below 3%) at 1173 K may be due to the relatively weak UV light radiation for temperature measurements at lower temperature. However, when temperature increased to 1473 K, Er reached less than 0.5% demonstrating the accuracy of the temperature measurement using the UV radiation.
In order to test the effect of increase radiation intensity with increasing temperature on the gray values of pixels at different temperatures and its effect on image correlation and subset matching. The four pictures with speckle patterns obtained by UV system at different temperatures in Figure 9 are used to analyze the gray values with ImageJ as shown in Figure 11 and the corresponding grayscale values distribution of different images are shown in Figure 12. It can be seen that there are three gray value peaks. The first isolated peak corresponds to the gray value distribution of black margin zone in the picture out of the sample surface, as a result, the gray value at this zone can be ignored in the analyses. The two other overlapping peaks are respectively corresponding to the gray values distribution of dark pixels with low values and bright pixels with high values. The gray values at peak sites and the discrepancy between bright and dark pixels are shown in Figure 12 and concluded in Table 2.
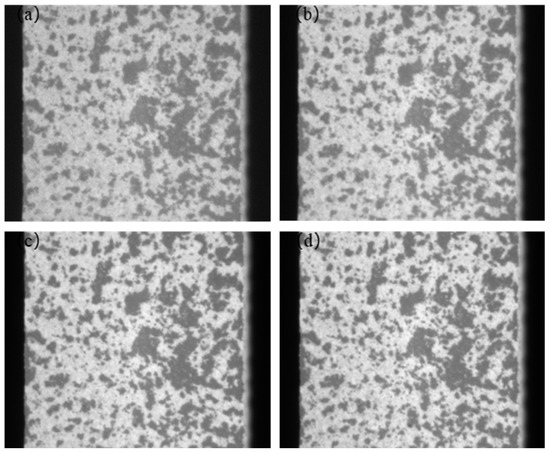
Figure 11.
Speckle patterns images captured by UV system at different temperatures: (a) 1173 K, (b) 1273 K, (c) 1373 K and (d) 1473 K.
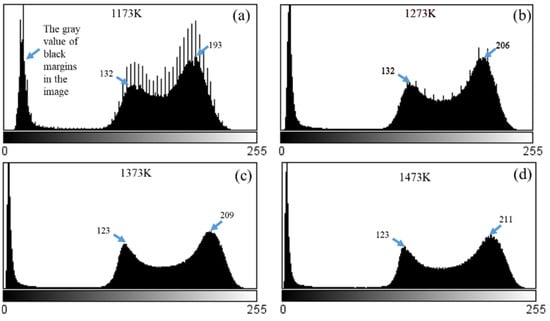
Figure 12.
Distributions of grayscale values of different pictures in Figure 11 (a) 1173 K, (b) 1273 K, (c) 1373 K and (d) 1473 K.
Table 2.
Gray Values at Peak Sites in Figure 11 and Discrepancies Between the Bright and Dark Pixels.
It can be seen that gray scale values of bright pixels change a little with temperature increasing, while the dark pixels have a contrary trend. The increase divergence with less than 10% at bright pixels from 1173 K to 1473 K is bigger than the decrease divergence at dark pixels, besides, the overlapping degree of the two peaks decreases with temperature increasing, which illustrates that the gray values become more concentrated for the dark and bright pixels.
Though increasing temperature affects gray scale values at different pixels, it will not affect image correlation and subset matching. For one aspect that the gray values change less than 10% as shown in Table 2, for the other aspect that we will use incremental correlation calculation strategy using updated reference image pair (serially correlating the image to the prior near one not to the first one) in DIC to process the images. The introduction of incremental correlation calculation method can be seen in the reference [46]. Besides, it can also be seen from Figure 1 that the effect of the glow was weak enough that the speckled surface remained visible, and the slight intensity variations in the images have negligible influence on DIC calculation, as they can be well compensated by the robust zero-mean normalized sum of squared difference (ZNSSD) criterion [47].
After obtaining the speckle pattern image (as shown in Figure 8) at different temperatures, the corresponding displacement fields of IC21 alloy can be calculated via DIC (Vic-2D 2009 Digital Image Correlation, version 2009.1.0, Correlated Solutions Inc., Columbia, SC, USA). The reference image captured at 1073 K was set as the reference image due to the reason that a clear high quality image cannot be obtained at room temperature resulting from the lack use of active UV illumination in the work for eliminating the influence of ambient light in temperature measurement. However, a clear image can be acquired at 1073 K due to the intensified thermal radiation for UV imaging of the specimen. Furthermore, it should be noted that the initial temperature at which the reference image captured depends on the hardware of system and exposure time. In DIC calculation, IC-GN algorithm with ZNSSD correlation criterion, first-order shape function and bicubic B-spline interpolation were employed. The subset size used was 85 × 85 pixels and the grid-step was chosen to be 7 pixels. Figure 13a–f show the displacement fields after eliminating the in-plane rigid-body motion at 1173 K, 1273 K and 1373 K, respectively. The evenly spaced contour lines in Figure 13a–f indicate homogeneous thermal expansion. At lower temperatures, the contour lines of the u displacement field are parallel to the y axis, and analogously, the contour lines of the v displacement field are parallel to the x axis. At higher temperature of 1373 K, however, the actual calculated results indicate a rigid body rotation (anticlockwise) as shown in Figure 13c,f. It’s the characteristic of a single crystal, when the dislocation moves at the slip surface along a particularly orientation during deformation. At a lower temperature of 1173 K and a stress level of 300 MPa, <110> {111} glide systems cannot be activated for which the thermal radiation dominates the deformation as seen in Figure 13. When temperature increases meanwhile the stress was maintained at 300 MPa, the dislocations were activated and deformation gradually accelerates, at which the creep deformation cannot be ignored, resulting in the superposition with the thermal deformation. As a result, the specimen is twisted along the slip orientation, which leads to u, v displacements incline as shown in Figure 13c,f.
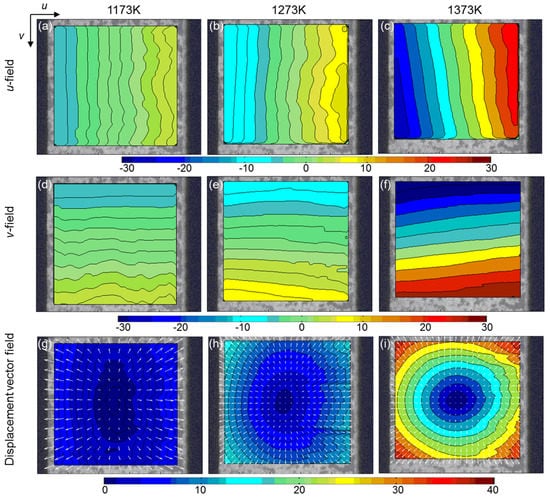
Figure 13.
u,v displacement fields and displacements vector fields measured at 1173 K, 1273 K and 1373 K after removing rigid-body rotation.
Figure 14 shows the typical strain maps of εyy at different temperatures. The homogeneous strain distribution agrees with the isotropic property of IC21. The calculated thermal strain εxx (x direction) and εyy (y direction) were then averaged as shown in Figure 14. The calculated average thermal strain and are almost the same, increasing as the temperature increases. However, after 1373 K, the strain increase rate of is higher than . This is because a stable tensile stress of 300 MPa was applied to the specimen of IC21 during the heating process, the creep deformation should not be ignored besides the thermal expansion at higher temperature.
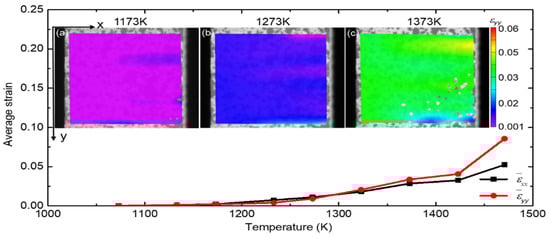
Figure 14.
Average thermal strain and with temperature increasing and the typical strain distribution in y direction.
Using the elaborately designed novel UV imaging system composed of one UV sensitive camera, a UV filter and a lens, the measurements of temperature and deformation field of Mo and IC21 were conducted, and the results verified the feasibility of the proposed technique. At lower temperature of 1173 K, the relative error can be about 3% which can be reduced by increasing heating temperature (1835 K with error 0.25%), thus the proposed system was especially suitable for ultra-high temperature situations. For displacement measurement accuracy, using the high-accuracy Bicubic B-spline interpolation method, the bias error in displacement measurement can be suppressed to less than 0.005 pixels [42]. The image resolution used was 1.3 μm/pixel, thus the displacement resolution is estimated to be 0.0065 μm. It is important to note that although the highest temperature measured up to 1473 K in the preliminary deformation measurement, the proposed measurement technique has a great potential for higher temperature applications [23].
The limitation of the current method is the ineffective use at low temperatures especially lower than 1073 K due to the reason that the clear high-quality pictures cannot be captured at these temperatures because of the lack use of active UV illumination light.
Special attention should be paid to the manufacture of high temperature resistant, non-falling off and stable speckle patterns.
5. Conclusions
In this study, for the first time, synchronous measurements of temperature and deformation were performed by a self-developed UV imaging system. Benefiting from the specially designed system composed of a sCMOS camera, a UV filter and a lens, the strong disturbance of thermal radiation emitted from the heated sample can be well suppressed. As thus, high-fidelity images can be recorded for deformation measurement at temperature not lower than 1473 K. In addition, by choosing the ultraviolet sensitive sCMOS camera without using active illumination, the collection of ultraviolet radiation energy can effectively measure the temperature accurately and eliminates the interference of the external ambient light. By fully taking advantage of UV radiation in temperature measurement, and UV-DIC technique, temperature and deformation fields can be obtained simultaneously especially at ultra-high temperature. Thus, the efficiency of the proposed system in providing rich experimental data is evident. These advantages are demonstrated by measuring the temperature of Mo up to and 1835 K and simultaneous measurement of temperature deformation of IC21 up to 1473 K. The results showed the validity and great potential of the proposed technique in characterizing temperature and deformation response of structural materials for aerospace applications.
Author Contributions
All authors have read and agreed to the published version of the manuscript. Conceptualization, Y.D. and Y.P.; methodology, Y.S.; software, Y.D.; validation, Y.D. and Y.S.; formal analysis, J.Z. and X.L.; investigation, J.Z. and X.L.; resources, Y.D., Y.P. and Y.S.; data curation, J.Z. and X.L.; writing-original draft preparation, J.Z.; writing-review and editing, Y.D. and Y.S.; visualization, J.Z.; supervision, Y.D. and Y.S.; project administration, Y.D. and Y.P.; Funding acquisition, Y.D., Y.S. and Y.P.
Funding
This work is supported by the National Natural Science Foundation of China (Grant nos. 11632010 and 041301129). National Science and Technology Major Project (2017-VI-0012-0084) and National Science and Technology Major Project (2017-VI-0011-0083).
Institutional Review Board Statement
Not applicable.
Informed Consent Statement
Not applicable.
Data Availability Statement
Not applicable.
Conflicts of Interest
The authors declare no conflict of interest.
References
- Velay, V.; Bernhart, G.; Delagnes, D.; Penazzi, L. A continuum damage model applied to high-temperature fatigue lifetime prediction of a martensitic tool steel. Fatigue Fract. Eng. Mater. Struct. 2005, 28, 1009–1023. [Google Scholar] [CrossRef]
- Suo, T.; Fan, X.; Hu, G.; Li, Y.; Tang, Z.; Xue, P. Compressive behavior of C/SiC composites over a wide range of strain rates and temperatures. Carbon 2013, 62, 481–492. [Google Scholar] [CrossRef]
- Naslain, R.; Guette, A.; Rebillat, F.; Pailler, R.; Langlais, F.; Bourrat, X. Boron-bearing species in ceramic matrix composites for long-term aerospace applications. J. Solid State Chem. 2004, 177, 449–456. [Google Scholar] [CrossRef]
- Yuan, W.; Wang, J.; Song, H.; Huang, C. Full-field deformation and temperature measurement for CW laser irradiated structures. Opt. Lasers Eng. 2018, 110, 244–252. [Google Scholar] [CrossRef]
- Baldwin, B.; Sheaffer, Y. Ablation and breakup of large meteoroids during atmospheric entry. J. Geophys. Res. 1971, 76, 4653–4668. [Google Scholar] [CrossRef]
- Wu, D.F.; Pan, B.; Gao, Z.T.; Mu, M.; Zhu, L.; Wang, Y.W. On the experimental simulation of ultra-high temperature, high heat flux and nonlinear aerodynamic heating environment and thermos- mechanical testing technique. J. Exp. Mech. 2012, 27, 255–271. [Google Scholar]
- Goldrein, H.T.; E, P.J.R.; Palmer, S.J.P.; Field, J.E. Construction of a high-resolution moiré interferometer for investigating microstructural displacement fields in materials. Philos. Trans. R. Soc. Lond. A 2002, 360, 939–952. [Google Scholar] [CrossRef]
- Løkberg, O.J.; Malmo, J.T.; Slettemoen, G.Å. Interferometric measurements of high temperature objects by electronic speckle pattern interferometry. Appl. Opt. 1985, 24, 3167–3172. [Google Scholar] [CrossRef] [PubMed]
- Völkl, R.; Fischer, B.; Beschliesser, M.; Glatzel, U. Evaluating strength at ultra-high temperatures—Methods and results. Mater. Sci. Eng. A 2008, 483-484, 587–589. [Google Scholar] [CrossRef]
- Brillaud, J.; Lagattu, F. Limits and possibilities of laser speckle and white-light image-correlation methods: Theory and experiments. Appl. Opt. 2002, 41, 6603–6613. [Google Scholar] [CrossRef]
- Peters, W.H.; Ranson, W.F. Digital imaging techniques in experimental stress analysis. Opt. Eng. 1982, 21, 213427. [Google Scholar] [CrossRef]
- Chu, T.C.; Ranson, W.F.; Sutton, M.A. Applications of digital-image-correlation techniques to experimental mechanics. Exp. Mech. 1985, 25, 232–244. [Google Scholar] [CrossRef]
- Sutton, M.; Mingqi, C.; Peters, W.; Chao, Y.; McNeill, S. Application of an optimized digital correlation method to planar deformation analysis. Image Vis. Comput. 1986, 4, 143–150. [Google Scholar] [CrossRef]
- Peters, W.H.; Ranson, W.F.; Sutton, M.A.; Chu, T.C.; Anderson, J. Application of digital correlation methods to rigid body mechanics. Opt. Eng. 1983, 22, 226738. [Google Scholar] [CrossRef]
- Saai, A.; Louche, H.; Tabourot, L.; Chang, H. Experimental and numerical study of the thermo-mechanical behavior of Al bi-crystal in tension using full field measurements and micromechanical modeling. Mech. Mater. 2010, 42, 275–292. [Google Scholar] [CrossRef]
- Cholewa, N.; Summers, P.T.; Feih, S.; Mouritz, A.P.; Lattimer, B.Y.; Case, S.W. A technique for coupled thermomechanical response measurement using infrared thermography and digital image correlation (TDIC). Exp. Mech. 2015, 56, 145–164. [Google Scholar] [CrossRef]
- Bodelot, L.; Charkaluk, E.; Sabatier, L.; Dufrénoy, P. Experimental study of heterogeneities in strain and temperature fields at the microstructural level of polycrystalline metals through fully-coupled full-field measurements by Digital Image Correlation and Infrared Thermography. Mech. Mater. 2011, 43, 654–670. [Google Scholar] [CrossRef]
- Orteu, J.-J.; Rotrou, Y.; Sentenac, T.; Robert, L. An innovative method for 3-d shape, strain and temperature full-field measurement using a single type of camera: Principle and preliminary results. Exp. Mech. 2008, 48, 163–179. [Google Scholar] [CrossRef][Green Version]
- Su, H.; Fang, X.; Qu, Z.; Zhang, C.; Yan, B.; Feng, X. Synchronous Full-Field Measurement of Temperature and Deformation of C/SiC Composite Subjected to Flame Heating at High Temperature. Exp. Mech. 2015, 56, 659–671. [Google Scholar] [CrossRef]
- Tang, Y.; Yue, M.; Fang, X.; Feng, X. Synchronous full-field measurement of temperature and deformation based on separated radiation and reflected light. Opt. Lasers Eng. 2019, 116, 94–102. [Google Scholar] [CrossRef]
- Dong, Y.; Hideki, K.; Yutaka, K. Optical system for microscopic observation and strain measurement at high temperature. Meas. Sci. Technol. 2014, 25, 025002. [Google Scholar] [CrossRef]
- Dong, Y. In-situ evaluation of C/SiC composites via an ultraviolet imaging system and microstructure based digital image correlation. Nondestruct. Test. Eval. 2018, 33, 427–437. [Google Scholar] [CrossRef]
- Dong, Y.; Pan, B. In-situ 3D shape and recession measurements of ablative materials in an arc-heated wind tunnel by UV stereo-digital image correlation. Opt. Lasers Eng. 2019, 116, 75–81. [Google Scholar] [CrossRef]
- Dong, Y.; Zhao, J.; Pan, B. Ultraviolet 3D digital image correlation applied for deformation measurement in thermal testing with infrared quartz lamps. Chin. J. Aeronaut. 2020, 33, 1085–1092. [Google Scholar] [CrossRef]
- Arai, Y.; Sato, M.; Kagawa, Y. Melting/Solidification of Si Bond Coat Layer in Oxide/Si/RB-SiC Environmental Barrier Coating System. Adv. Eng. Mater. 2018, 20, 1800677. [Google Scholar] [CrossRef]
- Inoue, R.; Arai, Y.; Kakisawa, H. In situ observation and strain distribution measurements of atmospheric plasma-sprayed mullite and Si multilayered coatings on SiC substrates. J. Mater. Sci. 2019, 54, 2824–2835. [Google Scholar] [CrossRef]
- Berke, R.B.; Lambros, J. Ultraviolet digital image correlation (UV-DIC) for high temperature applications. Rev. Sci. Instrum. 2014, 85, 045121. [Google Scholar] [CrossRef]
- Tang, Y.; Zhang, J.; Yue, M.; Zhu, X.; Fang, X.; Feng, X. High-frequency flashing of light source for synchronous measurement of temperature and deformation at elevated temperature. Opt. Lasers Eng. 2021, 137, 106361. [Google Scholar] [CrossRef]
- Dreyfus, M.G. Spectral Variation of Blackbody Radiation. Appl. Opt. 1963, 2, 1113–1115. [Google Scholar] [CrossRef]
- Herve, P.; Morel, A. Thermography improvements using ultraviolet pyrometry. Proc. Quantità Infrared Thermo 1996, 26–31. [Google Scholar]
- Ohji, T.; Yoshioka, N.; Shiwaku, T.; Okubo, A. Temperature measurement by UV thermal radiation. Weld. Int. 1995, 9, 185–190. [Google Scholar] [CrossRef]
- Miyasaka, F.; Ohji, T.; Fujii, Y. Temperature Measurement by UV Thermal Radiation. International Measurement Confederation XVI IMEKO World Congress (IMEKO 2000) Vol. 6, 25–28 September 2000, Vienna, Austria. Available online: http://home.mit.bme.hu/~kollar/IMEKO-procfiles-for-web/congresses/WC-16th-Wien-2000/Papers/Topic%2012/Miyasaka.PDF (accessed on 10 January 2021).
- Tsallis, C.; Barreto, F.C.S.; Loh, E.D. Generalization of the Planck radiation law and application to the cosmic microwave background radiation. Phys. Rev. E 1995, 52, 1447–1451. [Google Scholar] [CrossRef] [PubMed]
- Grant, B.M.B.; Stone, H.J.; Withers, P.; Preuss, M. High-temperature strain field measurement using digital image correlation. J. Strain Anal. Eng. Des. 2009, 44, 263–271. [Google Scholar] [CrossRef]
- DeWitt, D.P.; Nutter, G.D. Theory and Practice of Radiation Thermometry; John Wiley and Sons: New York, NY, USA, 1988. [Google Scholar]
- Xu, Z.; Zhao, H. A thermal infrared temperature and emissivity inversion algorithm based on correction of Wien Approximatin. Acta Opt. Sin. 2009, 29, 394–399. [Google Scholar]
- Herve, P.; Cedelle, J.; Negreanu, I. Infrared technique for simultaneous determination of temperature and emissivity. Infrared Phys. Technol. 2012, 55, 1–10. [Google Scholar] [CrossRef]
- Hervé, P.; Sadou, A. Determination of the complex index of refractory metals at high temperatures: Application to the determination of thermo-optical properties. Infrared Phys. Technol. 2008, 51, 249–255. [Google Scholar] [CrossRef]
- Rusin, S.P. Determination of true temperature of opaque matter based on its thermal radiation spectrum: Using relative emissivity and the Wien displacement law. J. Phys. Conf. Ser. 2015, 653, 012102. [Google Scholar] [CrossRef]
- Rani, A.; Singh, Y.P. Comparison of Transfer Standard Industrial Lamps against PTB-assigned Radiance Temperature of Vacuum and Gas Filled Tungsten Strip Lamps. M-APAN-J. Metrol. Soc. India 2013, 28, 129–140. [Google Scholar] [CrossRef]
- Coffey, V.C. Machine Vision: The Eyes of Industry 40. Opt. Photon News 2018, 29, 42–49. [Google Scholar] [CrossRef]
- Shang, Y.; Zhang, H.; Hou, H.; Ru, Y.; Pei, Y.; Li, S.; Gong, S.; Xu, H. High temperature tensile behavior of a thin-walled Ni based single-crystal superalloy with cooling hole: In-situ experiment and finite element calculation. J. Alloy. Compd. 2019, 782, 619–631. [Google Scholar] [CrossRef]
- Dong, Y.; Pan, B. A review of speckle pattern fabrication and assessment for digital image correlation. Exp. Mech. 2017, 57, 1161–1181. [Google Scholar] [CrossRef]
- Dong, Y.; Kakisawa, H.; Kagawa, Y. Development of microscale pattern for digital image correlation up to 1400 °C. Opt. Lasers Eng. 2015, 68, 7–15. [Google Scholar] [CrossRef]
- Dong, Y.L.; Zhang, Z.; Pan, B. High-throughput, high-accuracy determination of coefficient of thermal expansion of carbon fibre-epoxy composites using digital image correlation. Strain 2017, 54, e12259. [Google Scholar] [CrossRef]
- Hild, F.; Raka, B.; Baudequin, M.; Roux, S.; Cantelaube, F.; Hild, F. Multiscale displacement field measurements of compressed mineral-wool samples by digital image correlation. Appl. Opt. 2002, 41, 6815–6828. [Google Scholar] [CrossRef] [PubMed]
- Pan, B.; Xie, H.; Wang, Z. Equivalence of digital image correlation criteria for pattern matching. Appl. Opt. 2010, 49, 5501–5509. [Google Scholar] [CrossRef] [PubMed]


Publisher’s Note: MDPI stays neutral with regard to jurisdictional claims in published maps and institutional affiliations. |
© 2021 by the authors. Licensee MDPI, Basel, Switzerland. This article is an open access article distributed under the terms and conditions of the Creative Commons Attribution (CC BY) license (https://creativecommons.org/licenses/by/4.0/).