
Tire/Road Rolling Resistance Modeling: Discussing the Surface Macrotexture Effect


Abstract
:1. Introduction
2. Modeling
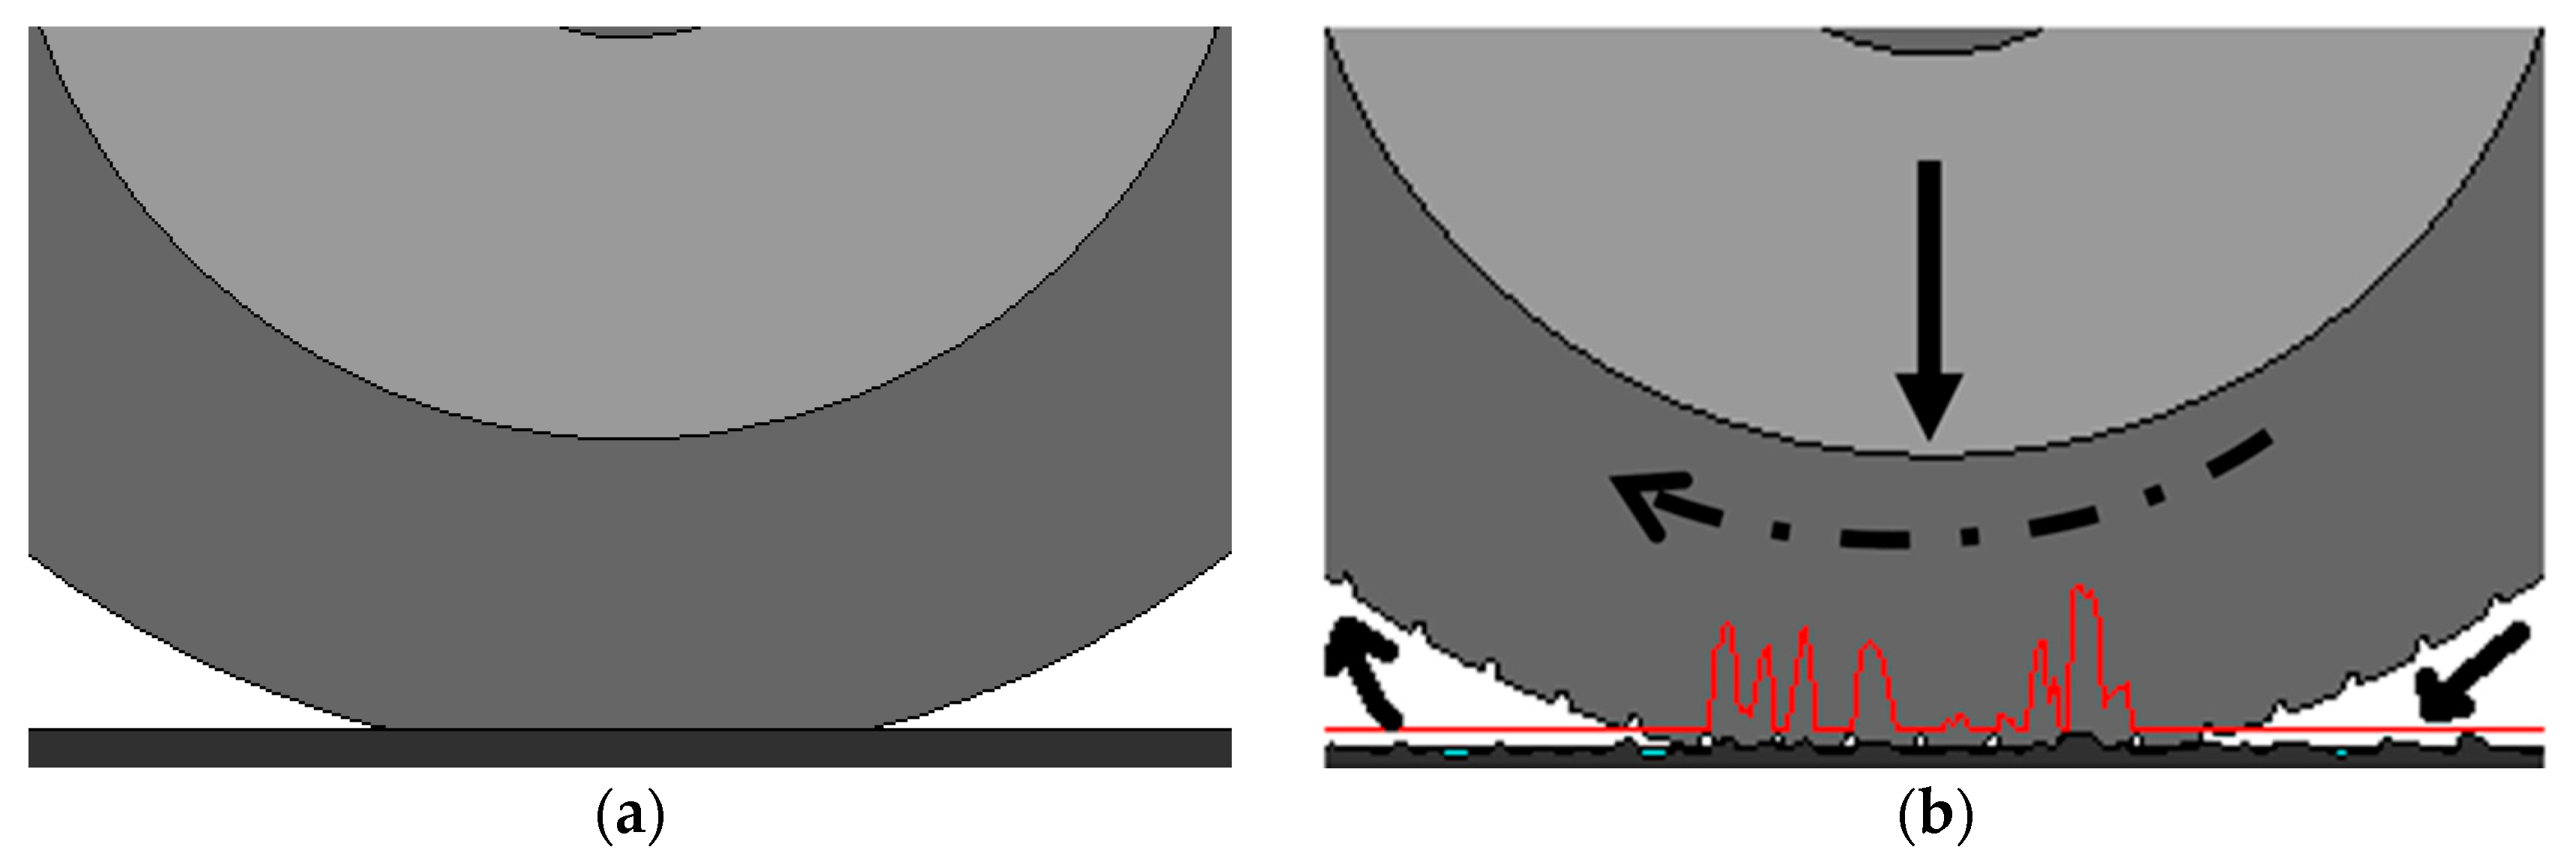
2.1. From DFM to RRM: Adaptation of the Dynamic Friction Model to the Modeling of Rolling Resistance
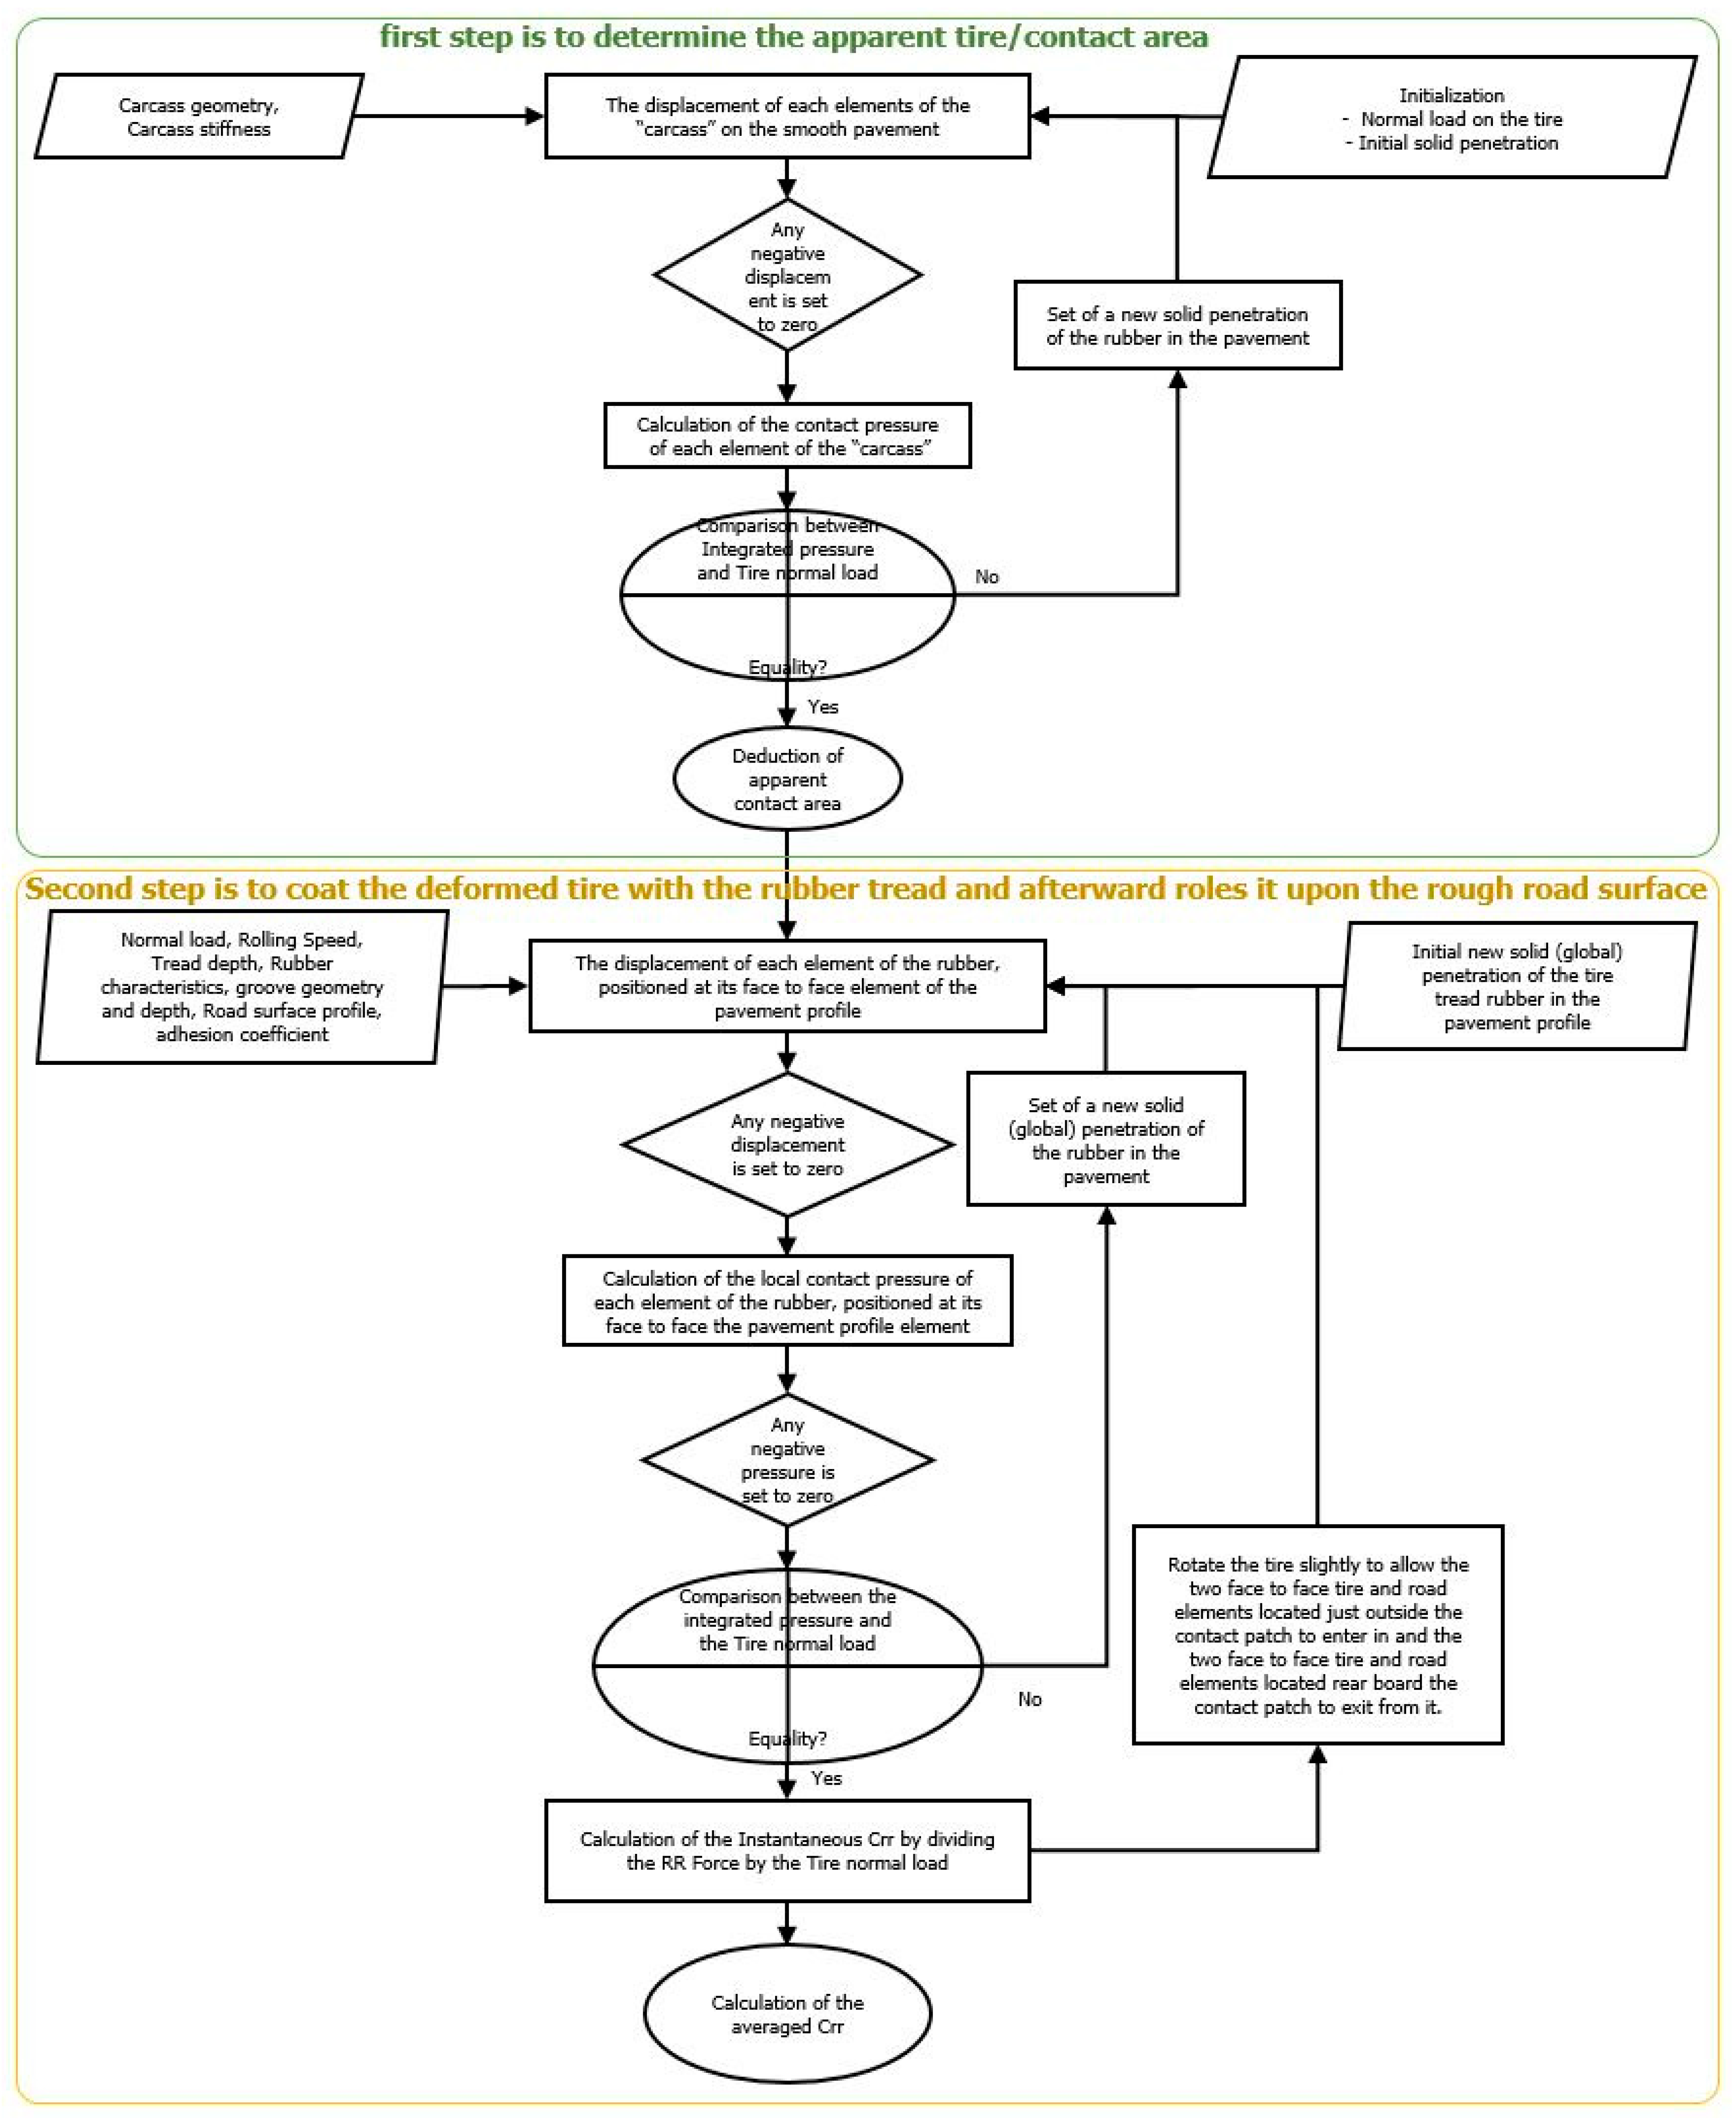
2.2. Two Steps Calculation
2.3. Calculating the Rolling Resistance Coefficient (Crr)
2.4. Calculation Algorithm
3. Experiments
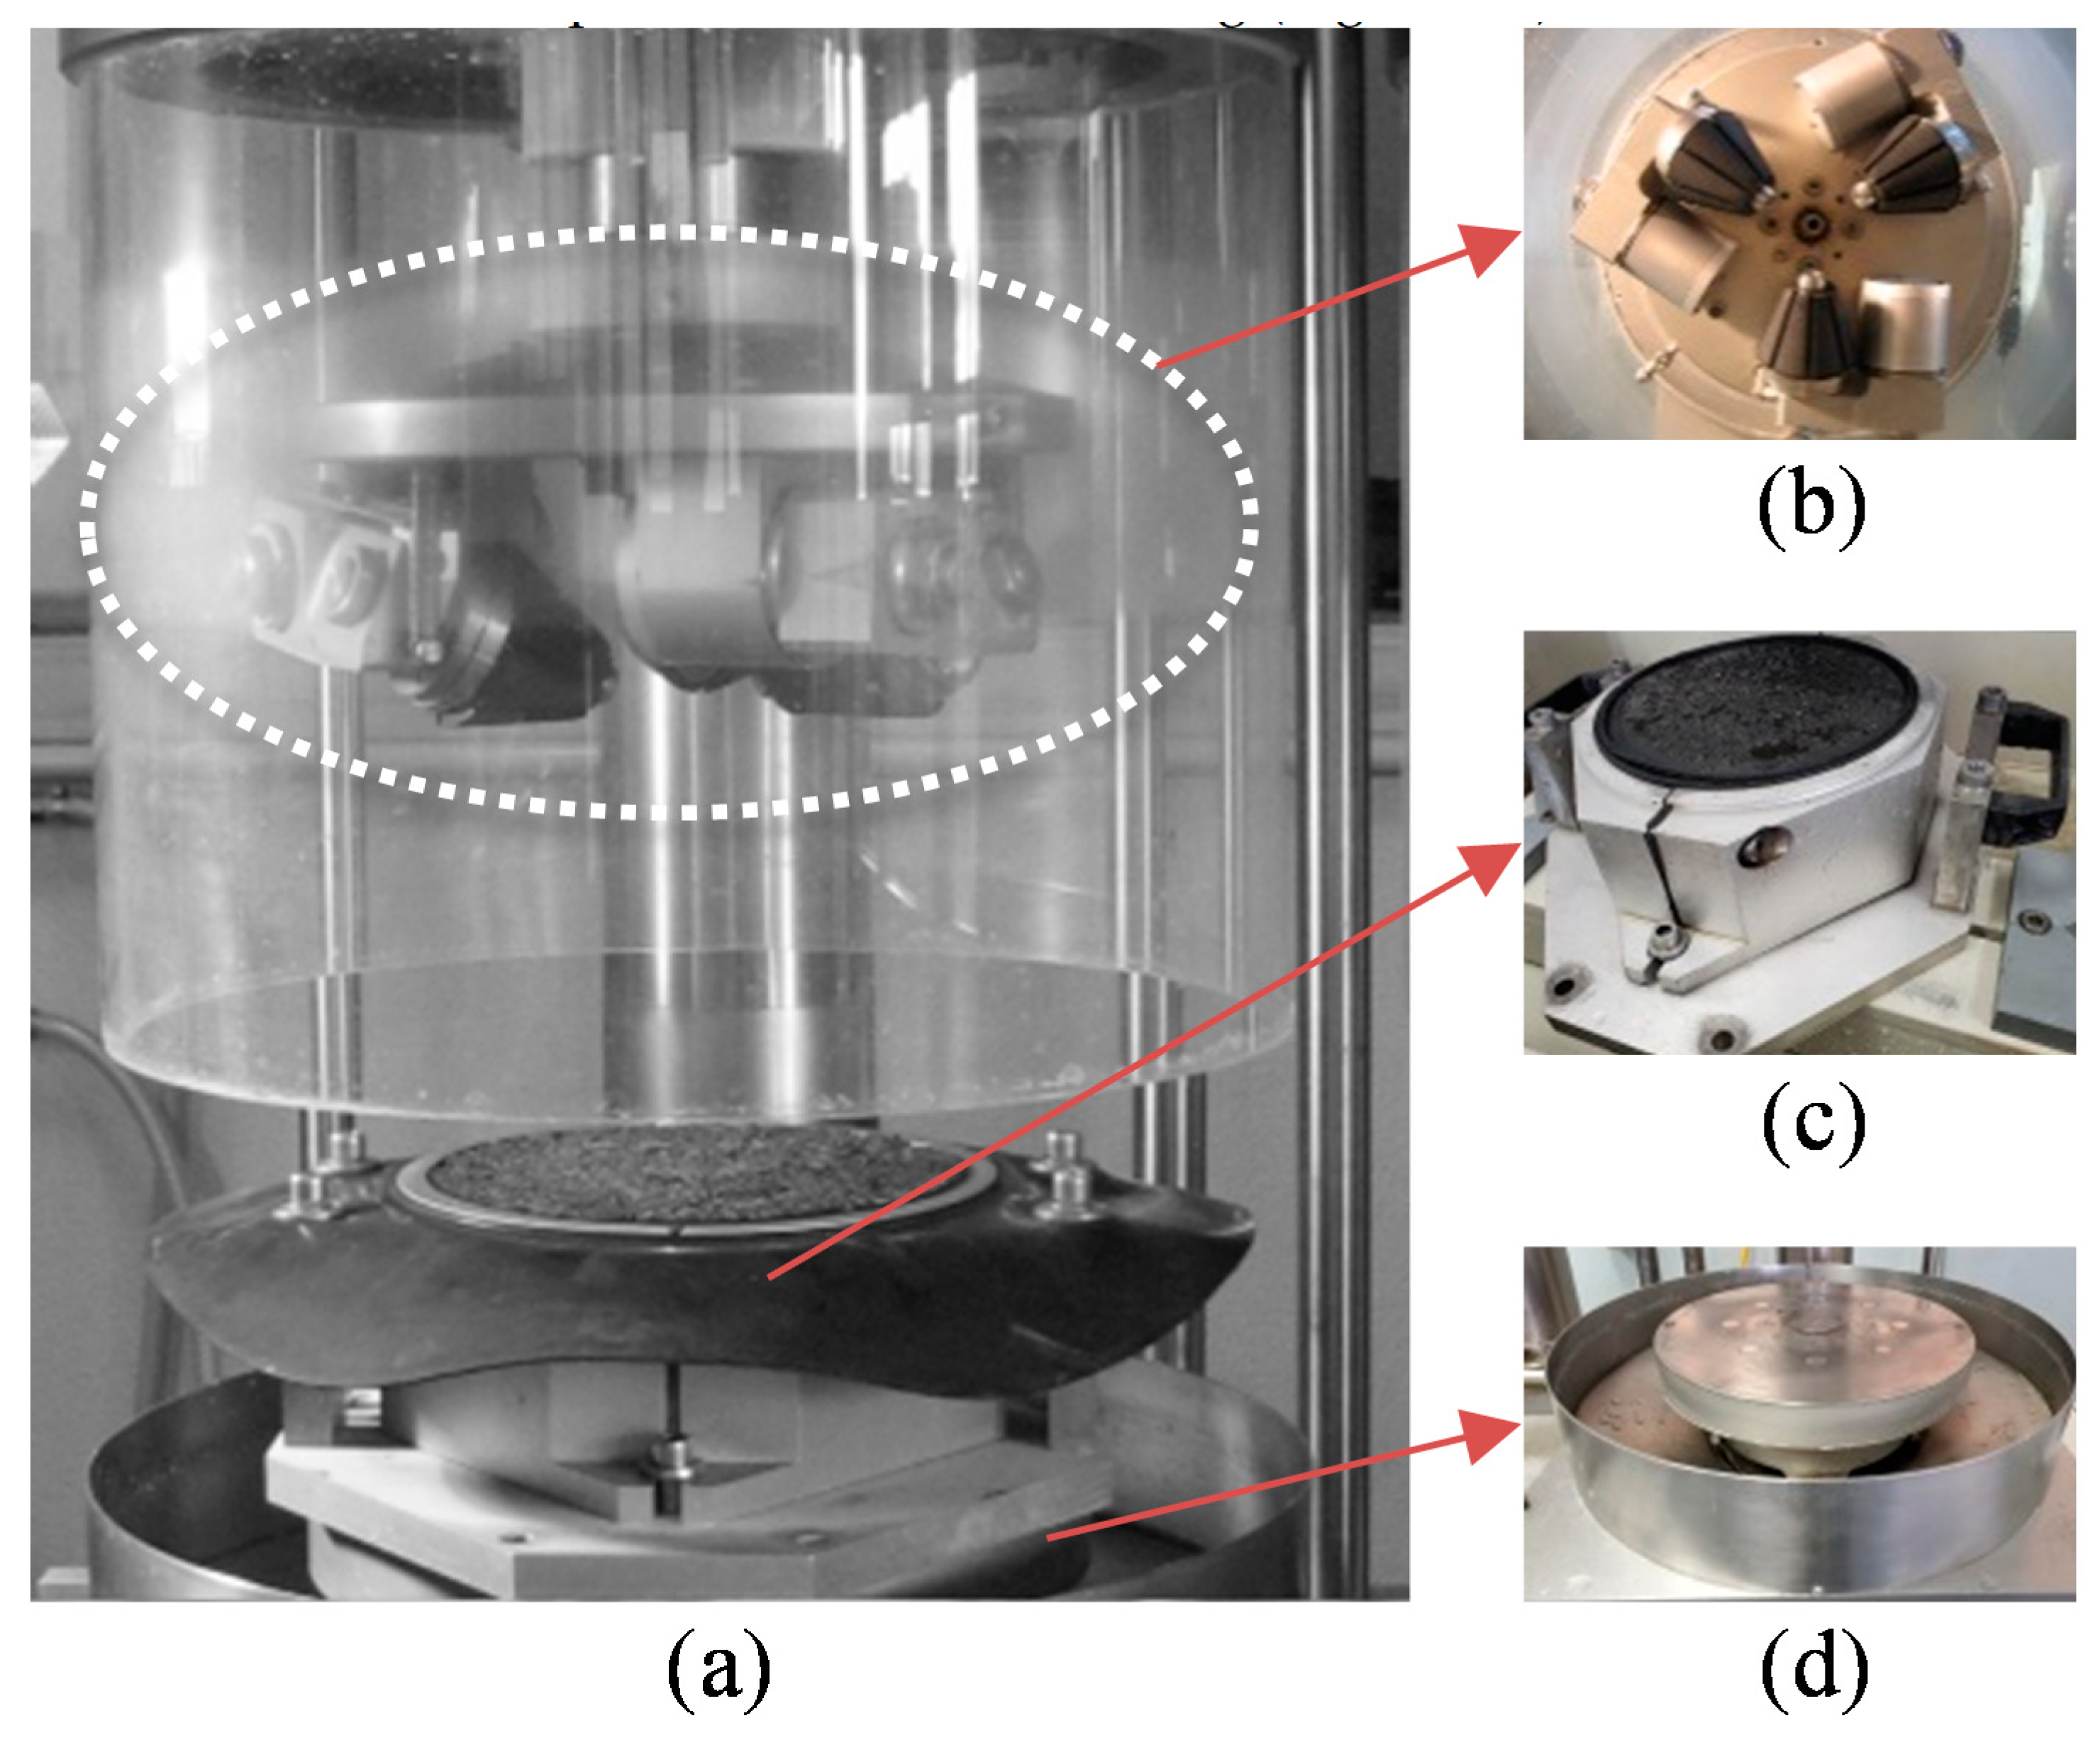
3.1. Measuring the Rolling Resistance Coefficient
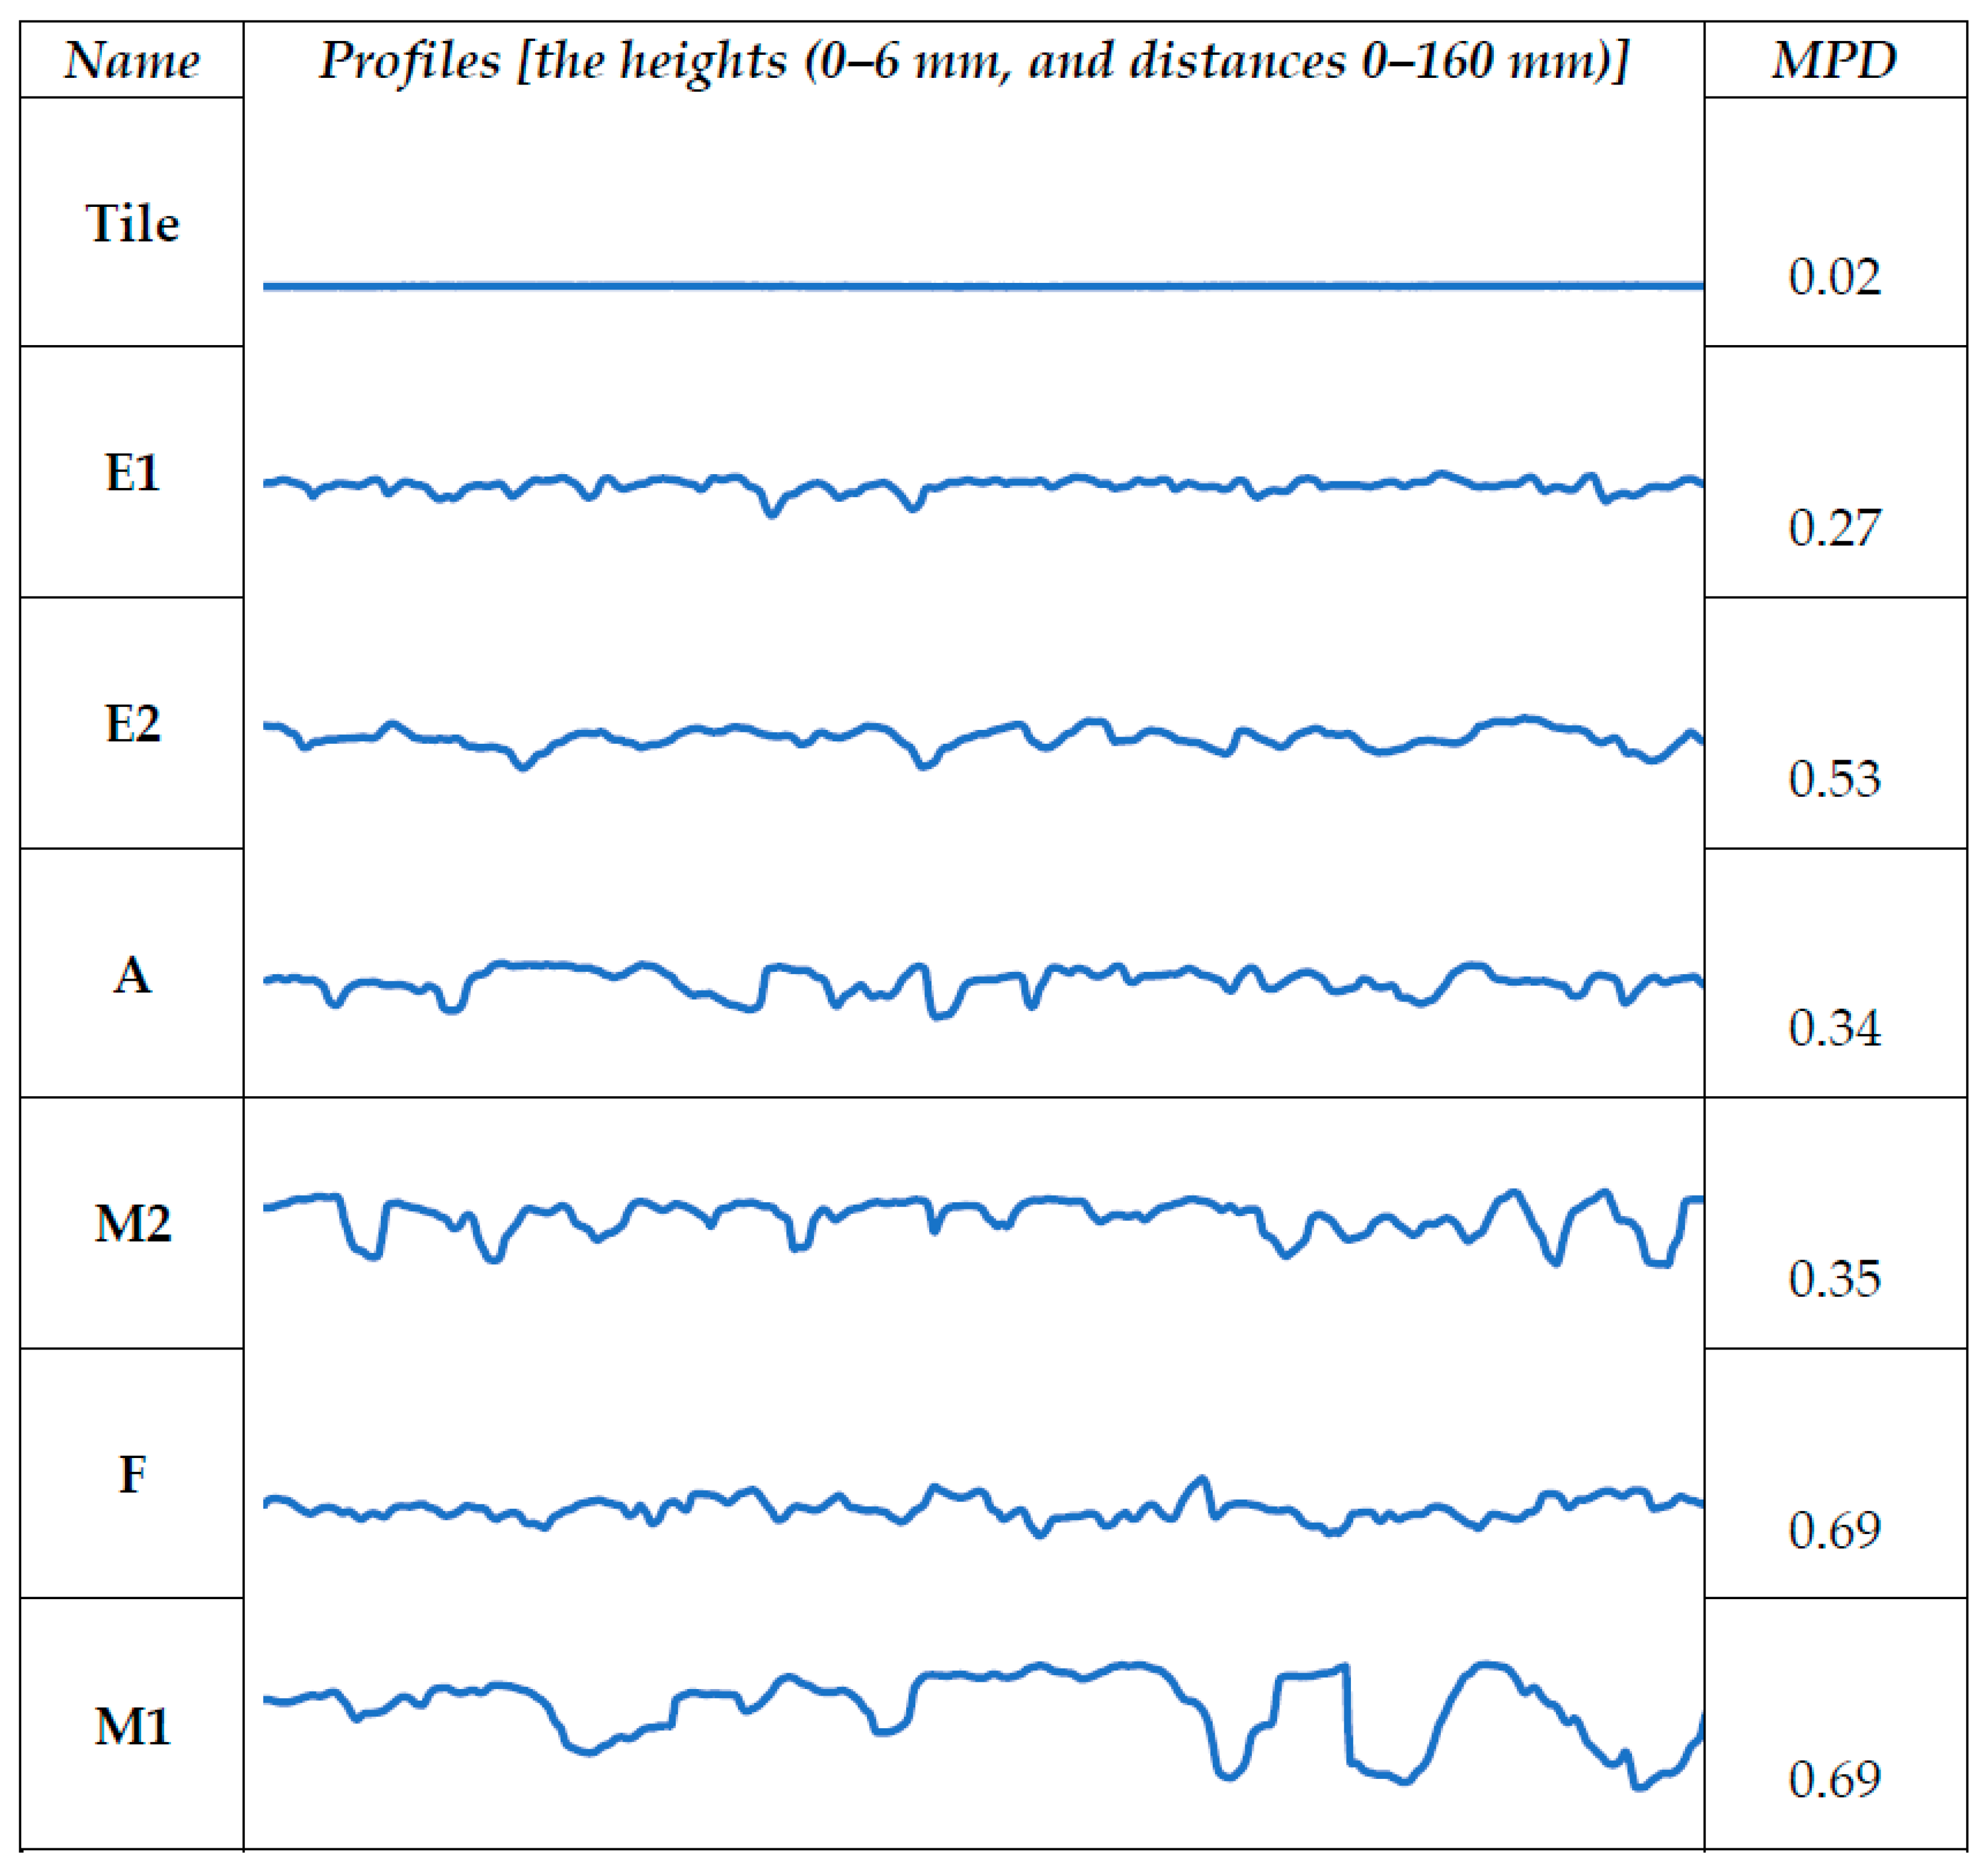
3.2. Tested Surfaces
4. Results
5. Discussion
6. Conclusions
Author Contributions
Funding
Institutional Review Board Statement
Informed Consent Statement
Data Availability Statement
Conflicts of Interest
References
- Chen, Y.; Ardila-Gomez, A.; Frame, G. Achieving Energy Savings by Intelligent Transportation Systems Investments in the Context of Smart Cities; World Bank: Washington, DC, USA, 2016. [Google Scholar] [CrossRef]
- Huo, H.; He, K.; Wang, M.; Yao, Z. Vehicle technologies, fuel-economy policies, and fuel-consumption rates of Chinese vehicles. Energy Policy 2012, 43, 30–36. [Google Scholar] [CrossRef]
- Global.yokohamatire.net. Rolling Resistance and Fuel Consumption | TIRE CARE & SAFETY | THE YOKOHAMA RUBBER CO., LTD. 2014. Available online: https://www.y-yokohama.com/global/product/tire/learn/care_safety/rolling_resistance/ (accessed on 2 May 2021).
- Guillou, M.; Bradley, C. Fuel Consumption Testing to Verify the Effect of Tire Rolling Resistance on Fuel Economy; Technical Paper 2010-01-0763; SAE International: Warrendale, PA, USA, 2010. [Google Scholar] [CrossRef]
- Aldhufairi, H.S.; Olatunbosun, O.A. Developments in tyre design for lower rolling resistance: A state of the art review. Proc. Inst. Mech. Eng. Part D J. Automob. Eng. 2017, 232, 1685–1882. [Google Scholar] [CrossRef]
- Chupin, O.; Piau, J.M.; Chabot, A. Evaluation of the structure-induced rolling resistance (SRR) for pavements including viscoelastic material layers. Mater. Struct. 2013, 46, 683–696. [Google Scholar] [CrossRef]
- Pettinari, M.; Lund-Jensen, B.B.; Schmidt, B. Low Rolling Resistance Pavements in Denmark. In Proceedings of the 6th Eurasphalt and Eurobitume Congress, Prague, Czech Republic, 1–3 June 2016. [Google Scholar] [CrossRef]
- Sandberg, U.; Haider, M.; Conter, M.; Goubert, L.; Bergiers, A.; Glaeser, K.; Schwalbe, G.; Zöller, M.; Boujard, O.; Hammarström, U.; et al. Rolling Resistance—Basic Information and State-of-the-Art on Measurement Methods; SP 1. Measurement Methods Source Models; Swedish National Road and Transport Research Institute: Linköping, Sweden, 2011; p. 102. [Google Scholar]
- Andersen, L.G.; Larsen, J.K.; Fraser, E.S.; Schmidt, B.; Dyre, J.C. Rolling resistance measurement and model development. J. Transp. Eng. 2015, 141, 04014075. [Google Scholar] [CrossRef]
- Ejsmont, J.; Owczarzak, W. Engineering method of tire rolling resistance evaluation. Measurement 2019, 145, 144–149. [Google Scholar] [CrossRef]
- Bergiers, A.; Goubert, L.; Anfosso-Lédée, F.; Dujardin, N. Comparison of Rolling Resistance Measuring Equipment. Technical Report for Pilot Study. 2011, p. 96. Available online: http://urn.kb.se/resolve?urn=urn:nbn:se:vti:diva-15697 (accessed on 2 May 2021).
- Roveri, N.; Pepe, G.; Carcaterra, A. OPTYRE—A new technology for tire monitoring: Evidence of contact patch phenomena. Mech. Syst. Signal Process. 2016, 66, 793–810. [Google Scholar] [CrossRef]
- Ejsmont, J.A.; Ronowski, G.; Świeczko-Żurek, B.; Sommer, S. Road texture influence on tyre rolling resistance. Road Mater. Pavement Des. 2017, 18, 181–198. [Google Scholar] [CrossRef]
- Nielsen, L.; Sandberg, T. A new model for rolling resistance of pneumatic tires. J. Passeng. Car Mech. Syst. J. 2002, 111, 1572–1579. [Google Scholar]
- Ai, J.; Chen, J.-F.; Rotter, J.M.; Ooi, J.Y. Assessment of rolling resistance models in discrete element simulations. Powder Technol. 2011, 206, 269–282. [Google Scholar] [CrossRef]
- Ebbott, T.G.; Hohman, R.L.; Jeusette, J.-P.; Kerchman, V. Tire temperature and rolling resistance prediction with finite element analysis. Tire Sci. Technol. 1999, 27, 2–21. [Google Scholar] [CrossRef]
- Clark, S. Geometric Effects on the Rolling Resistance of Pneumatic Tyres. In Tire Rolling Losses and Fuel Economy; Society of Automotive Engineers: Warrendale, PA, USA, 1977. [Google Scholar]
- Sidharth, B.M.R. Tyre Modelling for Rolling Resistance. Master’s Thesis, Chalmers University of Technology, Göteborg, Sweden, 2014. Available online: https://hdl.handle.net/20.500.12380/200040 (accessed on 2 May 2021).
- Kane, M.; Edmondson, V. Tire/road friction prediction: Introduction a simplified numerical tool based on contact modelling. Veh. Syst. Dyn. 2020, 1–20. [Google Scholar] [CrossRef]
- Kane, M.; Do, M.-T.; Cerezo, V.; Rado, Z.; Khelifi, C. Contribution to pavement friction modelling: An introduction of the wetting effect. Int. J. Pavement Eng. 2019, 20, 965–976. [Google Scholar] [CrossRef]
- Riahi, E.; Ropert, C.; Do, M.-T. Developing a laboratory test method for rolling resistance characterisation of road surface texture. Surf. Topogr. Metrol. Prop. 2020, 8, 024006. [Google Scholar] [CrossRef]


| Name | Description | MPD | Surface Texture |
|---|---|---|---|
| Tile | Smooth | 0.02 |  |
| E1 | Semi-coarse asphalt concrete | 0.27 | 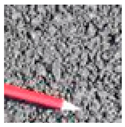 |
| E2 | Semi-coarse asphalt concrete | 0.53 |  |
| A | Porous asphalt concrete | 0.34 | 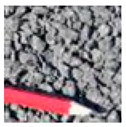 |
| M2 | Very thin asphalt concrete | 0.35 |  |
| F | Hight-friction dressing «COLGRIP©» | 0.69 | 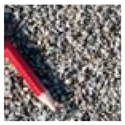 |
| M1 | Very thin asphalt concrete | 0.69 | 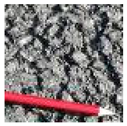 |
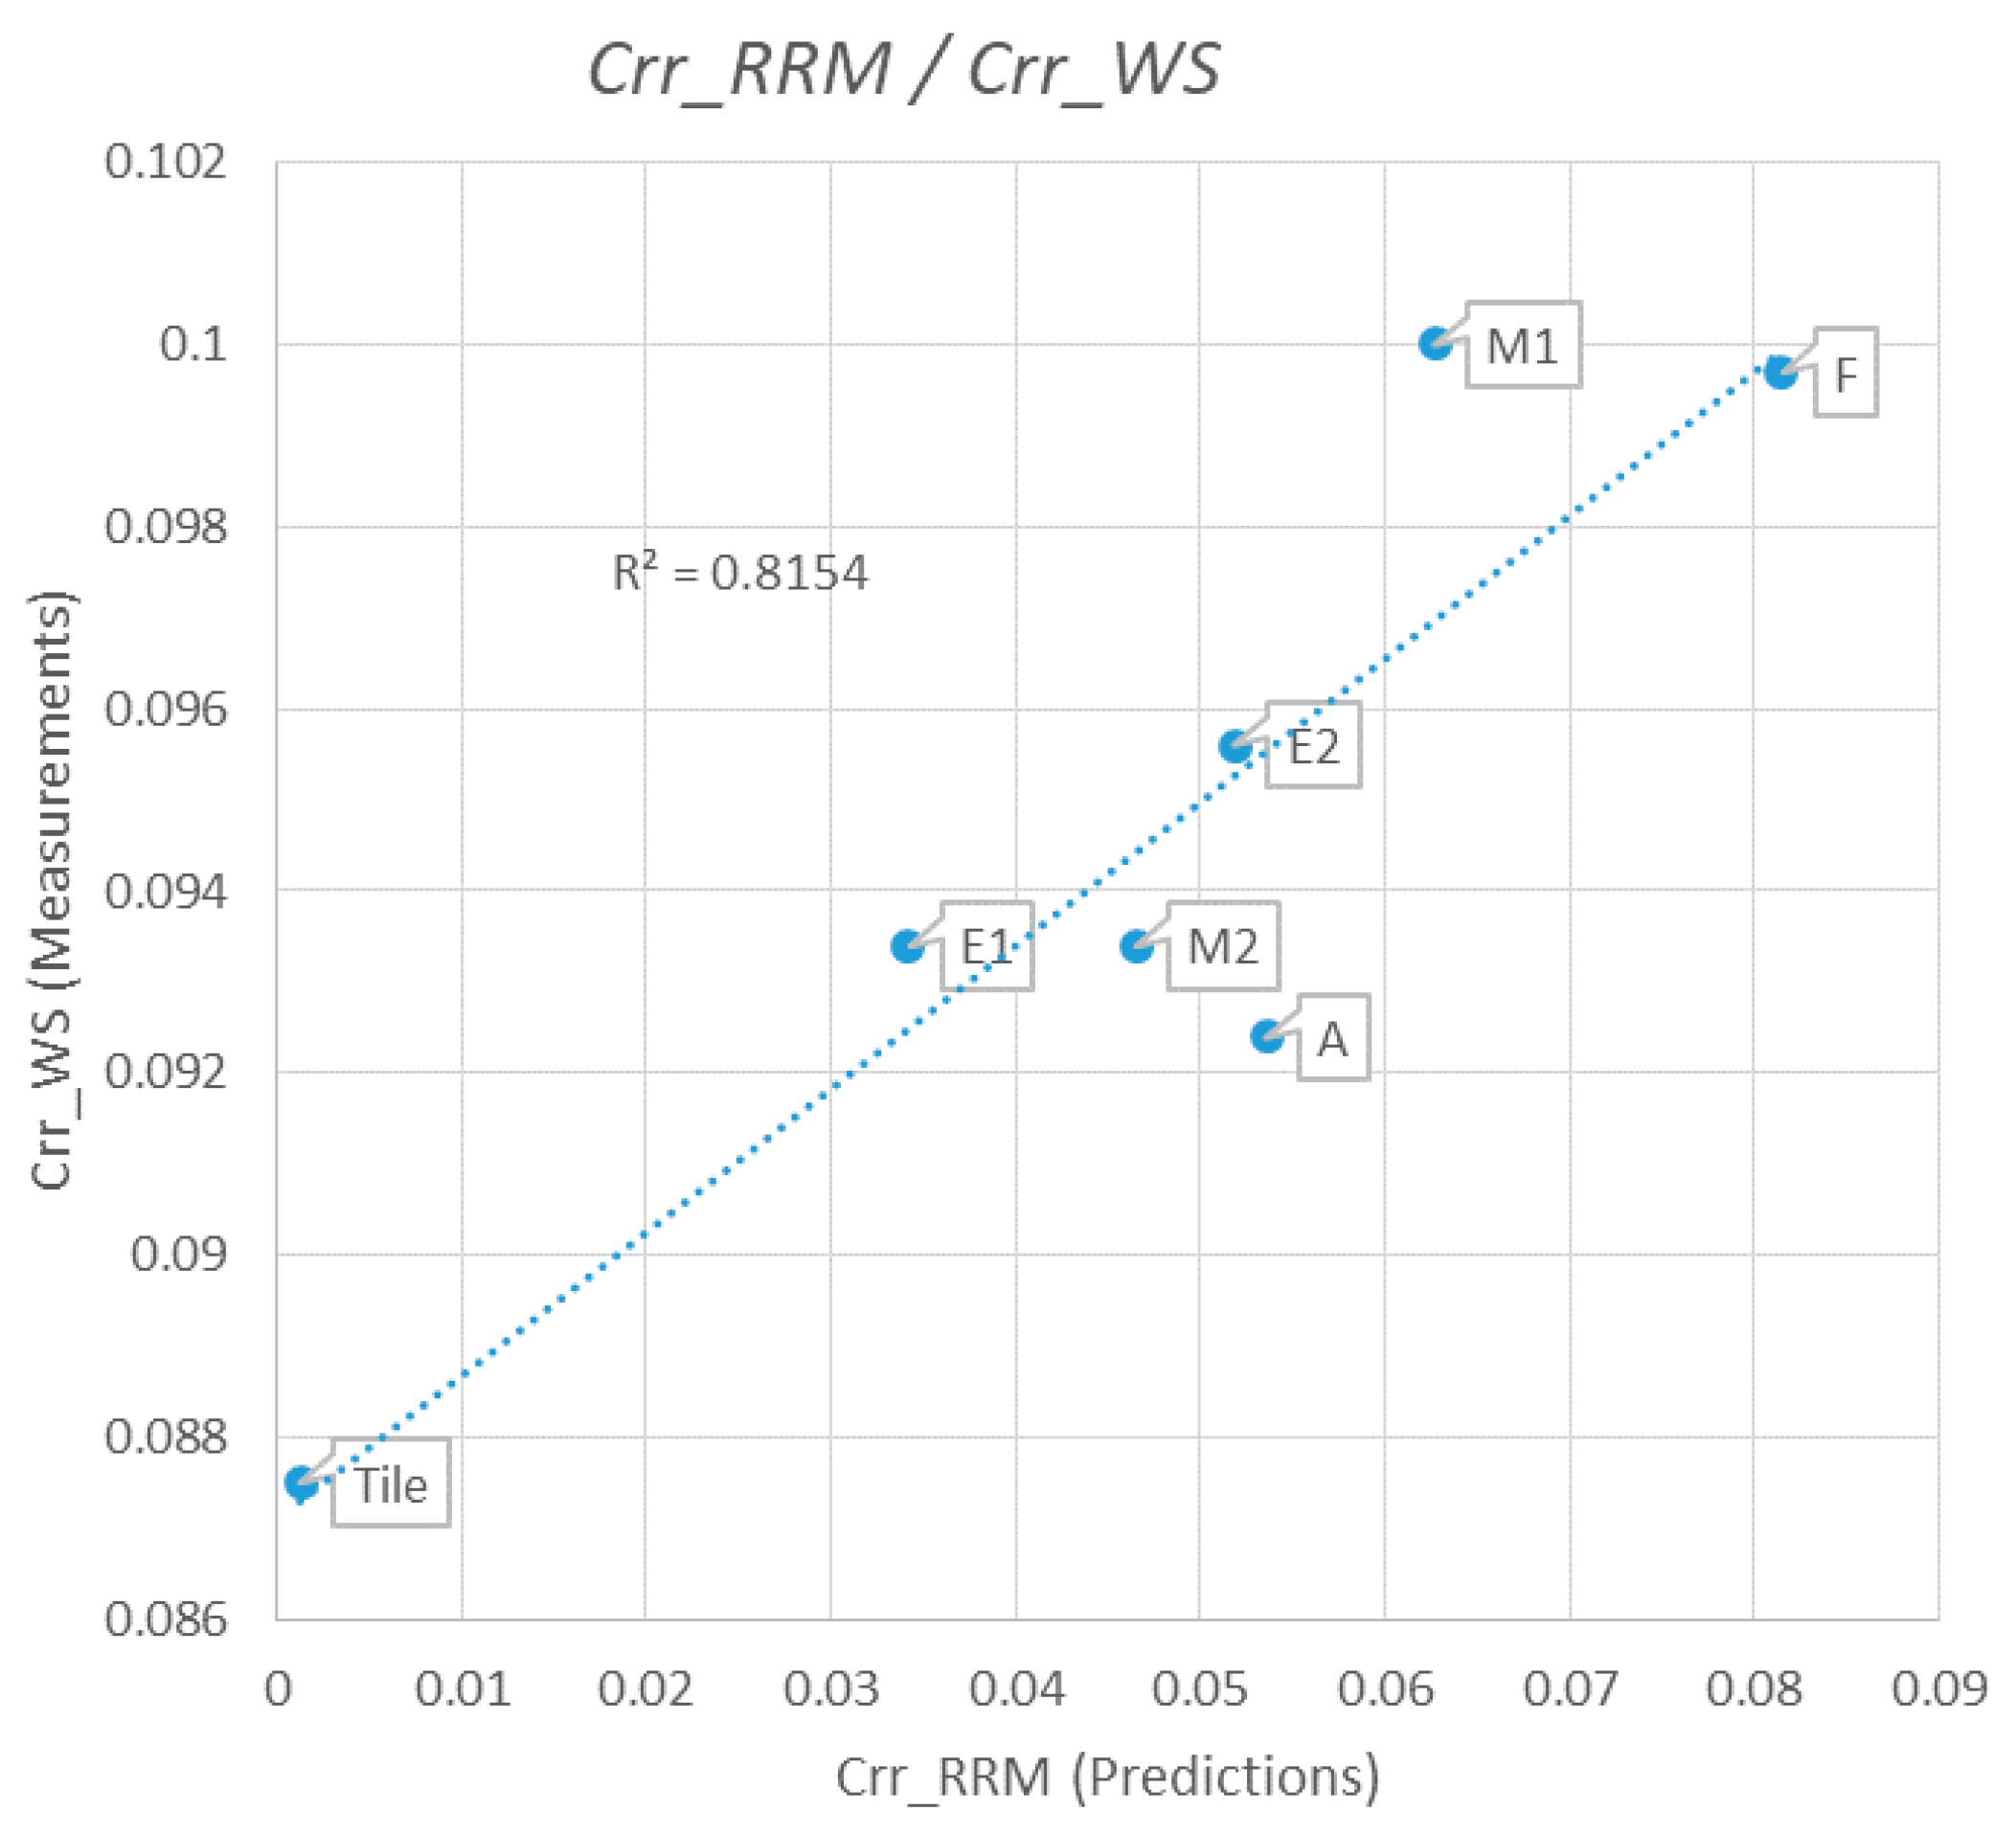
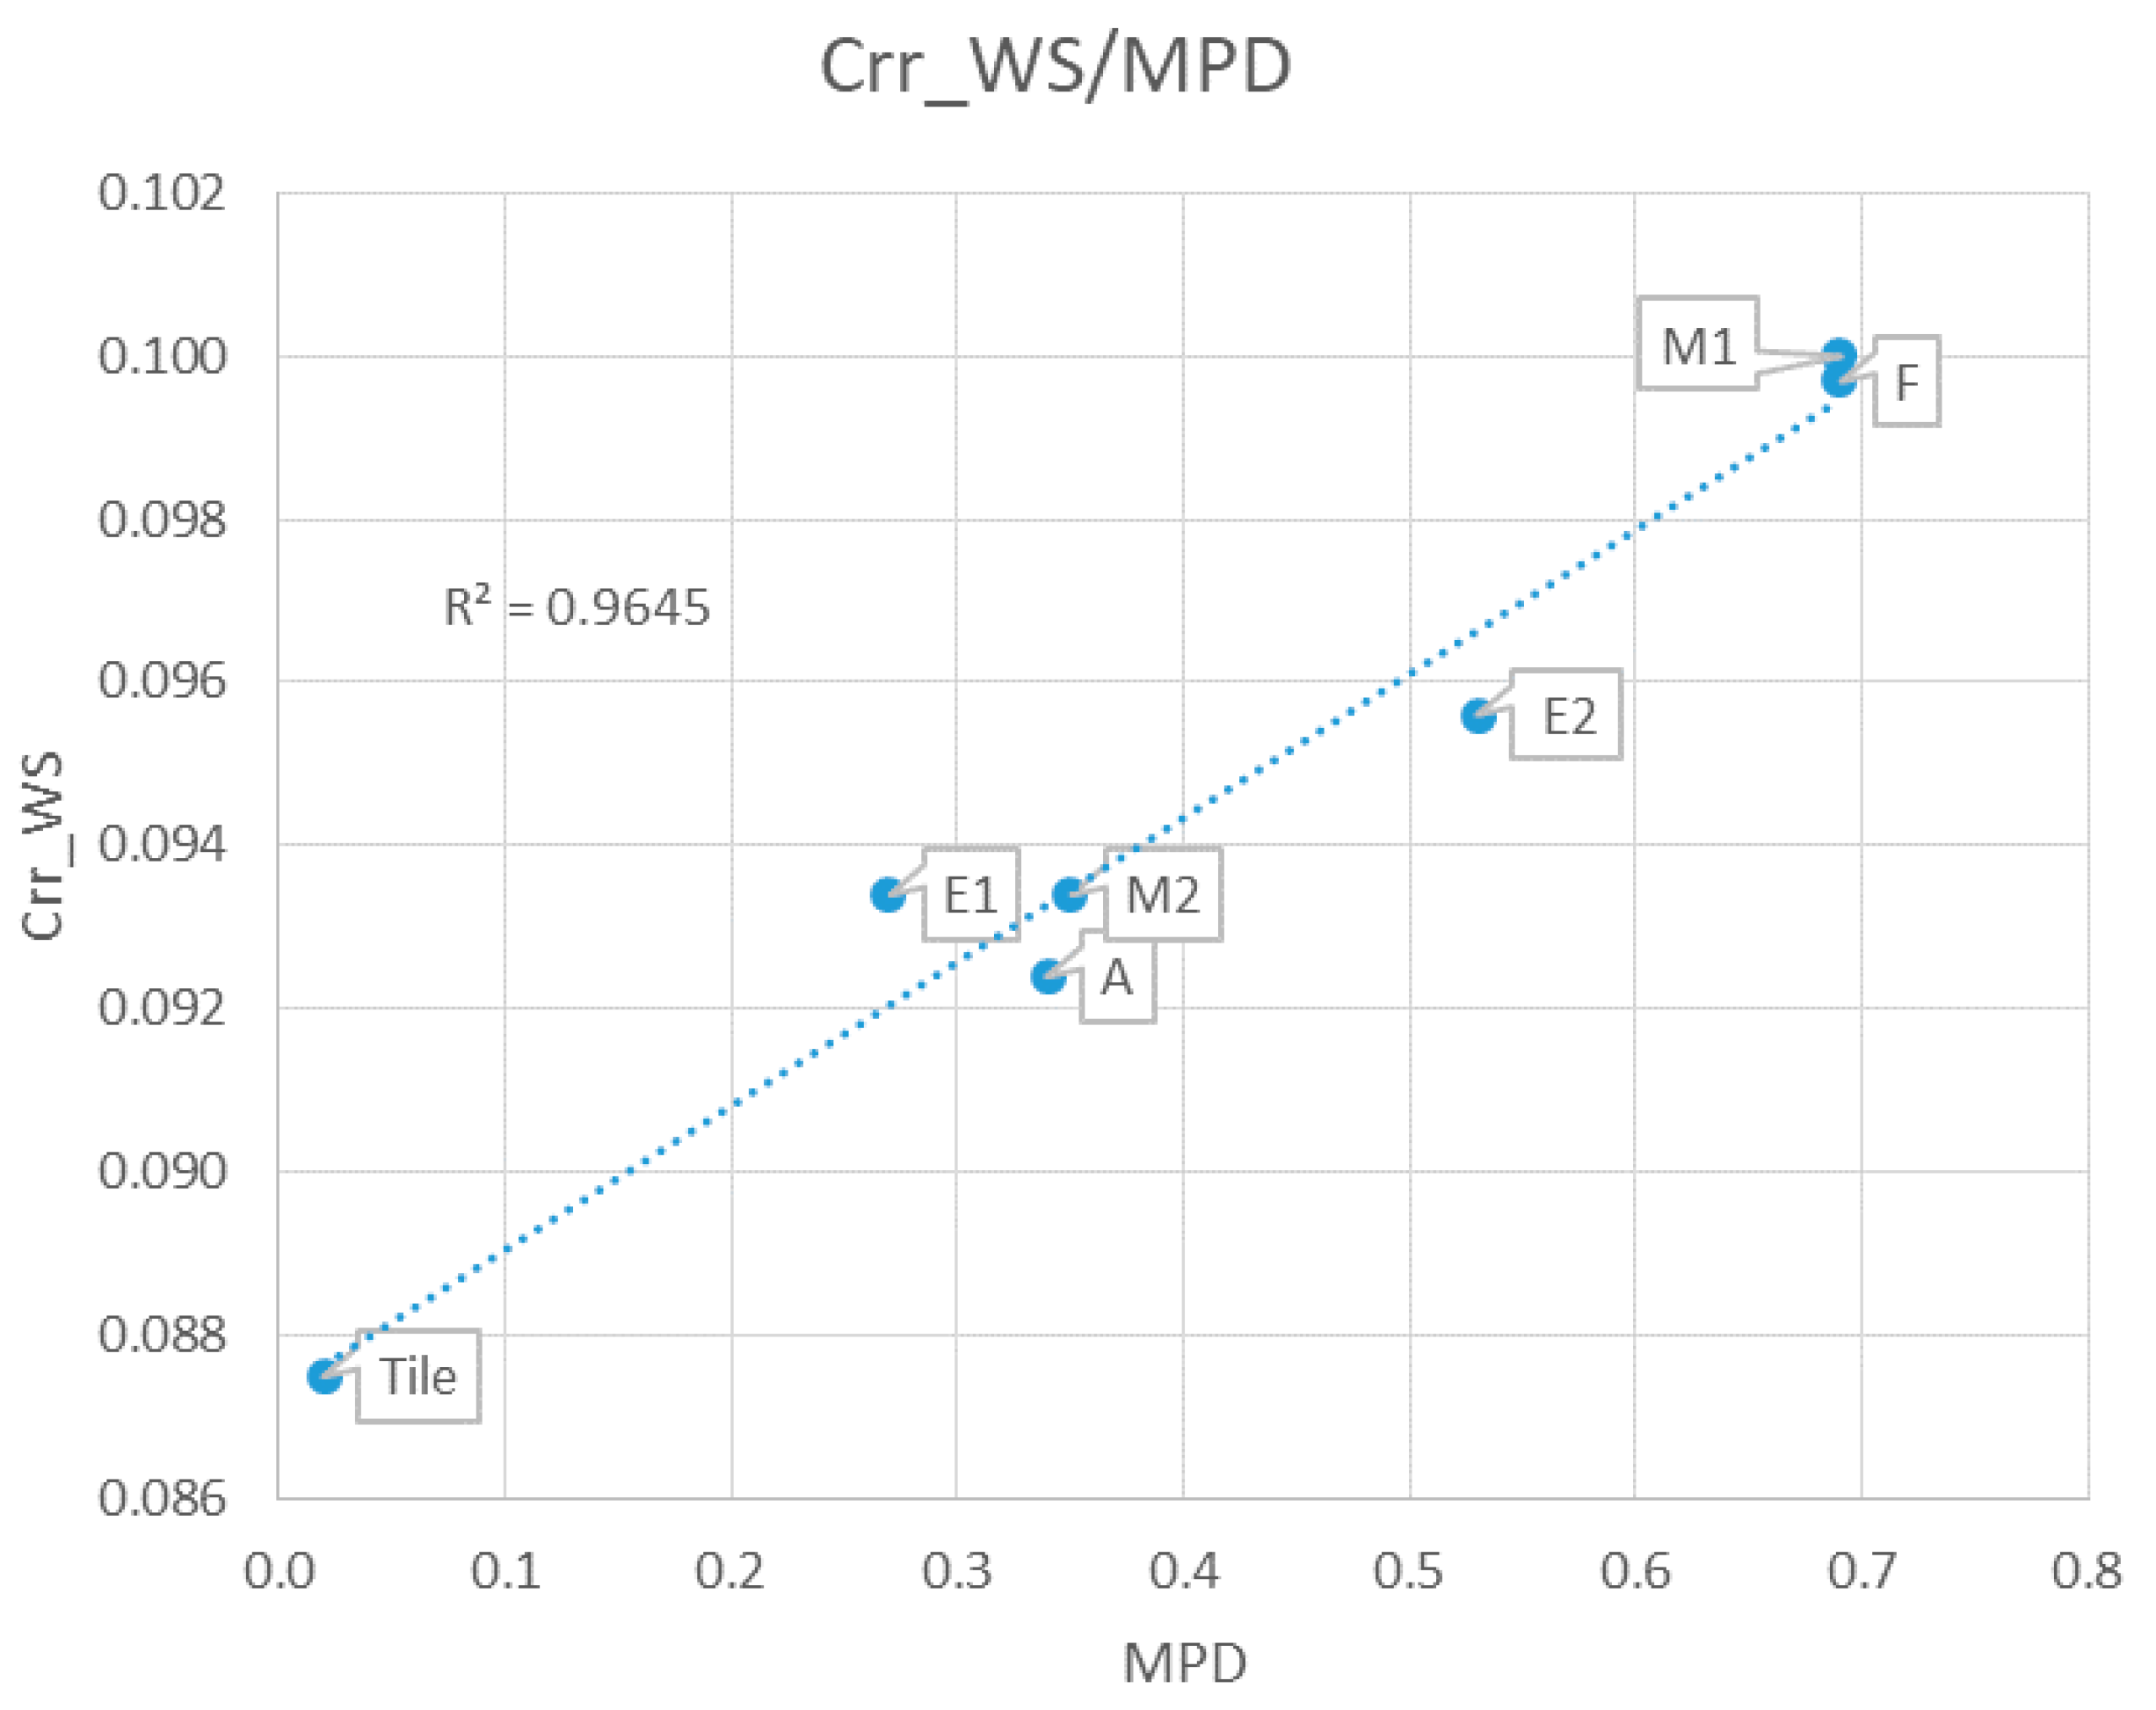
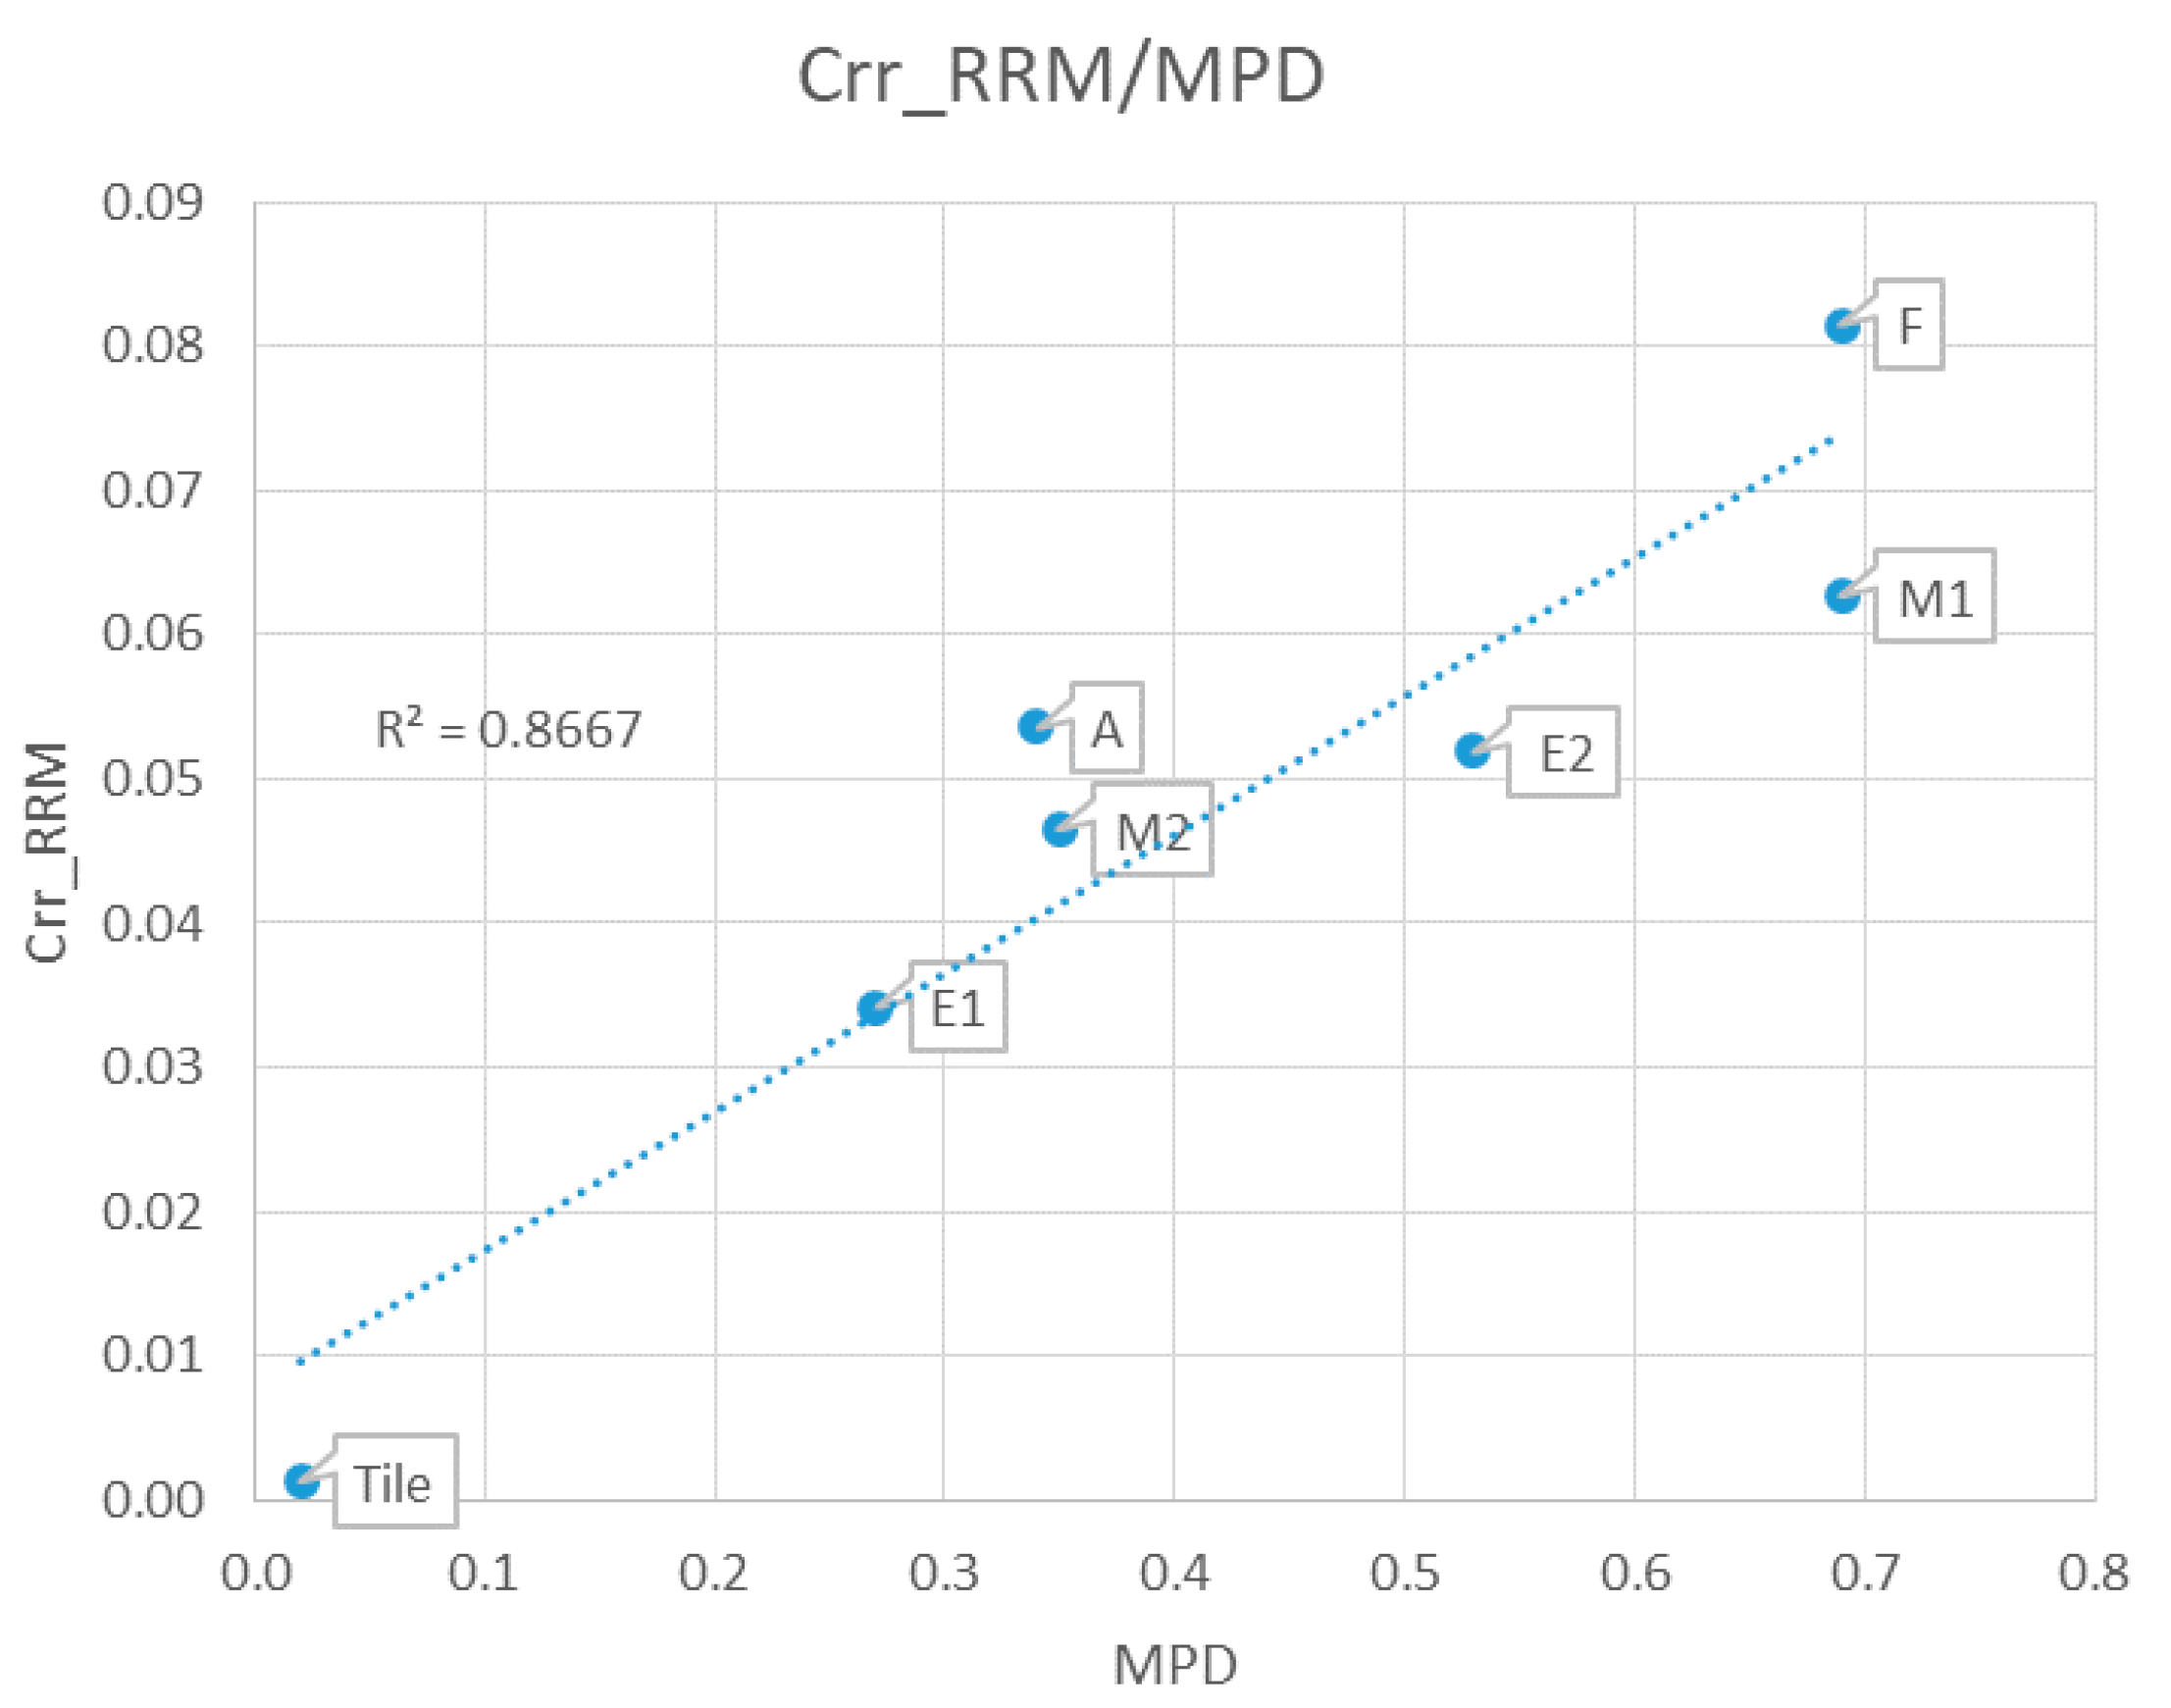
| Surfaces | MPD | Crr_RRM | Crr_WS |
|---|---|---|---|
| Tile | 0.02 | 1.30 × 10⁻³ | 8.75 × 10⁻² |
| E1 | 0.27 | 3.42 × 10⁻² | 9.34 × 10⁻² |
| E2 | 0.53 | 5.19 × 10⁻² | 9.56 × 10⁻² |
| A | 0.34 | 5.36 × 10⁻² | 9.24 × 10⁻² |
| M2 | 0.35 | 4.65 × 10⁻² | 9.34 × 10⁻² |
| F | 0.69 | 8.15 × 10⁻² | 9.97 × 10⁻² |
| M1 | 0.69 | 6.27 × 10⁻² | 1.00 × 10⁻¹ |
Publisher’s Note: MDPI stays neutral with regard to jurisdictional claims in published maps and institutional affiliations. |
© 2021 by the authors. Licensee MDPI, Basel, Switzerland. This article is an open access article distributed under the terms and conditions of the Creative Commons Attribution (CC BY) license (https://creativecommons.org/licenses/by/4.0/).
Share and Cite
Kane, M.; Riahi, E.; Do, M.-T. Tire/Road Rolling Resistance Modeling: Discussing the Surface Macrotexture Effect. Coatings 2021, 11, 538. https://doi.org/10.3390/coatings11050538
Kane M, Riahi E, Do M-T. Tire/Road Rolling Resistance Modeling: Discussing the Surface Macrotexture Effect. Coatings. 2021; 11(5):538. https://doi.org/10.3390/coatings11050538
Chicago/Turabian StyleKane, Malal, Ebrahim Riahi, and Minh-Tan Do. 2021. "Tire/Road Rolling Resistance Modeling: Discussing the Surface Macrotexture Effect" Coatings 11, no. 5: 538. https://doi.org/10.3390/coatings11050538
APA StyleKane, M., Riahi, E., & Do, M.-T. (2021). Tire/Road Rolling Resistance Modeling: Discussing the Surface Macrotexture Effect. Coatings, 11(5), 538. https://doi.org/10.3390/coatings11050538