Abstract
The atmospheric corrosion behavior of a hot-rolled strip with four types (I–IV) of oxide scale was investigated using the accelerated wet–dry cycle corrosion test. Corrosion resistance and porosity of oxide scale were studied by potentiometric polarization measurements. Characterization of samples after 80 cycles of the wet–dry corrosion test showed that scale comprised wüstite and magnetite had strongest corrosion resistance. Oxide scale composed of inner magnetite/iron (>70%) and an outer magnetite layer had the weakest corrosion resistance. The corrosion kinetics (weight gain) of each type of oxide scale followed an initial linear and then parabolic (at middle to late corrosion) relationship. This could be predicted by a simple kinetic model which showed good agreement with the experimental results. Analysis of the potentiometric polarization curves, obtained from oxide coated steel electrodes, revealed that the type I oxide scale had the highest porosity, and the corrosion mechanism resulted from the joint effects of electrochemical behavior and the porosity of the oxide scale. In the initial stage of corrosion, the corrosion product nucleated and an outer rust layer formed. As the thickness of outer rust layer increased, the corrosion product developed on the scale defects. An inner rust layer then formed in the localized pits as crack growth of the scale. This attacked the scale and expanded into the substrate during the later stage of corrosion. At this stage, the protective effect of the oxide scale was lost.
1. Introduction
Hot rolled steel plate accounts for the largest percentage of hot rolled steel products used in China. They are typically sold directly as finished products or as raw material for cold rolled production [1]. Hot rolled steel plates usually have no surface coating, so they are susceptible to atmospheric corrosion during transportation or storage and electrochemical corrosion caused by water in the stack or roll [2]. Steel waste due to corrosion is 10−20% of the annual output in China. The corrosion of hot rolled strip is mainly due to an electrochemical reaction in which corrosion products are formed continuously under a water film in an atmospheric environment [3,4,5]. The surface of hot rolled steel strip is susceptible to the formation of a very thin water film due to adsorption in a humid environment. The non-uniform composition of the hot rolled steel strip surface, or deformation under uneven loading, can generate different electrode potentials in adjacent sections, analogous to the formation of many micro-batteries [6]. In the anode region, the steel matrix is oxidized into Fe2+ in the water film. In the cathode region, dissolved oxygen in the water is reduced to OH−. OH− can bind with Fe2+ to form a white phase of Fe(OH)2 Fe(OH)2 is then oxidized to Fe(OH)3 in the presence of oxygen and water [7,8].
The oxide scale forms on the surface of hot rolled steel strip during the final rolling [9]. Then a series of phase transformations of oxide scale occur after coiling, leading to a structural difference of oxide scale between the high temperature and room temperature phases [10]. Collazo [11] et al. investigated the electrochemical corrosion behavior of carbon steel with oxide scale. They showed that the corrosion rate of carbon steel was significantly reduced by oxide scale. Perez [12] et al. applied the electrochemical impedance spectroscopy (EIS) technique to measure hot rolled steel plates with three different constituents. The results suggested that alloying elements could be enriched in the oxide scale, which affected the corrosion resistance of steel significantly. Macak [13] et al. conducted a series of experiments to examine oxide scale of stainless steel at high temperature in water vapor. It was found that oxide scale behaved like a semiconductor. The oxide scale has great influence on the electrochemical corrosion of hot rolled steel strip. Atmospheric corrosion kinetics of low carbon steel was studied by Ma and Li in a tropical ocean environment and an industrial atmosphere [14]. They proposed that a transition behavior of corrosion kinetics occurred at high relative humidity. The instantaneous corrosion rate followed different exponential functions before and after the transition stage. Hiroki [15] et al. investigated the role of the rust layer in the corrosion of steel. Based on the quantitative analysis of chemical reactions in the corrosion process, an atmospheric corrosion model for steel was established, and the formation conditions of a corrosion resistant rust layer were established. Dong [16] et al. applied EIS and surface characterization to examine the electrochemical corrosion behavior of hot rolled steel strip in 1% NaCl solution. The results showed that the corrosion of the steel matrix would be slowed by the dense oxide scale. Similar techniques were applied in a study by Thee et al. who examined the corrosion behavior of weathering steel in alternate wet–dry atmospheric environments [17]. The rust layer provided good and stable protection from further corrosion of the steel matrix. Evidently, the oxide scale of hot rolled strip has a protective effect in an atmospheric environment.
In this study we focused on the influence of oxide scale types and surface conditions on the corrosion protection of hot rolled steel strip. An understanding of these processes will extend the understanding of the corrosion behavior mechanisms of hot rolled steel products. The structure of oxide scale was optimized, and its protective effects improved by adjusting the hot rolling process.
2. Experimental Procedures
2.1. Metallography
The chemical composition of the steel used in the laboratory test is given in Table 1. Oxide scale specimens were cut from hot-rolled strips prepared by four different rolling processes given in Table 2. Cross-section specimens were obtained using a wire cutter. After ultrasonic cleaning, specimens were mounted in resin and their surface ground with SiC paper (800#, 1000#, and 1200#) until the scratches were removed. Samples were then polished with 2.5# diamond polishing paste for 30 min. The surface of each specimen was rinsed with alcohol prior to air drying and etching with 2.7% (v/v) hydrochloric acid in ethanol [18]. Cross-sectional morphology was observed using OLYMPUS-BX53M metallographic microscope.PS software was used to count the pixels of each oxide phase in the metallographic photos, and then the proportion of each oxide phase calculated.

Table 1.
Chemical composition of the tested steel (wt.%).

Table 2.
Hot roll steel strip processing conditions
2.2. Accelerated Wet–Dry Cycle Corrosion Experiment
To make a comparative study, samples with and without oxide scale were prepared. Eight groups, comprising eight test samples, were prepared to measure corrosion behavior. Test samples were cut into sections measuring 260 mm × 50 mm × 2.5 mm. Samples without scale were ground to a 1200 grit finish and polished for 30 min. All samples were mounted with epoxy resin to leave an exposed steel detection surface of 40 mm × 40 mm. The samples were placed in a constant temperature and humidity chamber maintained at 30 °C and 60% humidity for alternate cycles of wet and dry accelerated corrosion testing. NaHSO3 solution (0.005 mol/L, pH 4.5) was prepared for spray application to each sample at 40 mL/cm2. The course of corrosion experiment was 80 cycles, and each cycle was 12 h. The experiment cycle was as follows: (1) The initial weight of the samples was recorded; (2) solution was sprayed onto each sample surface; (3) samples were dried for 12 h in the chamber; and (4) samples were weighted again. After each cycle, the samples were removed from the chamber, washed with deionized water, sprayed with the solution and returned to the chamber. Steps (3) and (4) were repeated until the experiment was complete. At the same, the pH value of samples is detected after each cycle.
Cross-sectional and surface morphologies of the rust layer were observed using a JSM-840A scanning electron microscope (SEM) with energy dispersive X-ray spectroscopy (EDS) capability (Jeol Ltd., Tokyo, Japan). The corrosion products were formed on samples with and without oxide scale after 80 cycles. The phase composition of corrosion products with 80 cycles was studied using X-ray phase analysis. X-ray diffraction (XRD) diffractograms were obtained using Cu-Kα radiation from 2θ = 5o−120o.
2.3. Electrochemical Experiments
Potentiodynamic polarization measurements were performed with a CHI600B electrochemical workstation (CH Instruments, Inc., Austin, TX, USA) in 3 wt.% NaCl solution, using a three-electrode system. Steel electrode (with and without oxide scale), a saturated calomel electrode and a Pt electrode were used as the working, reference and counter electrodes, respectively. The potential scanning range was −0.5 to 0.5 V relative to the corrosion potential (Ecorr). The steel was cut into 10 mm × 10 mm × 2.5 mm sections for electrochemical measurements at 25 °C and a scan rate of 0.4 mV/s.
3. Experimental Results
3.1. Cross-Section Morphology of Oxide Scale under Different Hot Rolling Processes
The microstructure cross sections of oxide scales prepared at different hot rolling processes are shown in Figure 1. Figure 1a shows type I oxide scale which consisted of outer magnetite, magnetite/Fe eutectoid structure, and retained wüstite. The transformation of wüstite to magnetite/Fe eutectoid was estimated to be >70%. The structure of type II oxide scale (Figure 1b) was like type I, except that the transformation ratio was <50%. Most of the wüstite layer was retained in the type III scale shown in Figure 1c. Some magnetite precipitation was observed inside the wüstite layer. The structure of the type IV scale shown in Figure 1d consisted of outer magnetite and the inner wüstite. There was no precipitated magnetite and magnetite/iron eutectoid found in the wüstite. Table 3 summarizes the main structural features of the different types of oxide scales.
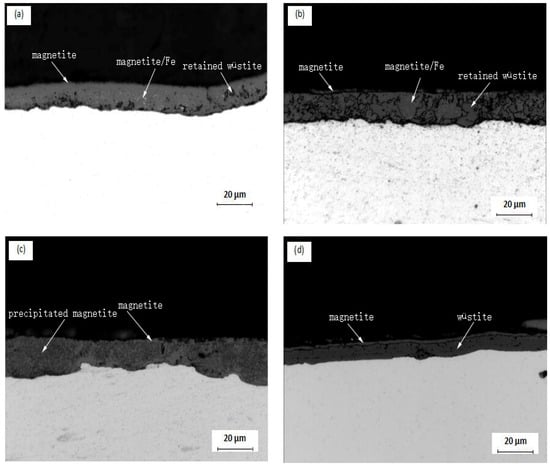
Figure 1.
Microstructure cross-section images of oxide scales: (a) type I; (b) type II; (c) type III; (d) type IV.

Table 3.
Microstructure characteristics of oxide scales.
3.2. Corrosion Kinetics
Figure 2 shows the relationship between corrosion time and weight gains in four samples, with and without oxide scale, after 80 cycles. Comparison of the samples with and without type I oxide scale showed that the corrosion weight gain of the sample with the oxide scale was similar to the sample without the oxide scale, indicating that type I oxide scale does not protect the substrate. The corrosion weight gains of samples with type II, III, and IV oxide scales were all less than samples without the oxide scale. After 80 cycles, the corrosion weight gain of samples with type II, III, and IV oxide scales were 1.57, 2.01, and 2.74 times lower, respectively, compared with samples without the oxide scale. The type IV oxide scale appeared to provide the best atmospheric corrosion resistance for the substrate. The oxide scale of hot rolled steel behaved like a non-conductive insulator. The oxide scale covered the steel surface, primarily playing a role in physical shielding, which could improve the corrosion resistance of hot rolled steel [19]. Figure 2 shows that relative to the type I oxide scale, the remaining three oxide scales could decrease the corrosion of the substrate.
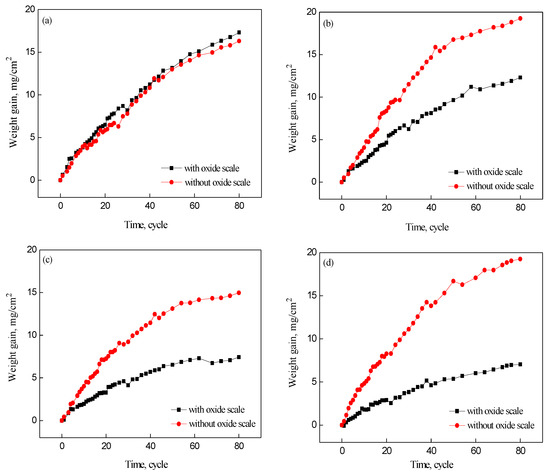
Figure 2.
Relationship between weight gain and corrosion time for the samples with and without the oxide scale: (a) type I; (b) type II; (c) type III; (d) type IV.
Figure 3 shows the relationship between the corrosion time and weight gain of the substrate steels with different oxide scale structures. The time and corrosion weight gains of the substrate steels exhibited a parabolic relationship. After 80 cycles, the corrosion weight gains of samples with types I, II, and III oxide scale were 2.46, 1.75, and 1.21 times that of types IV, respectively.
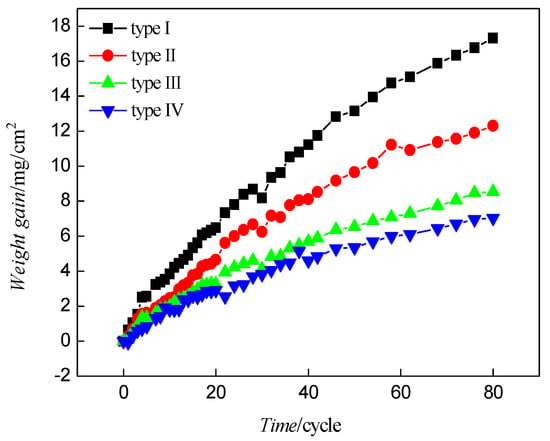
Figure 3.
Relationship between weight gains and corrosion exposure time for samples with different oxide scales.
3.3. Surface Rust Morphology
Figure 4 shows the evolution of the surface rust morphologies on type I and IV oxide scales after different corrosion cycles. After 20 cycles, a yellow rust layer covered the type I oxide scale surface (Figure 4a). This darkened with extended corrosion time to become dark brown after 70 cycles (Figure 4c). The corrosion product on type IV scale (Figure 4d−f) showed different images compared with type I. Most of scale surface was not covered by rust after 20 cycles; after 40 cycles, the area of rust increased but the scale was not covered completely; after 70 cycles, the oxide scale was covered by rust but the thickness of the layer was very thin. Hence, there were more corrosion resistant areas and the thickness of the corrosion products was very thin.
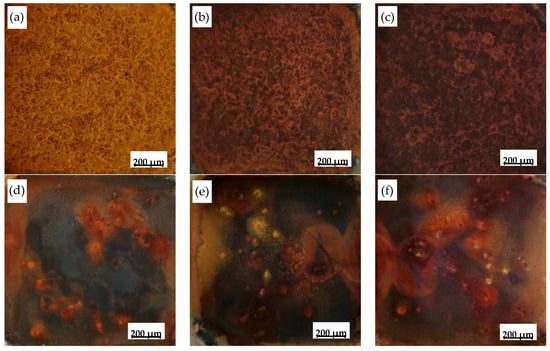
Figure 4.
Surface macro-morphologies of type I (a−c) and type IV (d−f) oxide scale after different corrosion cycles: (a) and (d) 20 cycles; (b) and (e) 46 cycles; (c) and (f) 70 cycles.
Figure 5 shows the SEM images of the corrosion products formed on the different oxide scales after 40 cycles. The surface morphology of the corrosion products formed on the four oxide scales were different. The corrosion products on the type I and II scales showed a loose structure with many cracks and micro-pores in the rust (Figure 5a,b). These cracks and micro-pores facilitated solution and oxygen from reaching the substrate. On the other hand, corrosion products with a compact and dense structure were formed on type III and IV oxide scale. The morphology of the surfaces on type III and IV scale were more homogeneous and finer than those on type I and II scales.
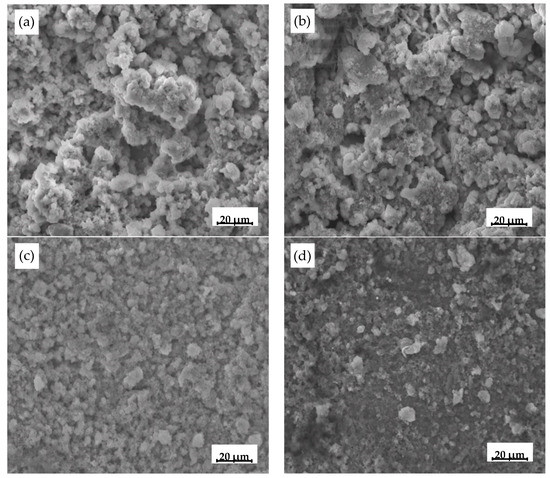
Figure 5.
SEM images of corrosion product formed on oxide scale electrode after 40 cycles: (a) type I; (b) type II; (c) type III; (d) type IV.
3.4. Rust Cross-Section Morphology
Figure 6 shows the cross-sectional morphologies of rusts formed on type I and type IV oxide scale after 20, 50, and 70 cycles. After 20 cycles, the thickness of rust covering the type I scale was 23 μm (Figure 6a). The image shows that the etching solution had reached the substrate via a scale crack to form and inner rust layer at the interface between the oxide scale and substrate. This indicated that the oxide scale had lost its substrate protective function. The thickness of the outer and inner rust layers increased after 50 cycles (see Figure 6b) and at 70 cycles, the thicknesses of outer and inner rust layers were about 49 μm and 35 μm, respectively (see Figure 6c). At this time, the oxide scale had lost its protective function completely. The corrosion product attached to the surface of the type IV oxide scale (see Figure 6d) was barely visible after 20 cycles. At 50 cycles, a rust layer with a compact and dense structure could be observed (Figure 6e). The thickness of outer rusts covering the type IV oxide scale was 3 μm. While the protective effect of oxide scale was evident, micro-pores and cracks had occurred in the scale. After 70 cycles corrosion product with a compact structure had accumulated on the oxide scale surface (see Figure 6f). With the extension of time, inner corrosion product formed and attached to substrate. After 70 cycles the outer rust layer was 25 μm, while inner layer was about 5 μm. The thickness of outer rust layer on type I scale was approximately twice that on type IV. This showed that the structure of the oxide scale could have a significant effect on the atmospheric corrosion behavior of hot rolled steel.
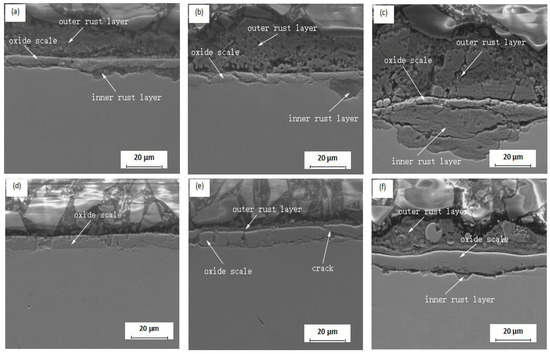
Figure 6.
Cross-sectional morphology of rust on oxide scales after different cycles: (a) 20 cycles, type I; (b) 50 cycles, type I; (c) 70 cycles, type I; (d) 20 cycles, type IV; (e) 50 cycles, type IV; (f) 70 cycles, type.
3.5. Composition of the Rust Layers
The composition of the rust layers, with and without oxide scale, was analyzed after 80 cycles using XRD. The XRD diffractograms given in Figure 7 showed that the rust layers were composed of γ-FeOOH, α-FeOOH and Fe3O4 [20]. Under the action of NaHSO3 solution, the anodic reactions occurring at the active zone in the initial wet–dry cycle corrosion test could be given by the following equations [19]:
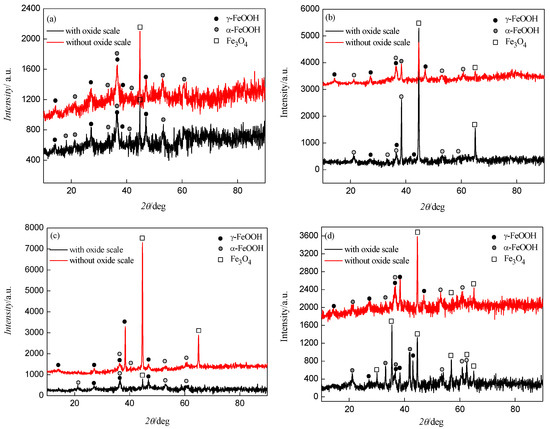
Figure 7.
XRD diffractograms of corrosion products after 80 cycles: (a) type I; (b) type II; (c) type III; (d) type IV.
Oxygen depolarization occurred at cathode region given by the following equations:
Fe(OH)2 was readily oxidized to Fe(OH)3 in the presence of oxygen and water [21]. A high corrosion rate resulted in oxygen depletion and induced the formation of Fe3O4. The pH of samples changed during the wet–dry cyclic corrosion test. When the pH was close to seven, γ-FeOOH formed rapidly at the surface of samples. As γ-FeOOH was generated continuously, this caused the hydrogen ion concentration to increase and the pH value decreased. Under these conditions, Fe2+ was adsorbed onto the surface of γ-FeOOH which promoted the dissolution of γ-FeOOH and transformation into α-FeOOH and Fe3O4 [22].
3.6. Potentiodynamic Polarization Measurements
Figure 8 shows the potentiodynamic polarization curves obtained from steel electrodes, with and without oxide scale, in 3 wt% NaCl solution. The polarization experiments indicated that the corrosion potential and current of the oxide scale-covered electrodes were a combination of potential and current from the substrate and the oxide scale [20]. It was evident that there was a more positive corrosion potential for electrodes with oxide scale compared with electrodes without oxide scale. Furthermore, the corrosion current of the electrodes without oxide scale was higher than that of oxide scale-covered electrodes.
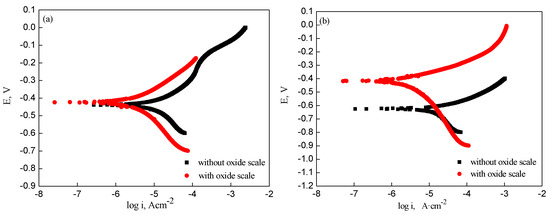
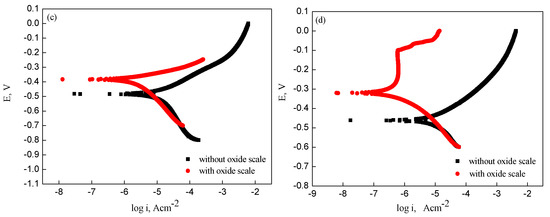
Figure 8.
Potentiodynamic polarization curves of samples with and without oxide scale: (a) type I; (b) type II; (c) type III; (d) type IV.
Figure 9 shows potentiodynamic polarization curves measured on electrodes with four types oxide scales in 3 wt% NaCl solution. The results showed that the electrode with type IV oxide scale had a higher corrosion potential and lower corrosion current compared with the other oxide scale electrodes. Based on the electrochemical analysis, type IV oxide scale-covered electrode had the lowest corrosion tendency. These results were consistent with the corrosion behavior results obtained from the wet–dry cycle corrosion tests.
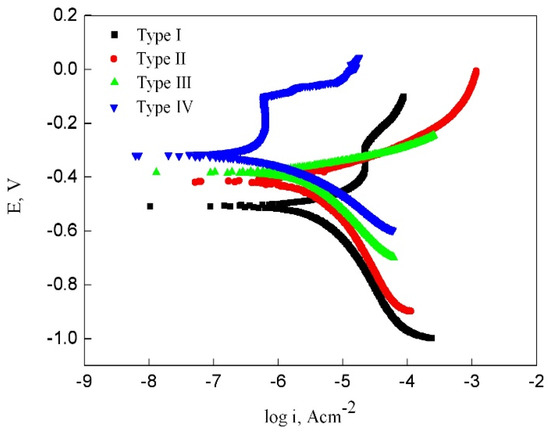
Figure 9.
Potentiometric polarization curves obtained from electrodes with four types oxide scale.
4. Discussion
4.1. Corrosion Kinetic Model
Inspection of the relationship between weight gain and corrosion cycle time for the substrates with four types oxide scales (see Figure 3) showed that the corrosion process could be divided into two stages, as shown in Figure 10.
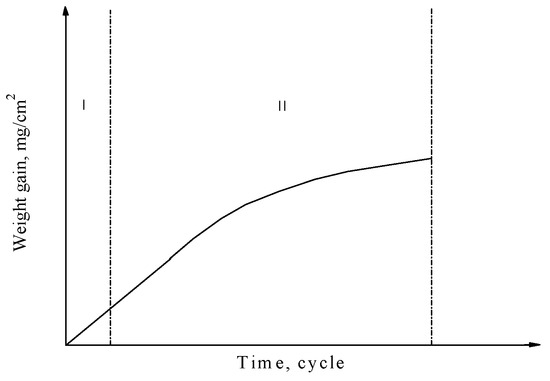
Figure 10.
Stages of the corrosion process: (I) interface reaction is the controlling step; (II) diffusion reaction is the controlling step.
In the initial wet–dry cycle corrosion test, there was adequate contact between the corrosion solution and oxide scale for corrosion products to form rapidly. The interfacial reaction process was the controlling step at this stage and the kinetics of the corrosion process could be described by a linear relationship. Hence, the experimental data could be fitted to the following equation:
where Kr is corrosion rate coefficient when interface reaction is controlling step, m(t) is the weight gain of samples, and t is the corrosion time.
A corrosion products layer formed from a reaction between the corrosion solution and oxide scale in the middle and late stages of the wet–dry cycle corrosion test. When the corrosion products layer reached a certain thickness, the controlling step changed from interfacial reaction to diffusion reaction. As the thickness of the corrosion product layer increased, the corrosion rate slowed, consistent with a parabolic relationship. Thus, the corrosion kinetics model for this stage could expressed as follows:
where Kd is corrosion rate coefficient when the diffusion reaction is the controlling step, m(t) is the weight gain of samples, t is the corrosion time, C is integral constant (it showed that the thin rust layer was formed on the substrate surface at the beginning of the second stage of corrosion). The corrosion kinetics model for the whole process could then be expressed as follows:
where tc is the critical time of transition from the first stage to the second. When t < tc, the corrosion reaction was in the first stage. When t ≥ tc, the reaction entered into the second stage.
Figure 11 shows the relationship between the calculated values of weight gain and the experiment values with corrosion cycle time. The calculated corrosion weight data showed good agreement with the experimental results. The values of Kr, Kd, and tc obtained for each type of oxide scale are given in Table 4.

Figure 11.
Relationship between calculated and experiment corrosion data.

Table 4.
Calculated values of Kr,Kd, and tc for the different oxide scales.
4.2. Porosity of Oxide Scale
The corrosion potential (Ecorr) and corrosion current (Icorr) of samples, with and without oxide scale, measured in the 3 wt.% NaCl solution are shown in Table 5.

Table 5.
Corrosion potential (Ecorr) and current (Icorr) of samples with different oxide scales.
Many cracks and pores occur in the oxide scale due to the hot rolling process [23]. The corrosion behavior of hot rolled steel with and without oxide scale is caused by reaction of the corrosion medium with substrate via these defects [24]. The number of defects in the oxide scale is proportional to corrosion current [25]. If the oxide scale had no defects its surface is completely shielded and the porosity of the scale would be zero. Under these conditions, the corrosion current would be minimum. If the oxide scale is completely defective (which corresponds to a substrate without oxide scale), the porosity of scale is one and the corrosion current would be maximum. The corrosion current is proportion to and increases with increasing porosity of the oxide scale. Hence, the porosity of oxide scale could be expressed as follows [16]:
where Icorr,f and Icorr,o were corrosion current with and without oxide scale respectively. From the Equation (8) and Table 5, the porosity of oxide scale was calculated and given in Table 6.

Table 6.
Porosity of four types oxide scale.
Inspection of Table 5 shows that the type I oxide scale had the highest porosity (21.19%), type III oxide scale had the lowest value (10.60%) while the porosity of the type IV oxide scale was 12.66%, which was not the minimum value. The structure of type IV oxide scale consisted of outer magnetite and inner wüstite. Since wüstite is a p-type metal deficit semiconductor, which can exist in high cation vacancy concentrations, the porosity of the type IV oxide scale was higher than type III. The data given in Table 5 and Table 6 illustrates that the corrosion behavior of substrate with oxide scale is a combination of electrochemical behavior and porosity of the oxide scale.
4.3. Atmospheric Corrosion Resistant Analysis of Different Types of Oxide Scale
Ecorr and Icorr of substrates with the four types oxide scale varied widely. For example, the Icorr of type I oxide scale was about an order of magnitude greater than type IV oxide scale. The reason may due to the structure of type I oxide scale which consisted of thin outer magnetite, magnetite/Fe eutectoid and small amount of retained wüstite. However, the alternate lamella eutectoid structures of Fe3O4 and Fe constituted many individual corrosion cells due to the natural potential difference between Fe and Fe3O4 [20]. The Fe3O4 layer at the outermost part of the oxide scale was relatively thin; therefore, Fe in the eutectoid products separated out at the surface of the oxide scale. The corrosion potential of Fe particles was more negative than that of Fe3O4, therefore the Fe particles behaved as micro-anodes in the corrosion microcell formed by the eutectoid structure (see Figure 12). In the NaHSO3 corrosive solution, apart from these surface cracks and holes in the oxide scale, the Fe particles also formed individual active sites. Thus, in a relatively short period of time, these micro-anodes, i.e., Fe particles, on the surface of the type I oxide scale were first eroded by the corrosive solution, leading to rapid localized corrosion. Therefore, the corrosion potential was relatively negative, and the corrosion current relatively high, which was one reason for the easy and rapid corrosion of the test steel with the type I oxide scale.
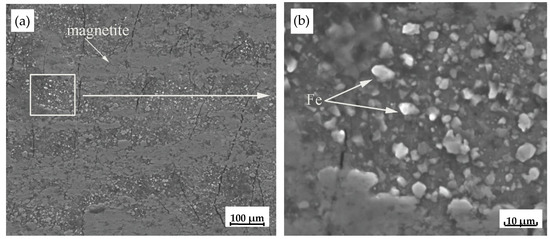
Figure 12.
SEM images of type I oxide scale sample: (a) surface morphology of type I oxide scale; (b) Fe particles on the type I oxide scale.
It is interesting to note that the corrosion kinetic data showed that the weight increment of the test steel with type IV oxide scale was the smallest. However, based on the potentiometric polarization test curves, the porosity of the type IV oxide scale was not the smallest among the four types oxide scale. This could be explained by two factors: (1) the Ecorr and Icorr of the oxide scale and the substrate steel; and (2) the porosity of the oxide scale. The cooperative action of these two factors led to the corrosion of the substrate steel with the oxide scale in the corrosive medium. The experimental results showed that under the test conditions, Ecorr and Icorr of the oxide scale and the substrate steel were the dominant factors. Thus, the substrate steel with the type IV oxide scale exhibited the best resistance to corrosion.
4.4. Mechanism of Atmospheric Corrosion Resistance of Substrate with Oxide Scale
Figure 13 shows the schematic diagram of corrosion process of substrate with oxide scale during the wet–dry cycle corrosion test. NaHSO3 solution dissociates and oxidizes on the surface of the samples as follows:
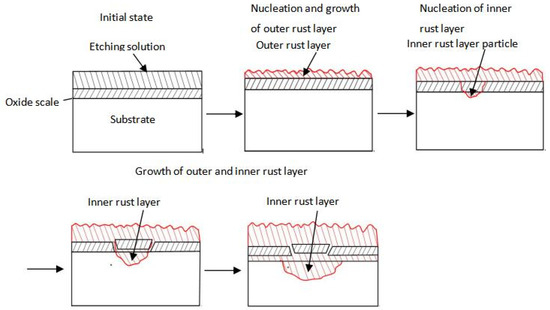
Figure 13.
Schematic diagram showing the nucleation and growth process of the rust layer in steel.
The corrosion products formed in the pores and cracks of the oxide scale and the openings became blocked. Consequently, the corrosion medium did not reach the reach the substrate directly and the rust layers preferentially formed on the surface of oxide scale. The thickness of the outer rust layer on the oxide scale surface gradually increased with the corrosion time. Meanwhile, the amount of corrosion products formed at the defects in the oxide scale gradually increased. When the corrosion medium reached the surface of substrate via the cracks, the self-dissolving reaction of Fe could occur. Under the same condition, the Ecorr of the oxide scale was more positive than that of steel with and without oxide scale [26]. When the corrosion medium reached the surface of substrate, a corrosion core inner rust layer was formed rapidly at the interface with the steel substrate. As a result, a small anode-large cathode was formed by the corrosion core and oxide scale respectively. Since the Ecorr of the oxide scale was much greater (+Ve) than that of the matrix steel, the corrosion core could grow rapidly in a very short time. The thickness of outer rust layer continued to grow with the increasing corrosion time. The corrosion core, formed at the interface between the oxide scale and the substrate, gradually increased to form an inner rust layer. As the inner rust layer continued to expand into the interior of the oxide scale and substrate the oxide scale lost its protective effect.
5. Conclusions
After 80 wet–dry corrosion cycles, the weight gain of the sample with the type I oxide scale was much greater than samples with type II−IV oxide scales. The corrosion weight gain of the sample with the type I oxide scale was similar to that of the sample without the oxide scale, indicating that the type I oxide scale provided little or no protection to the substrate. Covering the test steel surface with type II−IV oxide scales could decrease the amount of corrosion to the steel substrate.
In the initial stage of the corrosion of steel with an oxide scale, the interface reaction was the controlling step and the kinetics exhibited linear behavior. At the mid and late stages of corrosion, the controlling step changed from interface reaction to diffusion reaction as the corrosion product layer reached a certain thickness. Under these conditions the corrosion kinetics conformed to the parabolic relationship. A corrosion kinetic model for the test steel with the oxide scale was established based on the experimental corrosion weight gain data.
The corrosion of the test steel with the oxide scale was controlled by two factors: Ecorr and Icorr of the substrate steel with oxide scale, and the porosity of the oxide scale. The cooperative action of these two factors could account for the corrosion of the substrate steel with the oxide scale under the test conditions.
In the initial stage of the corrosion of hot-rolled steel with an oxide scale, corrosion products formed at the location of defects in the oxide scale while an outer rust layer preferentially formed on the surface of the oxide scale. In the middle stage of corrosion, a corrosion core of inner rust layer was rapidly formed at the interface between the oxide scale and the steel substrate as the corrosion medium reached the substrate. The corrosion core gradually increased to form an inner rust layer which eventually expanded into the oxide scale and substrate. At this stage, the protective effect of the oxide scale was lost.
Author Contributions
Conceptualization, B.S.; methodology, Y.-Q.H.; formal analysis, C.-Y.D.; investigation, J.-K.Z.; resources, G.-M.C.; data curation, L.C.; writing—original draft preparation, B.S.; writing—review and editing, B.S.; project administration, B.S.; funding acquisition, B.S. All authors have read and agreed to the published version of the manuscript.
Funding
This research was funded by National Natural Science Foundation of China, grant number 51301111; Natural Science Foundation of Liaoning Province of China, grant number 2019-KF-05-04 and Shenyang Young and Middle-aged Science and Technology Innovation Talent Support Programme, grant number RC200387.
Data Availability Statement
Data available in a publicly accessible repository. The data presented in this study are openly available.
Conflicts of Interest
The authors declare no conflict of interest. The funders had no role in the design of the study; in the collection, analyses, or interpretation of data; in the writing of the manuscript, or in the decision to publish the results.
References
- Frolish, M.F.; Krzyzanowski, M.; Rainforth, W.M.; Beynon, J.H. Oxide scale behaviour on aluminium and steel under hot working conditions. J. Mater. Process. Technol. 2006, 177, 36–40. [Google Scholar] [CrossRef]
- Zhang, H.; Qian, Y.; Qi, H.; Wang, W. Rusting behavior and preventing measures of hot-rolled steel plates for automobile. Corros. Protection. 2008, 29, 316–318, 333. [Google Scholar]
- Suzuki, I.; Masuko, N.; Hisamatsu, Y. Electrochemical properties of iron rust. Corros. Sci. 1979, 19, 521–533. [Google Scholar] [CrossRef]
- de La Fuente, D.; Día, Z.I.; Simancas, J.; Chico, B.; Morcillo, M. Long-term atmospheric corrosion of mild steel. Corros. Sci. 2011, 53, 604–617. [Google Scholar] [CrossRef]
- Han, W.; Pan, C.; Wang, Z.; Yu, G. A study on the initial corrosion behavior of carbon steel exposed to outdoor wet-dry cyclic condition. Corros. Sci. 2014, 88, 89–100. [Google Scholar] [CrossRef]
- Meng, G.Z.; Zhang, C.; Cheng, Y.F. Effects of corrosion product deposit on the subsequent cathodic and anodic reactions of X-70 steel in near-neutral pH solution. Corros. Sci. 2008, 50, 3116–3122. [Google Scholar] [CrossRef]
- Hœrlé, S.; Mazaudier, F.; Dillmann, P.; Santarini, G. Advances in understanding atmospheric corrosion of iron. II: Mechanistic modeling of wet-dry cycles. Corros. Sci. 2004, 46, 1431–1445. [Google Scholar] [CrossRef]
- Chen, Y.Y.; Tzeng, H.J.; Wei, L.I.; Wang, L.H.; Oung, J.C.; Shih, H.C. Corrosion resistance and mechanical properties of low-alloy steels under atmospheric conditions. Corros. Sci. 2005, 47, 1001–1021. [Google Scholar] [CrossRef]
- Chen, R.Y.; Yuen, W.Y.D. Review of the high-temperature oxidation of iron and carbon steels in air or oxygen. Oxid. Met. 2003, 59, 433–468. [Google Scholar] [CrossRef]
- Chen, R.Y.; Yuen, W.Y.D. Oxide scale structures formed on commercial hot-rolled steel strip and their formation mechanisms. Oxid. Met. 2001, 56, 111–112. [Google Scholar] [CrossRef]
- Collazo, A.; Nóvoa, X.R.; Pérez, C.; Puga, B. EIS study of the rust converter effectiveness under different conditions. Electrochem. Acta 2008, 53, 7565–7574. [Google Scholar] [CrossRef]
- Perez, F.J.; Martinez, L.; Hierro, M.P.; Gómez, C.; Portela, A.L.; Pucci, G.N.; Duday, D.; Lecomte-Beckers, J.; Greday, Y. Corrosion behaviour of different hot rolled steels. Corros. Sci. 2006, 48, 472–480. [Google Scholar] [CrossRef]
- Macák, J.; Sajdl, P.; Kučera, P.; Novotný, R.; Vošta, J. In situ electrochemical impedance and noise measurements of corroding stainless steel in high temperature water. Electrochem. Acta 2006, 51, 3566–3577. [Google Scholar] [CrossRef]
- Ma, Y.; Li, Y.; Wang, F. The atmospheric corrosion kinetics of low carbon steel in a tropical marine environment. Corros. Sci. 2010, 52, 1796–1800. [Google Scholar] [CrossRef]
- Tamura, H. The role of rusts in corrosion and corrosion protection of iron and steel. Corros. Sci. 2008, 50, 1872–1883. [Google Scholar] [CrossRef]
- Dong, C.F.; Xue, H.B.; Li, X.G.; Qi, H.B.; Cheng, Y.F. Electrochemical corrosion behavior of hot-rolled steel under oxide scale in chloride solution. Electrochem. Acta 2009, 54, 4223–4228. [Google Scholar] [CrossRef]
- Thee, C.; Hao, L.; Dong, J.; Mu, X.; Wei, X.; Li, X.; Ke, W. Atmospheric corrosion monitoring of a weathering steel under an electrolyte film in cyclic wet-dry condition. Corros. Sci. 2014, 78, 130–137. [Google Scholar] [CrossRef]
- Hao, M.; Sun, B.; Wang, H. High-Temperature Oxidation Behavior of Fe–1Cr–0.2Si Steel. Materials 2020, 13, 509. [Google Scholar] [CrossRef] [PubMed]
- He, A. The Effect of Oxide Film on the Electrochemical Corrosion Behaviors of Hot Rolled Steel; Ocean University of Qingdao: Qingdao, China, 2007. [Google Scholar]
- Cao, C. Principle of Corrosion Electrochemistry; Chemical Industry Press: Beijing, China, 2008; pp. 143–145. (In Chinese) [Google Scholar]
- Zhai, J. High Temperature Corrosion of Metal; Beijing University of Aeronautics and Astronautics: Beijing, China, 1994; pp. 15–18. (In Chinese) [Google Scholar]
- Fu, M.-h. Research on Structure and Corrosion Resistance of Oxide Scale of Hot-Strip Steel; Nanchang Hangkong University: Nanchang, China, 2009. [Google Scholar]
- Li, X.; Dong, C.; Xiao, K.; Du, C.; Zhou, H.; Lin, C. Initial Behavior and Mechanism of Metal Atmospheric Corrosion; Science Press: Beijing, China, 2009; pp. 61–67. [Google Scholar]
- Wei, B. Theory and Application of Metal Corrosion; Chemical Industry Press: Beijing, China, 2002; pp. 145–148. [Google Scholar]
- Sun, B.; Liu, Z.; Qiu, Y.; Wang, G. Isothermal eutectic decomposition of FeO formed on a low carbon steel in air. J. Iron Steel Res. 2010, 22, 34–40. [Google Scholar]
- Cao, G.; Tang, J.; Lin, F.; Li, Z.; Yang, M.; Liu, Z. Electrochemical corrosionbehavior of typical structure of oxide scale. J. Cent. South Univ. (Sci. Technol.) 2018, 49, 1366–1372. [Google Scholar]
Publisher’s Note: MDPI stays neutral with regard to jurisdictional claims in published maps and institutional affiliations. |
© 2021 by the authors. Licensee MDPI, Basel, Switzerland. This article is an open access article distributed under the terms and conditions of the Creative Commons Attribution (CC BY) license (https://creativecommons.org/licenses/by/4.0/).