Article

Influences of Nitrogen Flow Rate on Microstructure, Mechanical and Tribological Properties of WCN Coatings Deposited by HiPIMS

1
School of Mechanical Engineering, Dongguan University of Technology, Dongguan 523808, China
2
The Key Lab of Guangdong for Modern Surface Engineering Technology, National Engineering Laboratory for Modern Materials Surface Engineering Technology, Institute of New Materials, Guangdong Academy of Sciences, Guangzhou 510650, China
3
Synergy Innovation Institute for Modern Industries of Guangdong University of Technology, Dongyuan 517500, China
4
School of Electromechanical Engineering, Guangdong University of Technology, Guangzhou 510006, China
5
School of Materials and Energy, Guangdong University of Technology, Guangzhou 510006, China
*
Authors to whom correspondence should be addressed.
Coatings 2021, 11(4), 481; https://doi.org/10.3390/coatings11040481
Submission received: 26 March 2021 / Revised: 16 April 2021 / Accepted: 17 April 2021 / Published: 20 April 2021

Abstract

:
Tungsten carbide (WC) and Tungsten carbonitride (WCN) coatings are deposited by reactive high-power impulse magnetron sputtering (HiPIMS) with various nitrogen gas flow rates. The characteristics of discharge current and plasma optical emission of HiPIMS are recorded by oscilloscope (OSC) and optical emission spectroscopy (OES). The results exhibit that the peak discharge currents and the intensities of optical emission spectra lines are significantly influenced by the addition of nitrogen. The elemental concentration, microstructure, mechanical and tribological properties in ambient temperature and high temperature of deposited coatings are investigated by a wide variety of techniques such as energy dispersive spectroscopy (EDS), X-ray diffraction (XRD), nano-indentation measurement, scanning electron microscope (SEM), atomic force microscopy (AFM), X-ray photoelectron spectroscopy (XPS), and ball-on-disk tribometer. The results show that WC/WCN coatings with different microstructures, mechanical properties and tribological properties have been produced by controlling the flow rate of N2. Meanwhile, with the N2 flow rate increasing from 0 sccm to 24 sccm, (101) diffraction peak shifts to low angle. Moreover, (102) and (110) peaks’ intensities and the angle of (101) peak of β-W2C phase of the deposited WCN coatings decrease and disappear, and the average grain size decreases from 8.9 nm to 6.4 nm. XPS results show that the intensities of C=N, W–N, W–C–N, and N–O peaks increase while the intensity of C–W peak decreases. The deposited coatings change from slight columnar type to a typically dense and featureless structure, and the surface roughness decreases from Ra 11.6 nm at 0 sccm to Ra 5.7 nm at 24 sccm. The variation of nitrogen flow also plays a role in the mechanical properties of the coatings. It is found that the maximum hardness and elastic modulus of 35.6 GPa and 476.5 GPa appear at 16 sccm N2 flow rate. The results of wear tests demonstrate the addition of nitrogen slightly deteriorates tribological properties at room temperature (25 °C), but can remarkably improve tribological properties at high temperature (400 °C) of WC/WCN coatings deposited with an appropriate flow rate of nitrogen.

1. Introduction

Owing to a lot of excellent properties such as high hardness, low friction coefficient, good chemical stability and high wear resistance, tungsten carbide (WC) coatings serving as one of the protective coatings for mechanical components and cutting tools have attracted increasing critical attention and become a research focus in modern manufacturing industry [1,2,3,4,5]. However, the oxidation of graphite phase [6,7] in WC or W containing diamond-like carbon coatings (W-DLC, WC-DLC) above 400 °C in the air have limitations in practical applications, such as high-speed cutting, dry machining, and high-speed rotating [8]. The oxidation of carbon in WC coatings would give rise to accelerated material losses, deteriorated tribological properties and a shortened service life. So, enhancing its wear resistance at high temperatures is of vital importance to improve the performance and prolong the lifetime of WC coatings.
Doping Nitrogen is quite common and promising to enhance properties of nanocomposite coatings. For instance, through making use of high power impulse magnetron sputtering (HiPIMS) technique Shen et al. [9] deposited diamond like carbon films on AISI 304L austenitic stainless using Ar and N2 as precursors at room temperature. The results showed that the Nitrogen-doped diamond like carbon coating exhibited better tribocorrosion properties. Bootkul, D et al. [10] synthesized nitrogen doped tetrahedral amorphous carbon (ta-C:N) using the filtered cathodic vacuum arc (FCVA) technique. Measurement results showed that intentionally doping with nitrogen reduced the carbon sp3 content, hardness but increased the surface roughness and the critical load. According to Corona-Gomez’s experiments [11], Nitrogen doped DLC (NDLC) was successfully deposited on CoCrMo by ICP-CVD and the effect of nitrogen doping on the film adhesion was investigated by Rockwell C indentation. The results show that nitrogen doping can improve the film adhesion and the wear resistance significantly. Ju, Hongbo et al. [12] added non-metal nitrogen into the molybdenum disulfide solid self-lubricant film using RF magnetron sputtering system and the influence of nitrogen on the microstructure, mechanical, oxidation resistance and tribological properties of the Mo–S–N composite films were investigated. The results show that all Mo–S–N films exhibit higher hardness, oxidation resistance temperature and tribological properties at room temperature, 200, and 400 °C.
In conclusion, the addition of nitrogen into protective coatings proves to be effective for their properties improvement, such as wear resistance, corrosion resistance, oxidation resistance, adhesion strength and tribological property. The study on WCN coatings is relatively few, in comparison with WC coatings. Besides this, the mechanical properties and the influence of nitrogen at room temperature and high temperature of WCN films have not been studied systematically. In this study WCN coatings are deposited by reactive HiPIMS at acetylene/argon (C2H2/Ar) atmosphere with doping different nitrogen content. The elemental concentration, microstructure, mechanical properties, and tribological properties at ambient temperature and high temperature are investigated to examine the effects of the addition of nitrogen. A comparison of the results with those WCN coatings for a reference pure WC sample is also provided.

2. Experiment Details

2.1. Coatings Preparation

WC and WCN coatings are deposited on Si (100) wafers and YT 15 cemented carbide (WC-10 wt.%. Co) disks by using an industrial PVD deposition equipment with hexagonal vacuum chamber, which is about 800 mm high with a side length of 600 mm. The deposition equipment is equipped in a closed field magnetron sputtering with four cathodes through direct water-cooling. One cathode is equipped with a rectangular W70C30 alloy (565 × 115 mm2) and others are installed with blind flanges in this study. Detailed description of the experimental setup is reported in our previous papers [13,14]. Before deposition, the cemented carbide substrates are polished using a metallographic polishing machine (FMP1000Z, Testin Co.,LTD. Dongguan, China) and cleaned by acetone and alcohol in ultrasonic bath for 15 min each. Then the substrates are mounted on a rotary sample holder with a 10 cm distance parallel to the target surface. After that, the chamber is evacuated to below 4.0 × 10⁻⁴ Pa. The W70C30 target then is cleaned in Ar with the discharge pressure of 0.8 Pa for 20 min. In order to remove the contaminations and oxide layer on the surface, the substrates are also sputter-cleaned by using the glow discharge of Ar at −800 V for 25 min.
The HiPIMS power supply for WC target is operated in constant voltage mode and the peak target voltage is maintained at −800 V. The voltage before pulse kept at −400 V and drops after the discharge to −200 V then rise up to −400 V during the pulse off time, this design is in order to make the target easier to glow and to improve sputtering efficiency. During the deposition, the pulse duration and frequency of the power supply are 100 μs and 200 Hz, corresponding to duty cycles at 2%. The bias voltage of substrates is fixed at −80 V. The deposition temperature is maintained at 150 °C. The deposition time of all the WC/WCN coatings is fixed at 30 min. The only variable is the addition flow rate of nitrogen. Nitrogen added to the constant Ar flow in 8 sccm increments ranges from 0 sccm to 24 sccm. The working pressure increases from 0.8 Pa to 0.92 Pa by adding nitrogen. The sputtering details and deposition parameters are listed in Table 1.

2.2. Characterization

The target voltage and target current are measured by a high voltage differential probe and a passive probe, and recorded by a digital oscilloscope (OSC, RTE1052, Rhode & Schwartz, Munich, Germany). An optical emission spectrometer (OES, Ocean Optics Ltd., Dunedin, FL, USA, HR4000CG-UV-NIR) positioned in front of observation window is used to monitor the plasma species and relative quantities at various flow rates of nitrogen during deposition. The collimated optical fiber port was installed vertical to the target surface with a distance of 30 cm. Schematic diagram of the deposition apparatus and OES diagnostic experimental set-up is shown in Figure 1. In order to reduce errors of the collected plasma discharge characteristics, the integral time was set as 100 ms, and every 10 plasma pulses were summed and averaged to obtained presented spectra.
Thickness, surface and cross-sectional morphology of the obtained WC/WCN coatings are evaluated by scanning electron microscopy (SEM, Zeiss, SUPRA55, Carl Zeiss Co.,LTD, Aalen, Germany). Energy dispersive X-ray spectroscopy (EDS) is used to determine the chemical compositions of the coatings and the wear tracks. The surface morphology and roughness with an area size of 10 × 10 μm2 are evaluated by atomic force microscopy (AFM, Veeco, Bruker-ICON, Bruker Co.,LTD, Billerica, MA, USA) by using probe-scanning mode.
The analyses of crystallinity and microstructures are carried out via grazing incidence X-ray diffractometry (GIXRD, D/Max 2500/PC, Rigaku Industrial Corporation, Takatsuki-shi, Osaka, Japan) with an incident angle of 2.0° and a scanning speed of 0.05°/s. X-ray diffractograms of WC and WCN coatings are collected at angles between 10° and 90° with a Cu Kα source (Kγ = 1.5406 Å). X-ray photoelectron spectra (XPS, Ulvac-Phi Inc, PHI Quantera II, ULVAC-PHI Corporation, Chigasaki, Kanagawa, Japan) equipped with a mono-chromatic Al Kα radiation at the 1486.7 eV source is used to analyze the chemical compositions and bonding state of the deposited coatings. The XPS measurement is performed in constant analyzer energy mode with a 20-eV pass energy (take of angle: 45°, step size: 0.1 eV) for high-resolution spectra at a base pressure of 4 × 10⁻⁸ Pa. Prior to the analysis, the samples are pre-sputtered by Ar ion bombardment for 180 s to remove surface contamination. All the XPS spectra fittings are performed following a Shirley background subtraction with the Gaussian-Lorentzian peak shape.
Nanoindentation measurements are carried out via a nanoindenter (Nano-Indentor G200, Agilent, KLA-Tencor Corporation, Milpitas, CA, USA) equipped with a Berkovich diamond tip in continuous stiffness measurement (CSM) mode. The maximum load, loading resolution and rate are chosen as 10 mN, 50 nN and 0.23 mN/s. To avoid the influence of indentation size effects and the substrate, the maximum indentation depth of 300 nm (<10% of the coating’s thickness) is selected. Each sample is tested for 10 times to minimize possible errors. The hardness (H) and Young’s modulus (E) are evaluated by indentation curves according to Oliver and Pharr’s equation [15].
To investigate tribological properties of the deposited coatings, friction and wear tests are performed in a high-temperature ball-on-disk tribometer (Bruker, UMT-3, Bruker Co., LTD, Billerica, MA, USA) at room temperature of about 25 °C and elevated temperature of 400 °C with initial relative humidity of 60% respectively. The applied load is set as 8 N, the sliding speed at 0.1 m/s and the sliding radius at 4 mm. Al2O3 balls of 6 mm diameter are selected as the counterpart due to its chemical inertness and do not react with the coating material. The wear tests are operated in rotating mode with the sliding time of 3600 s. Wear tracks on coating surface are observed by SEM and laser confocal scanning microscope (LCSM, OLYMPUS, OLS4100, Olympus Corporation, Shinjuku, Tokyo, Japan). The normalized wear rates (mm3/Nm) are calculated by cross-sectional profiles of disk-wear track obtained with the surface contact profilometer (Bruker, DEKTAK XT, Bruker Co., LTD, Billericacity, MA, USA).

3. Results and Discussion

3.1. Plasma Discharge Characteristics

Figure 2 presents the evolution of the target voltage and discharge current waveforms with the nitrogen gas flow during the HiPIMS process. It can be seen that with the increase of the nitrogen gas flow rate from 0 to 24 sccm, the target voltage remains stable (Figure 2a) while the peak discharge current first rises up from 61.5 A at 0 sccm to 77.6 A at 16 sccm, then decreases to 61.6 A at 24 sccm (Figure 2b). The changes in discharge current with increasing nitrogen flow rate could be explained as follows. Target current is directly proportional to the quantity of particles participating in sputtering. The total working pressure increases with increasing inflow nitrogen, which leads to more collision and produces more ions [15]. These producing ions accelerate toward the target under electric field, which causes more ions bombardments resulting in increased discharge current and higher materials sputtering rates. However, as the nitrogen flow rates further increases, exceeding the rate of consumption, excessive reactive gas will lead to target poisoning and form a stoichiometric film at WC target surface. The resistance of the formed compound film is much higher that of pure alloy target, which leads to the accumulation of positive charge on target surface and preventing further ion-bombardment [16]. This results in decreases in the number of sputtered particles and a lower peak discharge current [17]. Moreover, with the increasing quantities of gas molecule, the collisions become more and more frequent, which causes a much shorter mean free path and insufficient kinetic energies of the colliding particles. This, in turn, leads to decreases of sputtered particles and peak discharge current [18,19].
As a signal representing the species and densities of plasma and the degree of target poisoning in reactive HiPIMS process, the optical emission spectra are collected within set integration time continuously to examine the influence of the addition of nitrogen. The average spectral line intensities calculated over several HiPIMS pulses and their afterglow as a function of the nitrogen gas flow in the range of 200–1000 nm are displayed in Figure 3. The spectral dates of emission lines are presented in Table 2. It is obvious that the addition of nitrogen gas leads to significant changes in plasma characteristic spectrum. With the increase of nitrogen gas flow, the intensities of the emission lines originated from the W I (W0), N I (N0), Ar I (Ar0), and Ar II (Ar+) first increase and then decrease, the emission intensity of the C I (C0) lines decrease. The emission characteristics changes with increasing nitrogen gas flow could be explained as follows. In magnetron sputtering (HiPIMS), the intensity of emission lines is positive correlation with the number density of emitting atoms, which is determined primarily by electron-driven processes such as electron impact excitation of the atom in its electronic ground state and of an excited metastable level that lies energetically below the emitting level. The formation rate of ionized and excited atoms via electron-driven processes depends essentially on three parameters, the electron temperature (Te), the electron density at a given electron energy (ne) and the density of the respective atoms (N) [20]. As to W I (W0), N I (N0), Ar I (Ar0), and Ar II, when the nitrogen gas flow increases, (i) the number of atoms involved in sputtering increases result in the increasing frequency of collisions between particles, which in turn produce more secondary electrons. These secondary electrons conduced more Ar atoms to ionize. (ii) Some of the ionized nitrogen atoms rush toward and impact the target under the attraction of cathode and lead to more tungsten atoms being sputtered out. So, the intensities of W I (W0), N I (N0), Ar I (Ar0) and Ar II (Ar+) emission lines increase. As the nitrogen gas flow further increases, more collisions will occur and lead to a shorter mean free path, which in turn results in lower ions’ kinetic energy [15,21]. The insufficient kinetic energy reduces the ionization and excitation rate of particles. Meanwhile, excess reaction gas can lead to target poisoning, which will also reduce the intensity of the elements emission lines [22,23]. As to C I (C0), the addition of nitrogen gas leads to a reduction in the collision probability and ionization rate of C atoms, thus reducing the spectral strength.

3.2. Microstructure and Morphology

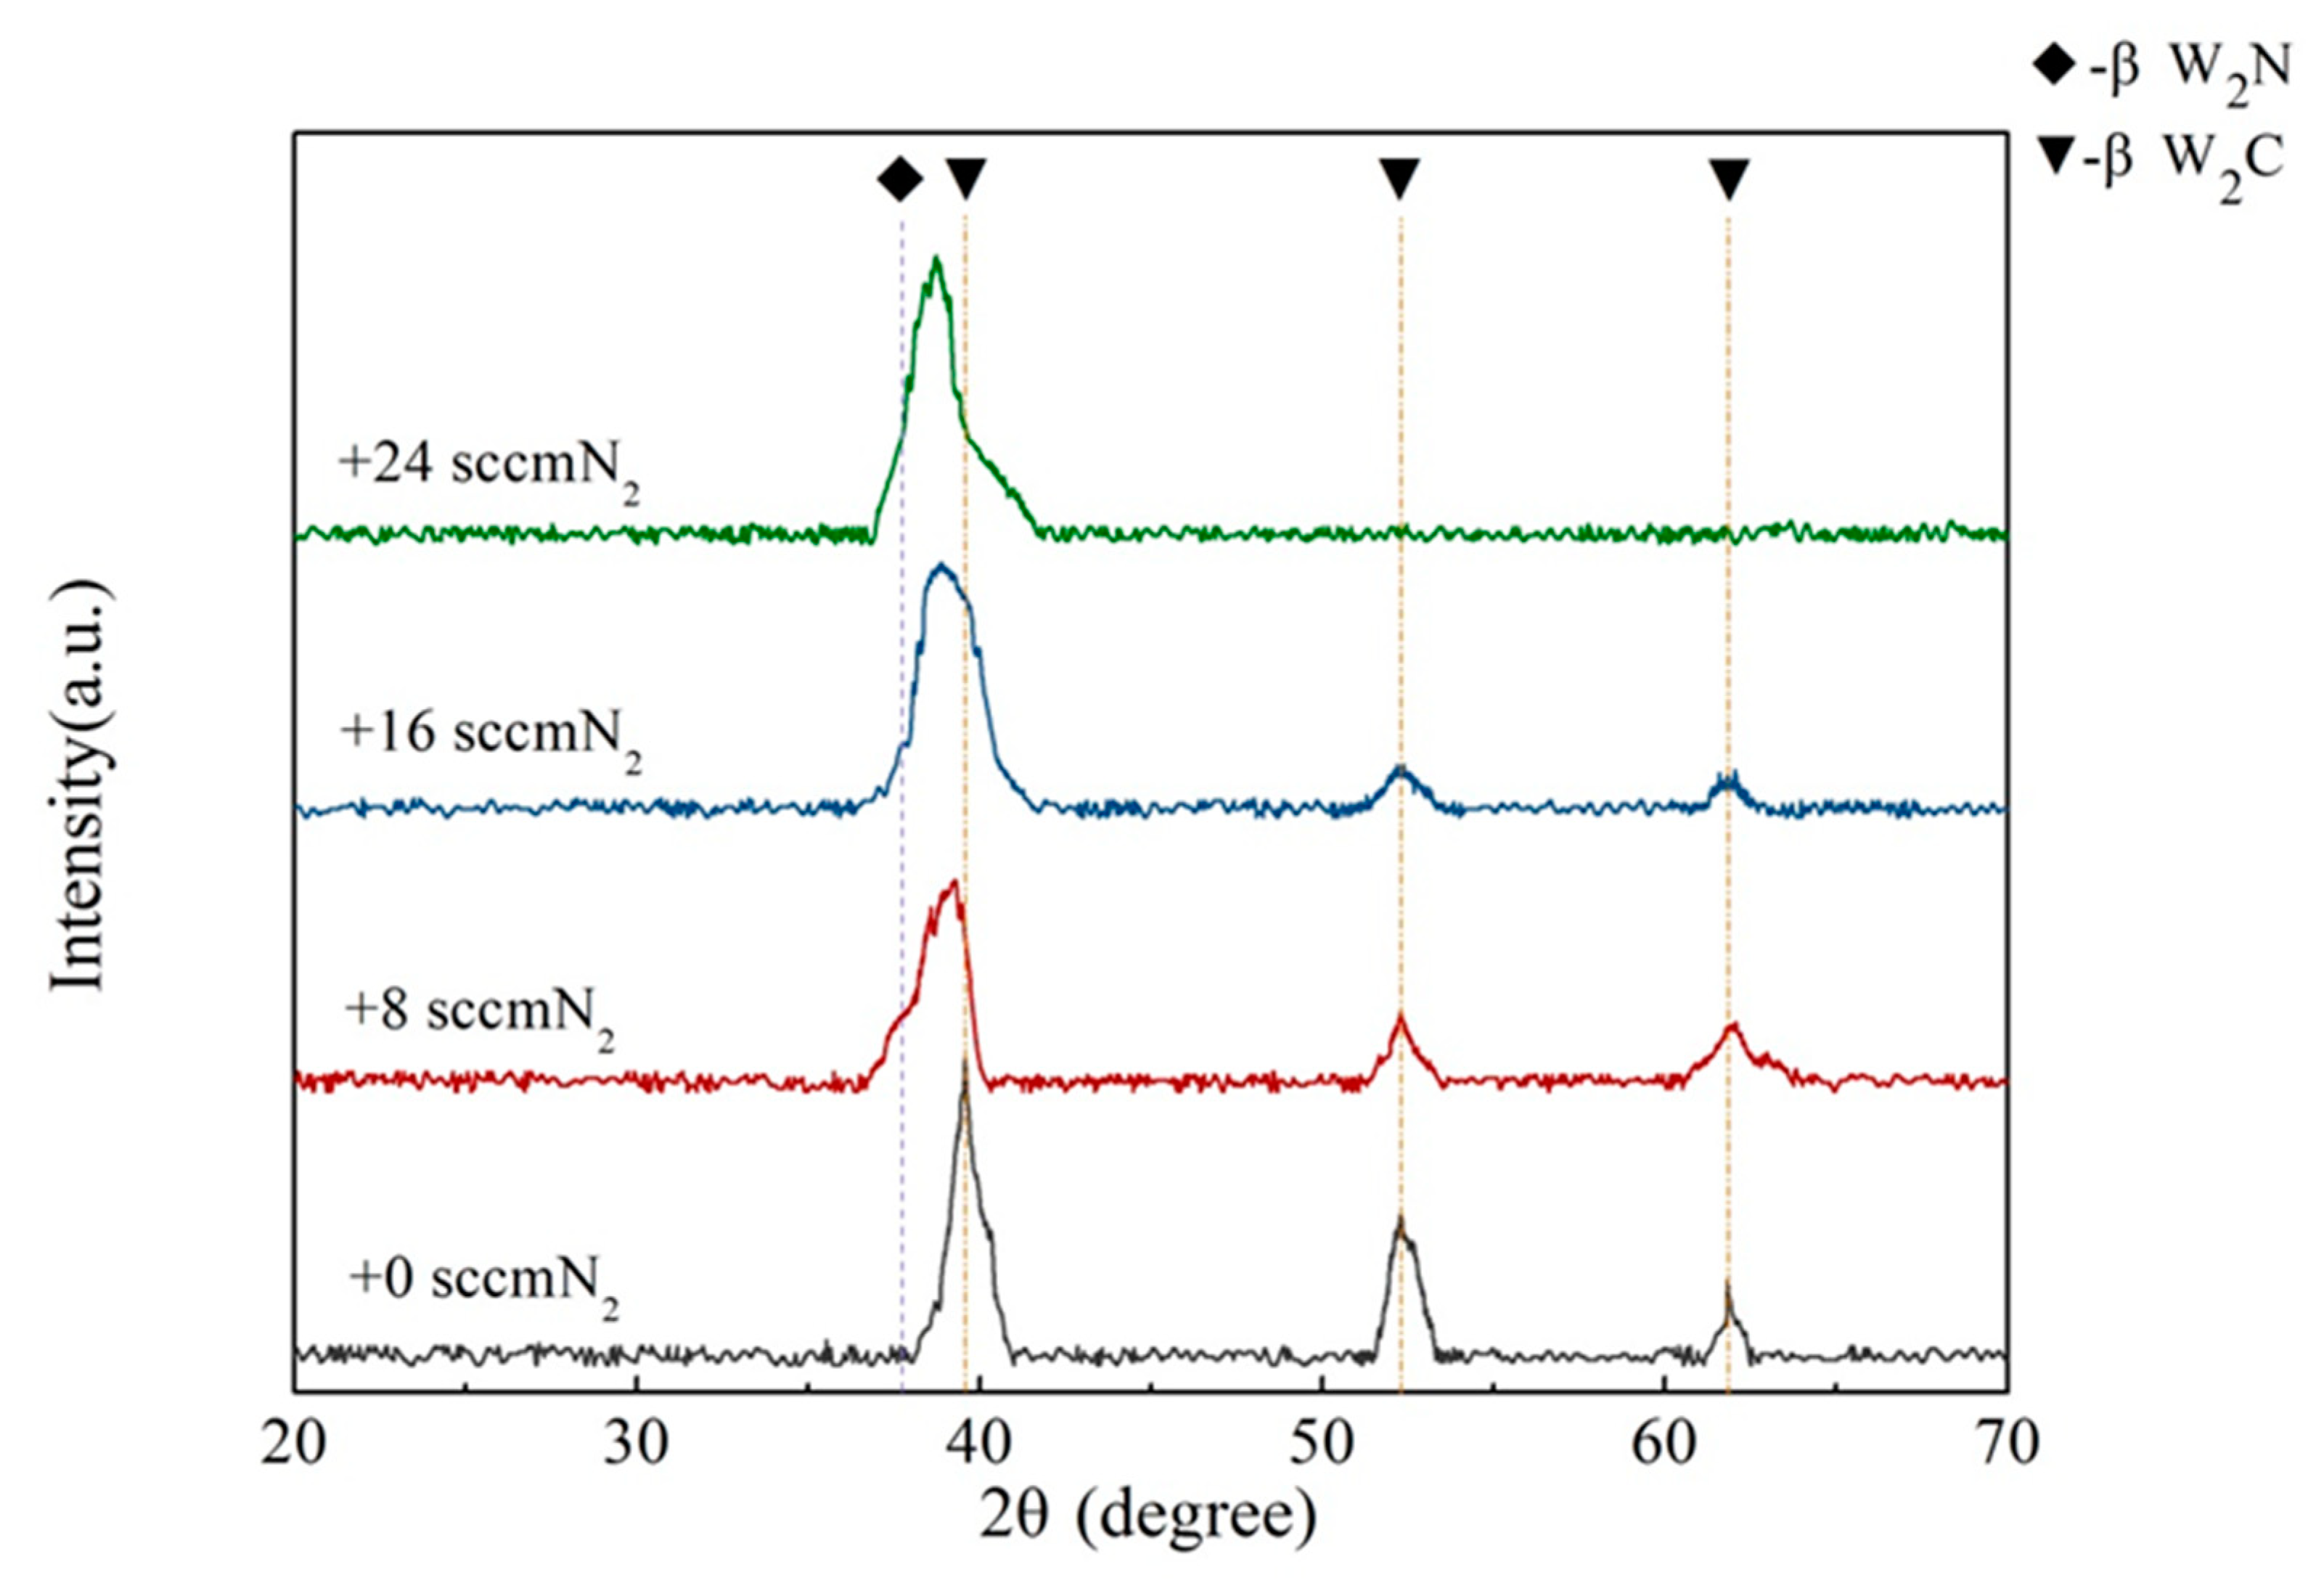
Figure 4 presents the XRD diffractograms of WC coating and WCN coatings using HiPIMS with different addition of nitrogen gas. The WC coating (with 0 sccm N2) exhibited the diffraction peaks at 2θ~39.57°, 53.30°and 61.85° corresponding to multiple orientations of (101), (102) and (110) respectively, characteristic of rhombohedral β-W2C phase [JCPDS data file card #35-0776]. With the addition of nitrogen, (101) diffraction peak of the deposited coatings shift to low angle (get closer to (111) diffraction peak of face-centered cubic (fcc) β-W2N [JCPDS data file card #25-1257]), which could be attributed to (111) preferential orientation of face-centered cubic (fcc) β-W(CN) phase whose positions lie intermediate between those for bulk W2C and W2N phases according to other researchers’ work [24,25,26]. Moreover, with the nitrogen flow increasing, the (102) and (110) peaks’ intensities and the angle of (101) peak of β-W2C phase decrease to disappear, indicating the nitrogen atoms could replace carbon atoms in the lattice of β-W2C to form β-W(CN) crystallites gradually. Furthermore, no visible peaks of W2N crystalline phase are observed, also suggesting that no pure W2N phase is formed and the added nitrogen atoms are likely incorporated in the FCC lattice of W(CN) phase [24].
To analyze the W2C, W2N and W(CN) phases, the average grain size is calculated from the full-width-half-maximum (FWHM) of (101) and (111) diffraction peaks using the Debye–Scherrer equation. The broadening of peaks reflects a decrease of the average grain size from 8.9 nm to 6.4 nm with the N2 flow rate increasing from 0 sccm to 24 sccm. Reasons for decrease of grain size of the deposited coatings are as follows: (i) With the addition of nitrogen gas, the densities of particles participating in the sputtering and arriving at the substrate becomes higher, which result in random interruptions of the growing grains and then induces more sites promoting secondary nucleation. (ii) The enhanced bombardment density of high-energy gas particles promotes grain boundary migration and leads to point defects that favor nucleation [27,28]. (iii) With the increasing addition of nitrogen, the total working pressure increases, which leads to more frequent collisions and lower kinetic energy carried by the bombarding ions may also be a reason for grain refinement [29].
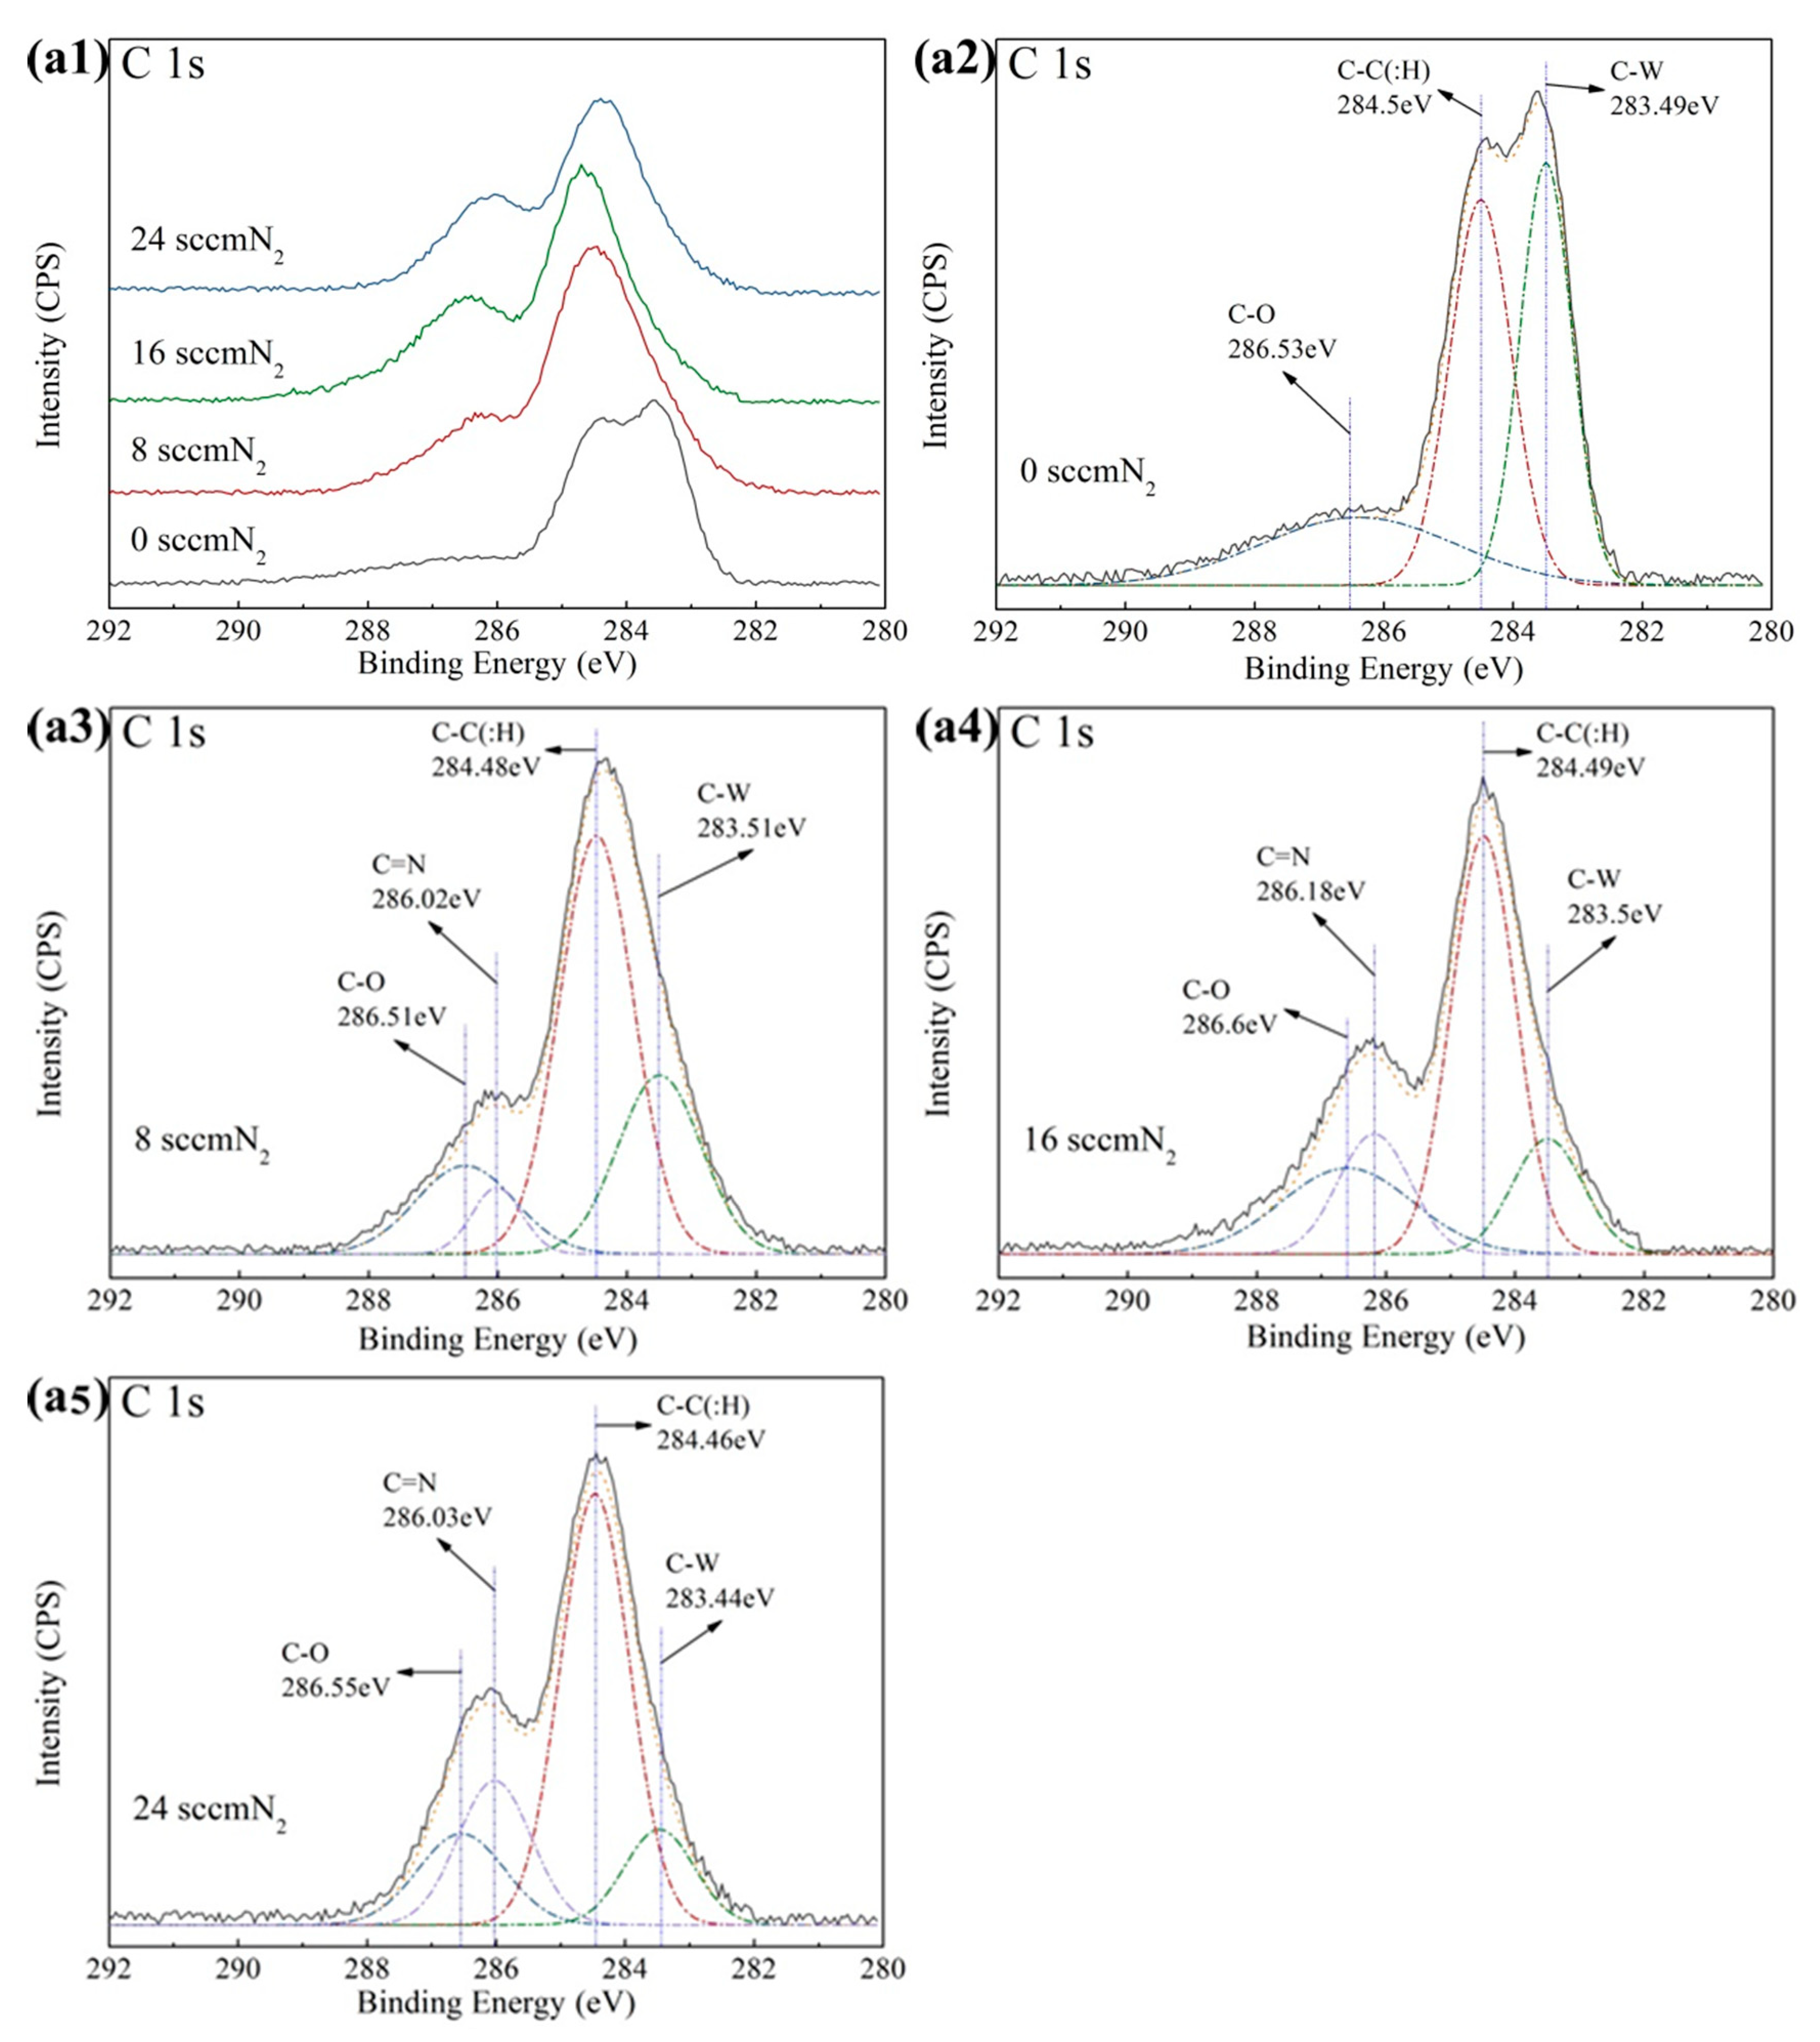
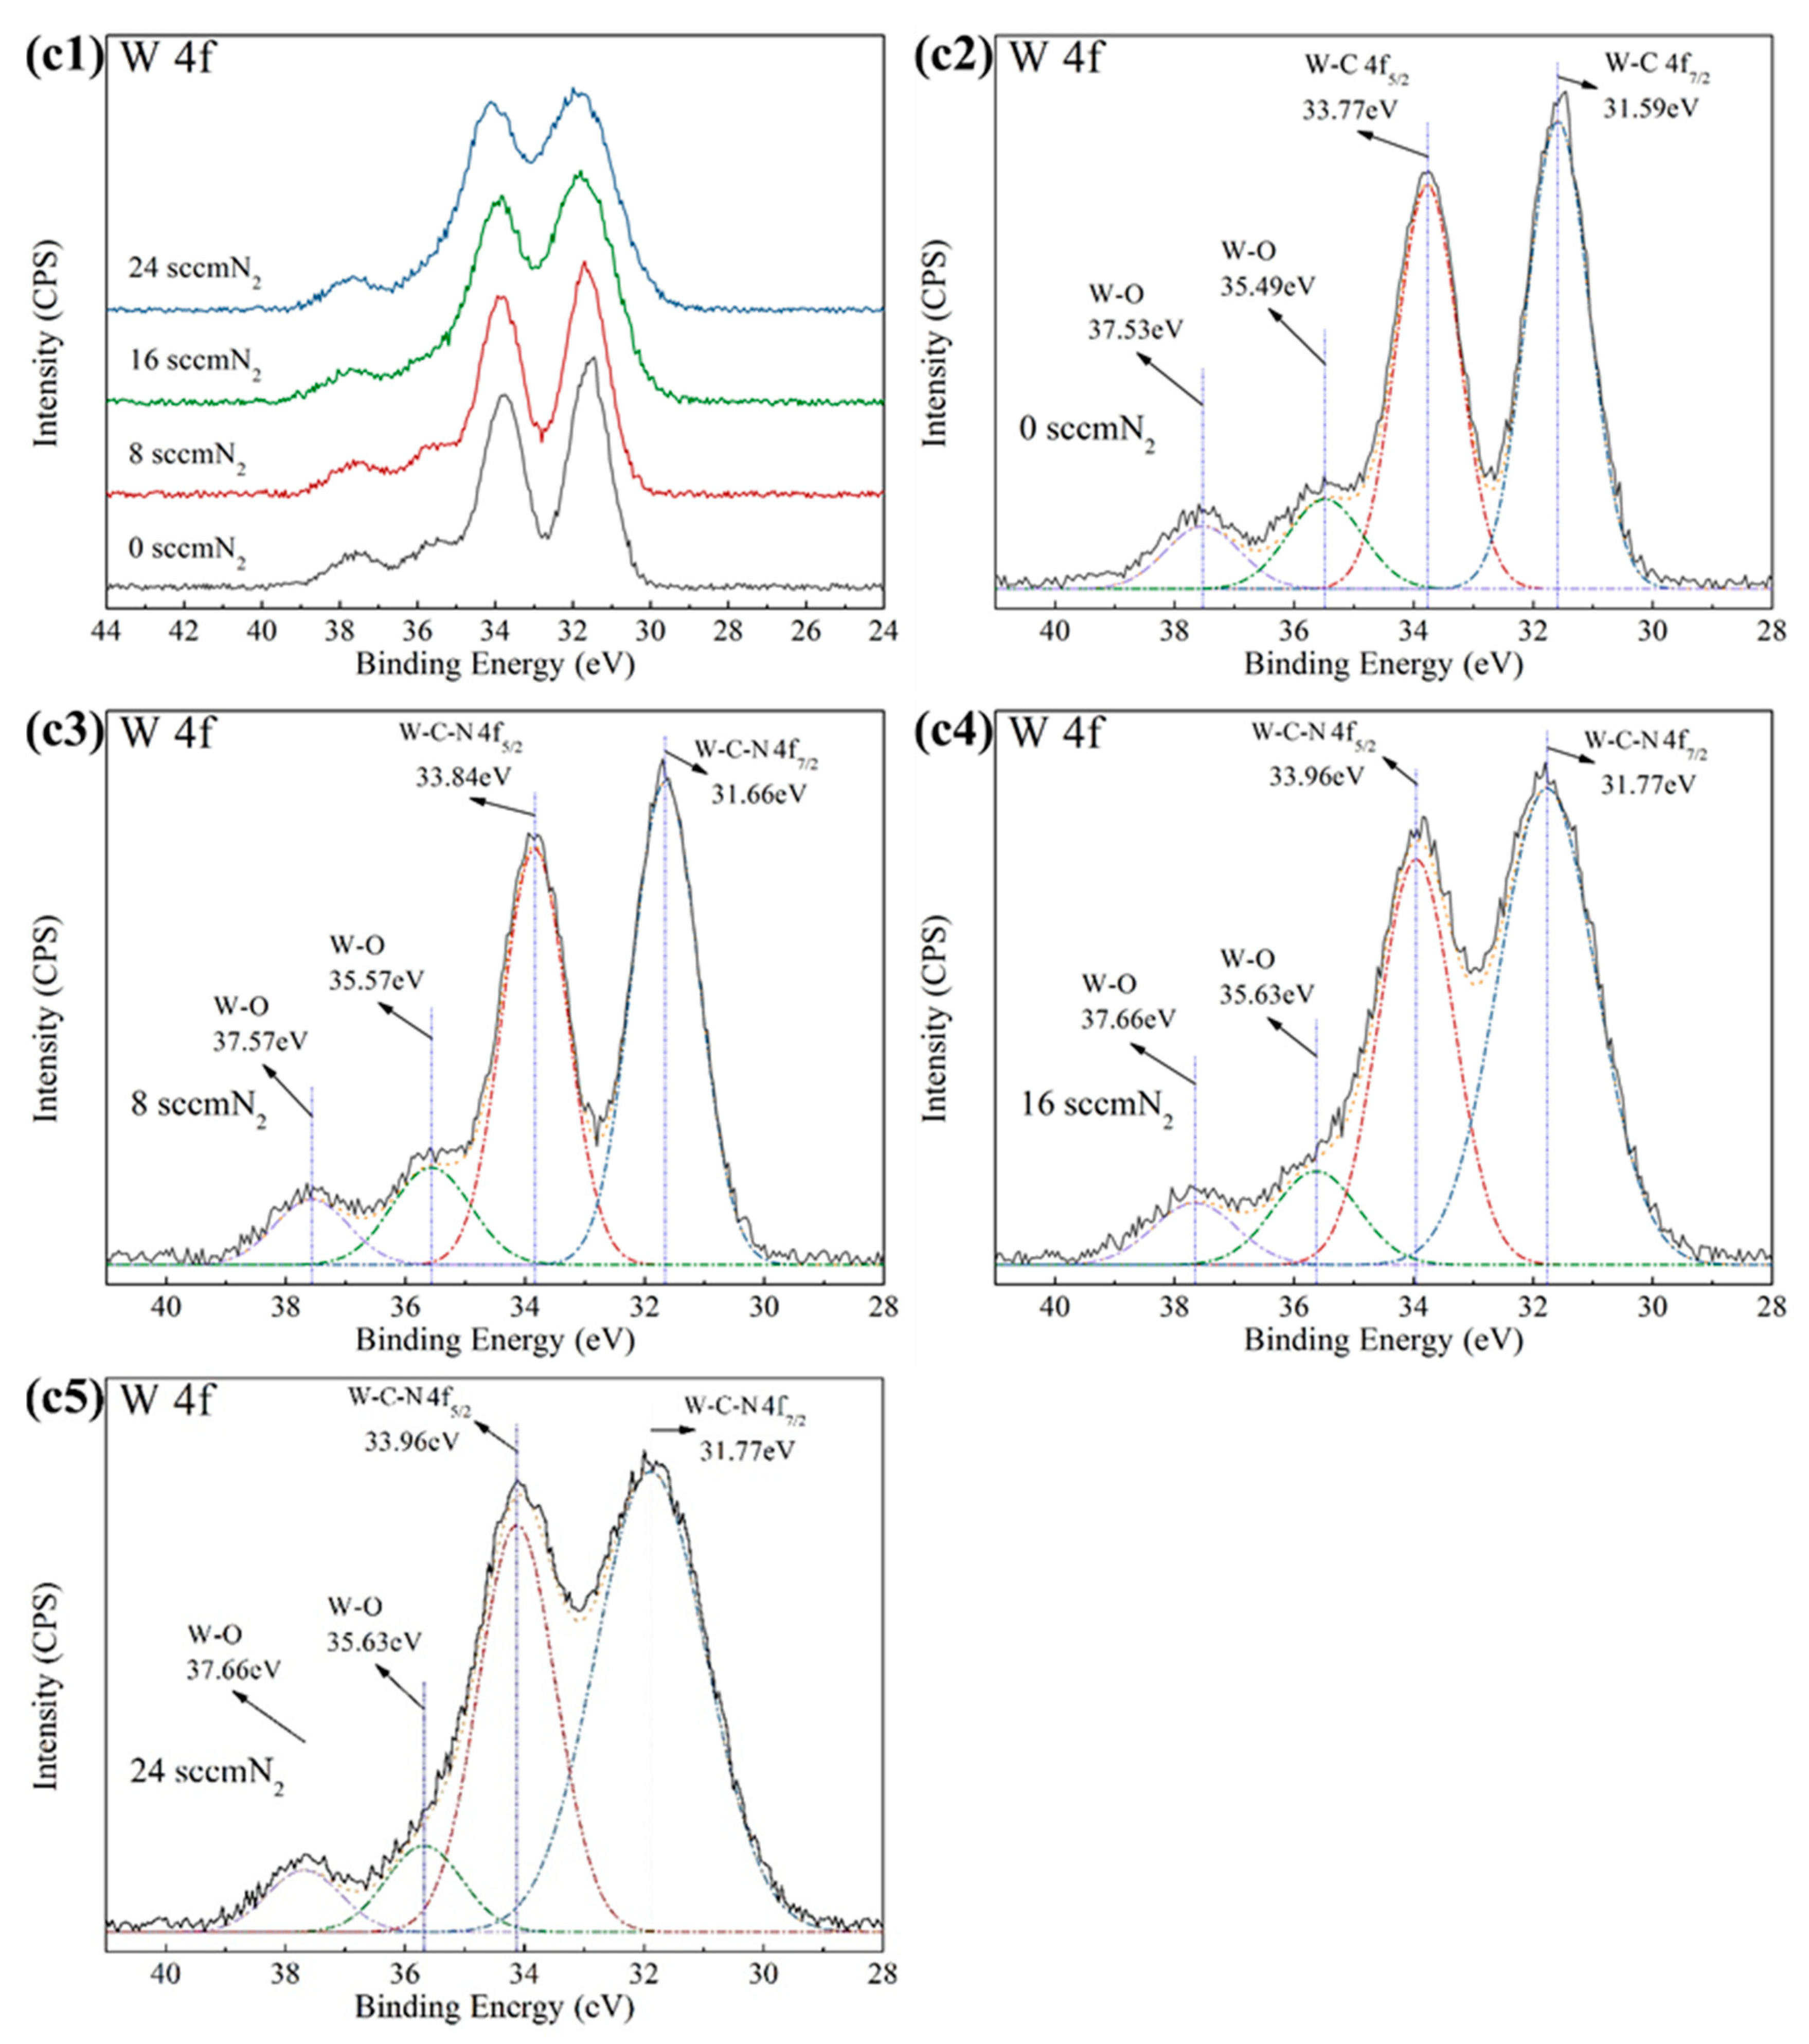
In order to acquire further information about crystalline phases and bonds structure of the deposited coatings, high-resolution XPS spectra of C 1s, N 1s and W 4f were deconvoluted, respectively. C 1s peak at 284.6 eV was used as a reference to calibrated the spectra [30,31]. Figure 5 shows the XPS core-level spectra, in which Figure 5a1,b1,c1 are overall spectra and Figure 5a2–a5,b2–b5,c2–c5 are detail spectra in the energy region of C 1s, N 1s and W 4f for the deposited coatings with different nitrogen flow rates. As shown in Figure 5a2, the fitted C 1s spectrum centered at 283.5 ± 0.1 eV, 284.5 ± 0.1 eV and 286.5 ± 0.1 eV are recognized as C–W, C–C(:H) and C–O [26,32,33,34]. The presence of free oxygen might from residual oxygen in the vacuum chamber during the coatings’ deposition. After the nitrogen pumped in, there is a new fitted peak located at around 286.1 ± 0.1 eV emerged in the C 1s spectra (Figure 5a3–a5), which is identified as C=N bonds [26]. And with the increasing of nitrogen flow rate, the intensity of C=N peak increases while the intensity of C–W peak decreases. The variation tendency of carbon bondings is in good agreement with the studies of other researchers [32,35].
In the N 1s XPS spectra (Figure 5b1–b5), the pure WC coating (Figure 5b2) shows no useful information. As is shown in Figure 5b1, when the N2 flow rate increased from 8 sccm to 24 sccm, the peak intensity of N 1s increased, which was in accordance with the increase of N content in the deposited coatings. And the N 1s spectra in Figure 5b3–b5 show four peaks at 396.9 ± 0.1 eV, 398.1 ± 0.1 eV, 399 ± 0.1 eV and 400.8 ± 0.1 eV, representing W­N, W–C–N, C=N and N–O, respectively [25,26,36,37]. It is worth noting that the ratio of peak intensity of W–N to W–C–N and C=N increases with the increasing N2 flow rate, meaning that more W-N bonds are formed in WCN coatings at higher N concentration.
Figure 5c1–c5 presents the fitted W 4f spectra, it could be seen that W 4f spectra exhibits two components: W 4f7/2 and W 4f5/2 and each component has a doublet structure composed of a high-energy main peak and a low-energy satellite peak. The W 4f7/2 peak located at 31.7 ± 0.2 eV between the binding energies of W–C (31.3 ± 0.1 eV) and W–N (33.1 ± 0.1 eV) is considered as the formation of W–C–N bonds [25,26]. The W 4f5/2 peak at 33.8 ± 0.2 eV is also attributed to W–C–N bonds as reported by R. Ospina [26] and J.F. Moulder [38]. And the appearing peaks at the high binding energies of 35.6 ± 0.2 eV and 37.6 ± 0.1 eV are corresponding to W–O (4f7/2) and W–O (4f5/2), respectively [39]. According to the fitted W 4f spectra, it can be seen W–C–N bonds slightly shift to higher binding energy, which also could be attributed to the formation of W-N bonds with the increase of nitrogen flow rate.
Figure 6 displays the cross-sectional SEM micrographs of WC/WCN composite coatings deposited with different N2 flow rates. It is can be seen with the increase of nitrogen flow rate, the cross-sectional morphologies of deposited coatings change from slight columnar type to a typical dense and featureless structure. Further, as the N2 flow rate increases, the coatings’ thickness increases from 2.64 μm at 0 sccm to 3.32 μm at 16 sccm, then decreases to 2.70 μm at 24 sccm corresponding to the deposition rate which increases from 88.0 nm/min to 110.7 nm/min and then drops to 90.0 nm/min. The deposition rate, chemical compositions, grain size and surface roughness of WC/WCN coatings with different N2 flow rate are shown in Table 3. This change might be explained as follows: (i) When the N2 flow introduced in the deposition is low, with the increase of the addition of N2, the peak discharge current and the deposition power (see in Figure 2) increases, which not only increased the deposition rate, but also led to enhanced fraction of ionized species reaching the growing coating, promoting the mobility of the adatoms and the migration of particles to the grain boundaries and the interruption of columnar structure, consequently, raising a spontaneous compact morphology. (ii) The getter effect in the reactive sputtering: the deposited coatings absorb the reactive gas and the deposition rate increases [40,41]. (iii) When the N2 flow rate increased further, excessive reactive gas leads to target poisoning, which reduces the sputtering of the targets and the peak discharge current. Therefore, the deposition rate decreased with the increased N2 flow rate.
As is shown in Table 3, with the increasing input nitrogen gas, the N content increased from 0% to 19.2 at.%. And the composition of W/C ratio in the deposited coatings was below 2.33 (7:3) which is the ratio of the target and decreased with the increasing N2 flow rate. This phenomenon is attributed to target poisoning and preventing the escape of metal W atoms from WC target surface.
In order to see the variation of surface morphology and surface roughness with the N2 flow rate, the three-dimensional topographic AFM images of WC/WCN coatings deposited onto silicon (100) wafers with different nitrogen gas flow are compared in Figure 7. It is obvious that all coatings have a granular structure with visible, agglomerated grains and the grain size decreases with the increase of the nitrogen gas flow, indicating a smoothing trend of the coatings’ surface. The surface roughness of the coatings decreases from Ra 11.6 nm at 0 sccm to Ra 5.7 nm at 24 sccm. The decreases of surface roughness can be attributed to the addition of N to W2C and promotes the continuous nucleation process leading to the grain refinement, which is in agreement with the variation tendency of grain size.

3.3. Mechanical and Tribological Properties

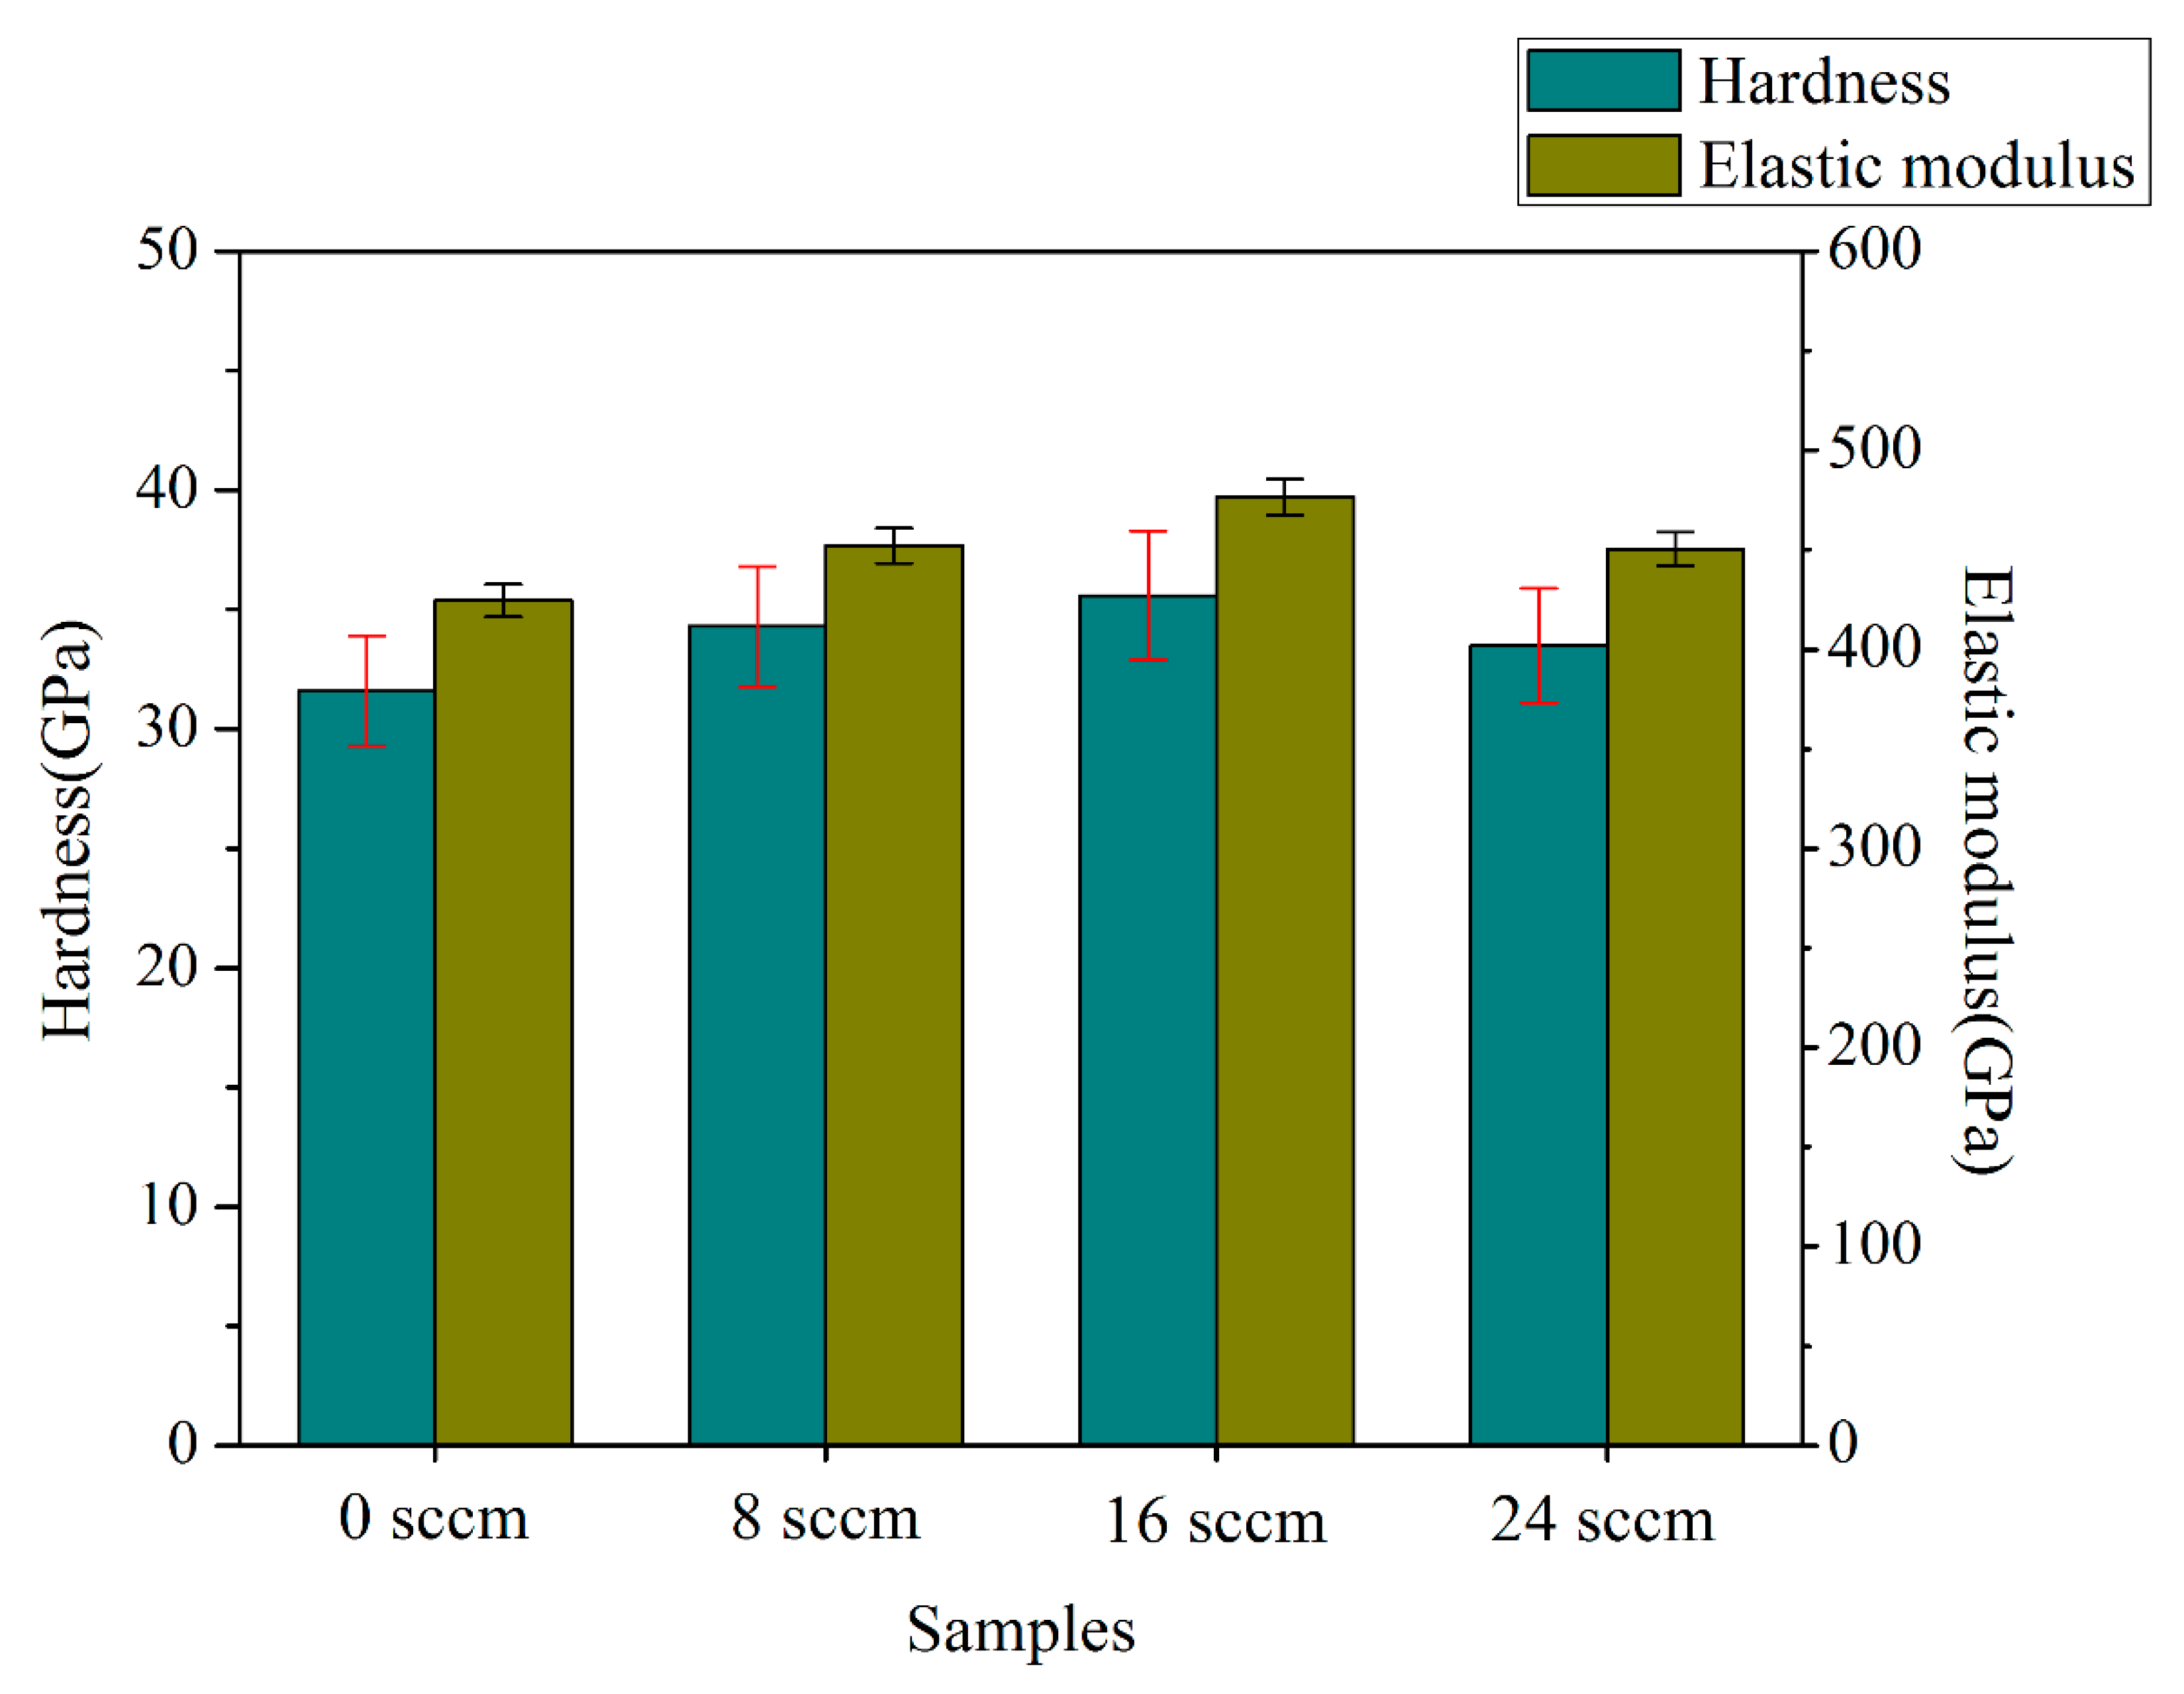
Figure 8 displays the hardness (H) and elastic modulus (E) of WC/WCN coatings deposited with different N2 flow rate. As is shown, the hardness and elastic modulus first increases then decreases with the increase of N2 flow rate, and peaked at 35.6 GPa and 476.5 GPa at 16 sccm, respectively. The variation of hardness is mainly attributed to the effect of solid solution strengthening and the grain refinement caused by the incorporation of nitrogen atoms [24,25]. Further increasing the N2 flow rate to 24 sccm, the hardness and elastic modulus decrease to 33.5 GPa and 450.4 GPa, respectively, mainly due to the increase in the content of amorphous CNx according to the result of XPS.
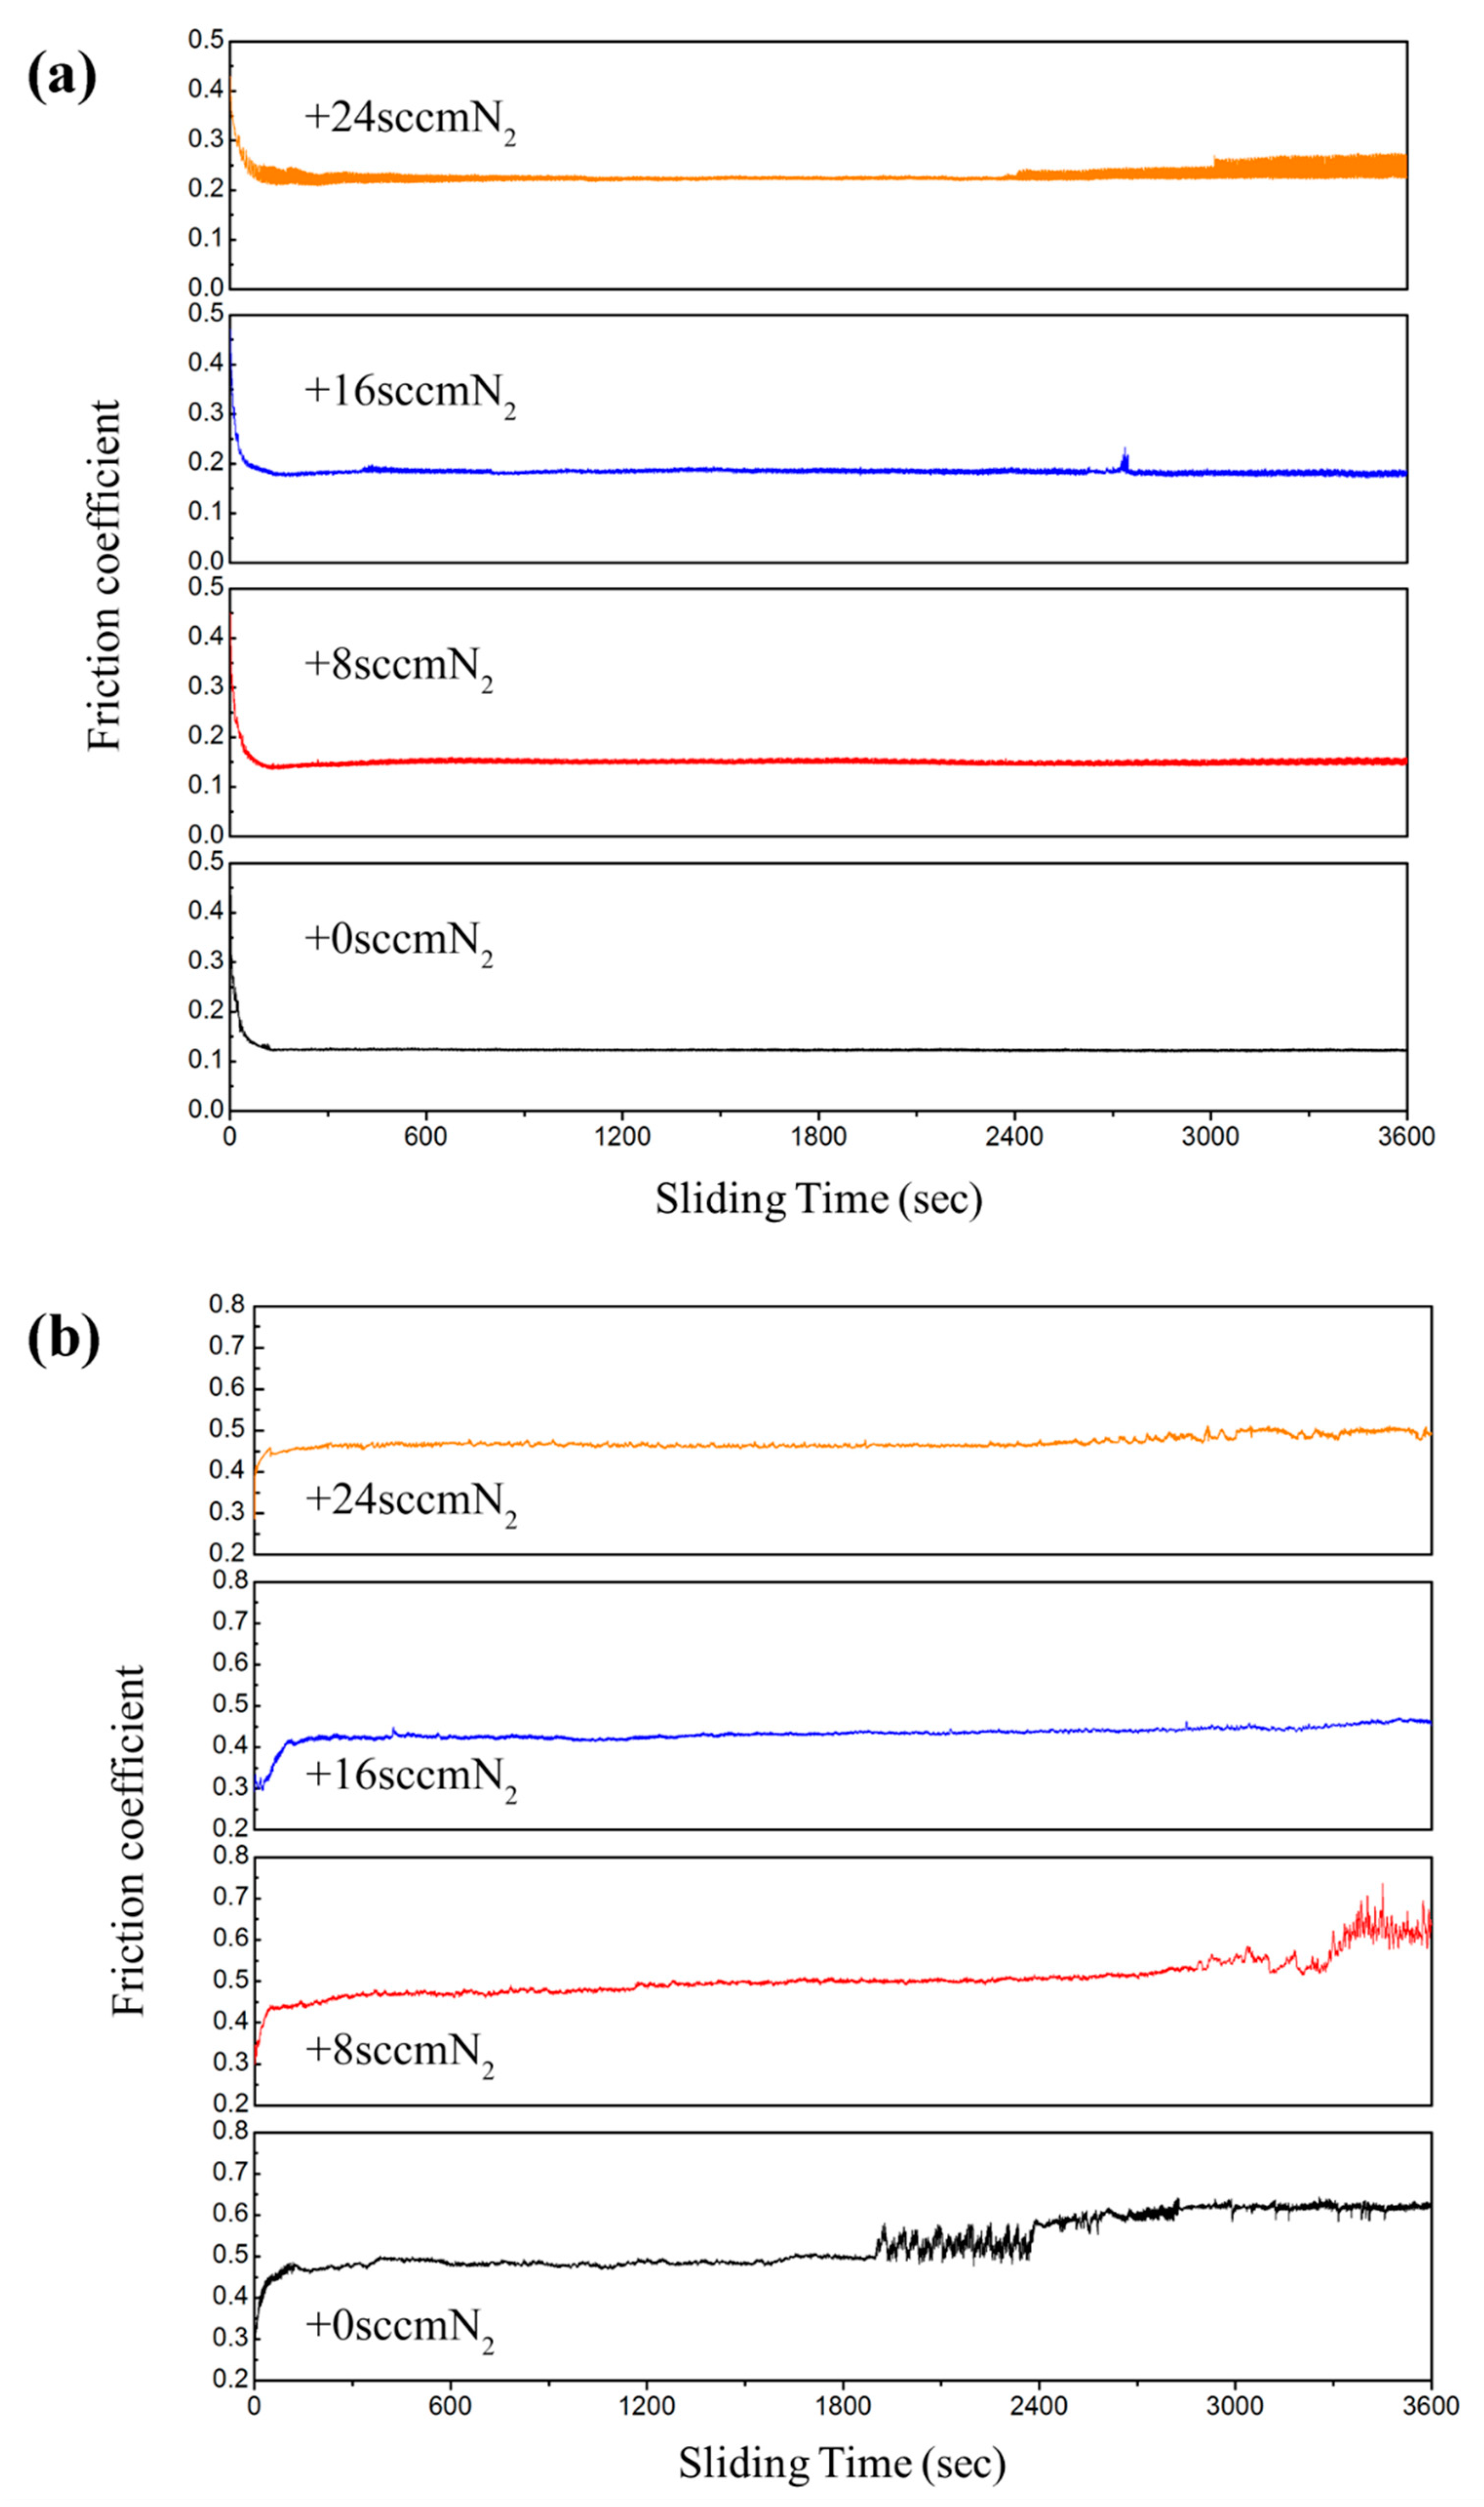
The coefficients of friction (COF) of WC/WCN coatings deposited with different N2 flow rate as a function of reciprocating sliding time under dry contact at the room temperature (25 °C, Figure 9a) and elevated temperature (400 °C, Figure 9b) are exhibited in Figure 9. As is shown in Figure 9a, the values of friction coefficient at RT become stable at approximately 0.12, 0.15, 0.18, and 0.23 after a rapid decrease in the initial running-in phase. As reported [42], the high friction coefficient of running-in period is mainly related to the defects on the coating surface and high abrasive forces acting at the sliding interface. Higher nitrogen fluxes lead to higher and less stable friction coefficients in the steady-state. It is clear that the addition of nitrogen affects friction coefficients. All the coatings are not thoroughly worn out in the end of the wear test since the friction coefficients remain approximately constant. Moreover, it is worth noting that the friction coefficient of the coating deposited at 24 sccm fluctuates greater, which indicates the coating partial failure. The friction curves at 400 °C are illustrated in Figure 9b. Different from the room temperature wear test, the friction coefficients increase after running-in stage and the friction coefficients of the coatings at 400 °C are much higher than those at 25 °C, which all could be attribute to the oxidization of coatings at high temperature. The friction curves of the coatings deposited at 0 sccm and 8 sccm increased to approximately 0.6 with large fluctuations after 1900 s and 3200 s, respectively. When increasing the N2 flow rate to 16 sccm, the friction coefficient of the coating remains stable over the entire test range. With a further increase of N2 flow rate, the coating deposited at 24 sccm exhibited a slight fluctuation at the end of the wear test, which indicates the high-temperature tribological properties deteriorate.
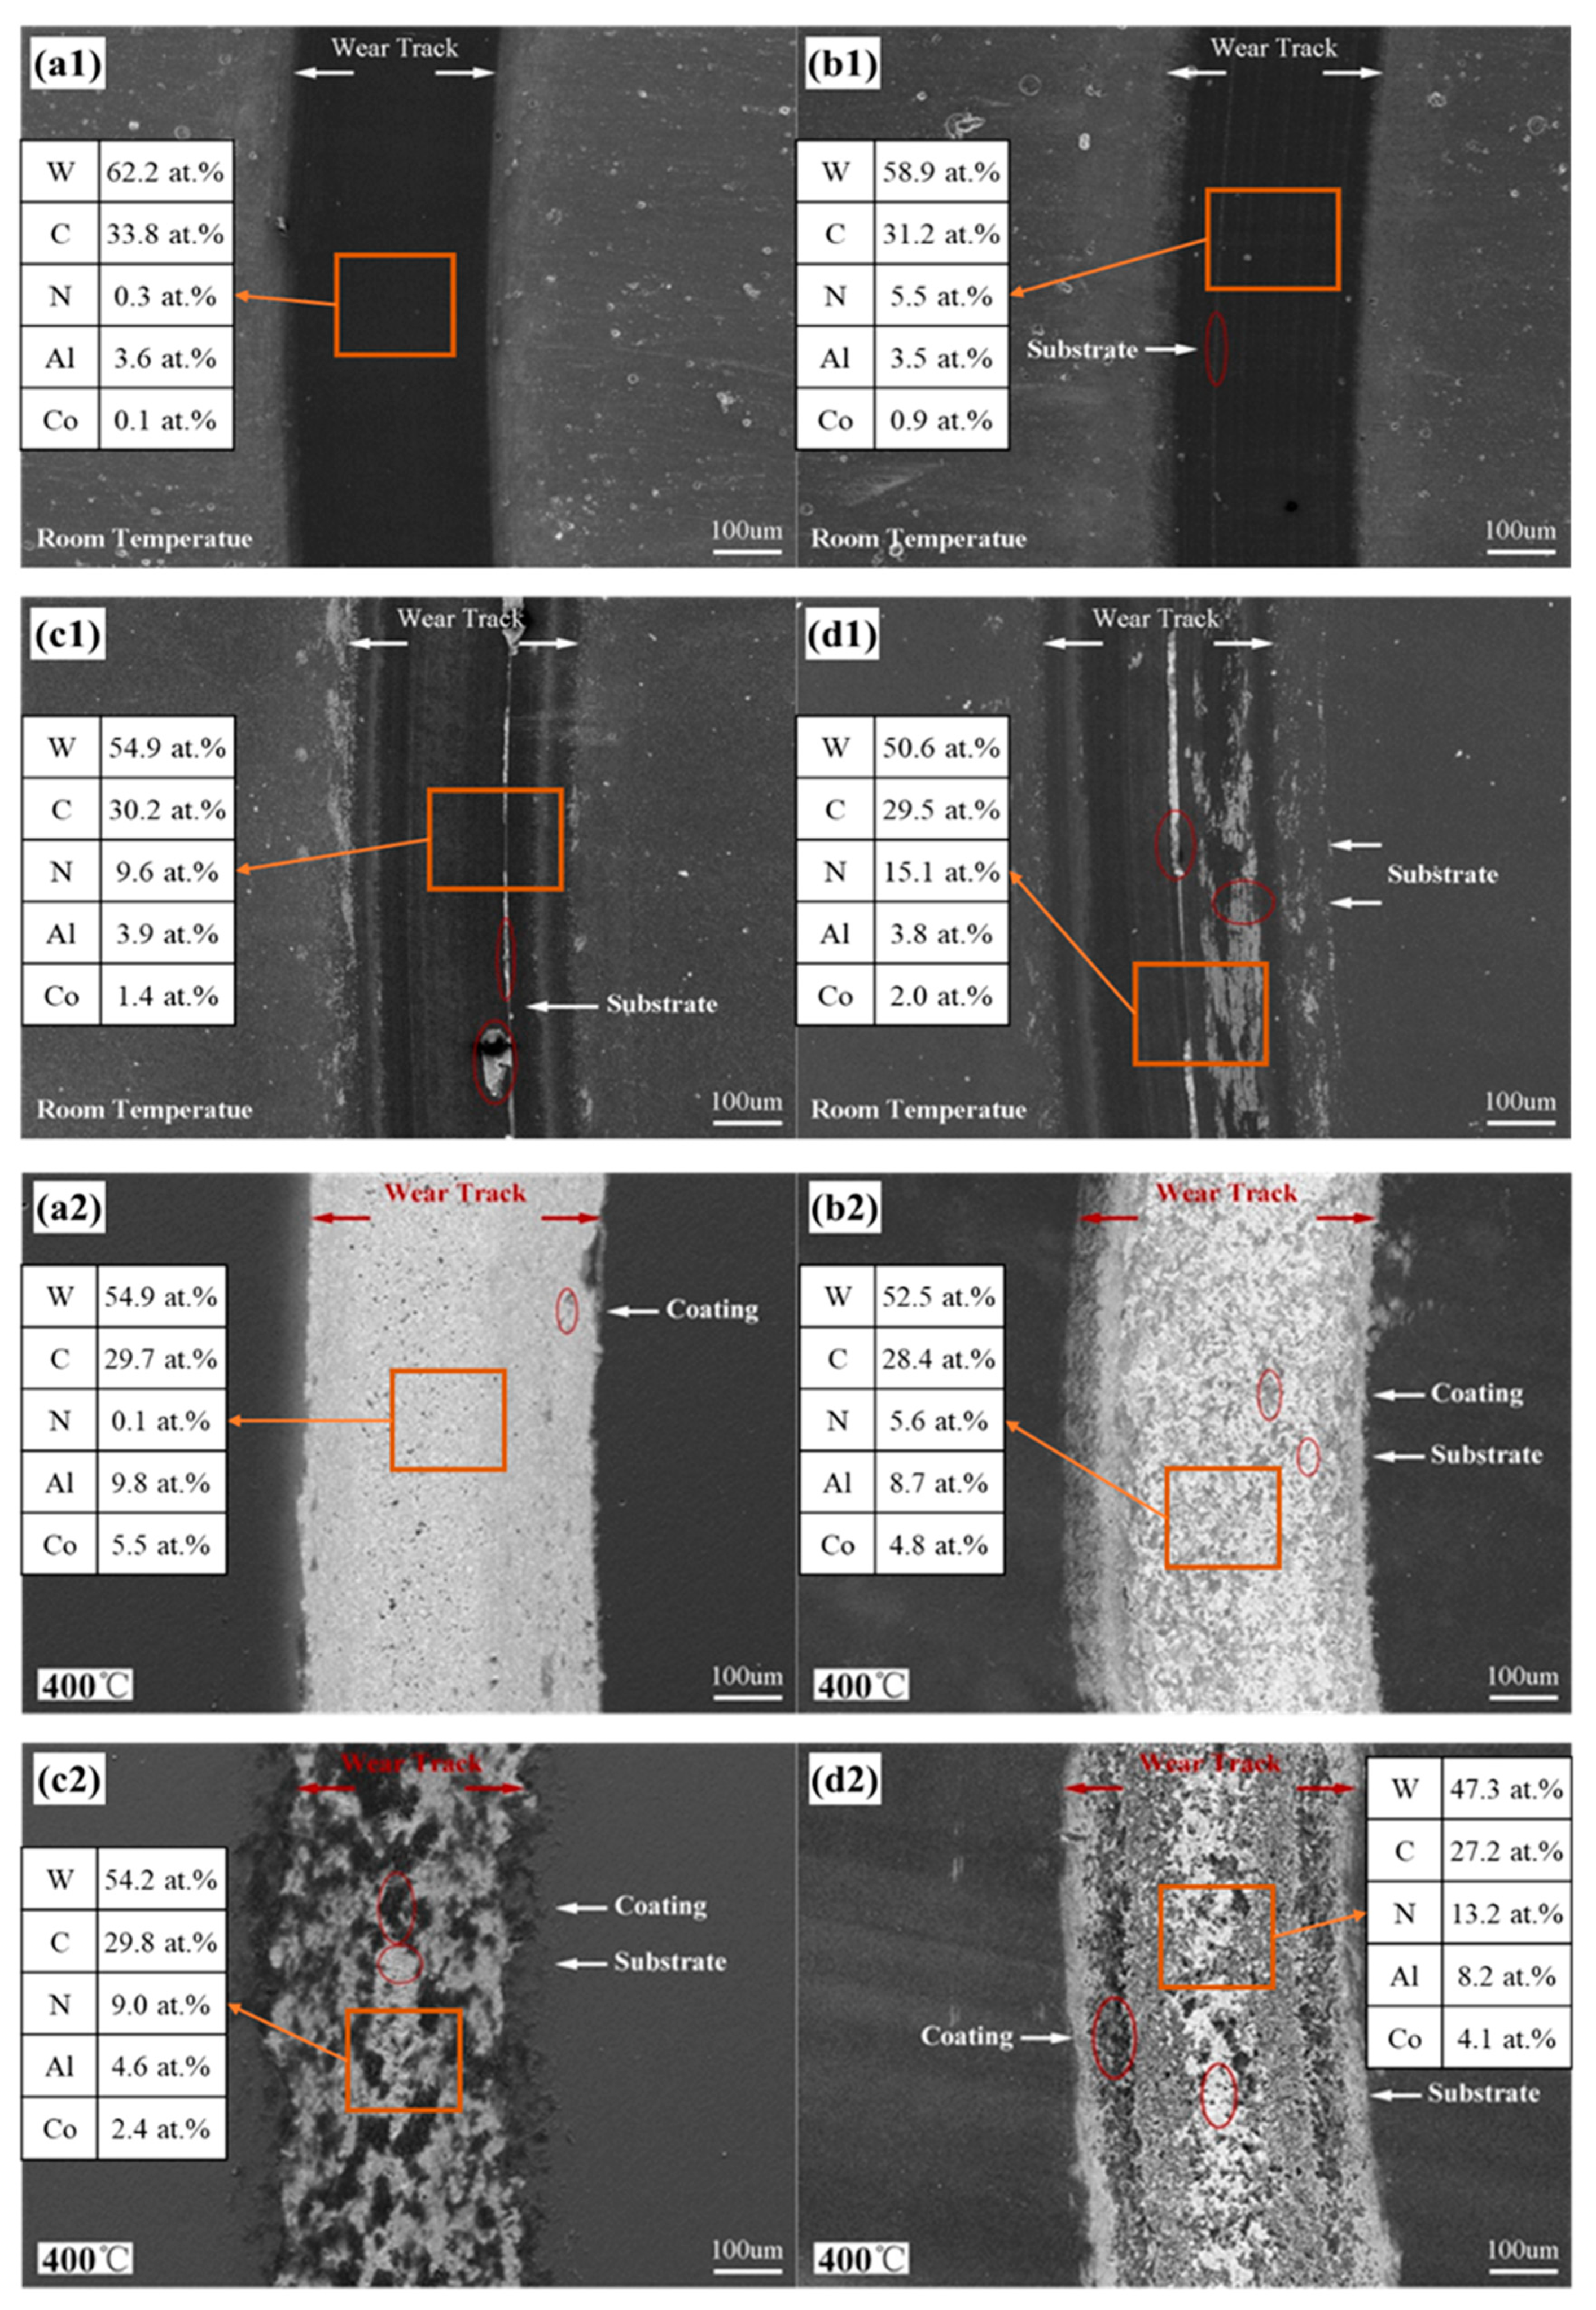
In order to further investigate the friction behaviors of the WC/WCN coatings, the SEM images and EDS analysis obtained by field emission scanning electron microscopy (FESEM) of wear tracks are presented in Figure 10. At 25 °C (Figure 10a1–d1), the wear tracks exhibit a tendency to broaden, and the exposed substrate area on wear tracks has been getting larger, which indicates that the room temperature (25 °C) tribological properties of the coatings deteriorates with the increase of the N2 flow rate. The results of EDS analysis demonstrate the Cobalt content in the center of the wear tracks increases with the increase of the N2 flow rate, this also confirm the exposure of the substrate. In particular, the appearance of aluminum element on the wear tracks is due to the transfer of the materials of the counterpart Al2O3 ball. At 400 °C (Figure 10a2–d2), the width of wear tracks is much wider than that at 25 °C. For the pure WC coating, the wear track is wide with substrate completely exposure. When added 8 sccm N2, the amount of residual coating increased slightly. With the N2 flow rate increases to 16 sccm, the width of the wear track gets narrow and remaining coating on the wear track increased significantly. As the nitrogen gas flow further increases to 24 sccm, the wear track becomes wider and the amount of residual coating decreases, indicating the high temperature (400 °C) tribological properties deteriorates with excess nitrogen gas supply. It can be clearly seen from the EDS results that the Cobalt content in the center of the wear tracks first decreases then increases with the rise of N2 flow rate, which also demonstrates the variation trends of the high temperature tribological properties of the coatings.
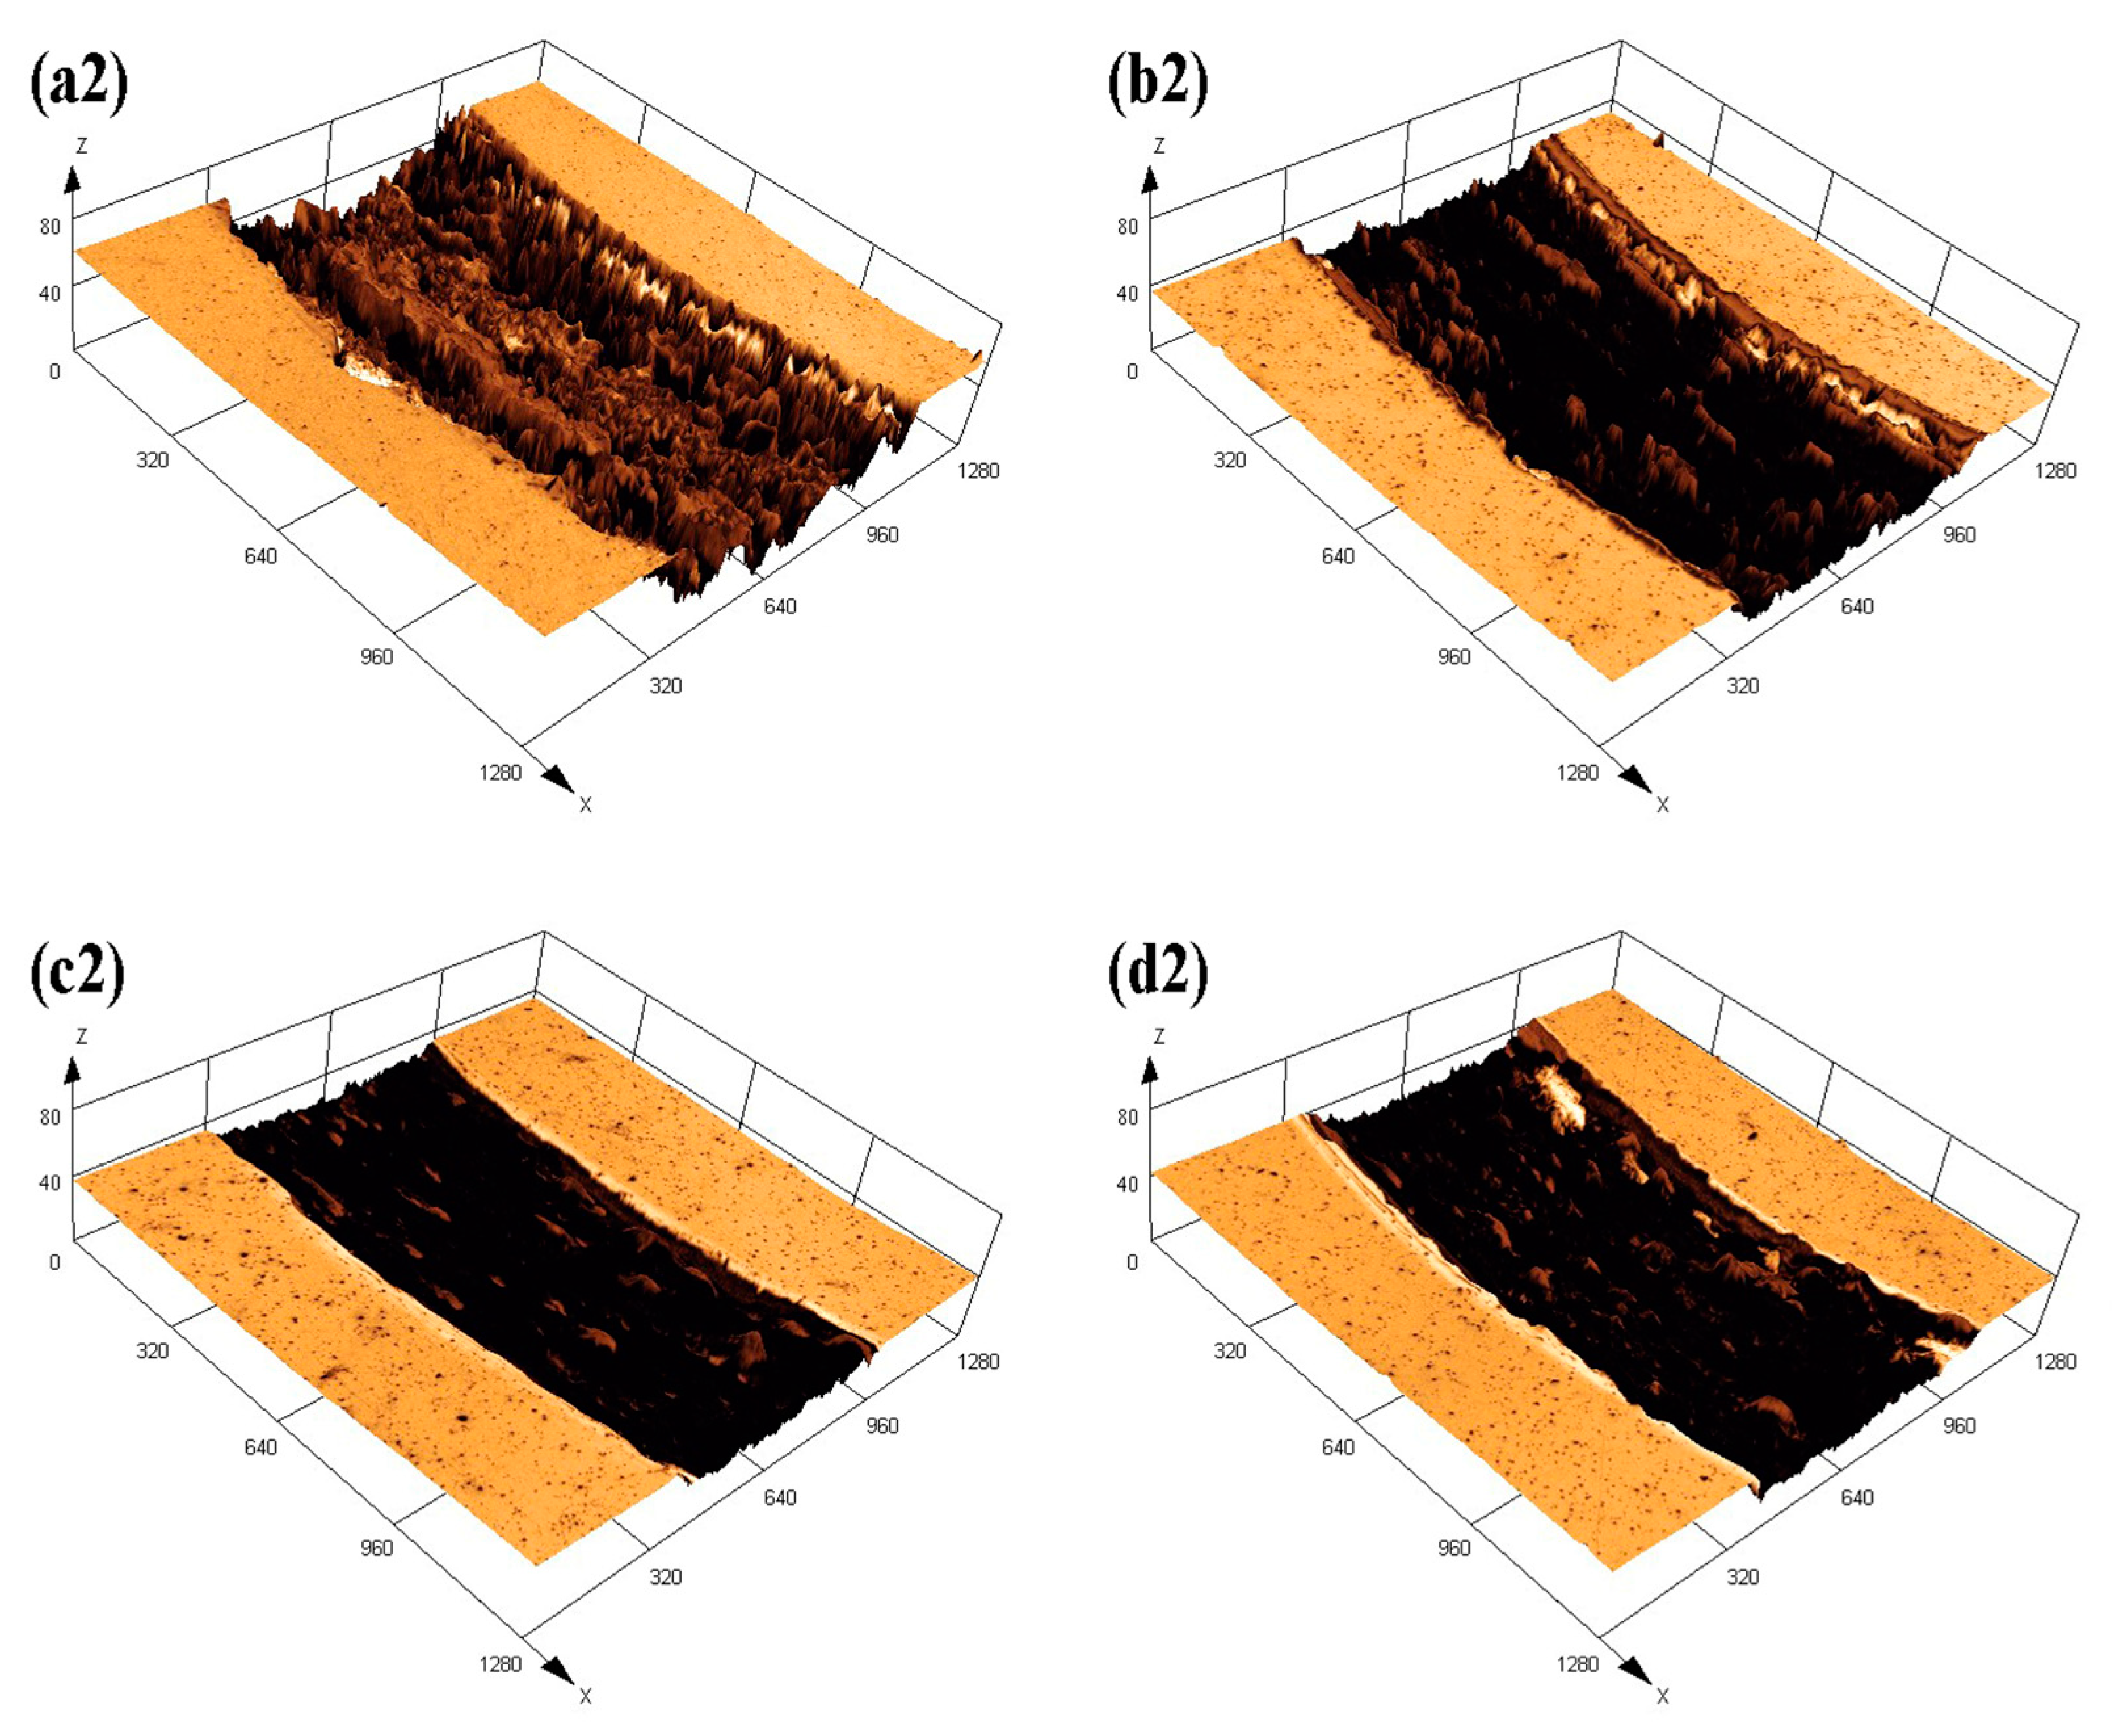
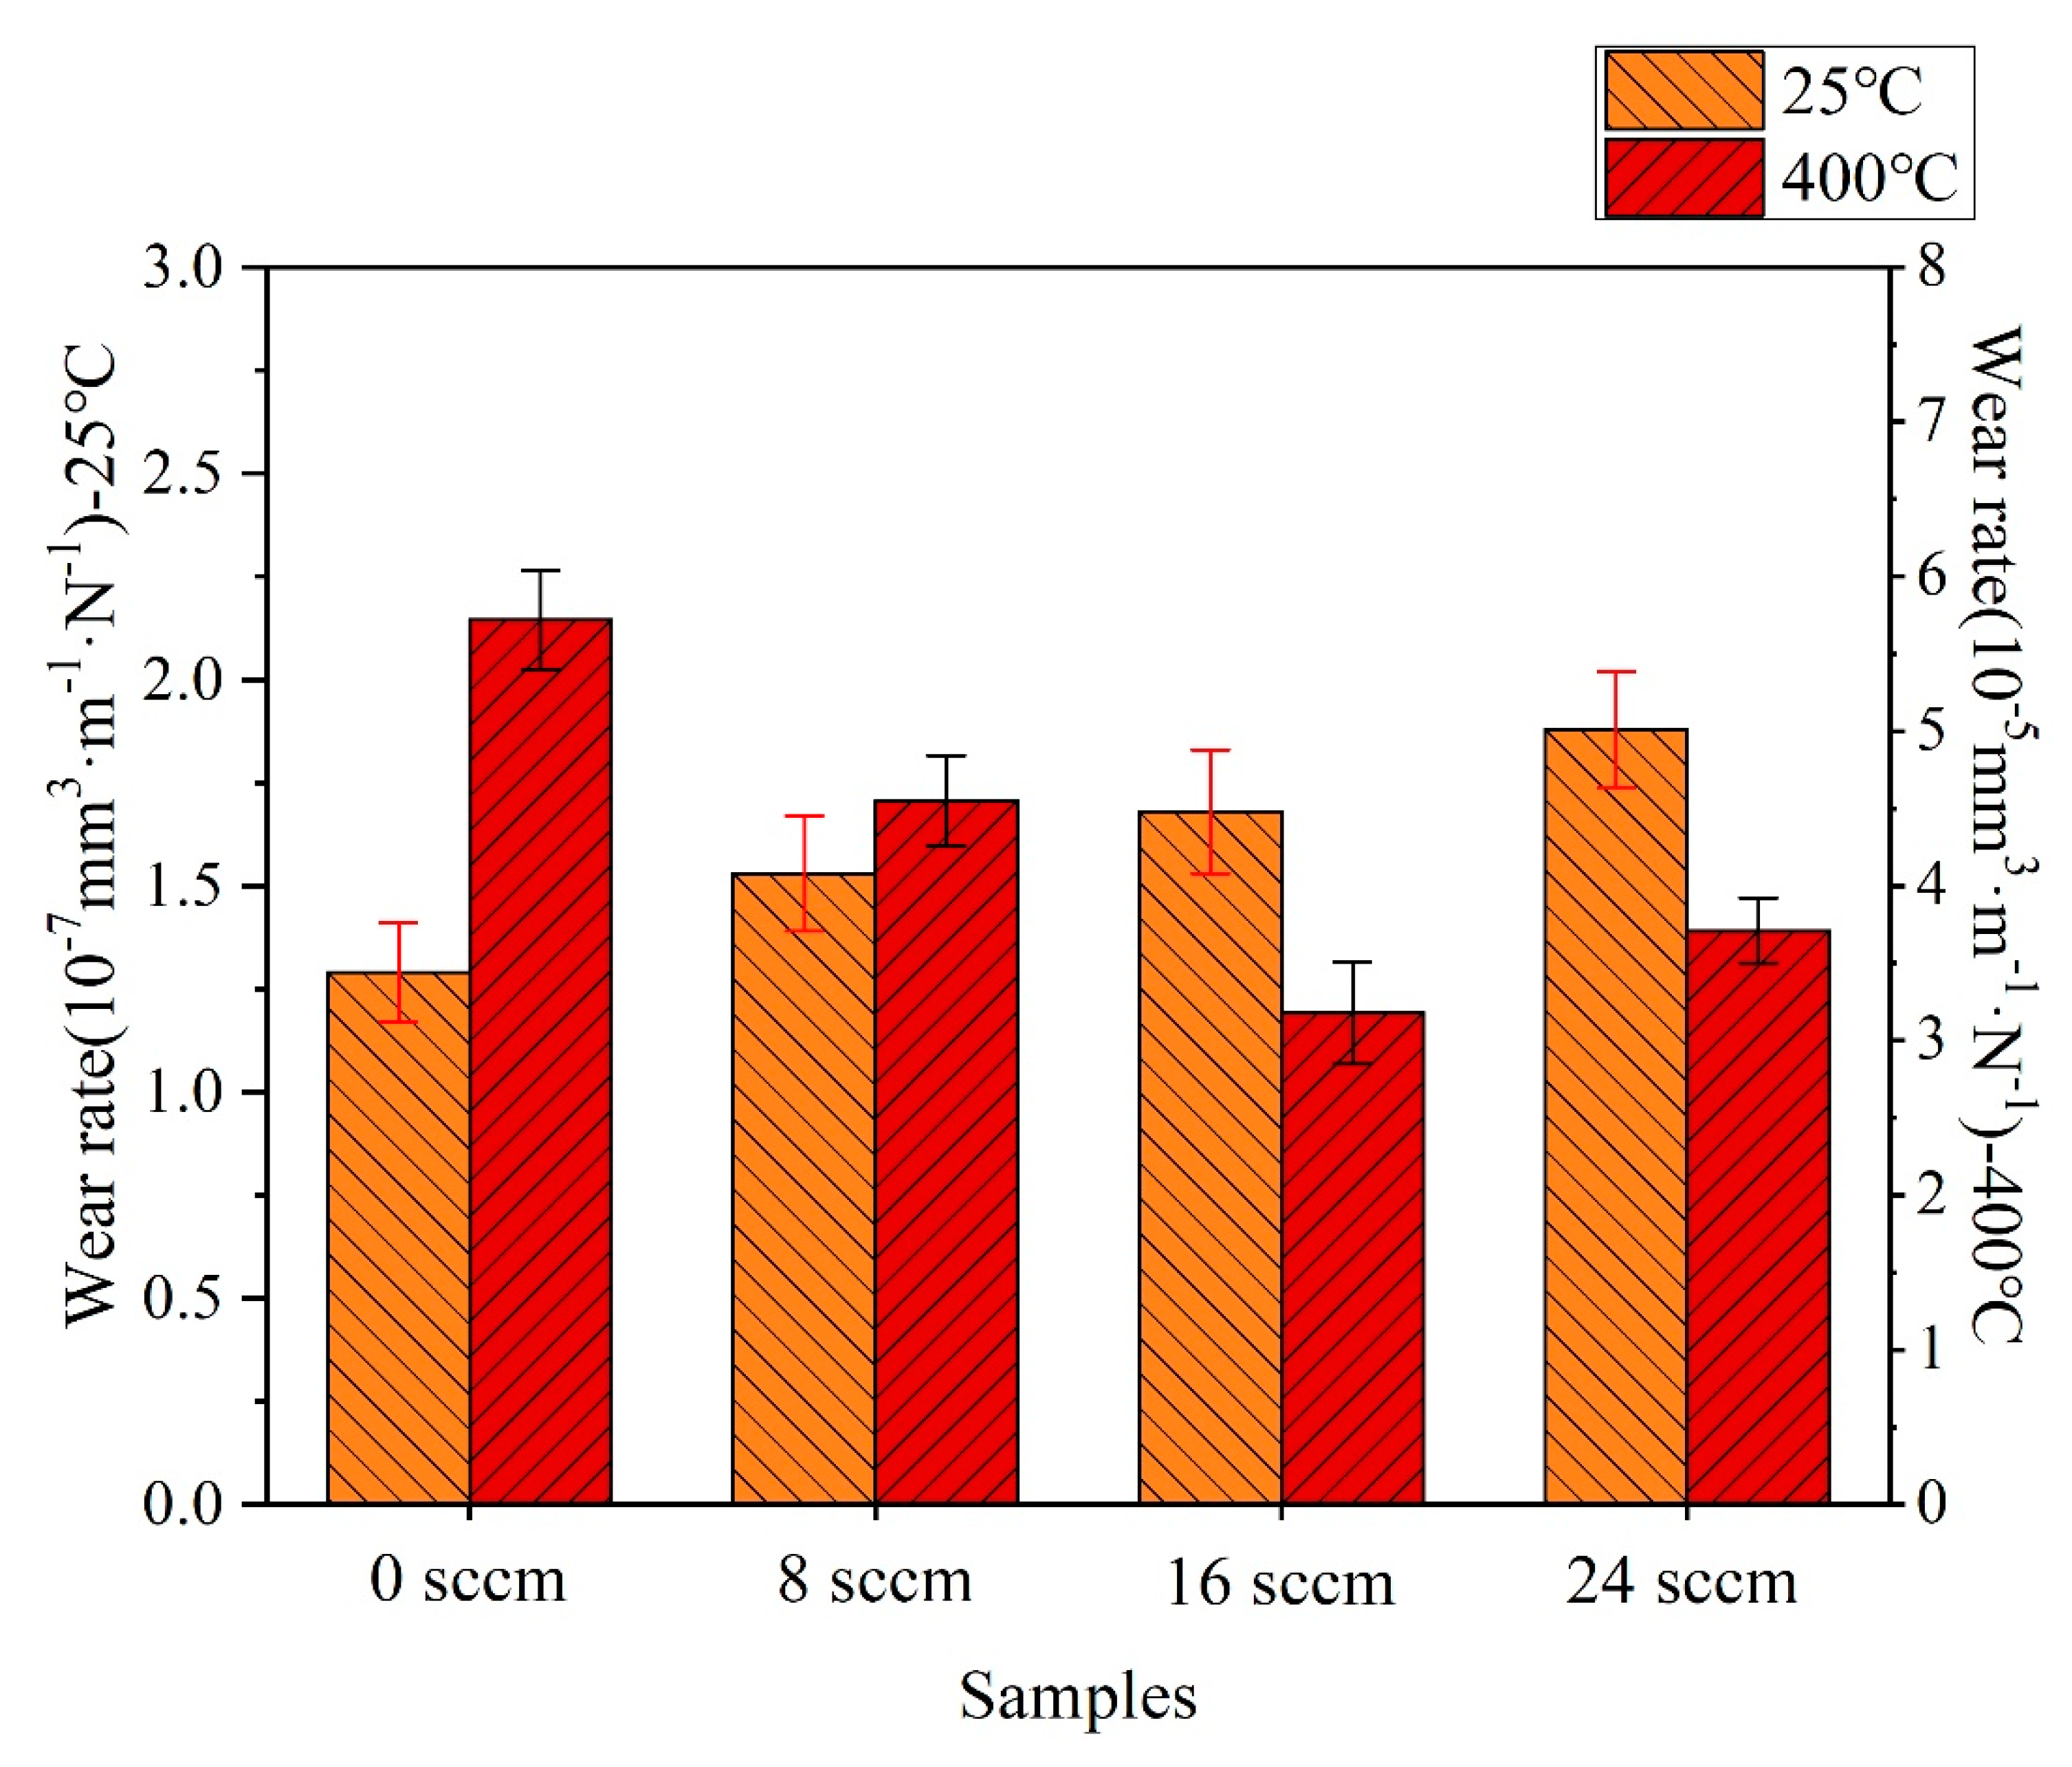
The 3D graphs of the wear tracks of WC/WCN coatings deposited with different nitrogen gas flow observed by LCMS are shown in Figure 11. As is shown in Figure 11a2–d2, coatings subjected to wear tests at elevated temperature (400 °C) have much wider and deeper wear tracks compared with those (Figure 11a1–d1) at room temperature (25 °C). This is probably attributed to the oxidation and the increased friction coefficients (see in Figure 9) of the WC/WCN coatings at high temperature. The wear rates of room temperature wear test increase with the increases of nitrogen flow rate, while the wear rates first decrease then increase with the increases of nitrogen flow rate, which are also confirmed by the wear rates of the deposited coatings calculated from the cross-sectional profiles of wear tracks shown in Figure 12.

4. Conclusions

Nanostructured WC/WCN coatings with various nitrogen contents obtained by controlling the flow rate of N2 in the deposition are successfully fabricated on Si (100) wafers and YT 15 cemented carbides through HiPIMS technology. The discharge characteristics of HiPIMS, microstructure, mechanical properties, room temperature, and elevated temperature tribological properties of the deposited coatings as a function of the nitrogen gas flow have been investigated and compared. The most important results can be summarized as follows: With the increase of nitrogen gas flow, the peak discharge current and the intensities of optical emission spectra lines originated from the W I (W0), N I (N0), Ar I (Ar0) and Ar II (Ar+) first increase and then decrease, while the emission intensity of the C I (C0) lines declines. Pure WC coating exhibits multiple orientations of (101), (102), and (110), respectively, characteristic of rhombohedral β-W2C phase. The average grain size decreases from 8.9 nm to 6.4 nm with the N2 flow rate increasing from 0 sccm to 24 sccm. The XPS spectra indicate the intensities of C=N, W–N, W–C–N and N–O peaks increase, while the intensity of C–W peak decreases. Further, more W-N bonds are formed in WCN coatings with higher N concentration. The deposition rate of the coatings first increases, then decreases. The cross-sectional morphologies of deposited coatings change from slight columnar type to a typically dense and featureless structure, and the surface roughness decreases from Ra 11.6 nm at 0 sccm to Ra 5.7 nm at 24 sccm. The hardness and elastic modulus of WC/WCN coatings first increase, then decrease. The maximum values are 35.6 GPa and 476.5 GPa at 16 sccm, respectively. All the hardness and elastic modulus values of WCN coatings are higher than those of the pure WC coating. The tribological properties at room temperature (25 °C) deteriorate slightly with the increases of N2 flow rate while tribological properties at high temperature (400 °C) improve significantly first, then deteriorate slightly with the increasing N2 flow rate according to images of the wear track and the wear rates of the coatings. The best high-temperature tribological property is obtained when the nitrogen flow rate is 16 sccm.

Author Contributions

Conceptualization, W.X.; Data curation, Y.Y.; Funding acquisition, S.H. and L.W.; Investigation, S.F. and L.W.; Methodology, Y.W.; Project administration, L.W.; Resources, W.X. and L.W.; Software, Y.W.; Supervision, L.W.; Visualization, Y.W.; Writing—original draft, W.H.; Writing—review & editing, M.H. and L.W. All authors have read and agreed to the published version of the manuscript.

Funding

This work was supported by Guangdong Enterprise Science and Technology Commissioner Project (GDKTP2020065800), Guangdong Special Support Program (2019BT02C629), Science and Technology Programs of Guangdong Province (2020B010184001, 2018A030313660), Special Fund for Scientific and Technological Innovation Strategy of Guangdong Province (No. 2018B090902003), Science and Technology Programs of Guangzhou (201904010261, 202007020008) and GDAS’ Project of Science & Technology (2021GDASYL-20210103064).

Institutional Review Board Statement

Not applicable.

Informed Consent Statement

Not applicable.

Data Availability Statement

Not applicable.

Conflicts of Interest

The authors declare no conflict of interest.

References

  1. Benedetti, M.; Fontanari, V.; Torresani, E.; Girardi, C.; Giordanino, L. Investigation of lubricated rolling sliding behaviour of WC/C, WC/C-CrN, DLC based coatings and plasma nitriding of steel for possible use in worm gearing. Wear 2017, 378–379, 106–113. [Google Scholar] [CrossRef]
  2. Rivera-Tello, C.D.; Broitman, E.; Flores-Ruiz, F.J.; Jimenez, O.; Flores, M. Mechanical properties and tribological behavior at micro and macro-scale of WC/WCN/W hierarchical multilayer coatings. Tribol. Int. 2016, 101, 194–203. [Google Scholar] [CrossRef] [Green Version]
  3. Pu, J.B.; He, D.Q.; Wang, L.P. Effects of WC phase contents on the microstructure, mechanical properties and tribological behaviors of WC/a-C superlattice coatings. Appl. Surf. Sci. 2015, 357, 2039–2047. [Google Scholar] [CrossRef]
  4. Pouraliakbar, H.; Khalaj, G.; Gomidželović, L.; Khalaj, M.J.; Nazerfakhari, M. Duplex ceramic coating produced by low temperature thermo-reactive deposition and diffusion on the cold work tool steel substrate: Thermodynamics, kinetics and modeling. Ceram. Int. 2015, 41, 9350–9360. [Google Scholar] [CrossRef]
  5. Khalaj, G.; Khalaj, M.J. Application of ANFIS for modeling of layer thickness of chromium carbonitride coating. Neural Comput. Appl. 2014, 24, 685–694. [Google Scholar] [CrossRef]
  6. Pourasad, J.; Ehsani, N.; Khalifesoltani, S.A. Preparation and characterization of SiO2 thin film and SiC nanofibers to improve of graphite oxidation resistance. J. Eur. Ceram. Soc. 2016, 36, 3947–3956. [Google Scholar] [CrossRef]
  7. Ehrburger, P.; Lahaye, J.; Bourgeois, C. Characterization of carbon-carbon composites—II: Oxidation behaviour. Carbon 1981, 19, 7–10. [Google Scholar] [CrossRef]
  8. Banerji, A.; Bhowmick, S.; Alpas, A.T. High temperature tribological behavior of W containing diamond-like carbon (DLC) coating against titanium alloys. Surf. Coat. Technol. 2014, 241, 93–104. [Google Scholar] [CrossRef]
  9. Shen, Y.-Q.; Zhang, Z.-Q.; Liao, B.; Wu, X.-Y.; Zhang, X.; Hua, Q.-S.; Bao, M.-Y. Tribocorrosion performance of Nitrogen-doped diamond like carbon coating by high power impulse magnetron sputtering technique. Acta Phys. Sin. Chin. Ed. 2020, 69, 108101. [Google Scholar]
  10. Bootkul, D.; Supsermpol, B.; Saenphinit, N.; Aramwit, C.; Intarasiri, S. Nitrogen doping for adhesion improvement of DLC film deposited on Si substrate by Filtered Cathodic Vacuum Arc (FCVA) technique. Appl. Surf. Sci. 2014, 310, 284–292. [Google Scholar] [CrossRef]
  11. Corona-Gomez, J.; Shiri, S.; Mohammadtaheri, M.; Yang, Q. Adhesion enhancement of DLC on CoCrMo alloy by diamond and nitrogen incorporation for wear resistant applications. Surf. Coat. Technol. 2017, 332, 120–127. [Google Scholar] [CrossRef]
  12. Ju, H.; Wang, R.; Ding, N.; Yu, L.; Xu, J.; Ahmed, F.; Zuo, B.; Geng, Y. Improvement on the oxidation resistance and tribological properties of molybdenum disulfide film by doping nitrogen. Mater. Des. 2019, 186, 108300. [Google Scholar] [CrossRef]
  13. Wang, L.; Li, L.; Li, G.; Ma, Q. Improved Adhesion of TiAlSiN Nanocomposite Coatings on Cemented Carbide Substrate by Pre-Implantation. Coatings 2019, 9, 209. [Google Scholar] [CrossRef] [Green Version]
  14. Wang, L.; Jin, J.; Zhu, C.; Li, G.; Kuang, X.; Huang, K. Effects of HiPIMS pulse-length on plasma discharge and on the properties of WC-DLC coatings. Appl. Surf. Sci. 2019, 487, 526–538. [Google Scholar] [CrossRef]
  15. Syed, B.; Hsu, T.W.; Chaar, A.B.B.; Polcik, P.; Kolozsvari, S.; Håkansson, G.; Rosen, J.; Johnson, L.J.S.; Zhirkov, I.; Andersson, J.M.; et al. Effect of varying N2 pressure on DC arc plasma properties and microstructure of TiAlN coatings. Plasma Sources Sci. Technol. 2020, 29, 095015. [Google Scholar] [CrossRef]
  16. Safi, I. Recent aspects concerning DC reactive magnetron sputtering of thin films: A review. Surf. Coat. Technol. 2000, 127, 203–218. [Google Scholar] [CrossRef]
  17. Fekete, M.; Bernátová, K.; Klein, P.; Hnilica, J.; Vašina, P. Evolution of discharge parameters and sputtered species ionization in reactive HiPIMS with oxygen, nitrogen and acetylene. Plasma Sources Sci. Technol. 2019, 28, 025011. [Google Scholar] [CrossRef]
  18. Lin, J.; Sproul, W.D.; Wei, R.; Chistyakov, R. Diamond like carbon films deposited by HiPIMS using oscillatory voltage pulses. Surf. Coat. Technol. 2014, 258, 1212–1222. [Google Scholar] [CrossRef]
  19. Peng, Y.L.; Guo, C.Q.; Lin, S.S.; Shi, Q.; Wei, C.B.; Su, Y.F.; Wu, Y.Q.; Tang, P.; Zhu, X.G.; Dai, M.J. Effects of working pressure on structure and properties of Al-containing amorphous carbon films prepared by high-power impulse magnetron sputtering. J. Alloys Compd. 2019, 816, 152587. [Google Scholar] [CrossRef]
  20. Zuo, X.; Zhang, D.; Chen, R.; Ke, P.; Odén, M.; Wang, A. Spectroscopic investigation on the near-substrate plasma characteristics of chromium HiPIMS in low density discharge mode. Plasma Sources Sci. Technol. 2020, 29, 0150013. [Google Scholar] [CrossRef]
  21. Yarin, A.L.; Rovagnati, B.; Mashayek, F.; Matsoukas, T. A reaction model for plasma coating of nanoparticles by amorphous carbon layers. J. Appl. Phys. 2006, 99, 064310. [Google Scholar] [CrossRef]
  22. Guillaumot, A.; Lapostolle, F.; Dublanche-Tixier, C.; Oliveira, J.C.; Billard, A.; Langlade, C. Reactive deposition of Al-N coatings in Ar/N2 atmospheres using pulsed-DC or high power impulse magnetron sputtering discharges. Vacuum 2010, 85, 120–125. [Google Scholar] [CrossRef]
  23. Lu, C.-Y.; Diyatmika, W.; Lou, B.-S.; Lee, J.-W. Superimposition of high power impulse and middle frequency magnetron sputtering for fabrication of CrTiBN multicomponent hard coatings. Surf. Coat. Technol. 2018, 350, 962–970. [Google Scholar] [CrossRef]
  24. Zhao, H.; Ni, Z.; Ye, F. Effect of carbon content on structure and properties of WCN coatings prepared by RF magnetron sputtering. Surf. Coat. Technol. 2016, 287, 129–137. [Google Scholar] [CrossRef]
  25. Su, Y.D.; Hu, C.Q.; Wen, M.; Wang, C.; Liu, D.S.; Zheng, W.T. Effects of bias voltage and annealing on the structure and mechanical properties of WC0.75N0.25 thin films. J. Alloys Compd. 2009, 486, 357–364. [Google Scholar] [CrossRef]
  26. Ospina, R.; Escobar-Rincón, D.; Arango, P.J.; Restrepo-Parra, E.; Jurado, J.F. Structural and chemical composition analysis of WCN produced by pulsed vacuum arc discharge. Surf. Coat. Technol. 2013, 232, 96–100. [Google Scholar] [CrossRef]
  27. Olaya, J.; Rodil, S.; Muhl, S.; Sánchez, E. Comparative study of chromium nitride coatings deposited by unbalanced and balanced magnetron sputtering. Thin Solid Film. 2005, 474, 119–126. [Google Scholar] [CrossRef]
  28. Kaoumi, D.; Motta, A.T.; Birtcher, R.C. A thermal spike model of grain growth under irradiation. J. Appl. Phys. 2008, 104, 073525. [Google Scholar] [CrossRef] [Green Version]
  29. Luo, H.; Gao, F.; Billard, A. Tunable microstructures and morphology of zirconium films via an assist of magnetic field in HiPIMS for improved mechanical properties. Surf. Coat. Technol. 2019, 374, 822–832. [Google Scholar] [CrossRef]
  30. Pradhan, A.A.; Shah, S.I.; Unruh, K.M. Reactive sputter deposition of alumina thin films using a hollow cathode sputtering source. Rev. Sci. Instrum. 2002, 73, 3841–3845. [Google Scholar] [CrossRef]
  31. Sánchez-López, J.C.; Dominguez-Meister, S.; Rojas, T.C.; Colasuonno, M.; Bazzan, M.; Patelli, A. Tribological properties of TiC/a-C:H nanocomposite coatings prepared via HiPIMS. Appl. Surf. Sci. 2018, 440, 458–466. [Google Scholar] [CrossRef]
  32. Wang, W.; Pelenovich, V.O.; Yousaf, M.I.; Yan, S.; Bin, H.; Wang, Z.; Tolstogouzov, A.B.; Kumar, P.; Yang, B.; Fu, D.J. Microstructure, mechanical and tribological properties of WC/a-C:H coatings deposited by cathodic arc ion-plating. Vacuum 2016, 132, 31–39. [Google Scholar] [CrossRef]
  33. Hinnen, C.; Imbert, D.; Siffre, J.M.; Marcus, P. An in situ XPS study of sputter-deposited aluminium thin films on graphite. Appl. Surf. Sci. 1994, 78, 219–231. [Google Scholar] [CrossRef]
  34. Qureshi, A.; Shah, S.; Pelagade, S.; Singh, N.L.; Mukherjee, S.; Tripathi, A.; Despande, U.P.; Shripathi, T. Surface modification of polycarbonate by plasma treatment. J. Phys. Conf. Ser. 2010, 208, 012108. [Google Scholar] [CrossRef]
  35. Czyzniewski, A. Deposition and some properties of nanocrystalline WC and nanocomposite WC/a-C:H coatings. Thin Solid Film. 2003, 433, 180–185. [Google Scholar] [CrossRef]
  36. Jiang, P.C.; Chen, J.S.; Lin, Y.K. Structural and electrical characteristics of W–N thin films prepared by reactive rf sputtering. J. Vac. Sci. Technol. 2003, 21, 616–622. [Google Scholar] [CrossRef]
  37. Shen, Y.G.; Mai, Y.W.; Mckenzie, D.R.; Zhang, Q.C.; McFall, W.D.; McBride, W.E. Composition, residual stress, and structural properties of thin tungsten nitride films deposited by reactive magnetron sputtering. J. Appl. Phys. 2000, 88, 1380–1388. [Google Scholar] [CrossRef]
  38. Moulder, J.F.; Stickle, W.F.; Sobol, P.E.; Bomben, K.D. Handbook of X-Ray Photoelectron Spectroscopy: A Reference Book of Standard Spectra for Identification and Interpretation of XPS Data; Moulder, J.F., Chastain, J., Eds.; Physical Electronics: Chanhassen, MN, USA, 1993. [Google Scholar]
  39. Wang, C.; Tao, Q.; Li, Y.; Ma, S.; Dong, S.; Cui, T.; Wang, X.; Zhu, P. Excellent mechanical properties of metastable c-WN fabricated at high pressure and high temperature. Int. J. Refract. Met. Hard Mater. 2017, 66, 63–67. [Google Scholar] [CrossRef]
  40. Tang, J.-F.; Lin, C.-Y.; Yang, F.-C.; Tsai, Y.-J.; Chang, C.-L. Effects of nitrogen-argon flow ratio on the microstructural and mechanical properties of AlCrN coatings prepared using high power impulse magnetron sputtering. Surf. Coat. Technol. 2020, 386, 125484. [Google Scholar] [CrossRef]
  41. Snyders, R.; Gouttebaron, R.; Dauchot, J.P.; Hecq, M. Mass spectrometry diagnostic of dc magnetron reactive sputtering. J. Anal. At. Spectrom. 2003, 18, 618–623. [Google Scholar] [CrossRef]
  42. Yu, L.; Zhao, H.; Xu, J. Mechanical, tribological and corrosion performance of WBN composite films deposited by reactive magnetron sputtering. Appl. Surf. Sci. 2014, 315, 380–386. [Google Scholar] [CrossRef]
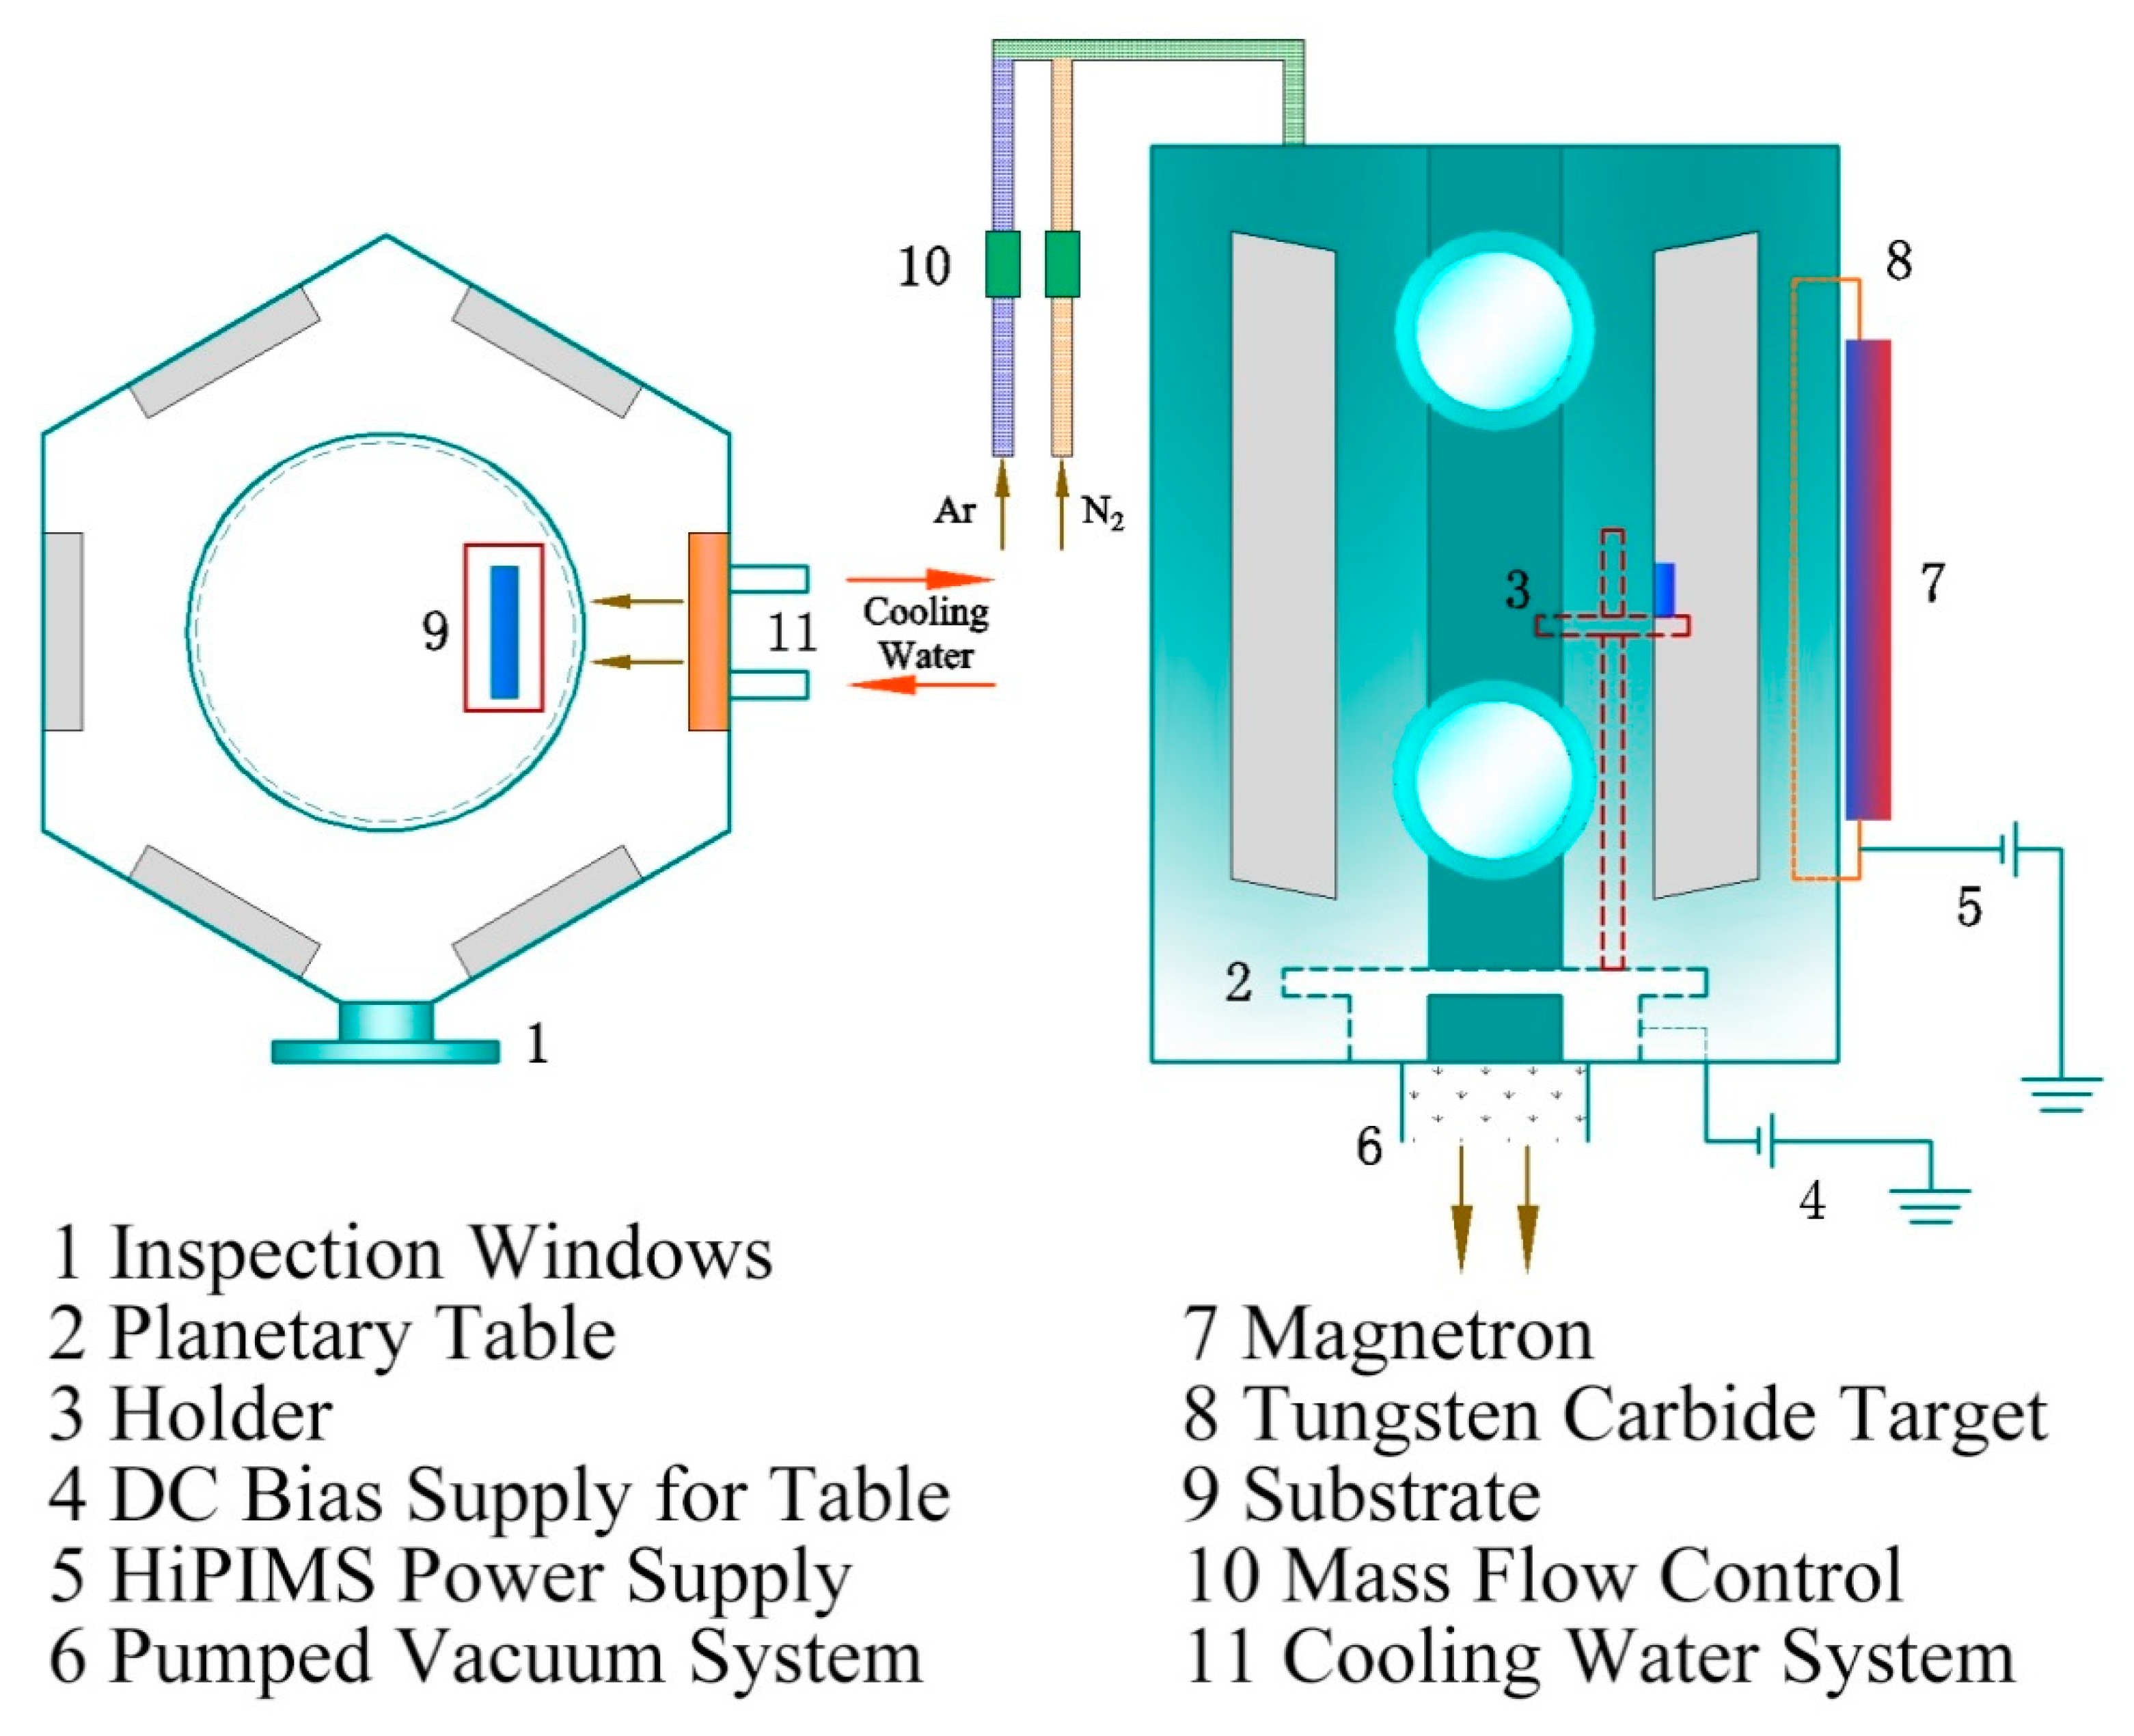
Figure 1. Schematic of the deposition apparatus.
Coatings 11 00481 g001
Figure 2. Evolution of the cathode voltage and discharge current with the nitrogen gas flow during the coatings deposition using HiPIMS. (a) Discharge Voltage; (b) Discharge Current.
Coatings 11 00481 g002
Figure 3. Normalized OES spectrum recorded during HiPIMS with various nitrogen gas flow showing the emission intensities from W, C, N and Ar.
Coatings 11 00481 g003
Figure 4. X-ray diffractograms of WC-DLC coatings deposited using HiPIMS with various nitrogen gas flow.
Coatings 11 00481 g004
Figure 5. C 1s, N 1s and W 4f core level XPS spectra of WC/WCN coatings deposited at different nitrogen flow rates. ((a):C 1s; (b): N 1s; (c): W 4f) of overall (a1,b1,c1), +0 sccm N2 (a2,b2,c2), +8 sccm N2 (a3,b3,c3), +16 sccm N2 (a4,b4,c4) and +24 sccm N2 (a5,b5,c5).
Coatings 11 00481 g005aCoatings 11 00481 g005bCoatings 11 00481 g005c
Figure 6. Cross-sectional SEM micrographs of WC/WCN composite coatings with different nitrogen flow rates. (a) +0 sccm N2, (b) +8 sccm N2, (c) +16 sccm N2, (d) +24 sccm N2.
Coatings 11 00481 g006
Figure 7. AFM images of 10 × 10 μm2 scan area of WC/WCN coatings prepared with various nitrogen flow rates. (a) +0 sccm N2, (b) +8 sccm N2, (c) +16 sccm N2, (d) +24 sccm N2.
Coatings 11 00481 g007
Figure 8. Hardness and Elastic modulus of WC-DLC coatings deposited with different nitrogen gas flow.
Coatings 11 00481 g008
Figure 9. Friction coefficients of WC/WCN coatings deposited with different nitrogen gas flow: (a) 25 °C, (b) 400 °C.
Coatings 11 00481 g009
Figure 10. SEM images and EDS analysis of the wear tracks produced by a ball on disk test of WC/WCN coatings deposited with different nitrogen gas flow ((a): 0 sccm; (b): 8 sccm; (c): 16 sccm; (d): 24 sccm) at 25 °C (a1,d1) and 400 °C (a2,d2).
Coatings 11 00481 g010
Figure 11. The 3D graphs of the wear tracks of WC/WCN coatings deposited with different nitrogen gas flow observed by LCMS: (a) 0 sccm (b) 8 sccm (c) 16 sccm (d) 24 sccm at 25 °C (a1,d1) and 400 °C (a2,d2).
Coatings 11 00481 g011aCoatings 11 00481 g011b
Figure 12. Wear rates of WC/WCN coatings at 25 °C and 400 °C deposited with different nitrogen gas flow.
Coatings 11 00481 g012
Table 1. Details and deposition parameters of sputtering.
ParameterValue
Samples (0 Sccm/8 Sccm/16 Sccm/24 Sccm)
Target-Substrate Distance (cm)10
Temperature (°C)150
Deposition Pressure (Pa)0.8
N2 Pressure (Pa)0.0/0.04/0.08/0.12
Total Deposition Time (min)30
Substrate Bias Voltage (V)−80
Pulse Width (μs)100
Repetition frequency (Hz)200
Pulse Negative Voltage (V)−800
Peak Discharge Current (A)61.5/70.9/77.6/61.6
Table 2. The spectral dates of indicated W,C,N emission lines in Figure 2.
SpeciesPosition
(nm)
Intensity (Relative, a.u.)
Samples (Different N2 Flow Rates)
+0 Sccm+8 Sccm+16 Sccm+24 Sccm
W0265.6524.4703.8675.1515.0
601.3963.7921.3832.3783.3
909.51463.91385.51298.01182.1
C0247.8627.9592.3549.9514.1
255.1460.8626.8598.1318.4
400.8664.1915.7859.5462.6
657.02647.92682.32807.51942.8
N0575.2127.0553.5682.6655.9
744.2281.5722.5906.2860.6
862.9244.2780.2957.8930.2
Table 3. The deposition rate, grain size and roughness of WC/WCN coatings with different N2 flow rate.
SamplesDeposition
Rate (nm/min)
Grain Size
(nm)
Roughness
(Ra/nm)
Chemical Compositions
WCN
Sample1 (0 sccm)88.08.911.667.8 ± 0.532.2 ± 0.3-
Sample2 (8 sccm)96.47.79.562.9 ± 0.732.0 ± 0.25.1 ± 0.2
Sample3 (16 sccm)110.76.88.257.4 ± 0.830.2 ± 0.412.4 ± 0.4
Sample4 (24 sccm)90.06.45.751.6 ± 0.629.2 ± 0.419.2 ± 0.3
Publisher’s Note: MDPI stays neutral with regard to jurisdictional claims in published maps and institutional affiliations.