1. Introduction
During the exploitation of clean energy natural gas, water is often produced. In order to reduce the adverse effects of water on natural gas exploitation, it is necessary to accurately measure the gas holdup of the fluid in the wellbore, hoping to increase the gas recovery rate as much as possible. Gas holdup refers to the share of gas area in total area of flow section in two phase or three phase flow, which is also known as void fraction, void fraction, or true void fraction. The traditional gas holdup measurement methods such as capacitance method, ultrasonic method, differential pressure method, and gamma ray method are not suitable for the measurement of horizontal well gas holdup [
1,
2,
3,
4,
5,
6]. Foreign horizontal well production logging technology started early, and the data processing software is very complete. For example, General Electric Company’s (GE’s) Multiple Array Production Suite (MAPS) array imaging instrument and Schlumberger’s FloScan Imager (FSI) array imaging instrument have achieved commercial applications [
7,
8,
9]. The Capacitance Array Tool (CAT) and Resistance Array Tool (RAT) in MAPS can be used to measure water holdup. The CAT consists of twelve capacitance probes. It uses the different dielectric constants of oil, gas, and water, and it obtains the instantaneous local water holdup per unit time by identifying the fluid by measuring the value of the dielectric constant. RAT consists of twelve resistance probes, which use the different conductivity of oil, gas, and water, and it obtains the instantaneous local water holdup per unit time by identifying the fluid by measuring the conductivity. There are six GHOST optical fiber probes in FSI for the measurement of gas holdup, and six FloView resistance probes for the measurement of water holdup. GHOST is a type of optical fiber probe. The tip of the optical fiber probe has different refractive indices in oil, gas, and water. When it encounters gas, it will be totally reflected and recorded as a high-level signal. When it encounters oil, it will be totally refracted and recorded as a low-level signal. Refraction and reflection occur in the water, and the medium level between gas and oil can be obtained. When measuring, the fluid can be identified according to the different levels identified, and the instantaneous local holdup of each phase per unit time can be obtained. FloView is a type of resistance probe. The principle is similar to that of RAT. It uses the impermeable conductivity of oil, gas, and water to identify the fluid and obtain the instantaneous local water holdup per unit time. The new array instrument Flow Array Sensing Technology (FAST) has also launched measurement services. The instrument has four arms, each arm is fixed with an optical fiber probe and a resistance probe, and the probe can be replaced. The FAST holdup measuring instrument uses both optical fiber probes and resistance probes for fluid identification, and at the same time records the response of oil, gas, and water to obtain the instantaneous local holdups of each phase per unit time. China’s horizontal well production logging technology started late, and there is no horizontal well measuring instrument and data processing software that can be tested on site. Some companies have introduced the MAPS array imaging instrument for research and horizontal well measurement. Due to the confidentiality of Schlumberger technology, only a testing service is carried out. In order to make up for the gap in gas holdup measurement of horizontal wells in China, the Gas Array Tool (GAT), an array gas holdup meter launched by GE company in 2018, was introduced in China. In order to study the applicability of GAT in gas–water two phase gas holdup measurement in horizontal wells, the multiphase flow laboratory has been used to simulate the gas holdup under different flowrates, water cut, and different cable speed measurement conditions by GAT and CAT instruments. In this paper, the GAT and CAT data under different flowrates, water cut, and cable speed measurement conditions are compared and analyzed.
2. Experiment and Interpolation Algorithm Analysis
2.1. Gas Array Tool
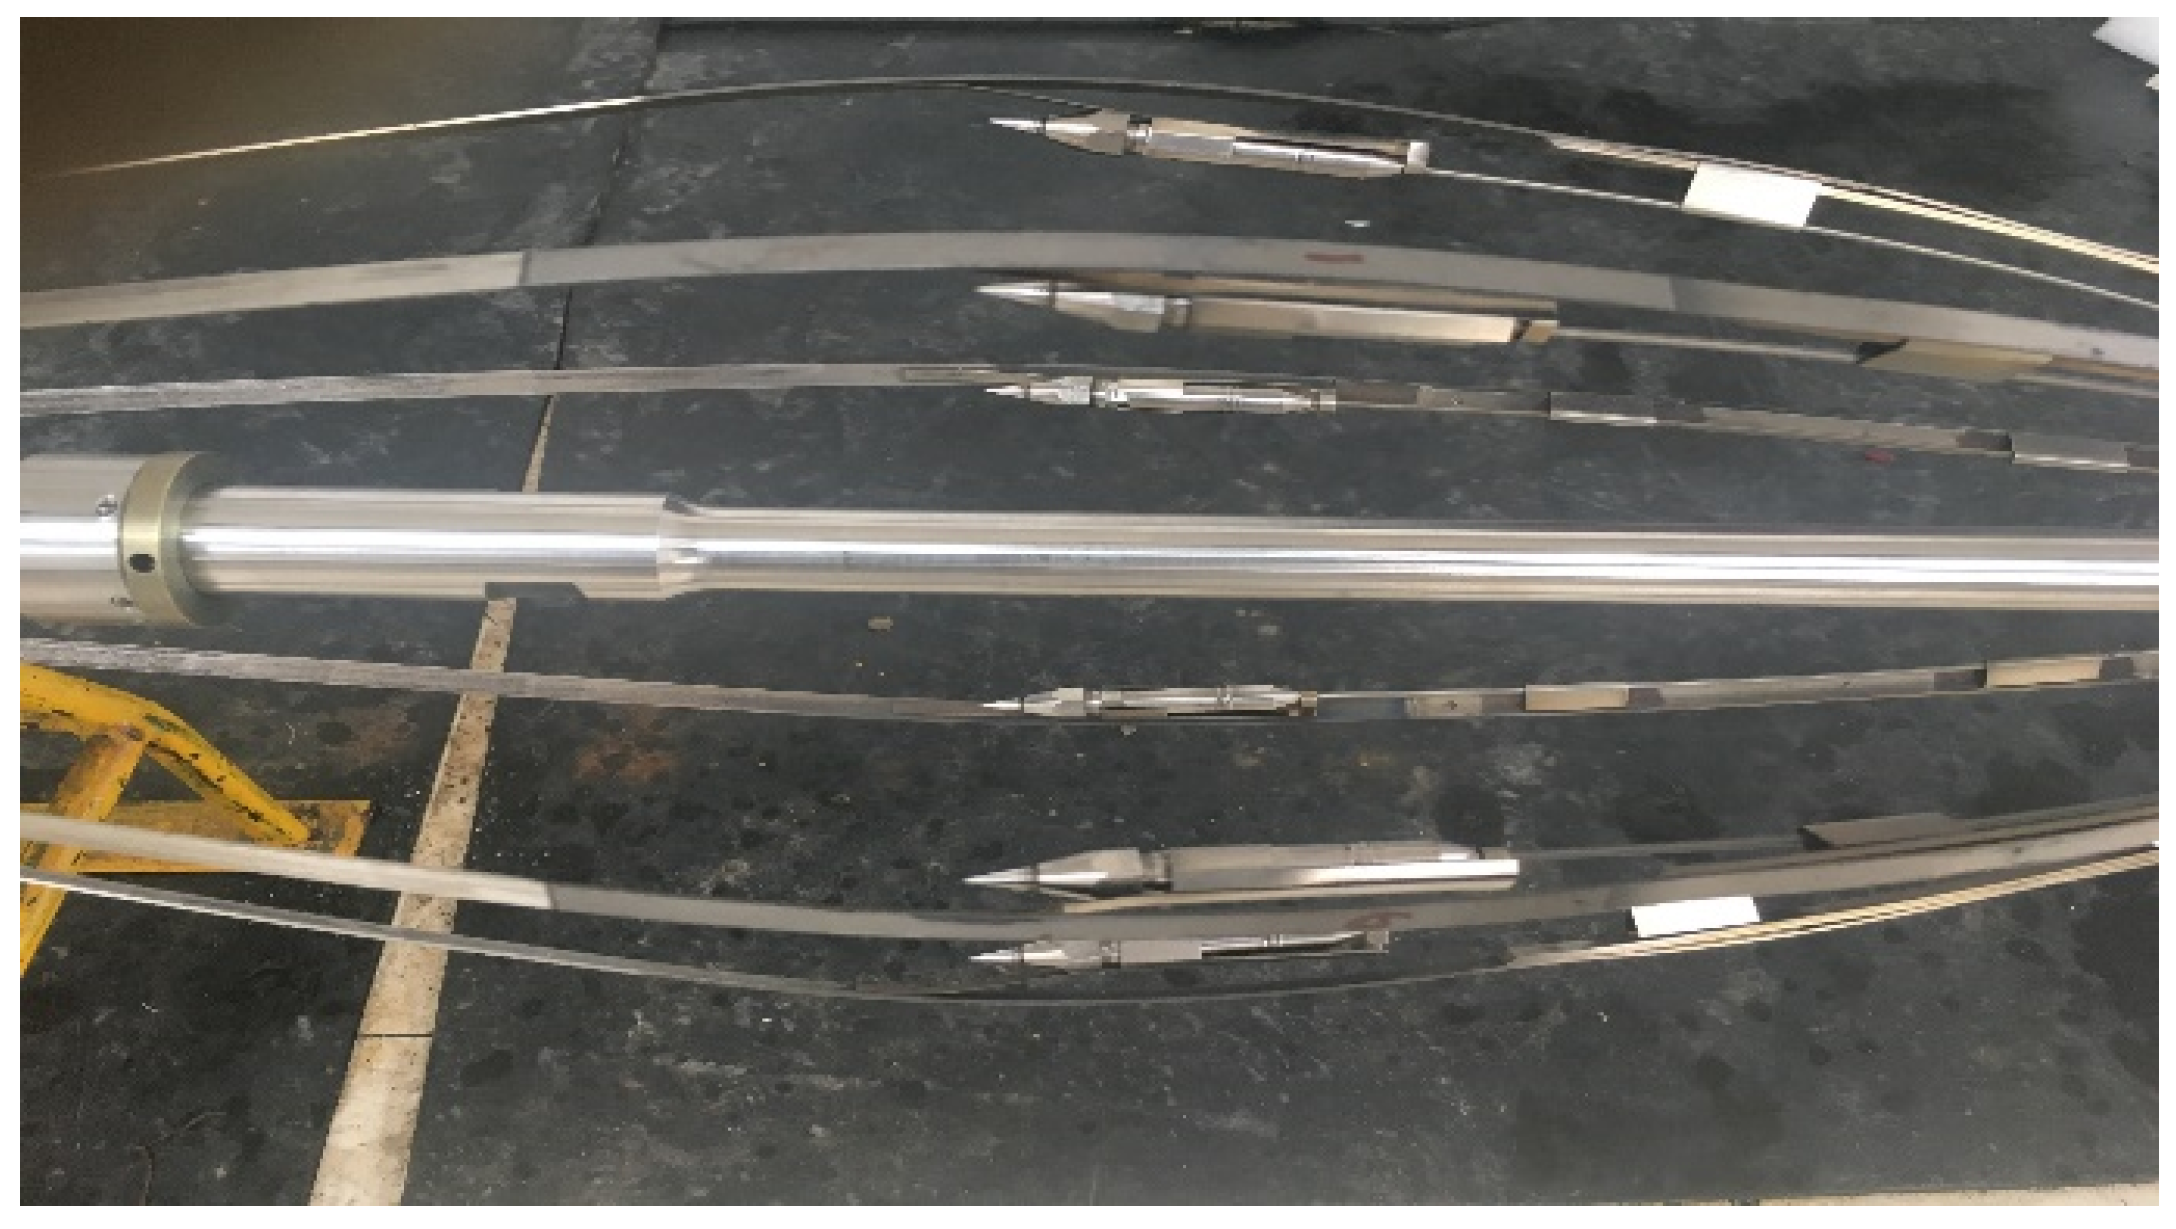
The six spring arms of the GAT are distributed in a circular shape at equal intervals, and an optical fiber probe is fixed in each spring arm, as shown in
Figure 1.
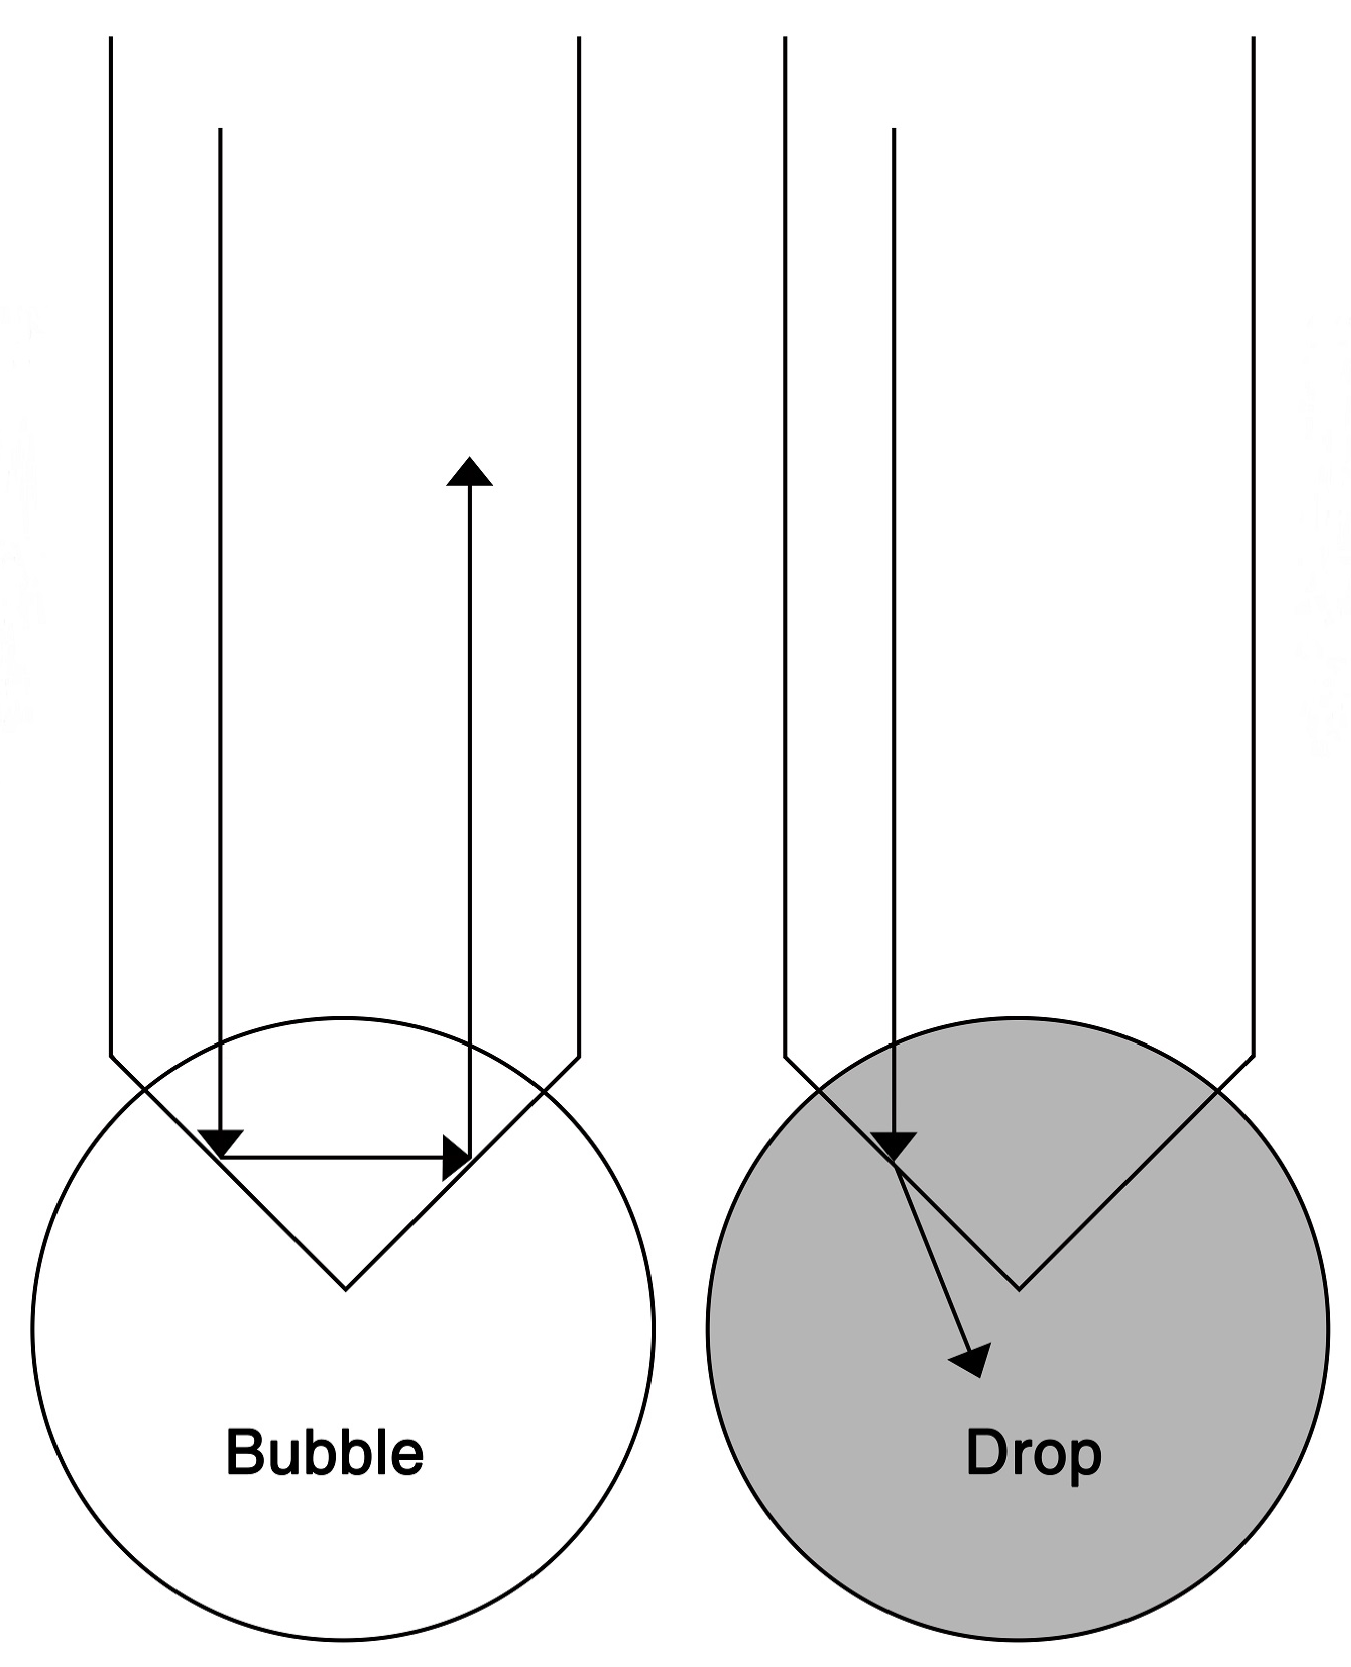
The head of the optical fiber probe is sapphire, and the refractive indices of light in sapphire, gas, water, and crude oil are 1.76, 1.00, 1.33, and 1.50, respectively [
10,
11,
12,
13]. As shown in
Figure 2, when the optical fiber probe is in contact with gas, most of the light is reflected back due to the large difference in refractive index between the gas and the sapphire, and the intensity of the reflected light is the largest. When the optical fiber probe touches water, since the refractive index difference between water and sapphire is relatively small, most of the light will pass through the sapphire, and the intensity of the reflected light will be small. Gas and water can be distinguished by measuring the light intensity reflected from the cone-shaped sapphire, and the gas holdup of the wellbore section can be obtained by using the data of six optical fiber probes. With the flow of oil, gas, and water downhole, the phase state in contact with the probe will continue to change, and signals of high and low fluctuations can be obtained, and the obtained signal data can be processed to obtain the local instantaneous gas holdup.
2.2. Capacitance Array Tool
CAT has 12 spring arms distributed in a circular shape at equal intervals, and a capacitance probe is fixed inside each spring arm for water holdup measurement, as shown in
Figure 3.
The principle of the capacitance probe to measure water holdup is that oil, gas, and water have different dielectric constants. The response value of the sensor will frequently change due to the change of the dielectric constant of the nearby liquid. The phase state of the liquid near the sensor can be identified by the scale of the sensor. However, because the dielectric constants of gas and oil are relatively close, it is actually difficult to distinguish between them. Therefore, capacitance probes are more sensitive to water, and they are often used to measure water holdup. In the gas–water two phases, since the sum of the gas holdup and the water holdup is 1, the gas holdup can be obtained by inverse calculation of the water holdup.
Compare and analyze FSI (Schlumberger, Houston, TX, USA) and MAPS (General Electric Company, Boston, MA, USA) instruments. FSI contains two types of holdup measurement probes, GHOST and FloView, and MAPS includes RAT, CAT, and GAT three holdup measurement probes. The parameters are shown in
Table 1. It can be found that GAT has the advantage of being less affected by the rotation of the instrument when measuring in horizontal wells compared with FSI. Compared with CAT and RAT, it has the advantage of directly measuring gas holdup to improve the accuracy of measuring gas holdup. GHOST and GAT are both optical fiber probes, and the measurement principles of both are the same. Both identify the fluid by measuring the intensity of the reflected light, and at the same time accumulate the frequency to obtain the local instantaneous gas holdup.
2.3. Experimental Scheme
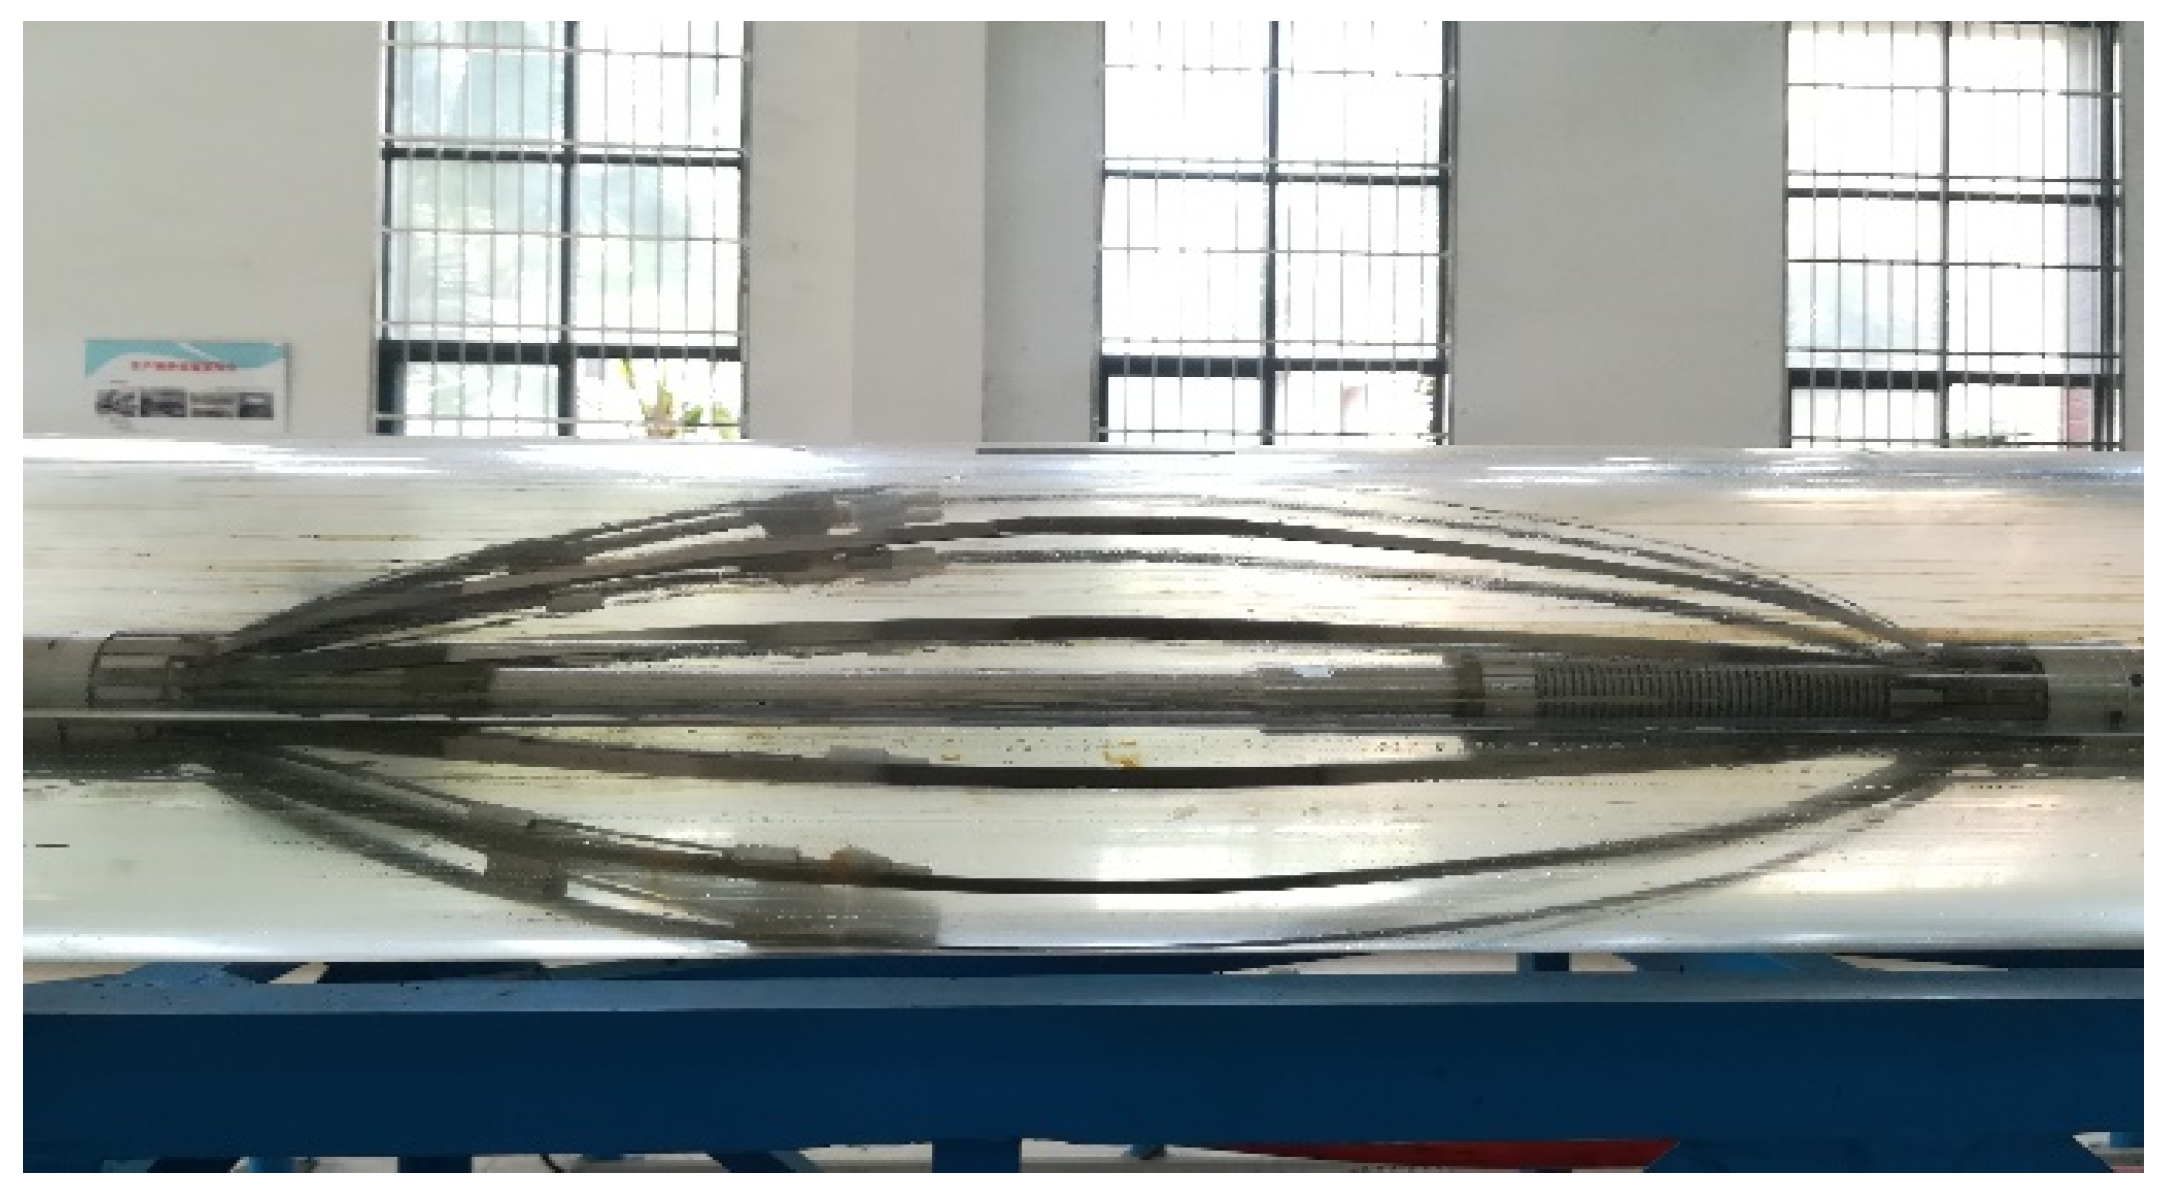
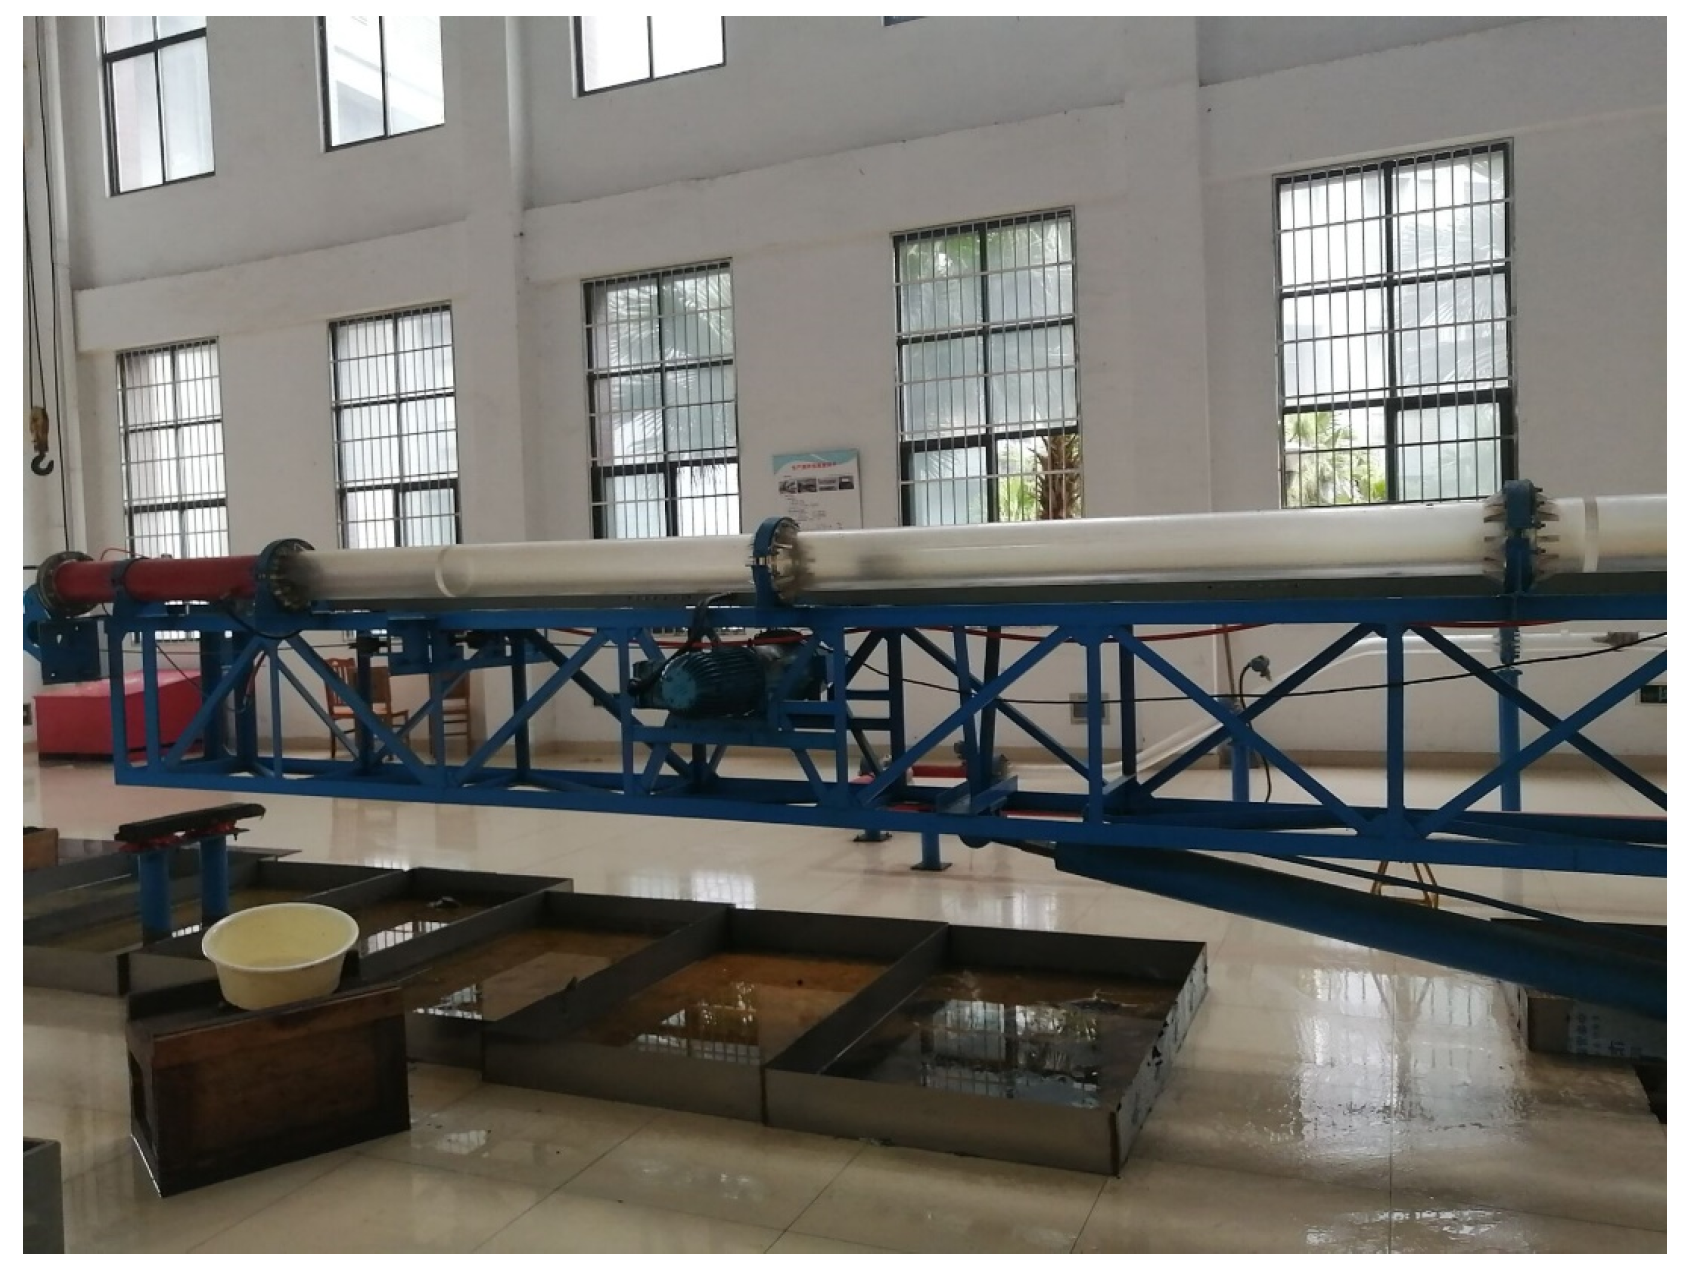
The experiment was carried out in a multiphase flow simulation experimental device of Yangtze University. The simulated wellbore was made of transparent plexiglass with an inner diameter of 124 mm and a length of 12 m. The simulated wellbore was set to be completely horizontal at 90°, as shown in
Figure 4. The experimental instruments GAT (General Electric Company, Boston, MA, USA) and CAT (General Electric Company, Boston, MA, USA) adopt a centered method in the wellbore for pulling measurement. In the experiment, tap water was used instead of water, air was used instead of gas, and the temperature is 25 °C. After the instrument is calibrated in pure water and pure gas, we perform the gas–water two phase measurement according to
Table 2 and obtain 48 sets of data.
2.4. Data Type Analysis
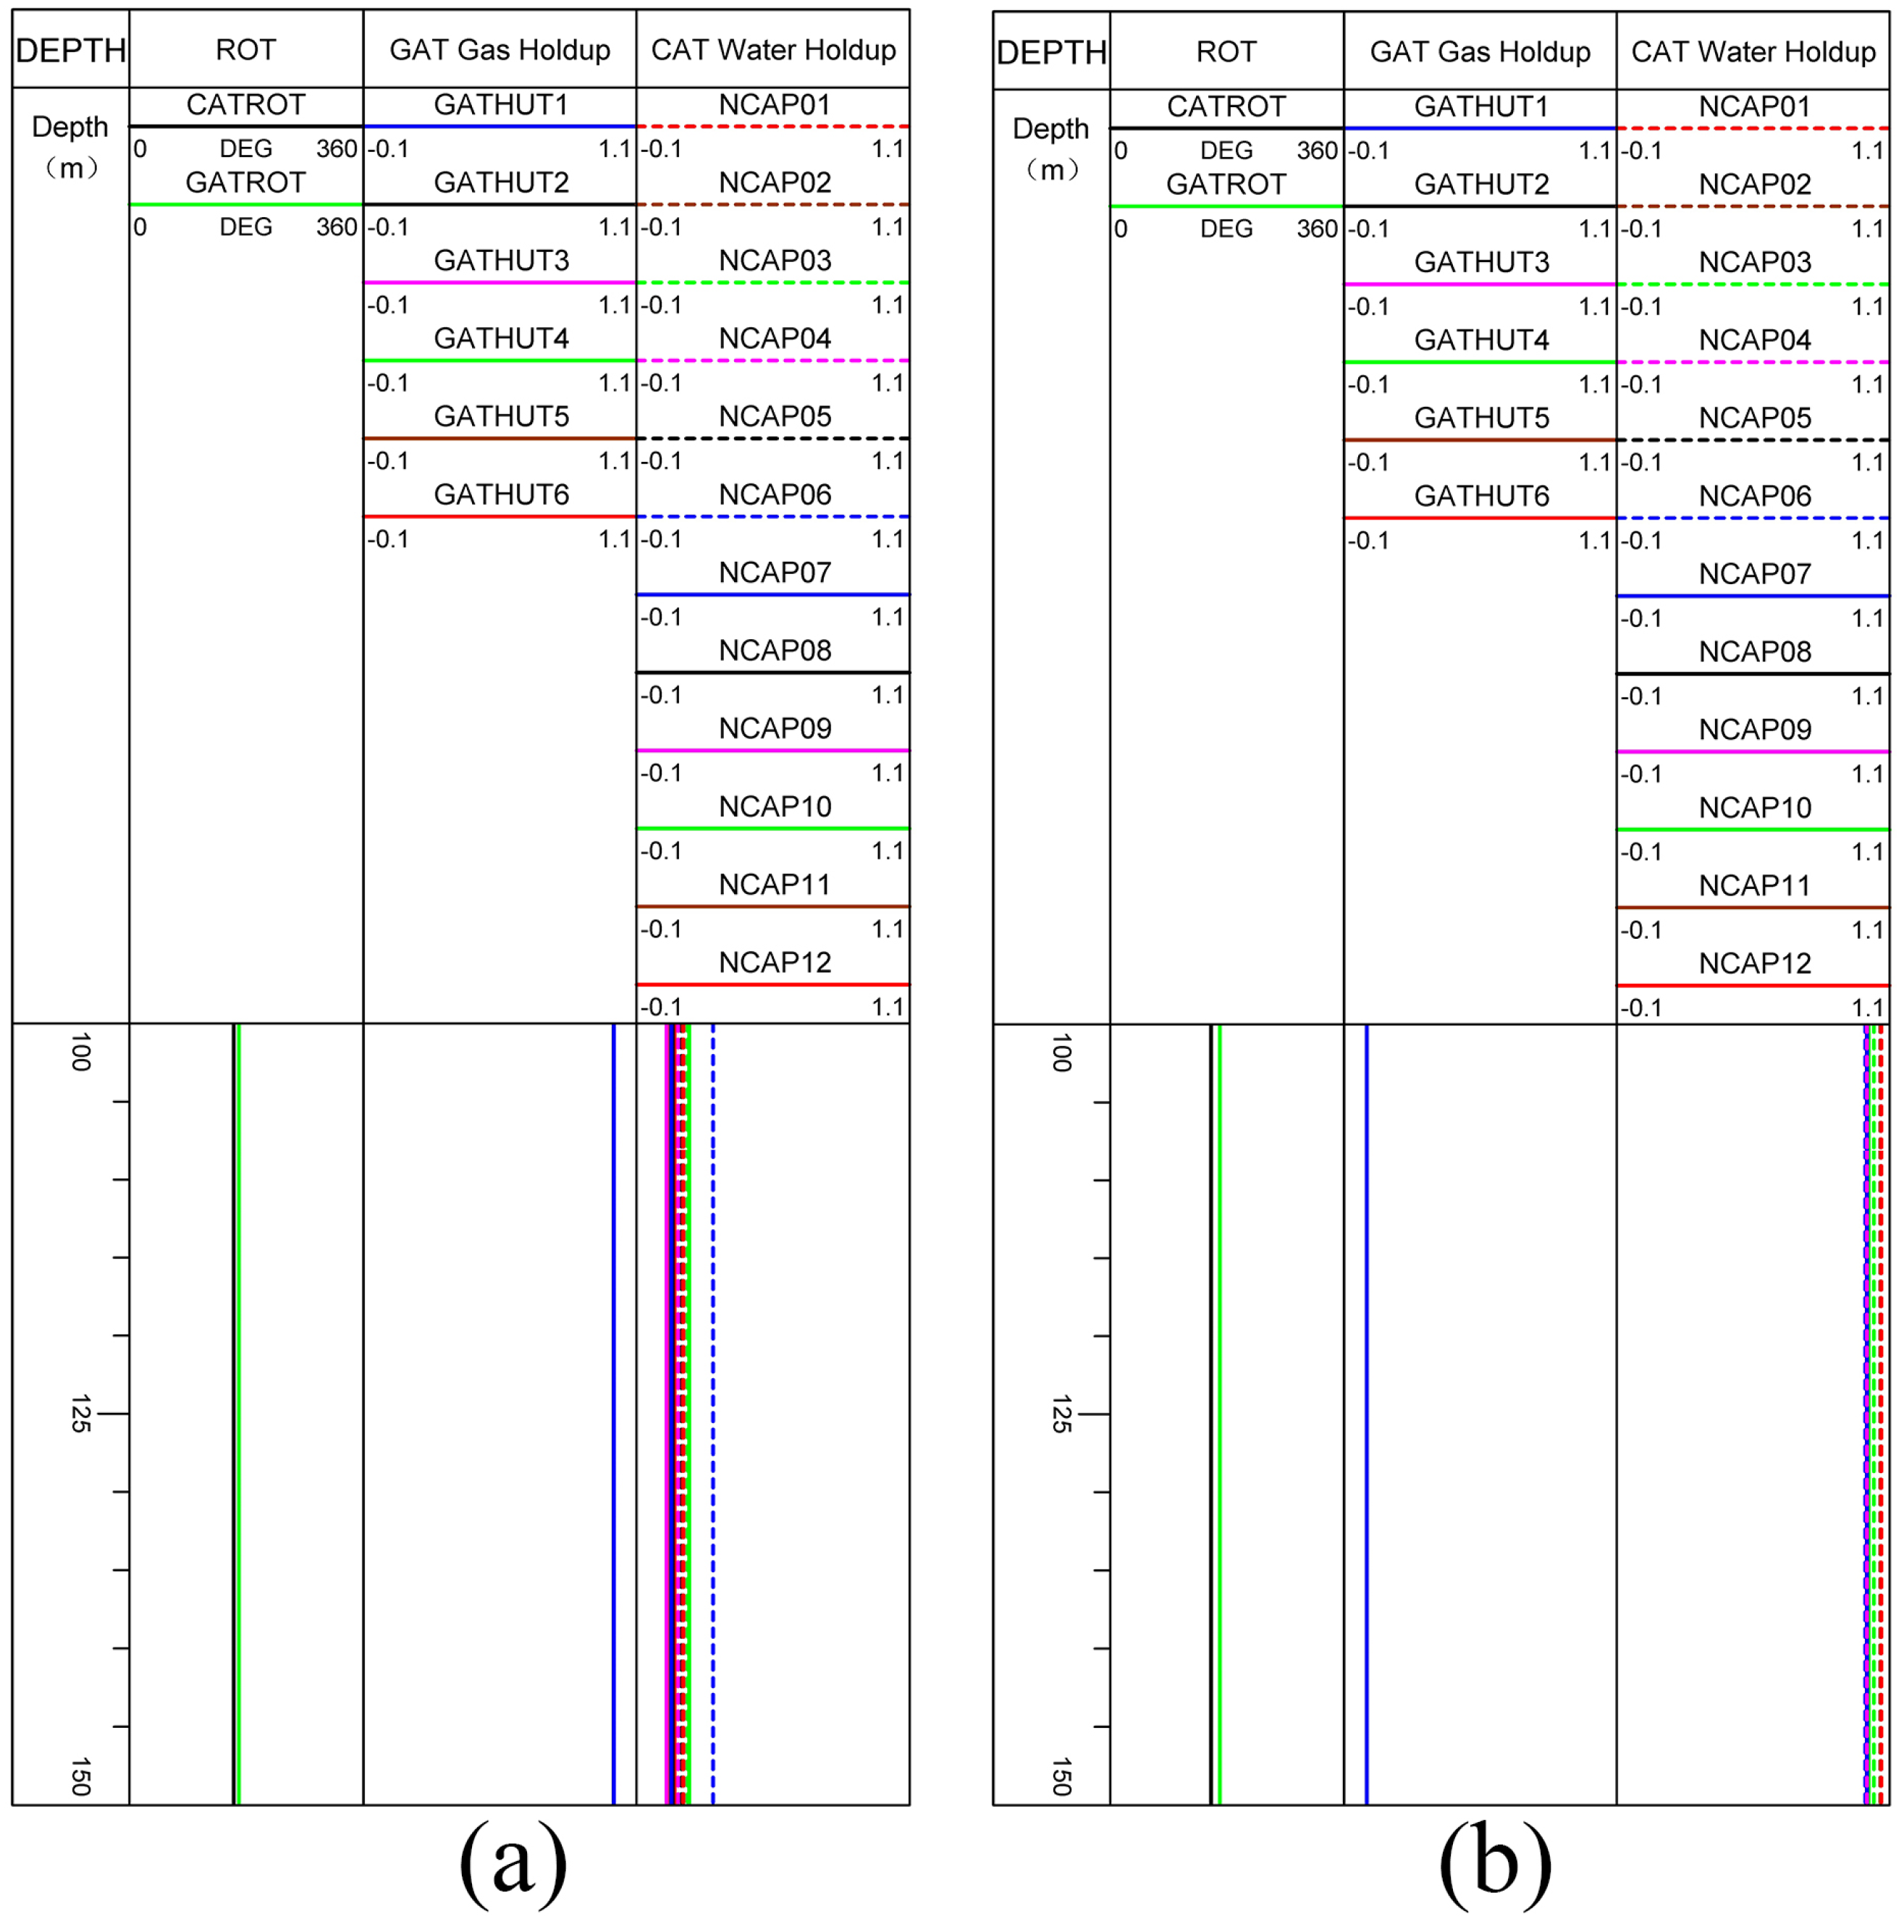
Load the data measured by the simulation measurement experiment to the CIFLog (2.1 version) platform. In the data management, you can see that there are 121 one-dimensional curves in the data, including an instrument rotation angle, gas state sampling rate, bubble count rate, gas holdup, water holdup, and the original value of holdup. As shown in
Figure 5, DEPTH represents the simulated depth recorded during the experiment; ROT represents the rotation angle of the instrument; CATROT represents the CAT rotation angle; GATROT represents the GAT rotation angle; DEG is the unit of rotation angle, which is defined by the software; GATHUT means GAT gas holdup; and NCAP means CAT water holdup. Carry out holdup plotting analysis on the calibration data in pure gas. As shown in
Figure 5a, it can be seen that the gas holdup of GAT is high, and the response of each probe is consistent. The water holdup of CAT is low, but the response of each probe is different; the calibration data in pure water is subjected to holdup plot analysis. As shown in
Figure 5b, the GAT holdup is low, and the response of each probe is consistent. The water holding capacity of CAT is high, but the response of each probe is different.
2.5. Interpolation Algorithm Analysis
When the instrument is carrying out the holdup measurement, it can only measure the holdup value at a limited point. In order to obtain the holdup of the entire wellbore section, it needs to be realized by interpolation. After investigating and analyzing the interpolation algorithm, this paper chooses the inverse distance weighted interpolation algorithm with better applicability [
14,
15,
16].
In the inverse distance weighted interpolation algorithm, it is reasonable to assume that the distribution of local gas holdup on the wellbore section is continuous and changes; then, the correlation between points decreases continuously as the distance increases. A simple distance inversely weighted interpolation is based on the relationship that the influence of the value of a known measurement point on other points to be interpolated decreases as the distance increases. The interpolation algorithm is that the gas holdup of the point to be interpolated on the wellbore section is the weighted average of the gas holdup of the known GAT probe on the wellbore section, and the coefficient is related to the distance between the point to be interpolated and the GAT probe on the wellbore section. The reciprocal of the k power of the distance (k generally takes 2) is:
where
represents the interpolated predicted value at the unmeasured point
of the wellbore interface;
represents the measured response value of the
-th probe; and
represents the
-th probe to the point
the distance.
3. Interpolation Results
The inverse distance weighted interpolation algorithm is used to interpolate the data of different measurement conditions to obtain the gas holdup image shown in
Figure 6. Both GAT and CAT instruments are distributed in a ring shape. When the instruments are rotated, the probe may no longer be symmetrically distributed. After interpolation, the gas–liquid interface in the gas holdup image will be tilted, which is similar to the actual horizontal well. There is a difference in the ratio, which cannot better reflect the distribution of gas and water in the wellbore.
Due to the influence of gravity, the flow pattern of horizontal wells is different from that of vertical wells. Horizontal wells are mainly divided into six flow patterns, namely stratified flow, wavy stratified flow, plug flow, slug flow, annular flow, and dispersed bubble flow [
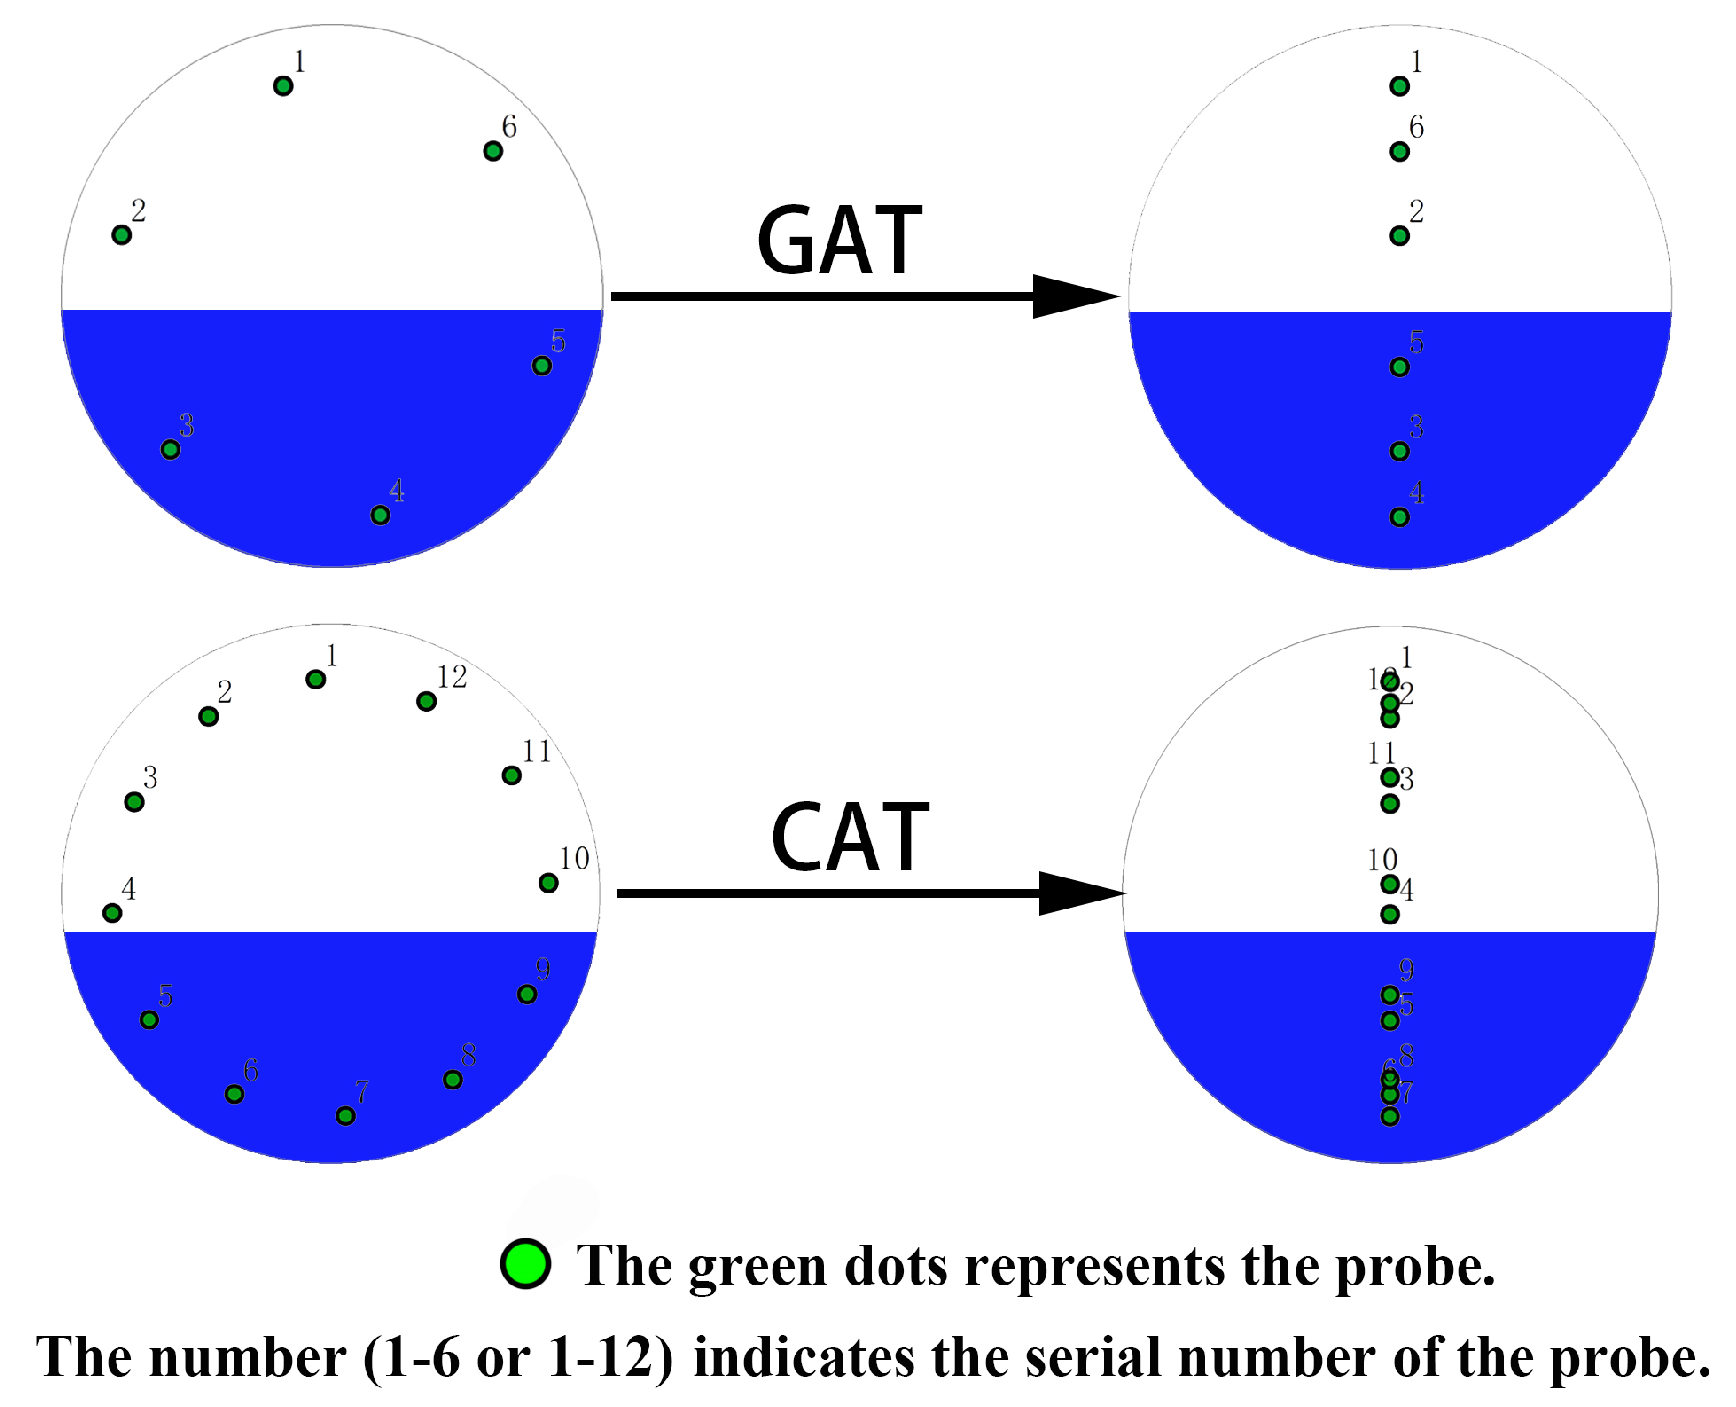
17]. The main observations in this experiment are stratified flow and wavy stratified flow. The gas–water interface is clear and level, and the horizontal and clear interface is obtained by projection. In order to solve the problem of liquid surface tilt in interpolation imaging, as shown in
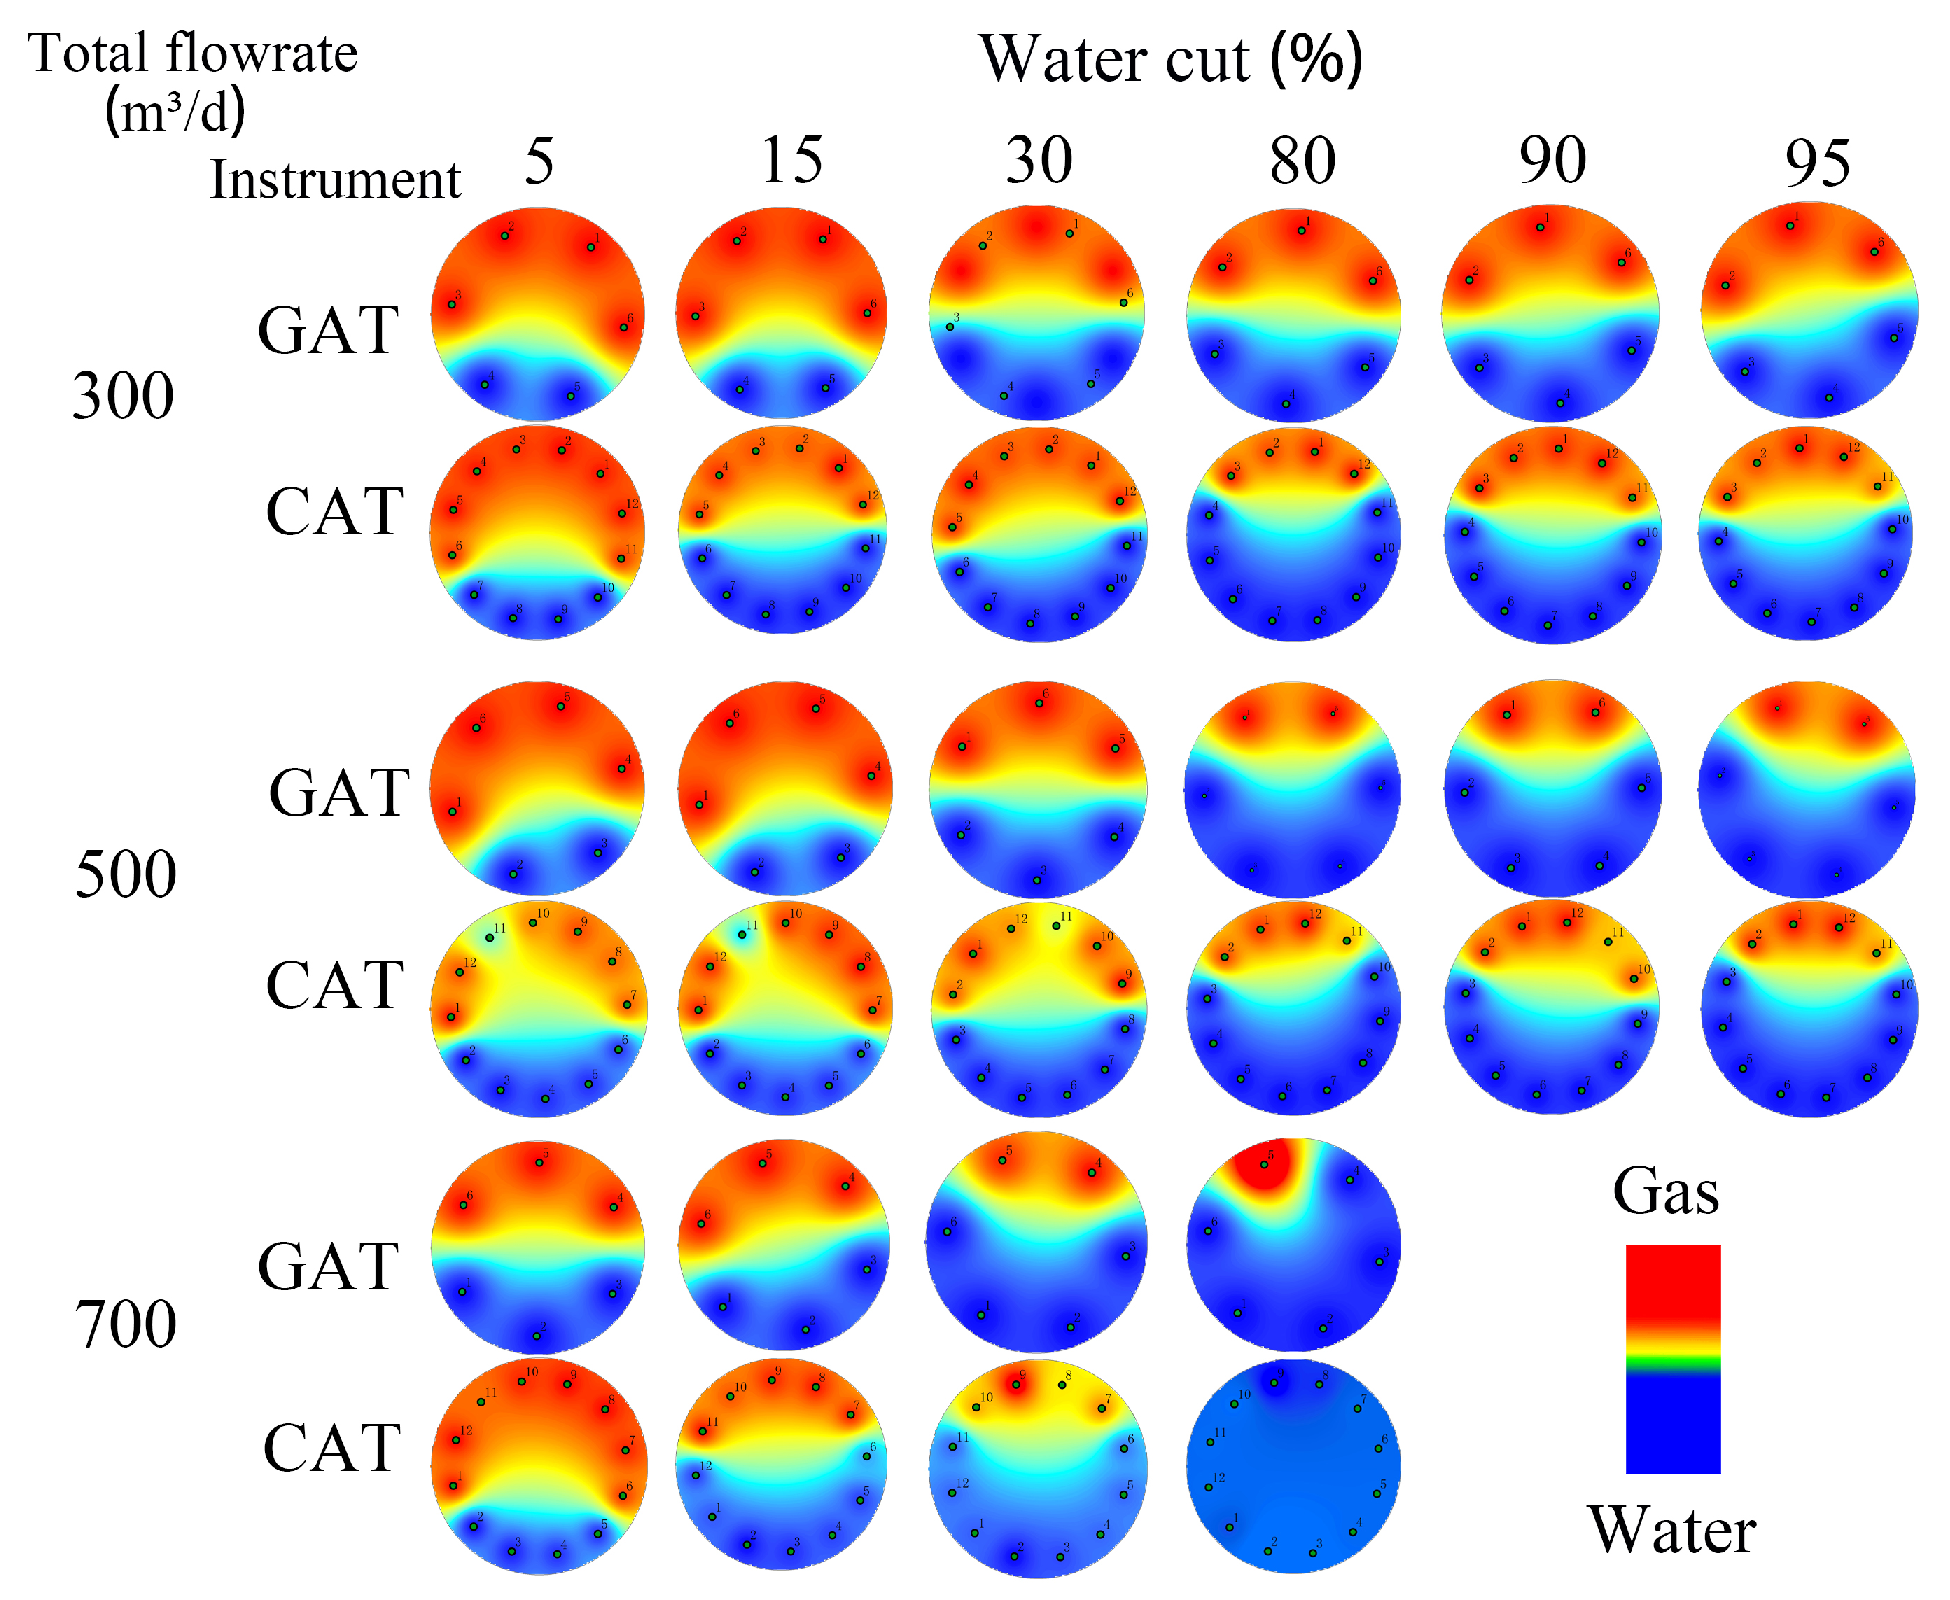
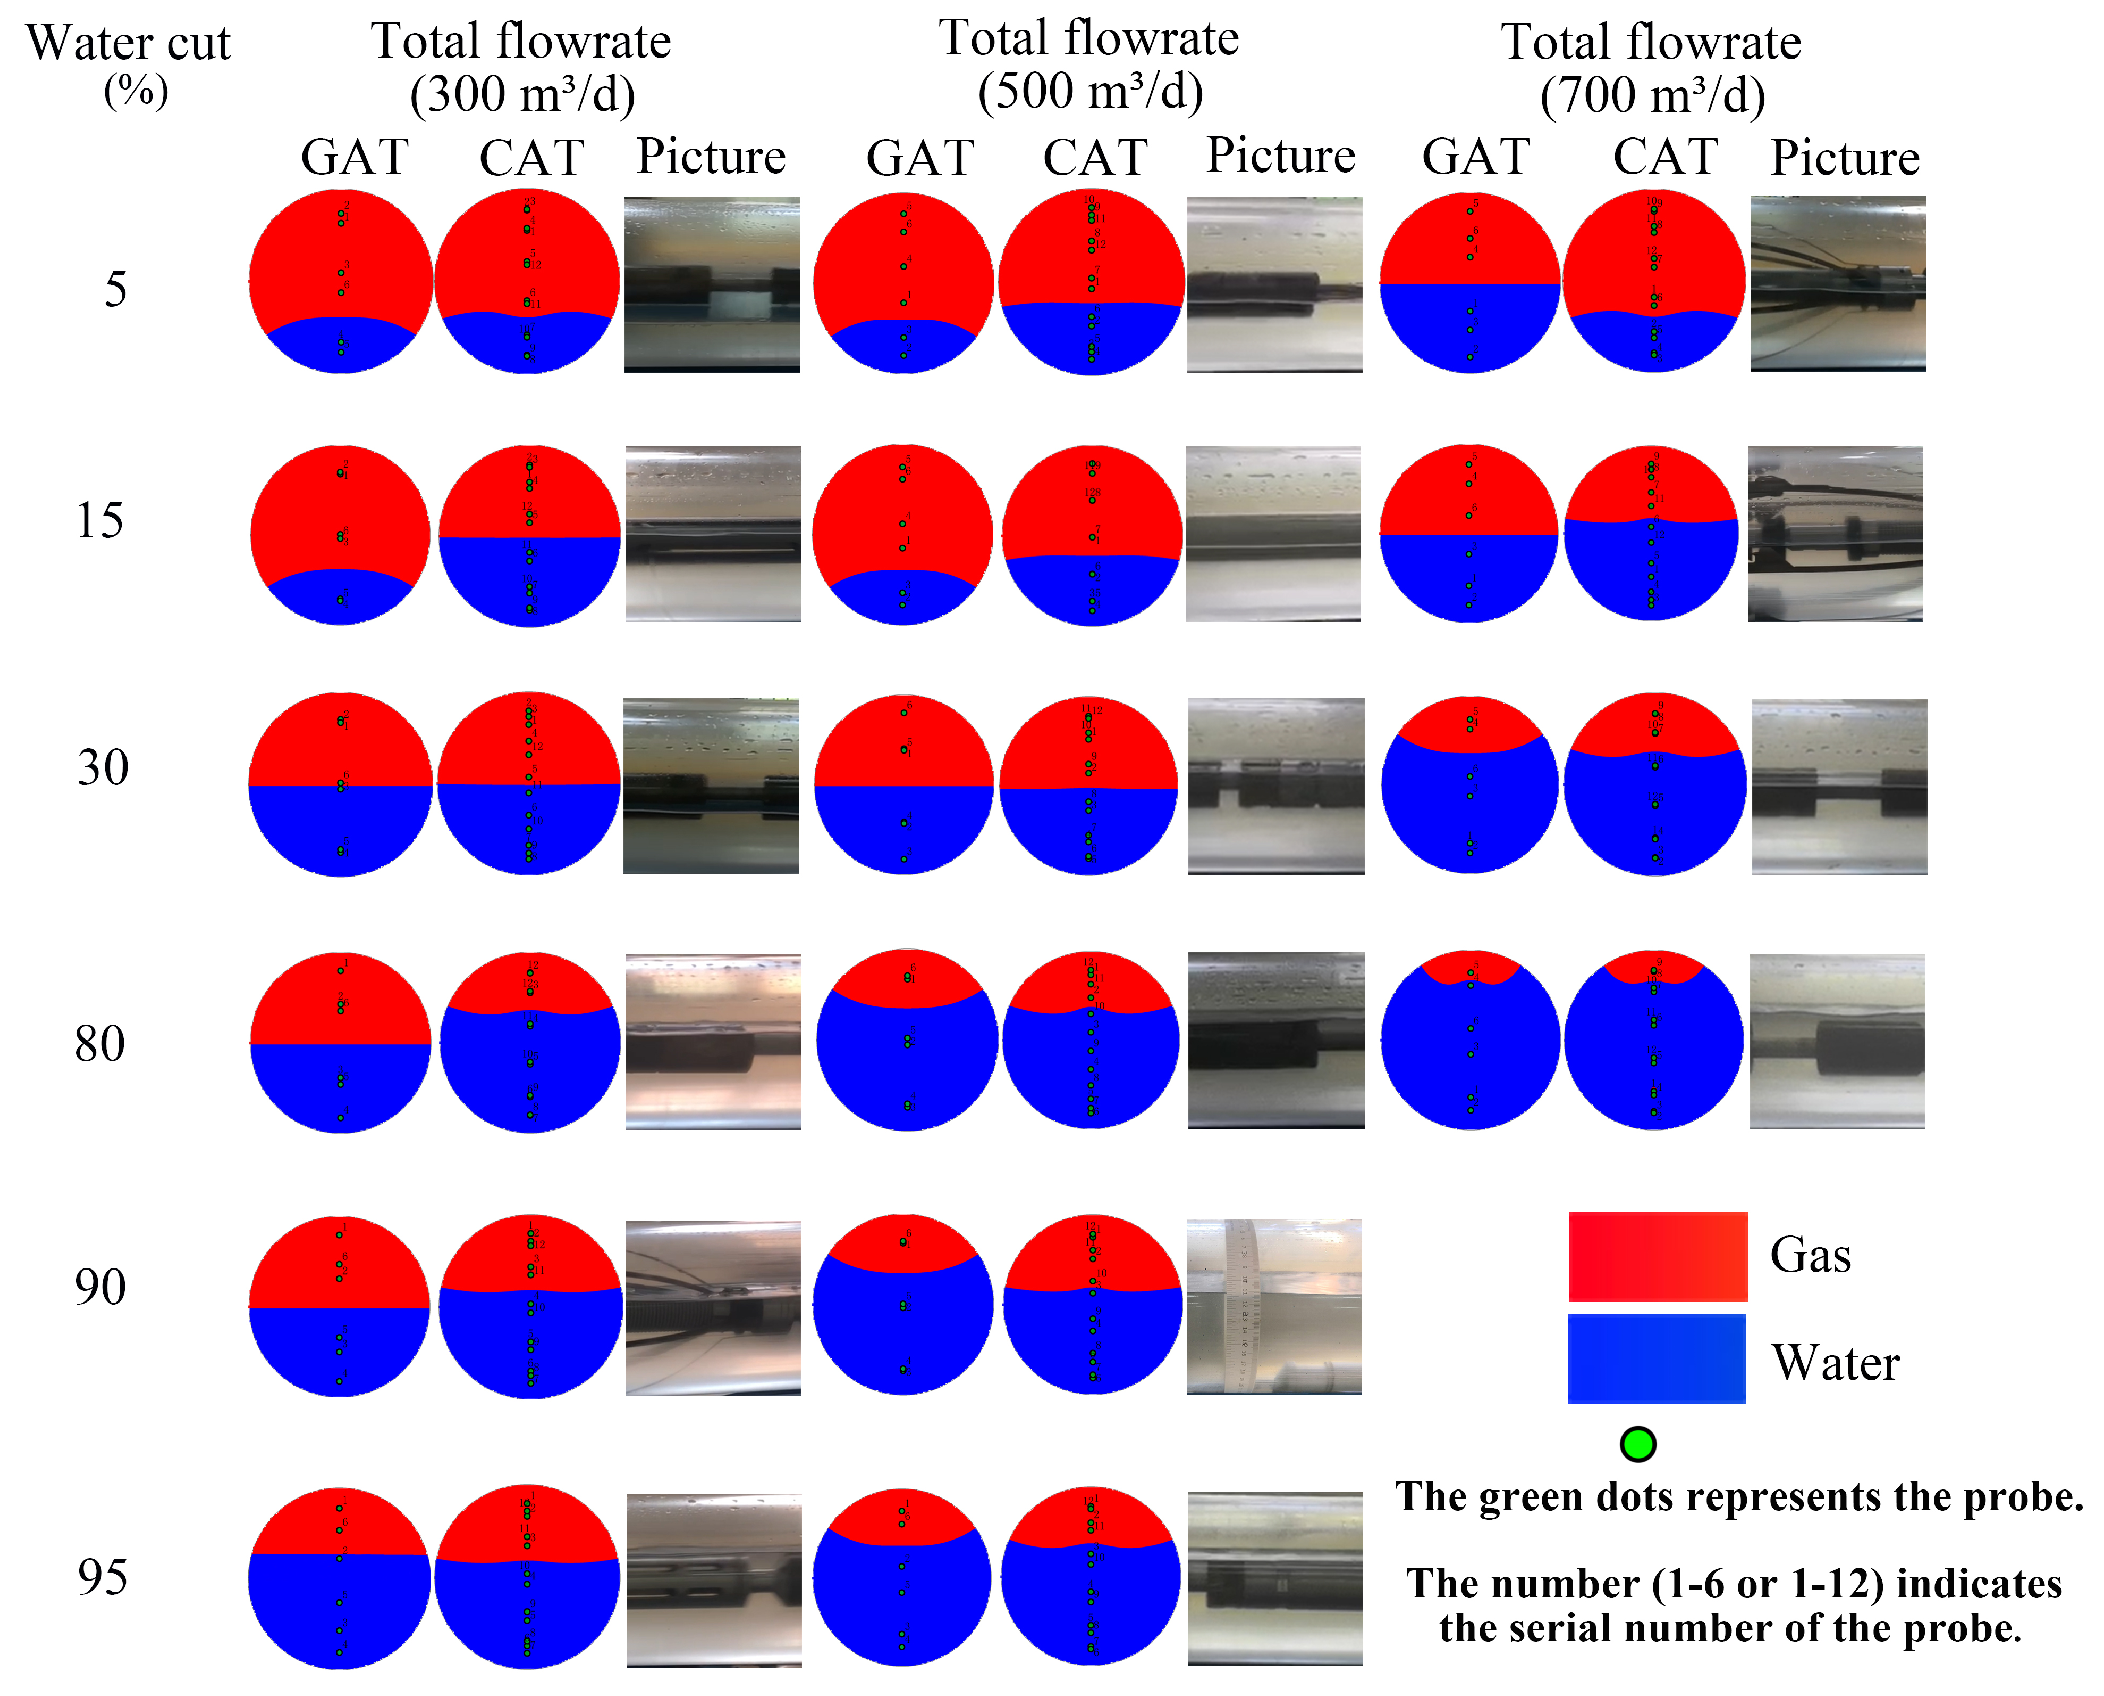
Figure 7, the GAT and CAT measurement points are projected, and all the points are projected to the center vertical position. Then, we interpolate to get the gas holdup imaging comparison chart, as shown in
Figure 8. The gas holdup measured by GAT and CAT is compared with the gas holdup measured by the quick-closing-valve (QCV), as shown in
Table 3, where
YgGAT represents the gas holdup of GAT,
YgCAT represents the gas holdup of CAT, and
YgQCV represents the gas holdup of the QCV.
4. Discussion
In
Figure 8, it is found that when the total flowrate is 300, 500, and 700 m
3/d, as the water cut increases, the liquid level rises, and both GAT and CAT can reflect the change of reduced gas holdup. As shown in
Table 3, the gas holdup measured by GAT and CAT is compared with the gas holdup measured by the QCV.
When the total flowrate is 300 m3/d, the minimum absolute error of YgGAT and YgQCV is 0.2%, and the maximum absolute error is 5.6%; the minimum absolute error of YgCA and YgQCV is 0.8%, and the maximum absolute error is 13.7%.
When the total flowrate is 500 m3/d, the minimum absolute error of YgGAT and YgQCV is 1.5%, and the maximum absolute error is 17.6%; the minimum absolute error of YgCA and YgQCV is 0.7%, and the maximum absolute error is 6.6%.
When the total flowrate is 700 m3/d, the minimum absolute error of YgGAT and YgQCV is 4.1%, and the maximum absolute error is 18.7%; the minimum absolute error of YgCA and YgQCV is 12.5%, and the maximum absolute error is 14.1%.
Through the above absolute error comparison of different flowrates, it is found that GAT has the best results at a flowrate of 300 m3/d, and each has advantages at 500 and 700 m3/d. At the same water cut and different flowrates, the gas holdup measured by GAT and CAT is compared. In the case of low water cut, the measurement results of GAT and CAT are consistent with the actual situation. In the case of high water cut, although both GAT and CAT have certain errors. In this experiment, the gas holdup measurement response of GAT is slightly better than that of CAT.
Through the above analysis, it can be found that the data measured by the GAT instrument are relatively stable, the results obtained by interpolation are consistent, and measurement stability of GAT is better under different water cuts. However, some problems have been found. There are only six probes in GAT, which has a slightly lower resolution in the longitudinal direction than CAT with 12 probes. In some cases where the water cut of GAT increases, because the height change of the liquid level is small, and the probe also has a certain height difference in the vertical direction, the liquid level is still between the two probes after the change of the liquid level, which makes it difficult for the instrument to measure the information of liquid level changes and will also result in similar interpolation images under different water cut. If future conditions permit, increase the number of GAT probes to increase the resolution in the longitudinal direction and improve the accuracy of the measurement of the interface height change.
5. Conclusions
(1) The response of each GAT probe is consistent, and the stability of each GAT probe is better than that of CAT in the experiment.
(2) GAT can accurately identify the gas in the gas-water two phase at different flowrates, different water cuts, and different cable speed measurement conditions, and the response results are consistent with the theoretical analysis.
(3) The applicability and accuracy of the gas holdup measurement of GAT under different flowrates, different water cuts, and different cable speed measurement conditions are verified, which can lay the foundation for further gas holdup measurement, interpretation, and field testing in the future.
Author Contributions
Conceptualization, S.C.; methodology, S.C.; software, Q.L.; validation, Q.L.; formal analysis, S.C.; investigation, S.C.; resources, J.L.; data curation, S.C.; writing—original draft preparation, S.C.; writing—review and editing, J.L.; visualization, S.C. and X.C.; supervision, X.C.; project administration, J.L.; funding acquisition, J.L. All authors have read and agreed to the published version of the manuscript.
Funding
This paper is supported by the Science Research Program from Hubei Provincial Department of Education (Grant No. D20151301) and Open Fund of Key Laboratory of Exploration Technologies for Oil and Gas Resources (Yangtze University), Ministry of Education (Grant No. K2018-10).
Institutional Review Board Statement
Not applicable.
Informed Consent Statement
Not applicable.
Data Availability Statement
Data is contained within the article.
Acknowledgments
All the data used in this paper are from the production logging Laboratory of College of Geophysics and petroleum resources, Yangtze University. The authors are grateful to the production logging laboratory of Yangtze University.
Conflicts of Interest
The authors declare no conflict of interest.
References
- Abbassi, L.; Tavernier, E.; Donzier, E.; Gysen, A.; Gysen, M.; Chen, C.K.; Zied, A.; Cedillo, G. Efficiency improvements in production profiling using ultracompact flow array sensing technology. Petrophysics 2018, 59, 457–488. [Google Scholar] [CrossRef]
- Zhai, L.S.; Bian, P.; Han, Y.F.; Gao, Z.K.; Jin, N.D. The measurement of gas–liquid two phase flows in a small diameter pipe using a dual-sensor multi-electrode conductance probe. Meas. Sci. Technol. 2016, 27, 045101. [Google Scholar] [CrossRef]
- Rice, H.P.; Fairweather, M.; Peakall, J.; Hunter, T.N.; Mahmoud, B.; Biggs, S.R. Measurement of particle concentration in horizontal, multiphase pipe flow using acoustic methods: Limiting concentration and the effect of attenuation. Chem. Eng. Sci. 2015, 126, 745–758. [Google Scholar] [CrossRef]
- Zhang, X.L.; Liu, X.R. Production logging of highly deviated and horizontal wells. Pet. Instrum. 2007, 6, 1–4. [Google Scholar] [CrossRef]
- Li, Y.B. Application of production logging array imager in horizontal wells. Electron. Test. 2017, 17, 85. [Google Scholar] [CrossRef]
- Yin, G.P.; Liu, H.; Zou, Y.Y.; Chen, H.X. Application of production logging array imager in horizontal wells. Pet. Tubing Tools 2016, 2, 59–62. [Google Scholar] [CrossRef]
- Wang, T.T.; Liu, J.F.; Li, B.K.; Deng, H.; Cui, S.F. Data analysis of gas-water two phase holdup in horizontal wells based on array optical fiber probe. Yunnan Chem. Ind. 2020, 252, 66–67. [Google Scholar]
- Meng, X. Imaging Study of Oil-Water Two Phase Flow in Horizontal Wells Based on MAPS. Master’s Thesis, Yangtze University, Wuhan, China, June 2019. [Google Scholar]
- Rui, Y. Study on the Processing Method of MAPS Holdup Imaging. Master’s Thesis, Yangtze University, Wuhan, China, June 2016. [Google Scholar]
- Hao, H. Research on the Measurement Technology of Phase Separation Holdup with a Novel Dual Receiving End Optical Fiber Probe Sensor. Master’s Thesis, Yanshan University, Qinhuangdao, China, June 2019. [Google Scholar]
- Hang, T.Y.; Liu, F.; Wang, X.L.; Ye, S.; Chen, Z.T. Development process and light transmission test of sapphire optical fiber probe sensor. Opt. Photoelectr. Technol. 2017, 15, 26–32. [Google Scholar] [CrossRef]
- Hao, Z.Y. Structural Optimization Design of Optical Fiber Probe Sensor for Gas Holdup Measurement of Oil Gas Water Three-Phase Flow. Master’s Thesis, Yanshan University, Qinhuangdao, China, June 2017. [Google Scholar]
- Zhang, Y.; Li, Y.W.; Liu, X.B.; Wang, Z.Y.; Shen, R.Q. Simulation and shape optimization of optical fiber probe for gas holdup measurement. Pet. Pipe Instrum. 2015, 1, 82–84. [Google Scholar] [CrossRef]
- Zhang, H.B.; Guo, H.M.; Dai, J.C.; Liu, J.F.; Huang, Z.J.; Wu, L.J.; Ma, H.Y. Application of cat in horizontal well water holdup imaging logging tool. Pet. Instrum. 2008, 33–34. [Google Scholar] [CrossRef]
- Liu, J.F.; Xu, Y.Z.; Wu, Q.X. Flow imaging analysis of capacitive and resistive annular array probes. Prog. Geophys. 2018, 33, 2141–2147. [Google Scholar]
- Liu, X.L. Study on imaging logging method of oil-water two phase flow in horizontal wells based on array probe. Pet. Tubing Tools 2018, 4, 70–73. [Google Scholar]
- Dukler, A.E.; Taitel, Y. Flow pattern transitions in gas–liquid systems: Measurement and modeling. Multiph. Sci. Technol. 1986, 1–94. [Google Scholar] [CrossRef]
| Publisher’s Note: MDPI stays neutral with regard to jurisdictional claims in published maps and institutional affiliations. |
© 2021 by the authors. Licensee MDPI, Basel, Switzerland. This article is an open access article distributed under the terms and conditions of the Creative Commons Attribution (CC BY) license (http://creativecommons.org/licenses/by/4.0/).


