Article

Measurement of the Elastic Modulus and Residual Stress of Thermal Barrier Coatings Using a Digital Image Correlation Technique

1
Faculty of Civil Engineering and Mechanics, Jiangsu University, Zhenjiang 212013, China
2
National Center for International Research on Structural Health Management of Critical Components, Jiangsu University, Zhenjiang 212013, China
3
National Key Laboratory of Science and Technology on Advanced Composites in Special Environments, Harbin Institute of Technology, Harbin 150001, China
*
Author to whom correspondence should be addressed.
These authors contributed equally to this work and should be considered as co-first authors.
Coatings 2021, 11(2), 245; https://doi.org/10.3390/coatings11020245
Submission received: 12 January 2021 / Revised: 10 February 2021 / Accepted: 13 February 2021 / Published: 19 February 2021
(This article belongs to the Section Ceramic Coatings and Engineering Technology)

Abstract

:
This paper presents an experimental study on simultaneously measuring the elastic modulus and residual stress of a thermal barrier coating (TBC) after different isothermal heat treatments. The elastic modulus and residual stress of TBCs were theoretically analyzed based on composite beam bending theory. Thereafter, an experimental setup was established combining the 3D digital image correlation method with the bending test to obtain the curvature changes in the TBC sample. Finally, the elastic modulus and residual stress of the ceramic layer with different isothermal heat treatments were obtained. The results show that the elastic modulus of the ceramic layer measured under compression is greater than that under tension, and the elastic modulus of the ceramic layer increases first and then tends to be stable as the heat treatment time increases. In addition, the residual stress of the TBCs ceramic layer quickly changes from compressive stress to tensile stress with heat treatment, and the tensile stress increases with the increase in thermal exposure time. Furthermore, the reasons for the change tendency were analyzed according to the variation in porosity and microstructures by processing the scanning electron microscope (SEM) figures. The results demonstrate that simultaneously determining the elastic modulus and residual stress of TBC based on combining the 3D digital image correlation method with the bending test is effective and reliable.

1. Introduction

The application of thermal barrier coatings (TBCs) to components of gas turbine engines with internal cooling has dramatically increased the turbine entry temperature, thereby improving the performance and efficiency of gas turbine engines. Plasma-sprayed coatings were first brought into use, and currently remain as one of the most economical methods for the preparation of TBCs. There are substantial pores, cracks, interfaces, and other defects inside plasma-sprayed coatings and, as a result, the mechanical properties of the coatings are significantly different from the bulk counterparts [1,2,3]. In addition, the microstructure of the plasma-sprayed coating will continuously vary with the shrinkage of pores and cracks when exposed to high temperature, and its mechanical properties will consequently change [4,5]. Determining the mechanical properties of plasma-sprayed coatings is of great scientific and technological significance. It allows for a better understanding of the role of microstructure features and its relationship with mechanical properties [6]. Moreover, the evolution of mechanical properties with thermal loading is important for numerical models and analysis of failure mechanisms [7,8]. A typical TBC is a multilayer structure; each layer has different physical, thermal and mechanical properties. During service, TBCs must withstand harsh environments including extreme temperatures. Therefore, residual stress inevitably occurs in the thermal spraying process and evolves during its service life. However, high residual stresses in TBCs could lead to cracking, delamination of the coating, and shape changes, and deteriorate the performance and reliability of the entire structure. Considerable efforts, though difficult, have been made to estimate and understand the residual stresses [9,10].
There have been substantial investigations into the mechanical properties of TBC. Non-destructive testing methods such as the impulse excitation technique (IET) and ultrasonic methods have been successfully applied to the mechanical properties of TBCs. IET has become a widely accepted method for the determination of accurate stiffness and damping values for monolithic materials [11]. As a microscale measurement method, the indentation technique has been employed to estimate the elastic modulus of plasma-sprayed coatings [12]. The operation is automatic and fast [13,14]. However, the reliability of the results is susceptible to influence by the microstructures inside the specimens. Some static methods including bending [15,16], uniaxial tension [17], and cantilever beam [5] methods have been successfully used to evaluate the elastic modulus of plasma-sprayed coatings. Since plasma-sprayed coatings are brittle ceramics with thin thickness and the strain of specimens under loading is small, the tests should be carefully controlled with high resolution detectors. The curvature method has also been applied to measure the elastic modulus of plasma-sprayed coatings based on bi-layer beam equilibrium [18]. The tests are more stable and controllable with the requirement of detectable curvature under thermal loading. Measurement techniques of residual stress in coatings can generally be divided into non-destructive and destructive techniques. The non-destructive techniques usually measure parameters that are related to stress, such as X-ray or neutron diffraction and the curvature method. The X-ray or neutron diffraction probes the changes in lattice constants caused by stress [19]. The main drawback of these techniques is the shallow penetration depth of the incident beam, which confines the analysis to a surface layer. In order to obtain stress/depth profile, X-ray diffraction can be combined with layer removal methods. However, a progressive layer removal technique is generally unadvisable for ceramic materials where an uncontrolled stress relaxation or modification can occur. The destructive techniques such as block sectioning, slitting and hole-drilling with strain gauge rosettes are well established worldwide due to their versatility and reliability. Meanwhile, the full-field optical techniques including Moiré interferometry, electronic speckle-pattern interferometry (ESPI), and digital image correlation (DIC) have been advantageously used with hole-drilling to determine residual stresses from surface displacements (or strains) [20,21]. Generally, experimental measurements of elastic modulus and residual stress of TBCs are implemented separately; each implementation is troublesome and time-consuming. Therefore, further research is imperative for the evaluation and design of plasma-sprayed TBCs.
The present work aims to develop an experimental method to simultaneously determine the elastic modulus and residual stress of TBCs by a 3D digital image correlation technique. First, theoretical studies on composite beam bending were conducted to establish the formulas to determine the elastic modulus and residual stress of TBCs. Second, digital image correlation was employed to obtain curvatures of the TBC specimens with varying high temperature exposure time. Finally, elastic modulus and residual stress of TBCs are obtained followed by discussion and conclusions.

2. Theoretical Analysis

Considering that the superalloys have good thermodynamic properties and large thickness, the TBC system generally does not have a large impact on the substrate during the preparation process. The analysis assumes uniform temperature and thermal stress, and does not consider plastic deformation and stress release mechanisms. The elastic modulus of the bond coating and the substrate is equivalent, so the bond coating and the substrate can be equivalent to one layer to simplify the model. And the composite elastic modulus of the substrate and the bond layer was used to calculate in the process.
Consider a two-layer beam of uniform cross section with each layer composed of a homogeneous isotropic material subject to bending moment of magnitude M, and the upper layer is subjected to residual stress σR, as shown in Figure 1. The sign direction is specified, and whether the curvature is positive or negative depends on the sign of the moment M and residual stress σR. A right-handed coordinate system with the neutral layer as the x-axis and the positive y-axis pointing downward is established. The M direction shown in Figure 1 is positive, that is, the upper side of the neutral axis is compressed, and the lower side is tensioned. Residual stress is negative for compression and positive for tension. Therefore, positive bending moments or negative residual stresses provide the system with positive curvature, while negative bending moments or positive residual stresses cause the system to produce negative curvature.
The sum of axial force in the cross section is therefore equal to zero,
  σ c d A c +   σ s d A s = 0 ,
where Ac and A s are the cross-sectional areas of the deposited coating and substrate, respectively; and σ c and σ s are axial stresses in the cross section of coating and substrate, respectively. Assuming small strain and neglecting residual stress in the substrate, the normal stresses in the cross section are [18,22]:
σ c = E ¯ c κ y + σ R ,
σ s = E ¯ s κ y ,
κ = κ 0 + Δ κ ,
where κ is the curvature of the bending beam; κ 0 is the initial curvature without external loading; and Δ κ is the curvature change subject to external loading.   σ R is the residual stress of the coating. For plain strain, E ¯ i   =   E i / 1 υ i 2 , where E i and υ i are the elastic modulus and Poisson ratio, respectively.
Substituting Equations (2) and (3) into Equation (1), the force equilibrium equation of the pure bending beam is:
E ¯ c h 1 h c h 1 ( κ y + σ R E ¯ c ) d y + E ¯ s h 1 h 0 κ y d y = 0 ,
where h1 is the distance from the neutral surface to the interface; and h 0 is the distance from the neutral surface to the bottom of the substrate.
Similarly, the sum of the internal moments is equal to the external moment,
h 1 h c h 1 σ c y d y + h 1 h 0 σ s y d y = M .
By substituting Equations (2) and (3) into Equation (6), the moment equilibrium equation of the pure bending beam is:
E ¯ c h 1 h c h 1 κ y + σ R E ¯ c y d y + E ¯ s h 1 h 0 κ y 2 d y = M .
Equations (5) and (7) can be generalized into:
κ = 12 E ¯ c h c + E ¯ s h s ξ M + 6 E ¯ c h c h s h c + h s ξ σ R ,
where h s   =   h 0 + h 1 , and:
ξ = E ¯ c 2 h c 4 + 4 E ¯ c h c 3 E ¯ s h s + 6 E ¯ c h c 2 E ¯ s h s 2 + 4 E ¯ c h c E ¯ s h s 3 + E ¯ s 2 h s 4
Equation (8) can be regarded as a linear equation of κ and M, which can be measured experimentally. If assuming,
a = 12 E ¯ c h c + E ¯ s h s ξ ,   b = 6 E ¯ c h c h s h c + h s ξ σ R .
then a and b can be determined according to the linear fitting of κ and M. This then leads to:
E ¯ c = 2 a E ¯ s h c 2 h s 3 a E ¯ s h s 2 h c 2 a E ¯ s h s 3 + 6 + 2 a 2 h c 4 h s 2 E ¯ s 2 + 3 a 2 h c 3 h s 3 E ¯ s 2 + 4 a 2 h c 2 h s 4 E ¯ s 2 + 3 a 2 h c h s 5 E ¯ s 2 + a 2 h s 6 E ¯ s 2 3 a h c 2 h s E ¯ s 9 a h c h s 2 E ¯ s 6 a h s 3 E ¯ s + 9 a h c 3 ,
σ R = b E ¯ c 2 h c 4 + 4 E ¯ c h c 3 E ¯ s h s + 6 E ¯ c h c 2 E ¯ s h s 2 + 4 E ¯ c h c E ¯ s h s 3 + E ¯ s 2 h s 4 6 E ¯ c h c h s h c + h s .
Therefore, the two unknowns, E ¯ c and σ R can be simultaneously obtained.

3. Experimental

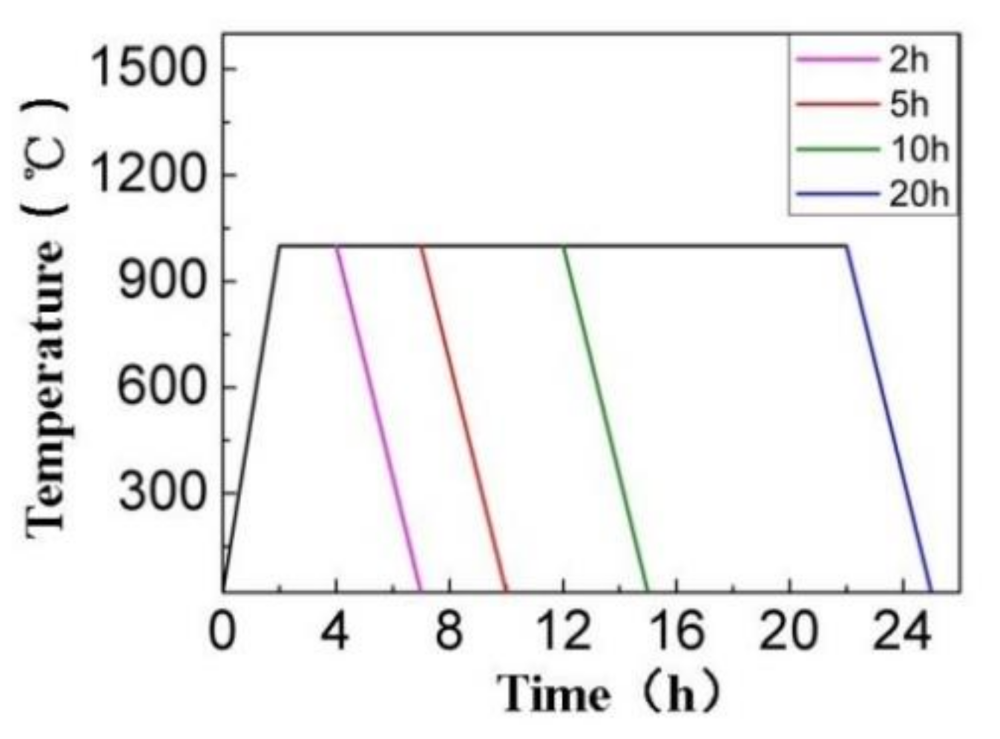
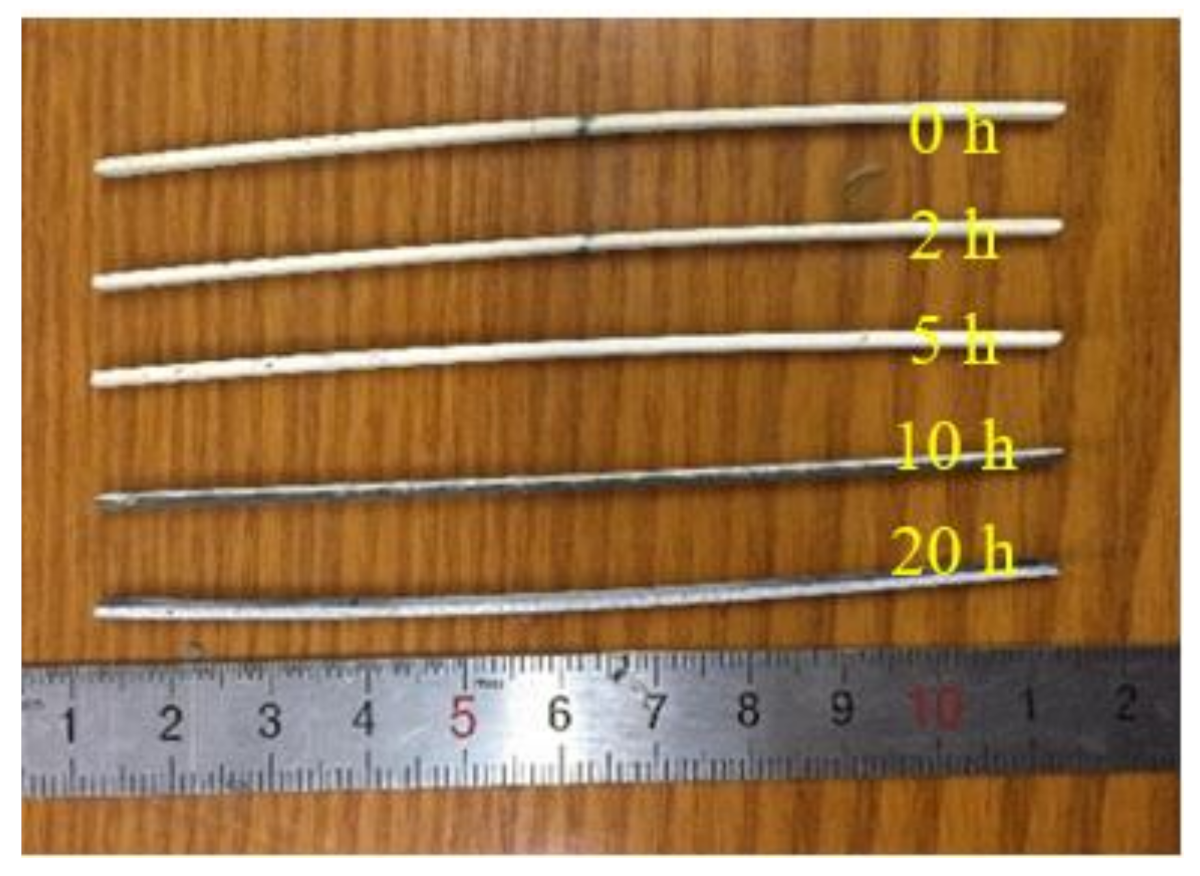
3.1. Specimen Preparation

A superalloy GH4169 substrate was firstly cut comb-shaped with electrical discharge machining, then was cleaned ultrasonically, and sandblasted to improve the bonding strength of the subsequent deposited coatings, as shown in Figure 2. NiCoCrAl−Y2O3 powder (BGRIMM Advanced Materials Science & Technology Co., Ltd., Beijing, China) with a particle size distribution of 45−106 μm was selected as the bond-coat material and yttrium oxide stabilized zirconia (8 wt.% Y2O3, 8YSZ, 38−75 μm, Precursor Plasma Powders Co., Ltd., China) was used as the feedstock to deposit the topcoat. A HVOF spraying system (JP8000, Praxair Surface Technologies, Inc., Bury, CT, USA) with a torch (TAFA 8220) and an atmospheric plasma spraying system (3710, Praxair Surface Technologies, Inc., Bury, CT, USA) with a high energy plasma gun (SG-100) were used for bond coating and top coating deposition, respectively. The thickness of the bond-coat and topcoat was about 150 μm and 330 μμm, respectively. The spraying parameters and material parameters are listed in Table 1.
The comb-shaped TBC was cut into strips with a dimension of about 100 × 3 × 1 mm3. Four of the comb-shaped TBC specimens were subjected to high temperature loading with homogeneous temperature distribution in a furnace. The four comb-shaped specimens were dwelling in the highest temperature of 1000 °C for 2, 5, 10 and 20 h, respectively. The high temperature loading is presented in Figure 3. The specimens after different high temperature loading are shown in Figure 4.

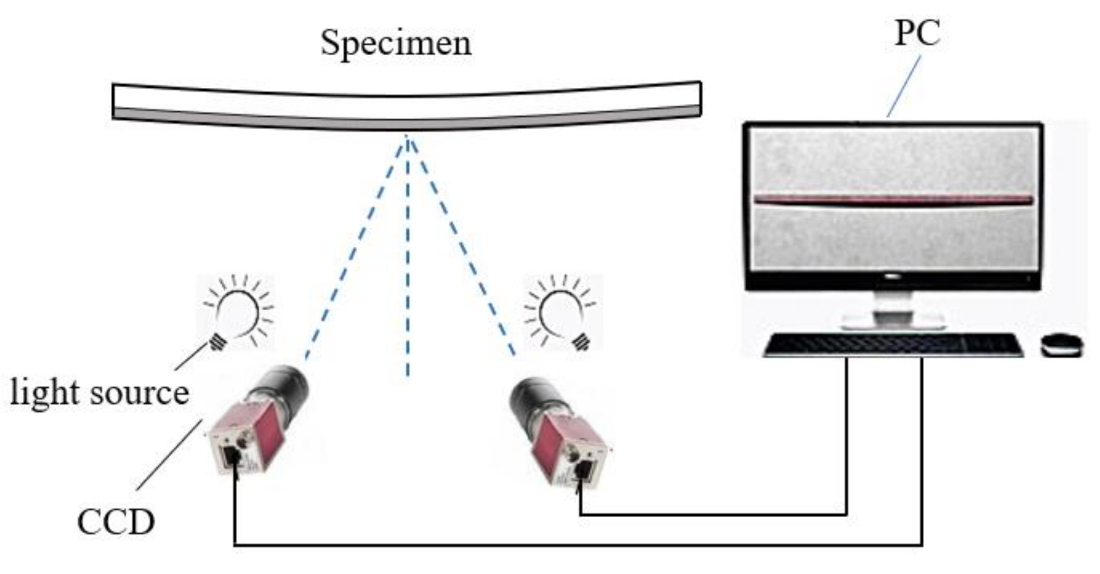
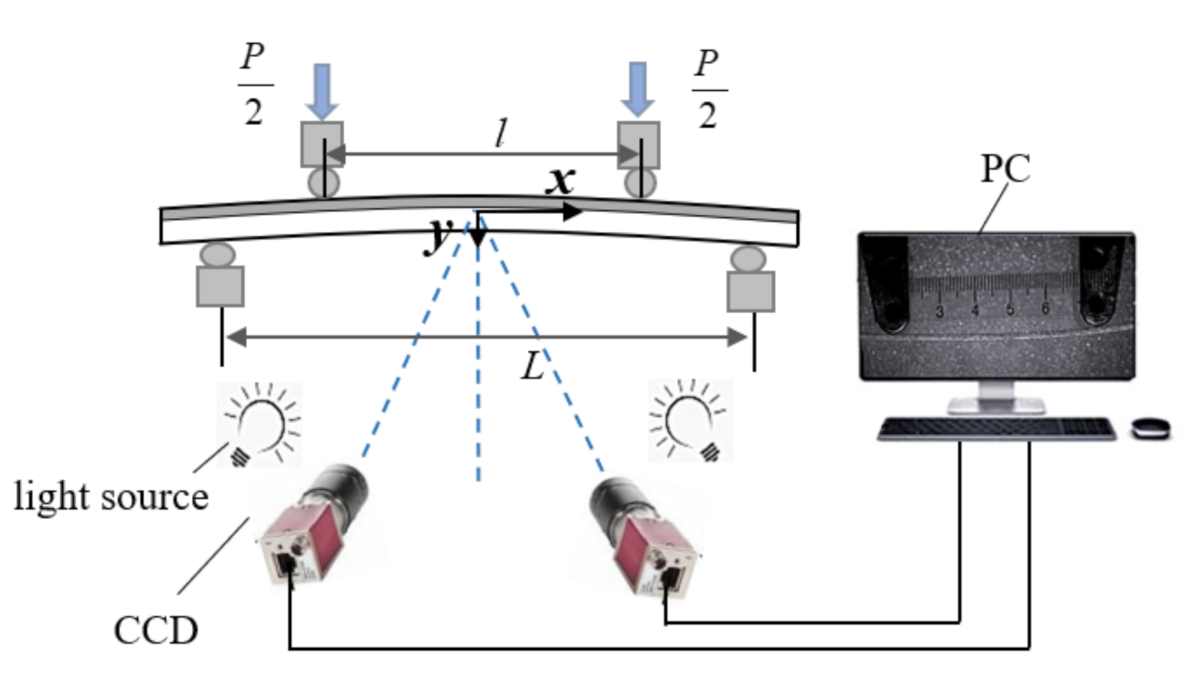
3.2. Digital Image Correction

Digital image correction (DIC) is a noncontact, non-interferometric, image-based optical technique for deformation measurement. 3D DIC processes the image pairs acquired by two synchronized cameras to measure all three displacement components of planar or non-planar object surfaces [23,24,25,26].
A 3D DIC system was used for the morphology measurement of TBC specimens to obtain initial curvatures, as shown in Figure 5. Black paint was sprayed on the surface of topcoat as speckle patterns before the experimental measurement. Images were simultaneously captured using two CCD cameras (Schneider1.4/23-0902) with a resolution of 1600 × 1200 pixels. The angle between the optical axes of the two cameras was at about 45°. The two camera system was calibrated by acquiring image pairs of a standard grid undergoing arbitrary motions, and then images of each TBC specimen were captured for extracting its 3D contour. A commercial DIC software (Vic-3D, Correlated Solutions, Inc., Keasbey, NJ, USA) was used for DIC calculation. A subset of 20 × 20 pixel2 and a step size of 10 pixels were selected in the calculation. The initial curvatures of the TBC specimens were finally extracted with polynomial fitting using least square method according to the 3D contours of the DIC measurement.
Similarly, the 3D DIC system was used for the cross-sectional profile measurement of TBC specimens to obtain curvature changes, as shown in Figure 6. Four-point bending was applied to the specimens by a micro-mechanical testing machine. The span between the two support points was 70 mm and the span between the two loading points was 50 mm. In order to obtain digital images for DIC analysis, the speckle pattern was fabricated by spraying black paint on the cross section of the specimen. The tests were carried out under a constant displacement rate of 0.1 mm/min at the loading point. During the tests, the load P and the image on the cross section of the specimen were continuously recorded with a load transducer and a CCD camera, respectively. The resolution of force was 0.2 N. The resolution of the CCD camera was 1600 × 1200 pixels. A subset of 15 × 15 pixel2 was selected in the calculation. Note that the CCD cameras began to record images before loading. During the experiment, a corresponding deformed image was captured immediately when the load increased. For instance, when the load increased to 3 N, an image was taken and named as 3 N. Since the loading speed is very low, there was sufficient time for image capture without breaking off the machine. In this way, the captured images for DIC calculation can be guaranteed to be synchronized with the testing set-up. The tested specimen was topcoat-upward loaded so that the topcoat was in a compressed stress state, or topcoat-downward loaded so that the topcoat was in a tensile stress state. Figure 6 shows that the specimen is in a topcoat-upward loading state. After the tests, the microstructures of the TBC specimens were measured using a scanning electron microscope (SEM, ZEISS Merlin Compact, Jena, Germany).

4. Experimental Results and Discussion
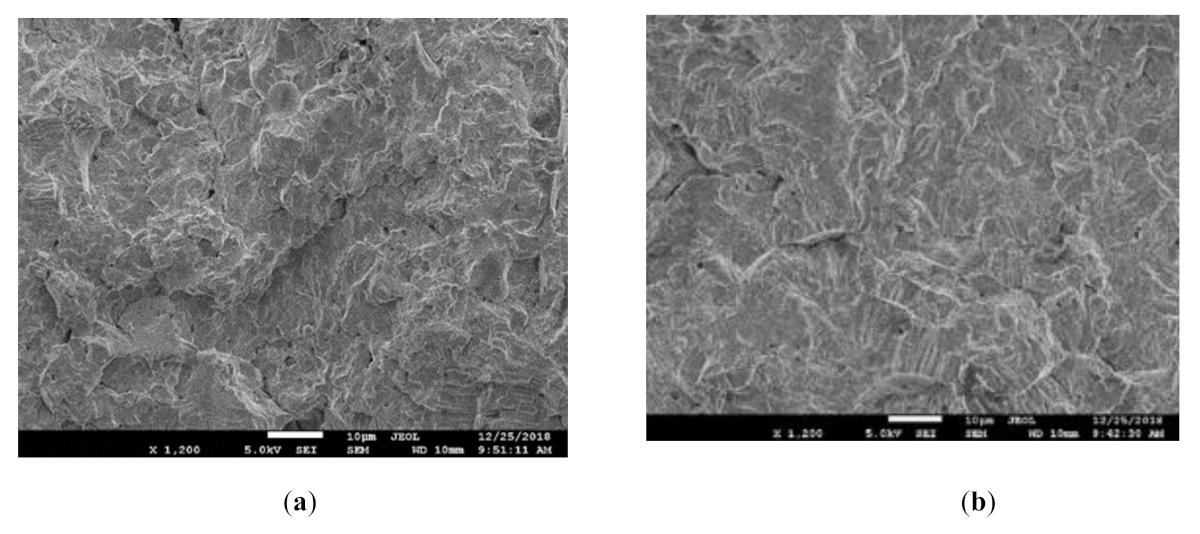
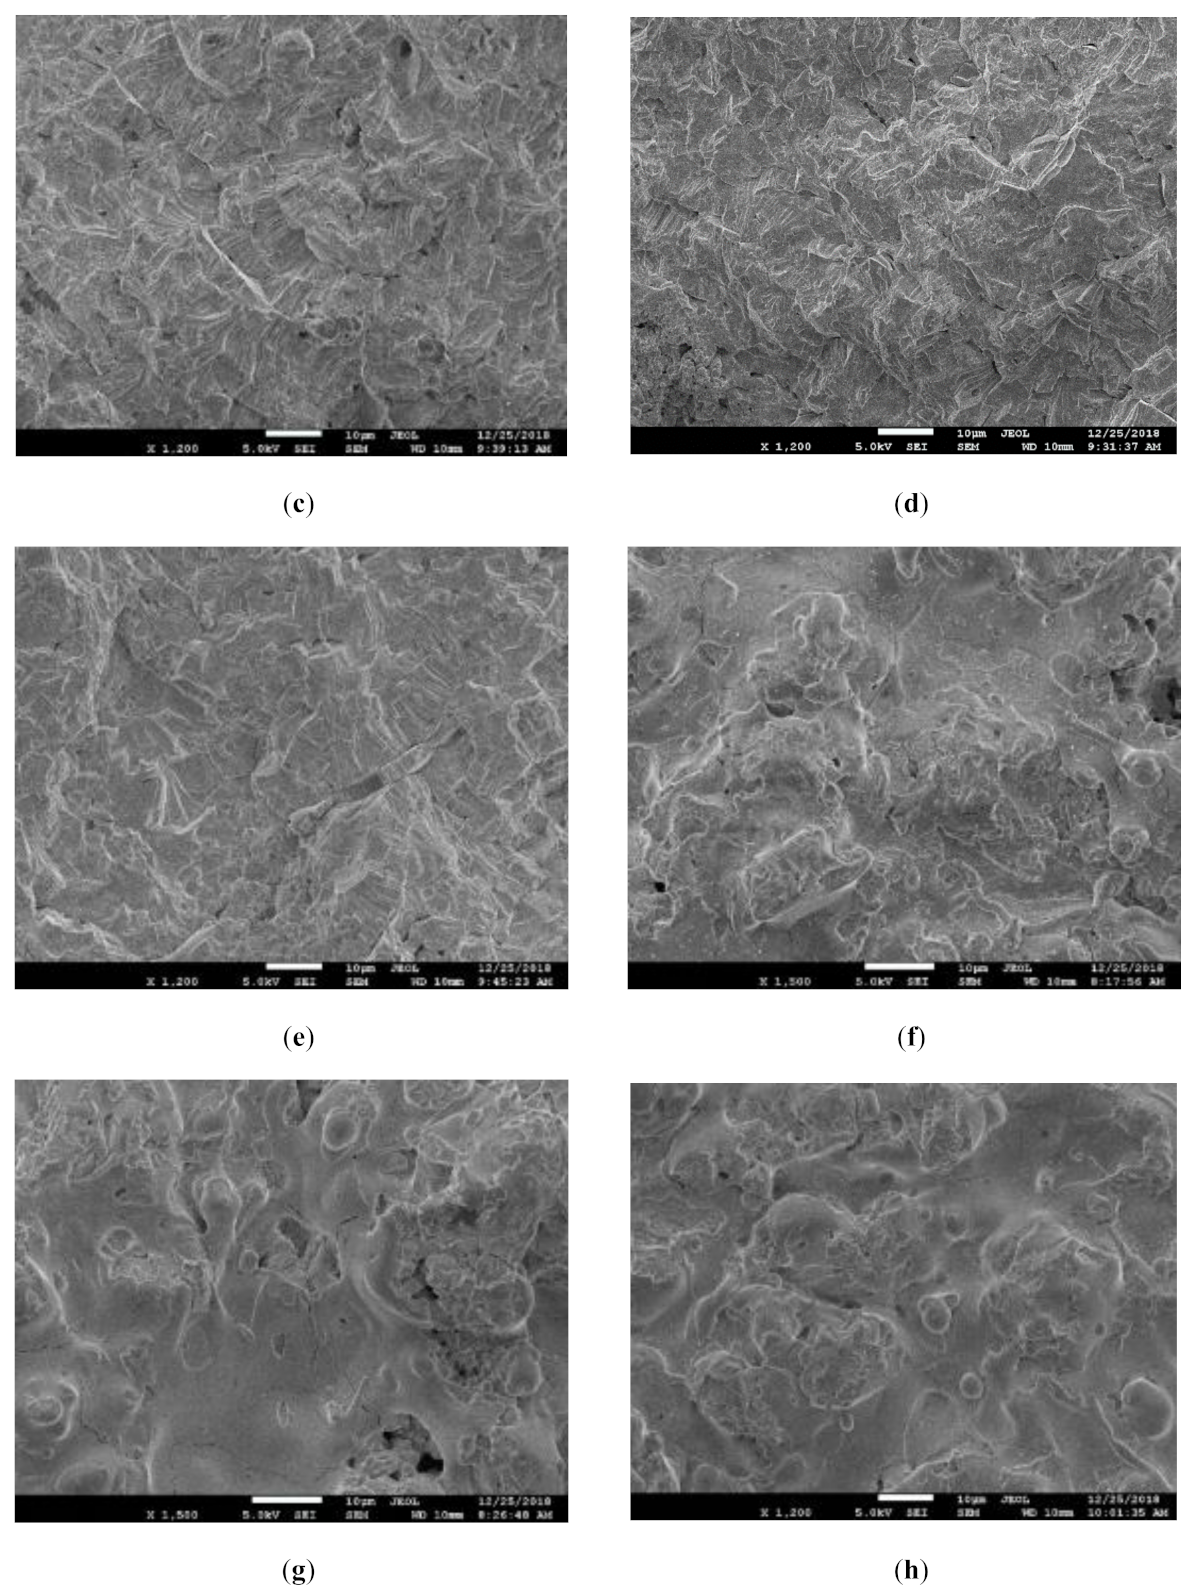
4.1. Microstructure

Figure 7 shows SEM diagrams of TBCs under high temperature exposure. Figure 7 (a–e) are surface morphologies for 0, 2, 5, 10 and 20 h, respectively; The cross-sectional morphology shows a compact accumulation of multiple lamella during deposition and there are many microcracks and pores on the cross section. Figure 7f,j are cross sectional morphologies for 0, 2, 5, 10 and 20 h, respectively. It shows that the surface is corrugate filled, with the round deposited ceramic particles and molten particles bonding together during the coating build up. In addition, irregular cracks winded along the boundary of the particles. It is clearly illuminated that the cracks on the cross section and the surface shrink or partially close with the increasing thermal exposure time.
Porosity distribution on the cross section was analyzed with an image processing software (Image J). Ten enlarged regions on the same image were analyzed with the same threshold and were averaged as the porosity value of the specimen. Figure 8a shows the porosity distribution on the cross section of the as received TBC. The pores are circled by irregular solid lines. Figure 8b shows the curve between porosity and thermal exposure time. The porosity of as received coating is about 8.6%. The porosity decreases quickly with the thermal exposure time in less than 5 h and slowly decreases when the thermal exposure is more than 5 h. The porosity with thermal exposure time for 20 h is about 5.3%. The results can be explained with the microstructural changes including grain growths and closure of cracks.

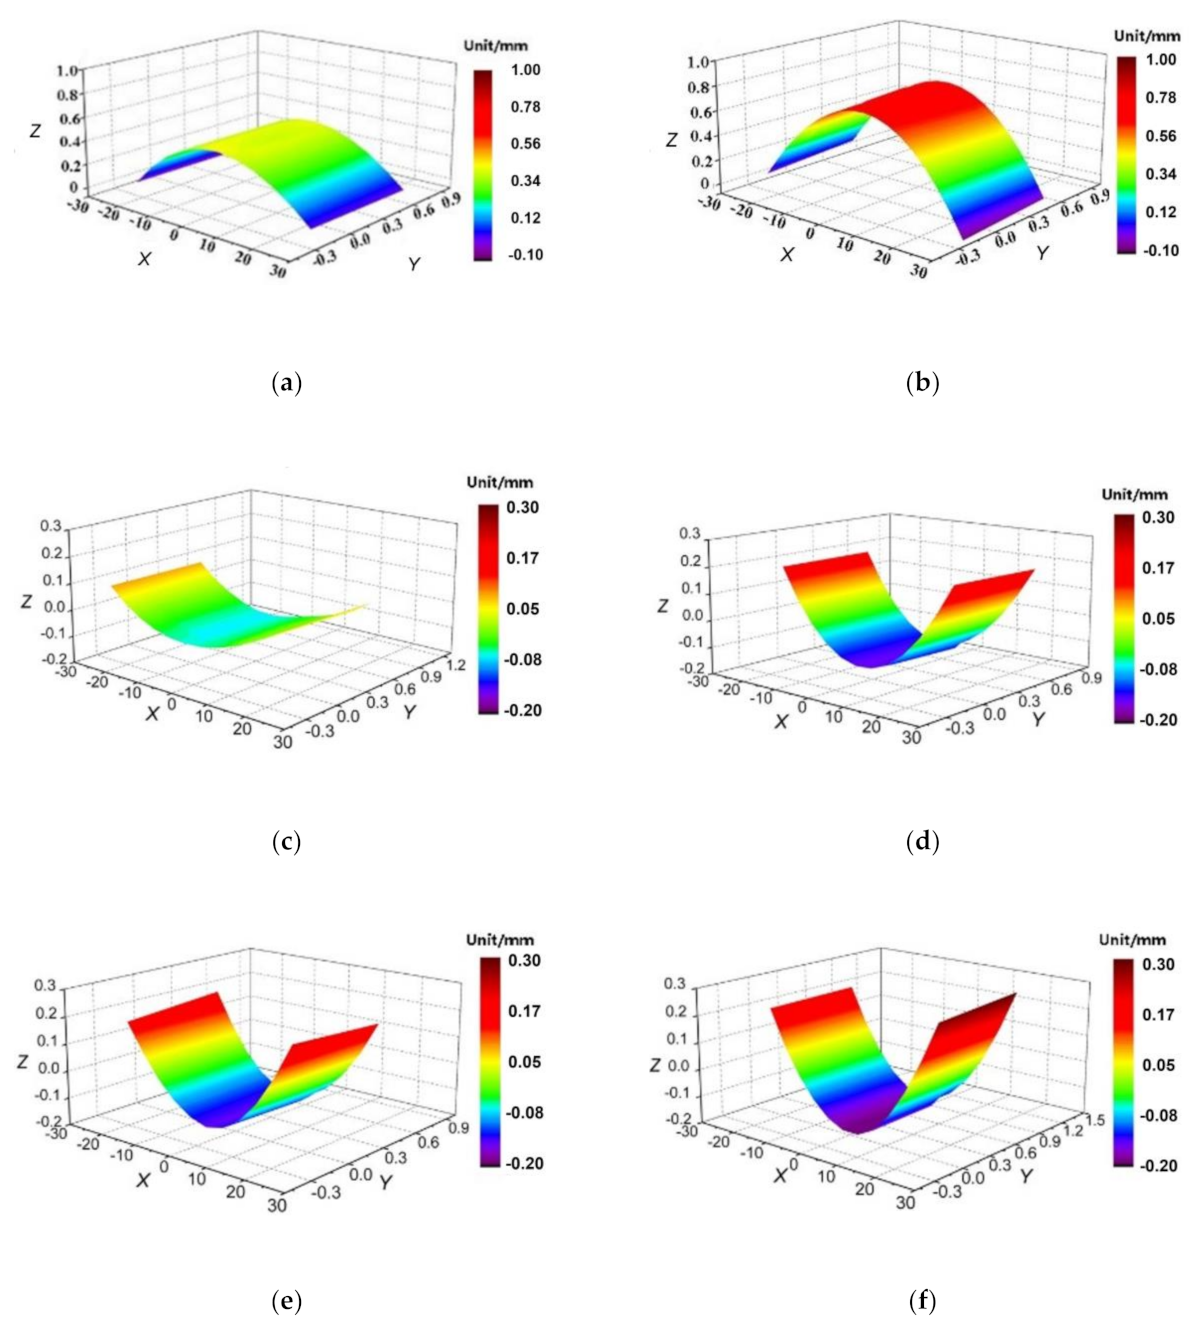
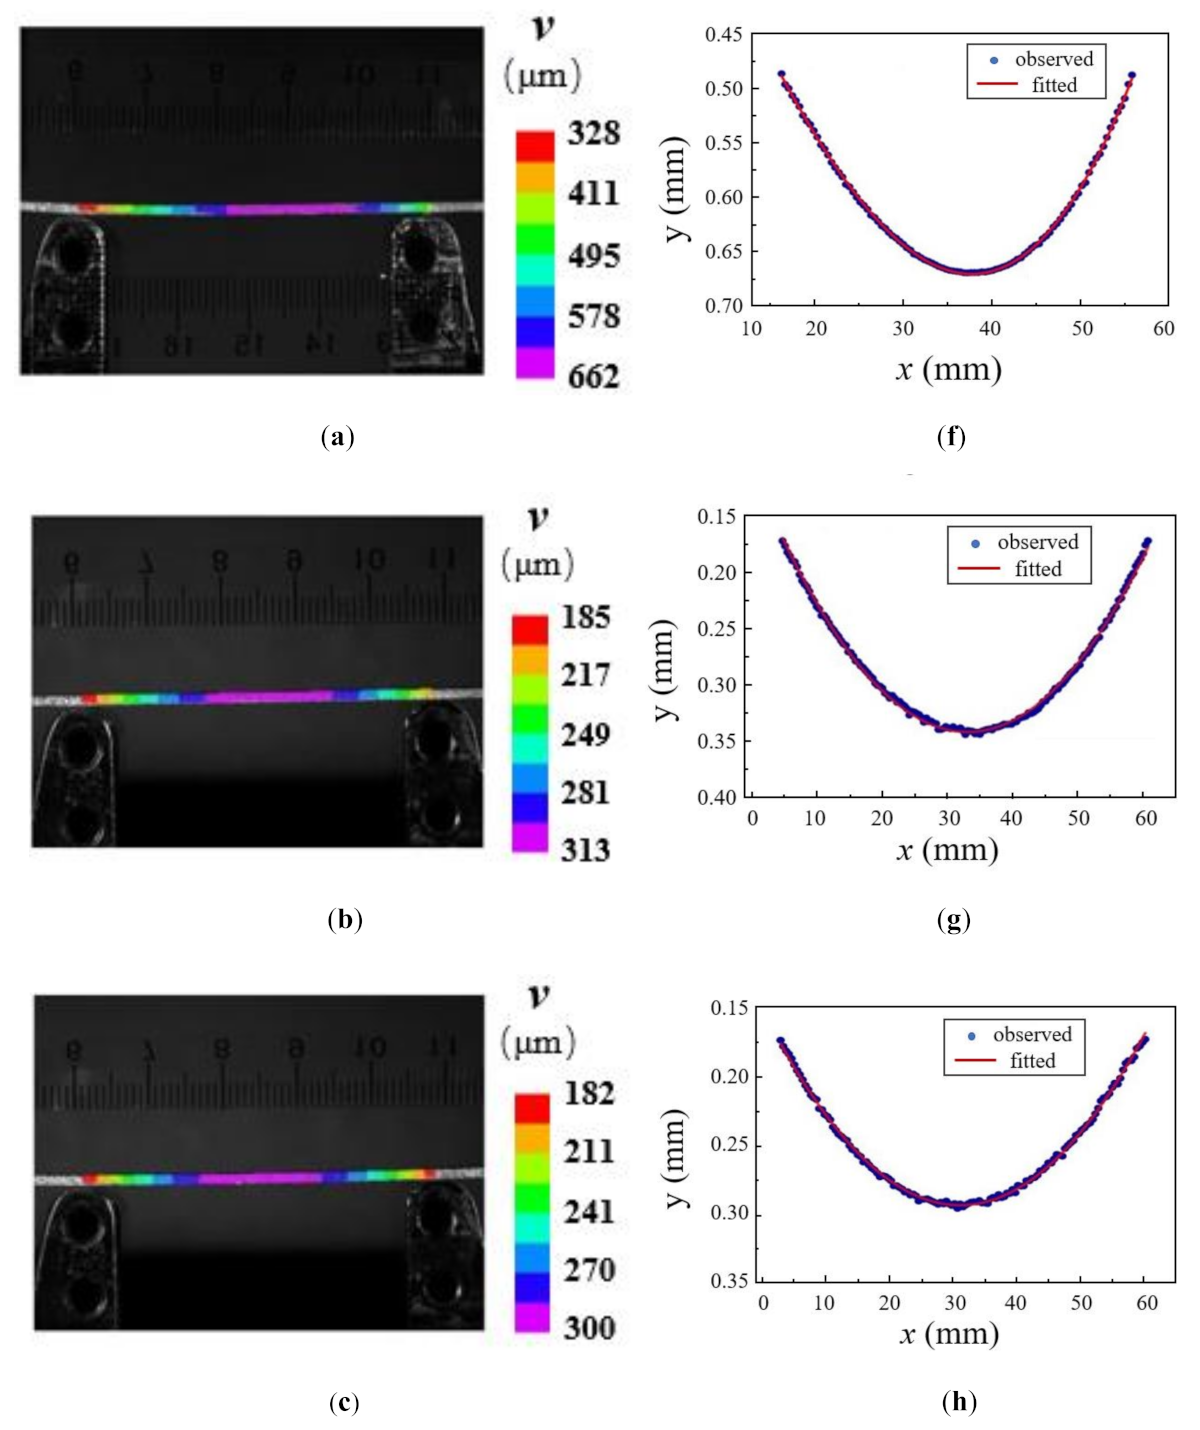
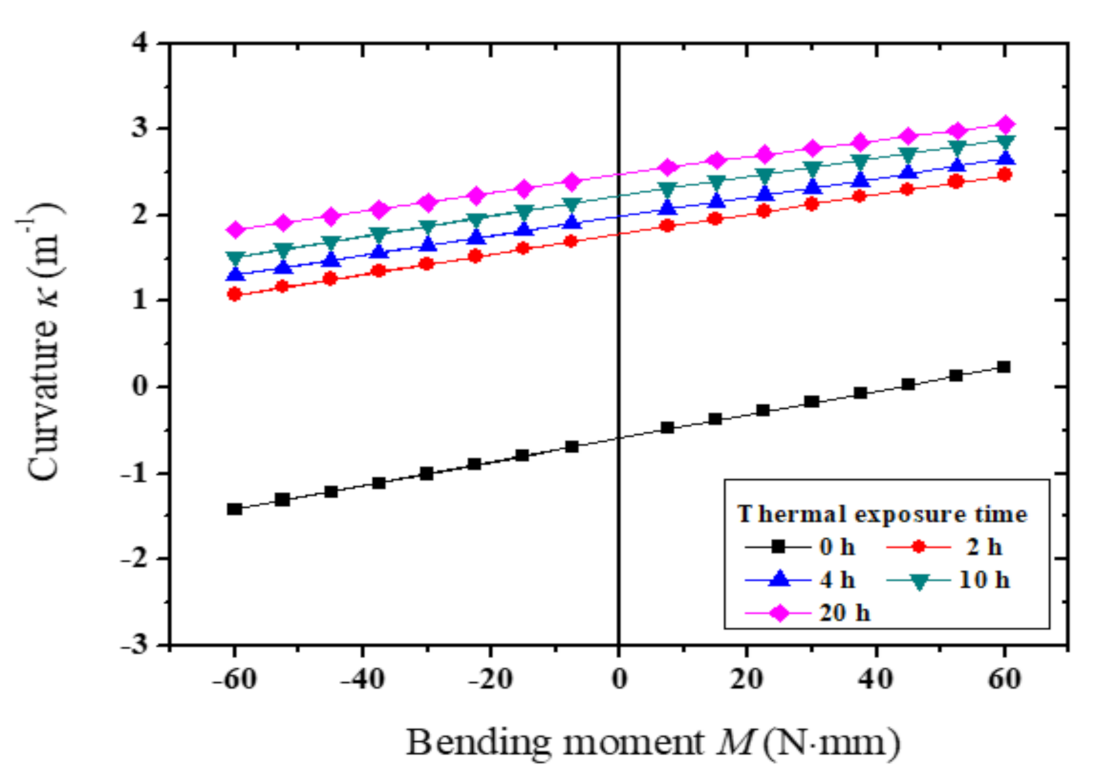
4.2. Curvature Measurement with DIC

TBC specimens including the as received and with high temperature exposure of different times was measured by the 3D DIC method to obtain curvatures, denoted by κ 2 . The morphology contours are shown in Figure 9. Moreover, curvature of the specimen before the topcoat deposition, denoted by κ 1 , was measured to exclude the influence of the residual stress caused by the bond-coat deposition. The initial curvatures of the TBC specimens can be obtained by κ 0 = κ 2     κ 1 . Table 2 shows the measurement results.
The TBC specimens were then tested under the four-point bending system. The loading P was in a range of 0–9 N to ensure the composite beam bending in elastic deformation. The moment M was calculated by M   =   P L l / 4 . Vertical deformation of the topcoat-upward specimens under four-point bending with P = 5 N was measured by 3D DIC. In the DIC calculation, the speckle pattern of 0 N loading was set as the reference image. Figure 10a,e show the vertical deformation fields of specimens with high temperature exposure for 0, 2, 5, 10 and 20 h, respectively, and (f)–(j) are their corresponding fitting curves based on the least square method. Thus, the curvature changes of specimens under P = 5 N can be obtained. Similarly, the curvature change of the topcoat-upward specimens under various loading can be obtained.
According to Equation (4), the curvature of the topcoat-upward TBC specimens under various loading can be calculated. Similarly, the curvature of the topcoat-downward TBC specimens under various loading can also be obtained. Figure 11 shows the relation curves between moment and curvature. The fitting curves demonstrate linear relations between moment and curvature, which is in accordance with Equation (8). Therefore, the slope and intercept of each linear fitting curve can be determined, which are the values for parameters a and b in Equation (10).

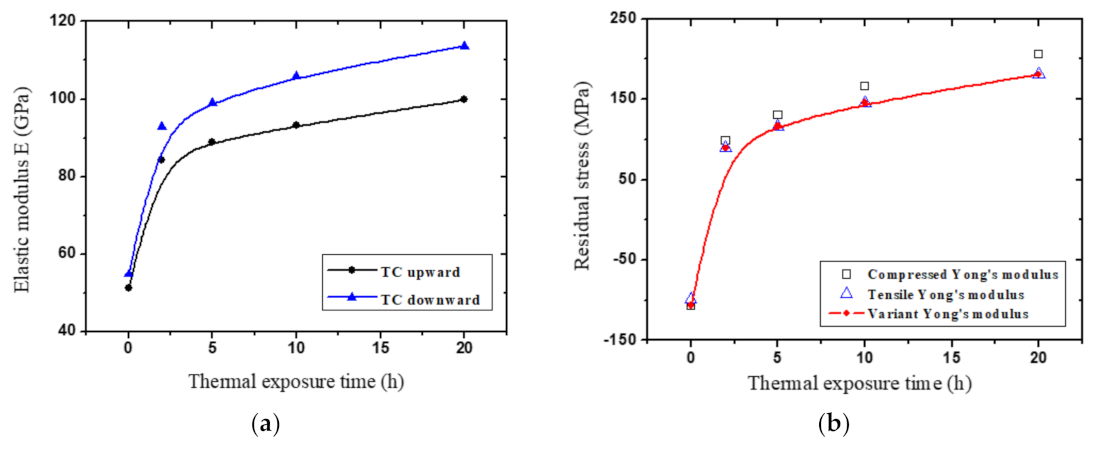
4.3. Elastic Modulus and Residual Stress

The variation of curvature changes with the bending moment during specimen loading is shown in Figure 11. The bending moment is positive when the tested specimen is topcoat-upward loaded, or negative when the tested specimen is topcoat-downward loaded. Figure 11 shows the linear change in curvature with bending moment, which indicates that the linear elastic state of the tested materials is ensured during the loading process. In addition, after removing the load, no permanent deformation was observed. Therefore, plastic deformation of the substrate can be excluded.
The elastic modulus and residual stress of specimens can be calculated according to Equations (11) and (12), as shown in Figure 12. Figure 1a shows the elastic modulus of the topcoat-upward and downward specimens varying with the high temperature exposure time. The elastic modulus of the as received coating is 54 GPa in compression and 51 GPa in tension. The value rapidly increases as the thermal exposure time increases at the beginning of the 2-h period and reaches 93 GPa in compression and 84 GPa in tension. Then, the value of the elastic modulus slowly increases after 2 h and reaches 116 GPa in compression and 96 GPa in tension, when the thermal exposure time is 20 h. In general, the value of the elastic modulus has a rapidly increasing stage at the beginning and a slow increasing stage afterward.
In general, the value of the elastic modulus of the thermally sprayed coating is not constant and consists of two stages which are rapidly increasing and slowly increasing stages. This trend agrees with the results reported in the references [4,27,28]. In the first stage, the rapid increase in the elastic modulus of the plasma-sprayed TBC is attributed to the effect of sintering, which is in accordance with the porosity variation with the high temperature exposure time. The porosity decreases quickly with the thermal exposure time, which means that the coating material converts from loosely connected to more closely connected microstructure, and as a result the value of the elastic modulus rapidly increases. In the second stage, a progressive increase in the elastic modulus of topcoat is corresponded to a gradual decrease in porosity with the thermal exposure time, which has been demonstrated in references [27,29]. Nevertheless, previous researchers have reported a slight decrease in the elastic modulus in the second stage, which is mainly due to the formation of new microdefects on the detached top coats in the high temperature exposure of over 1400 K [13,28,30].
Furthermore, the results also indicate that elastic modulus of the topcoat-upward specimen is always greater than that of the topcoat-downward specimen, or elastic modulus in compression is always greater than that in tension, and the mutual difference is significant with the increasing high temperature exposure time. This phenomenon has been previously reported [17] and is due to the mechanical properties of the brittle coating material with micro cracks and pores on the inside. Due to the difference in elastic modulus between tension and compression, a neutral axis shift should be considered in calculating stresses in uniaxial and biaxial flexure.
Figure 12b shows residual stress of the TBC specimens varying with the high temperature exposure time. As the solid dots indicated, the residual stress of the as received coating is −106.6 MPa, which indicates that the coating is in a compressed stress state. The residual stress quickly changes from the compressed stress state to a tensile stress state after a thermal exposure time of 2 h. The magnitude of the tensile stress is 97.2 MPa. Then, the value of the residual stress gradually increases and reaches 209 MPa, when the thermal exposure time is 20 h.
The residual stress during the spray process originates from quenching stress due to the rapid solidification of molten coating droplets and the thermal stress due to CTE mismatch of the coating and the substrate [8,31]. The final stress state can be in the form of tensile, compressive or neutral stress, depending on a number of factors such as varying thickness and CTE of coating and substrate, and temperature and velocity of spray particles in thermal spraying [7,32]. Yang et al. [33] used Raman spectroscopy and curvature methods to measure the residual stress in the YSZ layer and the obtained results are consistent with this paper. The as deposited residual stress measured by the curvature method is −130 MPa, which gradually turns into a tensile stress of about 130 MPa after 30 h at 1150 °C. Sintering in the YSZ layer causes the residual stress to gradually change from tensile to compression, and the phase change in the YSZ layer and the bonding layer also have an effect on the residual stress.
It should be pointed out that the residual stress of the as received coating is calculated according to the magnitude of the compressive elastic modulus of the top coat and the residual stress of the after thermal exposure coating is calculated according to the magnitude of the tensile elastic modulus of the topcoat. Otherwise, as the hollow dots indicate, errors occur in the calculation of residual stress. As for the as received coating, the false residual stress will reduce to 8% of the true value. As for the after thermal exposure coating, the residual stress will be overestimated by about 15% and the relative error is likely increasing with the increasing high temperature exposure time.

5. Conclusions

This study focused on the experimental determination of the elastic modulus and residual stress of thermally sprayed TBCs. Based on the composite beam bending theory, a formula to determine the elastic modulus and residual stress of TBCs was established. A 3D DIC technology was adopted to obtain the 3D shape of the curved sample before and after the ceramic layer was sprayed, and the full field displacement of the TBC sample under four-point bending load. The elastic modulus of coating under tension and compression with different thermal exposure time were measured. The residual stress of the TBC sample treated with varying high temperature exposure time was obtained. The main conclusions are summarized as follows.
  • The formula to determine the elastic modulus and residual stress of TBCs was deduced based on the composite beam bending theory. According to the formula, the elastic modulus and residual stress of TBCs can be experimentally determined.
  • The experimental method to simultaneously determine the elastic modulus and residual stress of TBCs using a 3D digital image correlation technique combined with bending test is effective and reliable.
  • The results show that the elastic modulus of the ceramic layer measured under com-pression is greater than that under tension, and the elastic modulus of the ceramic layer increases first and then tends to be stable as the heat treatment time increases. In addition, the residual stress of the TBCs ceramic layer quickly changes from compressive stress to tensile stress with heat treatment, and the tensile stress increases with the increase in thermal exposure time.

Author Contributions

Conceptualization, D.Y. and J.L.; Data curation, Q.Z., D.Y. and Y.Z.; Formal analysis, Q.Z. and L.Z.; Funding acquisition, J.Z.; Investigation, Q.Z. and Y.Z.; Project administration, J.Z.; Resources, W.X.; Supervision, J.Z.; Validation, Y.Z., L.Z.; Writing—original draft, Q.Z.; Writing—review & editing, J.Z. All authors have read and agreed to the published version of the manuscript.

Funding

This research were funded by the National Natural Science Foundation of China, Grant Nos.11672345 and 11972014, and the National Key Laboratory of Science and Technology on Advanced Composites in Special Environments, grant number JCKYS2020603C014.

Institutional Review Board Statement

Not applicable.

Informed Consent Statement

Not applicable.

Data Availability Statement

Data is contained within the article.

Acknowledgments

The authors are grateful for the financial support provided by the National Natural Science Foundation of China (Grant Nos.11672345 and 11972014) and the National Key Laboratory of Science and Technology on Advanced Composites in Special Environments (JCKYS2020603C014).

Conflicts of Interest

The authors declare no conflict of interest.

References

  1. Cai, J.; Yang, S.Z.; Ji, L.; Guan, Q.F.; Wang, Z.P.; Han, Z.Y. Surface microstructure and high temperature oxidation resistance of thermal sprayed CoCrAIY coating irradiated by high current pulsed electron beam. Surf. Coat. Technol. 2014, 251, 217–225. [Google Scholar] [CrossRef]
  2. Cai, J.; Guan, Q.; Yang, S.; Yang, S.; Wang, Z.; Han, Z. Microstructural characterization of modified YSZ thermal barrier coatings by high-current pulsed electron beam. Surf. Coat. Technol. 2014, 254, 187–194. [Google Scholar] [CrossRef]
  3. Li, G.-R.; Wang, L.-S. Durable TBCs with self-enhanced thermal insulation based on co-design on macro- and microstructure. Appl. Surf. Sci. 2019, 483, 472–480. [Google Scholar] [CrossRef]
  4. Ma, K.; Xie, H.; Zhu, J.; Wang, H. Physical and mechanical properties of plasma-sprayed thermal barrier coatings at room and high temperatures. Surf. Coat. Technol. 2014, 253, 58–67. [Google Scholar] [CrossRef]
  5. Ma, K.; Zhu, J.; Xie, H.; Wang, H. Effect of porous microstructure on the elastic modulus of plasma-sprayed thermal barrier coatings: Experiment and numerical analysis. Surf. Coat. Technol. 2013, 235, 589–595. [Google Scholar] [CrossRef]
  6. Cai, J.; Gao, C.Z.; Lv, P.; Zhang, C.; Guan, Q.; Lu, J.; Xu, X. Hot corrosion behaviour of thermally sprayed CoCrAlY coating irradiated by high-current pulsed electron beam. J. Alloys Compd. 2019, 784, 1221–1233. [Google Scholar] [CrossRef]
  7. Wu, L.; Zhu, J.; Xie, H. Numerical and Experimental Investigation of Residual Stress in Thermal Barrier Coatings during APS Process. J. Therm. Spray Technol. 2014, 23, 653–665. [Google Scholar] [CrossRef]
  8. Zhu, J.; Chen, W.; Xie, H. Simulation of residual stresses and their effects on thermal barrier coating systems using finite element method. Sci. China-Phys. Mech. Astron. 2015, 58, 1–10. [Google Scholar] [CrossRef]
  9. Zhu, W.; Zhang, Z.B.; Yang, L.; Zhou, Y.C.; Wei, Y.G. Spallation of thermal barrier coatings with real thermally grown oxide morphology under thermal stress. Mater. Des. 2018, 146, 180–193. [Google Scholar] [CrossRef]
  10. Li, C.; Zhang, X.; Chen, Y.; Carr, J.; Jacques, S.; Behnsen, J.; Di Michiel, M.; Xiao, P.; Cernik, R. Understanding the residual stress distribution through the thickness of atmosphere plasma sprayed (APS) thermal barrier coatings (TBCs) by high energy synchrotron XRD; digital image correlation (DIC) and image based modelling. Acta Mater. 2017, 132, 1–12. [Google Scholar] [CrossRef]
  11. Raj, S.V.; Pawlik, R.; Loewenthal, W. Young’s moduli of cold and vacuum plasma sprayed metallic coatings. Mater. Sci. Eng. 2009, 513, 59–63. [Google Scholar] [CrossRef] [Green Version]
  12. Li, C.C.; Wang, T.; Liu, X.J.; Zheng, Z.H.; Li, Q. Evolution of mechanical properties of thermal barrier coatings subjected to thermal exposure by instrumented indentation testing. Ceram. Int. 2016, 42, 10242–10250. [Google Scholar] [CrossRef]
  13. Zhu, J.; Ma, K. Microstructural and mechanical properties of thermal barrier coating at 1400 °C treatment. Theor. Appl. Mech. Lett. 2014, 4, 53–57. [Google Scholar] [CrossRef] [Green Version]
  14. Zhu, J.; Xie, H.; Hu, Z.; Chen, P.; Zhang, Q. Cross-Sectional Residual Stresses in Thermal Spray Coatings Measured by Moire Interferometry and Nanoindentation Technique. J. Therm. Spray Technol. 2012, 21, 810–817. [Google Scholar] [CrossRef]
  15. Mao, W.; Wang, Y.; Huang, H.; Zeng, L.; Wang, Y.; Lv, L.; Feng, B.; Zou, C.; Dai, C.; Tang, Q.; et al. In situ characterizations of mechanical behaviors of freestanding (Gd0.9Yb0.1) (2) Zr2O7 coatings by bending tests under different temperatures based on digital image correlation. J. Eur. Ceram. Soc. 2020, 40, 491–502. [Google Scholar] [CrossRef]
  16. Zhu, Q.; He, W.; Zhu, J.; Zhou, Y.; Chen, L. Investigation on interfacial fracture toughness of plasma-sprayed TBCs using a three-point bending method. Surf. Coat. Technol. 2018, 353, 75–83. [Google Scholar] [CrossRef]
  17. Choi, S.R.; Zhu, D.M.; Miller, R.A. Mechanical properties/database of plasma-sprayed ZrO2-8wt% Y2O3 thermal barrier coatings. Int. J. Appl. Ceram. Technolo. 2004, 1, 330–342. [Google Scholar] [CrossRef]
  18. Wang, X.; Tint, S.; Chiu, M.; Atkinson, A. Stiffness of free-standing thermal barrier coating top coats measured by bending tests. Acta Mater. 2012, 60, 3247–3258. [Google Scholar] [CrossRef]
  19. Li, C.; Jacques, S.D.M.; Chen, Y.; Daisenberger, D.; Xiao, P.; Markocsan, N.; Nylen, P.; Cernik, R.J. A synchrotron X-ray diffraction deconvolution method for the measurement of residual stress in thermal barrier coatings as a function of depth. J. Appl. Crystallogr. 2016, 49, 1904–1911. [Google Scholar] [CrossRef]
  20. Zhang, X.; Li, C.; Withers, P.J.; Markocsan, N.; Xiao, P. Determination of local residual stress in an air plasma spray thermal barrier coating (APS-TBC) by microscale ring coring using a picosecond laser. Scr. Mater. 2019, 167, 126–130. [Google Scholar] [CrossRef]
  21. Zhu, J.G.; Xie, H.M.; Li, Y.J.; Hu, Z.X.; Luo, Q.; Gu, C.Z. Interfacial Residual Stress Analysis of Thermal Spray Coatings by Miniature Ring-Core Cutting Combined with DIC Method. Exp. Mech. 2014, 54, 127–136. [Google Scholar] [CrossRef]
  22. Forschelen, P.J.J.; Suiker, A.S.J.; Van Der Sluis, O. Effect of residual stress on the delamination response of film-substrate systems under bending. Int. J. Solids Struct. 2016, 97–98, 284–299. [Google Scholar] [CrossRef]
  23. Qian, W.; Li, J.; Zhu, J.; Hao, W.; Chen, L. Distortion correction of a microscopy lens system for deformation measurements based on speckle pattern and grating. Opt. Laser Eng. 2020, 124, 105804. [Google Scholar] [CrossRef]
  24. Hao, W.; Tang, C.; Yuan, Y.; Yao, X.; Ma, Y. Experimental study on the fiber pull-out of composites using digital gradient sensing technique. Polym. Test. 2015, 41, 239–244. [Google Scholar] [CrossRef]
  25. Liu, H.; Xiong, K.; Wang, M.; Bian, K.; Zhu, K. Experimental study on strain distribution of ionic polymer-metal composite actuator using digital image correlation. Smart Mater. Struct. 2017, 26, 025004. [Google Scholar] [CrossRef]
  26. Zhu, J.; Yan, G.; He, G.; Chen, L. Fabrication and optimization of micro-scale speckle patterns for digital image correlation. Meas. Sci. Technol. 2016, 27, 015203. [Google Scholar] [CrossRef]
  27. Guo, S.; Kagawa, Y. Young’s moduli of zirconia top-coat and thermally grown oxide in a plasma-sprayed thermal barrier coating system. Scr. Mater. 2004, 50, 1401–1406. [Google Scholar] [CrossRef]
  28. Wei, Q.; Zhu, J.; Chen, W. Anisotropic Mechanical Properties of Plasma-Sprayed Thermal Barrier Coatings at High Temperature Determined by Ultrasonic Method. J. Therm. Spray Technol. 2016, 25, 605–612. [Google Scholar] [CrossRef]
  29. Thompson, J.A.; Clyne, T.W. The effect of heat treatment on the stiffness of zirconia top coats in plasma-sprayed TBCs. Acta Mater. 2001, 49, 1565–1575. [Google Scholar] [CrossRef]
  30. Chen, Q.; Mao, W.G.; Zhou, Y.C.; Lu, C. Effect of Young’s modulus evolution on residual stress measurement of thermal barrier coatings by X-ray diffraction. Appl. Surf. Sci. 2010, 256, 7311–7315. [Google Scholar] [CrossRef] [Green Version]
  31. Zhu, J.; Xie, H.; Hu, Z.; Chen, P.; Zhang, Q. Residual stress in thermal spray coatings measured by curvature based on 3D digital image correlation technique. Surf. Coat. Technol. 2011, 206, 1396–1402. [Google Scholar] [CrossRef]
  32. Totemeier, T.C.; Wright, J.K. Residual stress determination in thermally sprayed coatings—A comparison of curvature models and X-ray techniques. Surf. Coat. Technol. 2006, 200, 3955–3962. [Google Scholar] [CrossRef]
  33. Yang, L.; Yang, F.; Long, Y.; Zhao, Y.; Xiong, X.; Zhao, X.; Xiao, P. Evolution of residual stress in air plasma sprayed yttria stabilised zirconia thermal barrier coatings after isothermal treatment. Surf. Coat. Technol. 2014, 251, 98–105. [Google Scholar] [CrossRef]
Figure 1. Geometry, strain, and stress profiles of a two-layer beam subject to bending moment.
Coatings 11 00245 g001
Figure 2. Image of TBC on a comb-shaped substrate.
Coatings 11 00245 g002
Figure 3. Temperature profile during thermal loading.
Coatings 11 00245 g003
Figure 4. Specimens after thermal loading.
Coatings 11 00245 g004
Figure 5. Schematic diagram of a 3D DIC system for morphology measurement of TBC specimens.
Coatings 11 00245 g005
Figure 6. Schematic diagram of a 3D DIC system for cross sectional profile measurement of four-point bending TBCs.
Coatings 11 00245 g006
Figure 7. Scanning electron microscope diagrams of thermal barrier coatings under high temperature exposure: (ae) are surface morphologies for 0, 2, 5, 10 and 20 h, respectively; (fj) are cross sectional morphologies for 0, 2, 5, 10 and 20 h, respectively.
Coatings 11 00245 g007aCoatings 11 00245 g007bCoatings 11 00245 g007c
Figure 8. (a) Porosity distribution based on image analysis; and (b) curve between porosity and thermal exposure time.
Coatings 11 00245 g008
Figure 9. Morphology contours of TBC specimens: (a) before topcoat deposition; (b) as received; (c) high temperature exposure for 2 h; (d) high temperature exposure for 5 h; (e) high temperature exposure for 10 h; (f) high temperature exposure for 20 h.
Coatings 11 00245 g009
Figure 10. Vertical deformation of the topcoat-upward specimens under four-point bending measured by 3D DIC. The loading P is equal to 5 N. (ae) are vertical deformation fields of specimens with high temperature exposure for 0, 2, 5, 10 and 20 h, respectively, and (fj) are their corresponding fitting curves.
Coatings 11 00245 g010aCoatings 11 00245 g010b
Figure 11. Relation curves between moment and curvature.
Coatings 11 00245 g011
Figure 12. Relation curves of (a) elastic modulus; and (b) residual stress with high temperature exposure time.
Coatings 11 00245 g012
Table 1. Spraying parameters for top and bond coatings.
ParameterBond CoatTop Coat
Spraying processHVOFAPS
Kerosene flow rate (GPH)5.9\
Oxygen flow rate (SCFH) 2000\
Primary gas flow rate (SCFH) \70 (Ar)
Secondary gas flow rate (SCFH) \2.5 (H2)
Plasma arc power (kW)\30
Powder feed rate (r·min−1)4550
Spray distance (mm)38060
Gun traverse speed (mm·s−1)500500
Table 2. Curvatures measured by DIC.
Curvature before Top Coat Deposition
κ 1 ( m 1 )
−0.98
High Temperature Exposure (h)
0251020
Curvature after thermal exposure
κ 2 ( m 1 )
-1.560.811.021.251.50
Initial   curvature   κ 0 ( m 1 )-0.581.792.002.232.48
Publisher’s Note: MDPI stays neutral with regard to jurisdictional claims in published maps and institutional affiliations.

