A Method for Accelerated Natural Weathering of Wood Subsurface and Its Multilevel Characterization


Abstract
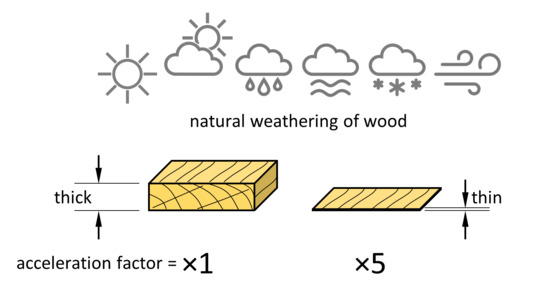
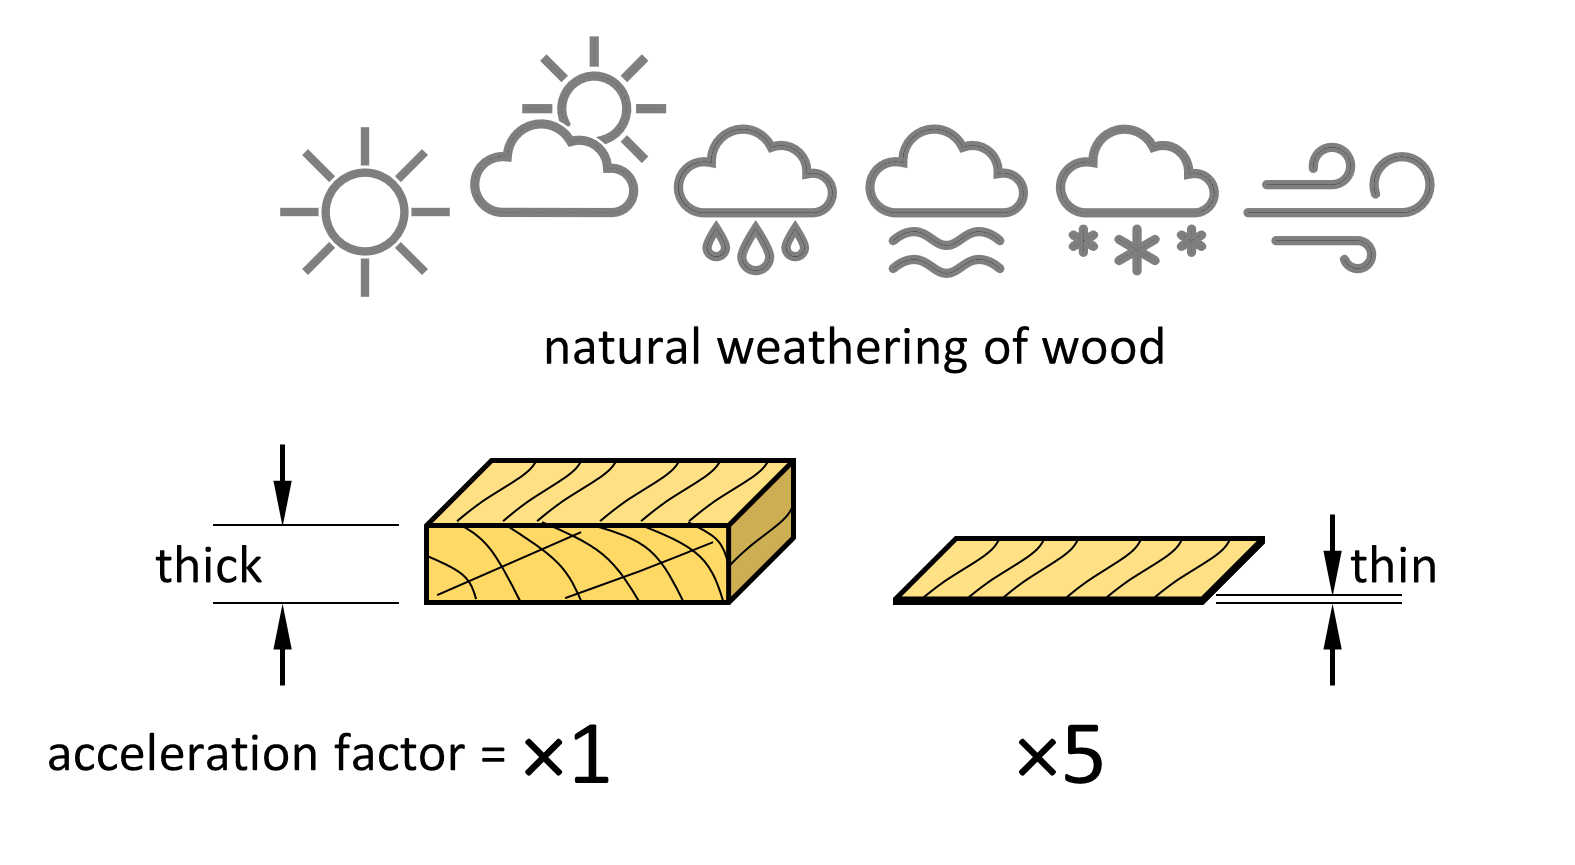
1. Introduction
2. Materials and Methods
2.1. Experimental Samples
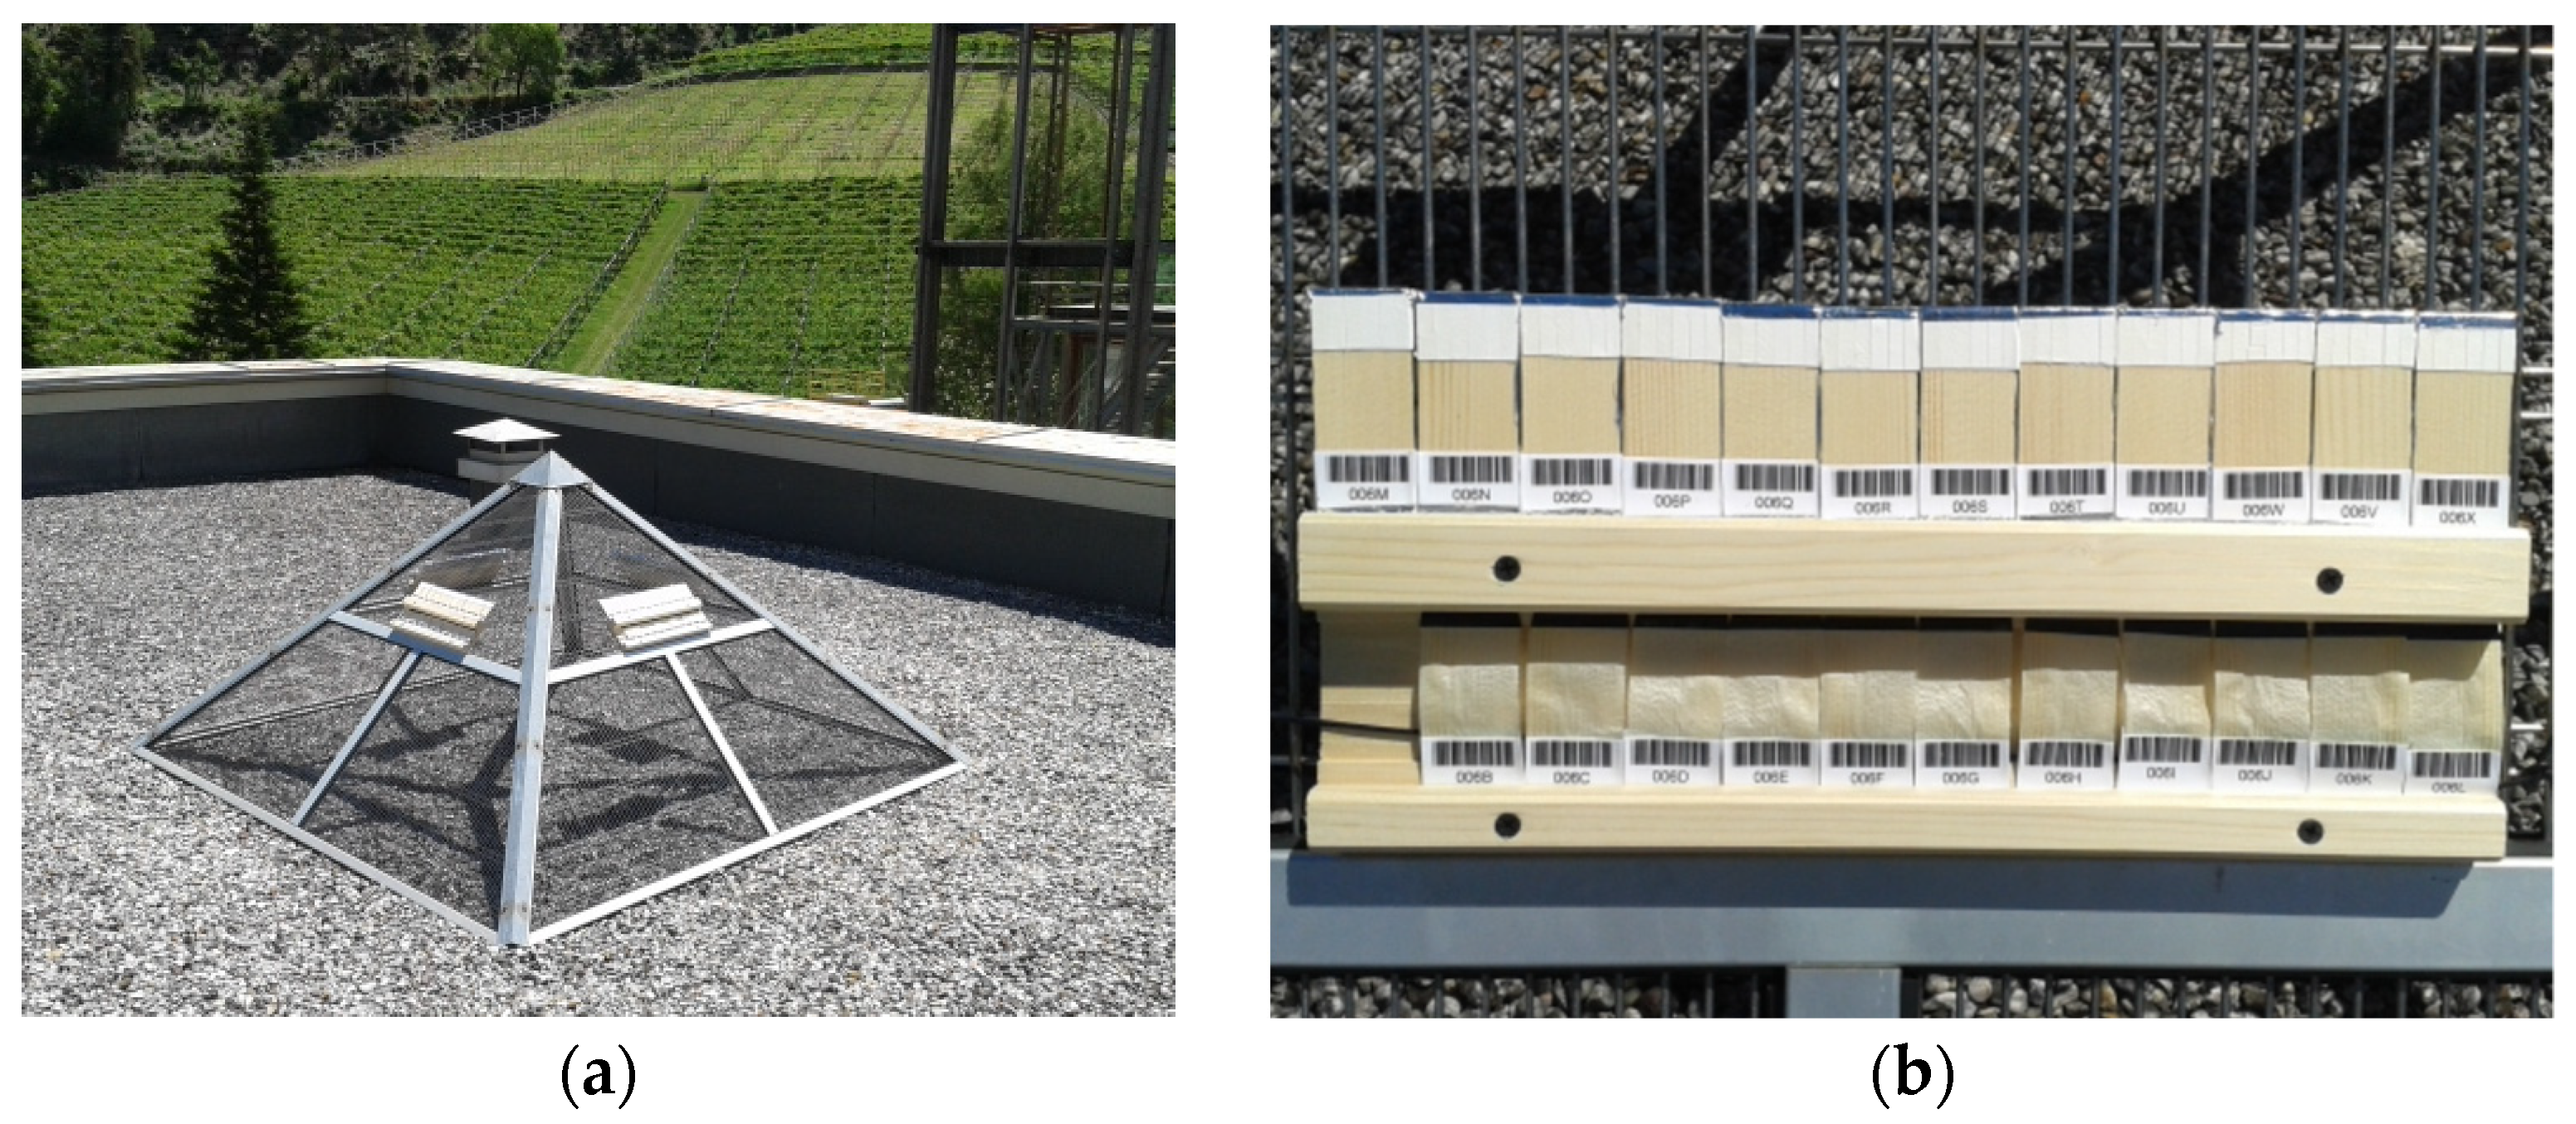
2.2. Weathering Test
2.3. Macroscopic Observation: Colour Measurement
2.4. Microscopic Observation: Scanning Electron Microscopy
2.5. Molecular Observation: Fourier Transform–Infra Red Measurement
3. Results
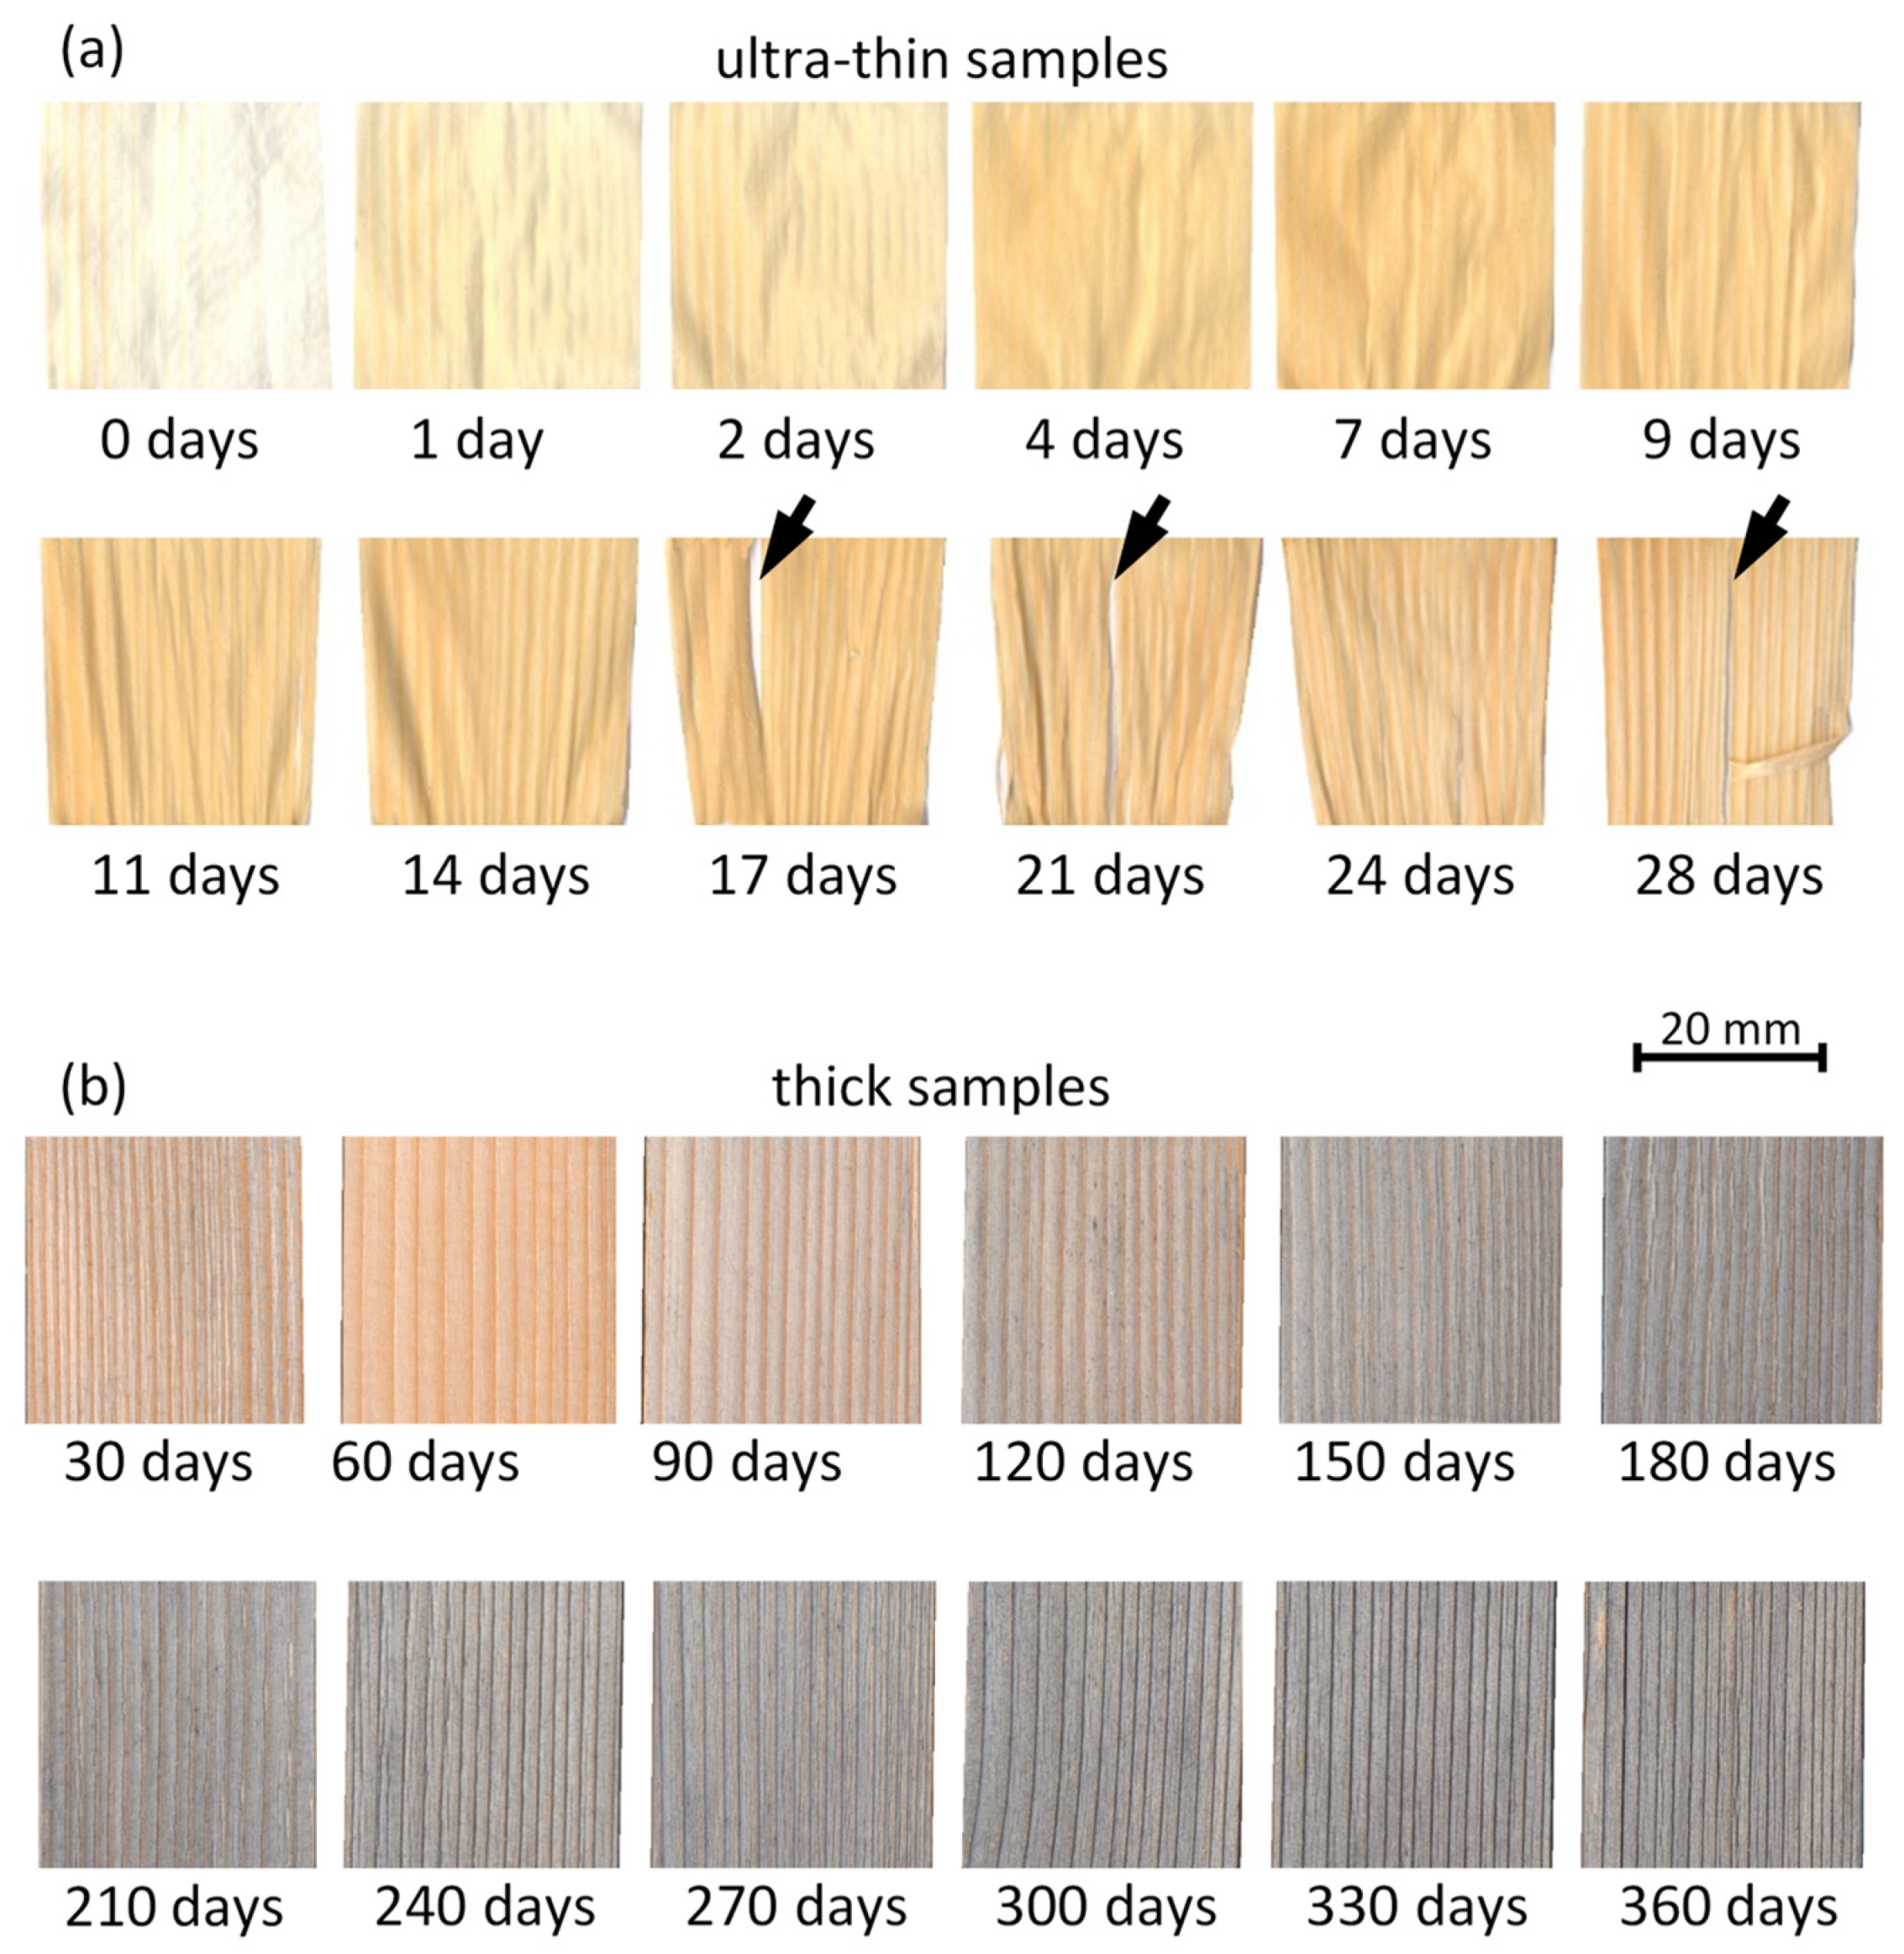
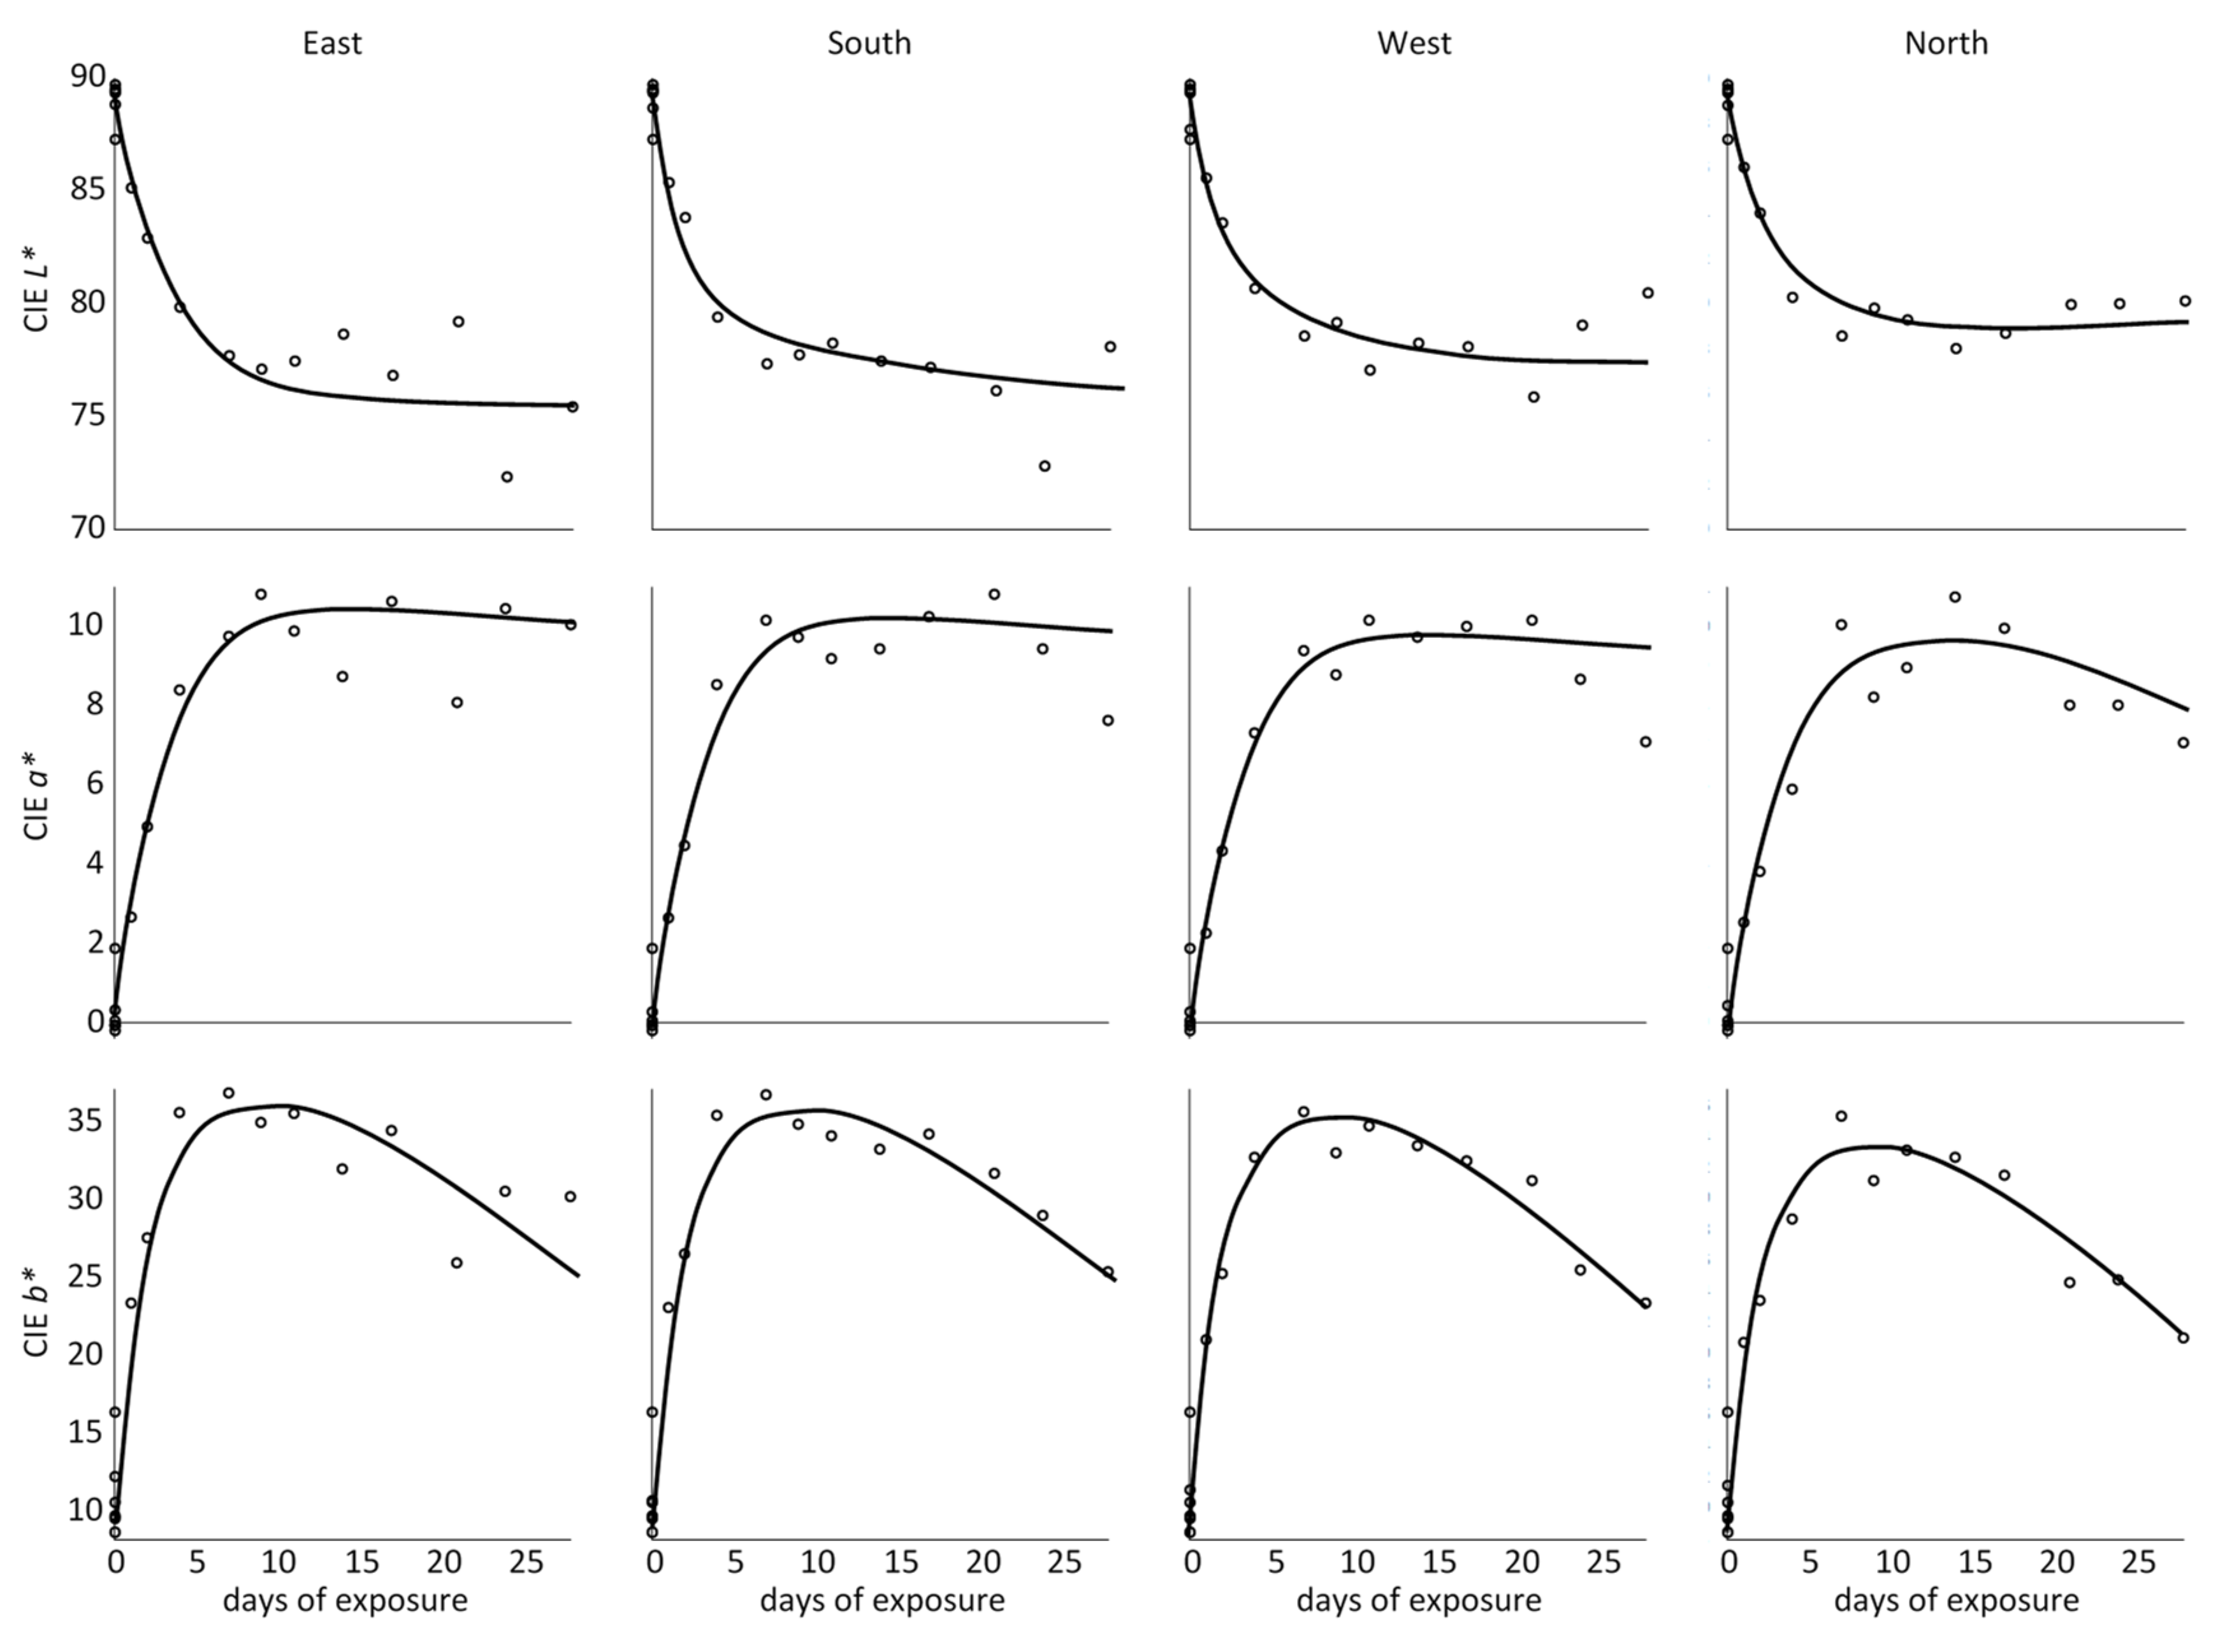
3.1. Macroscopic Level
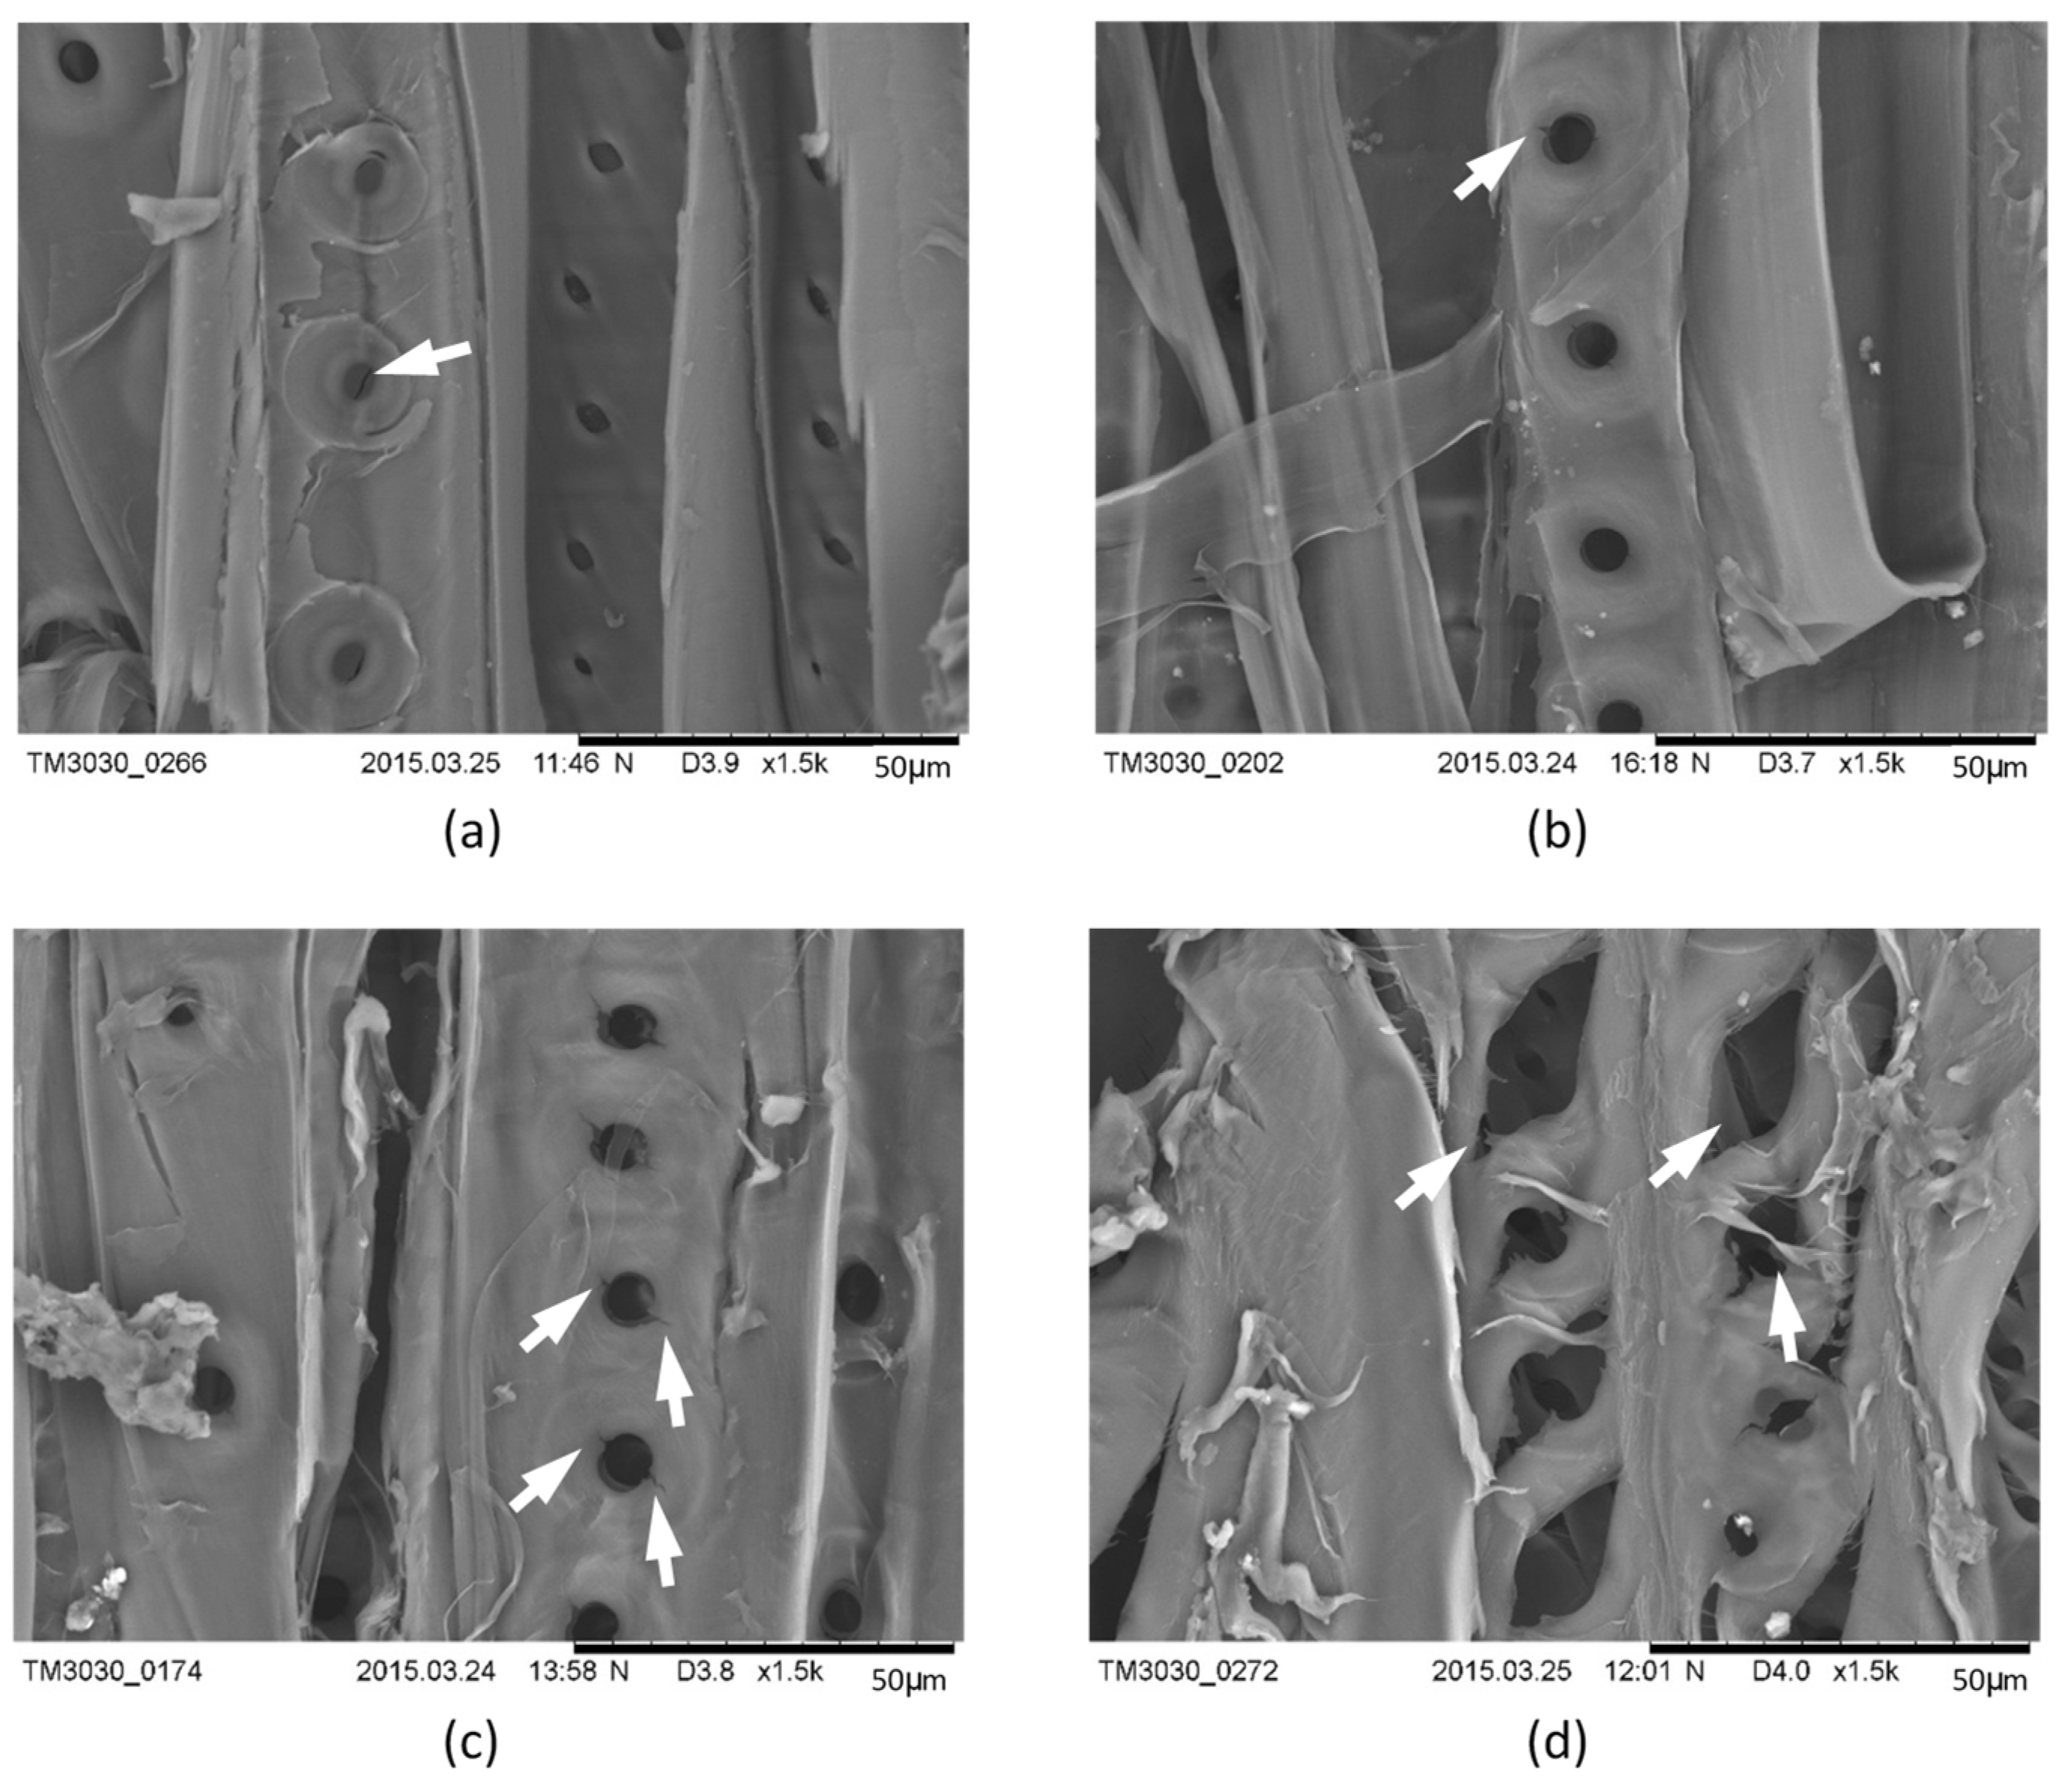
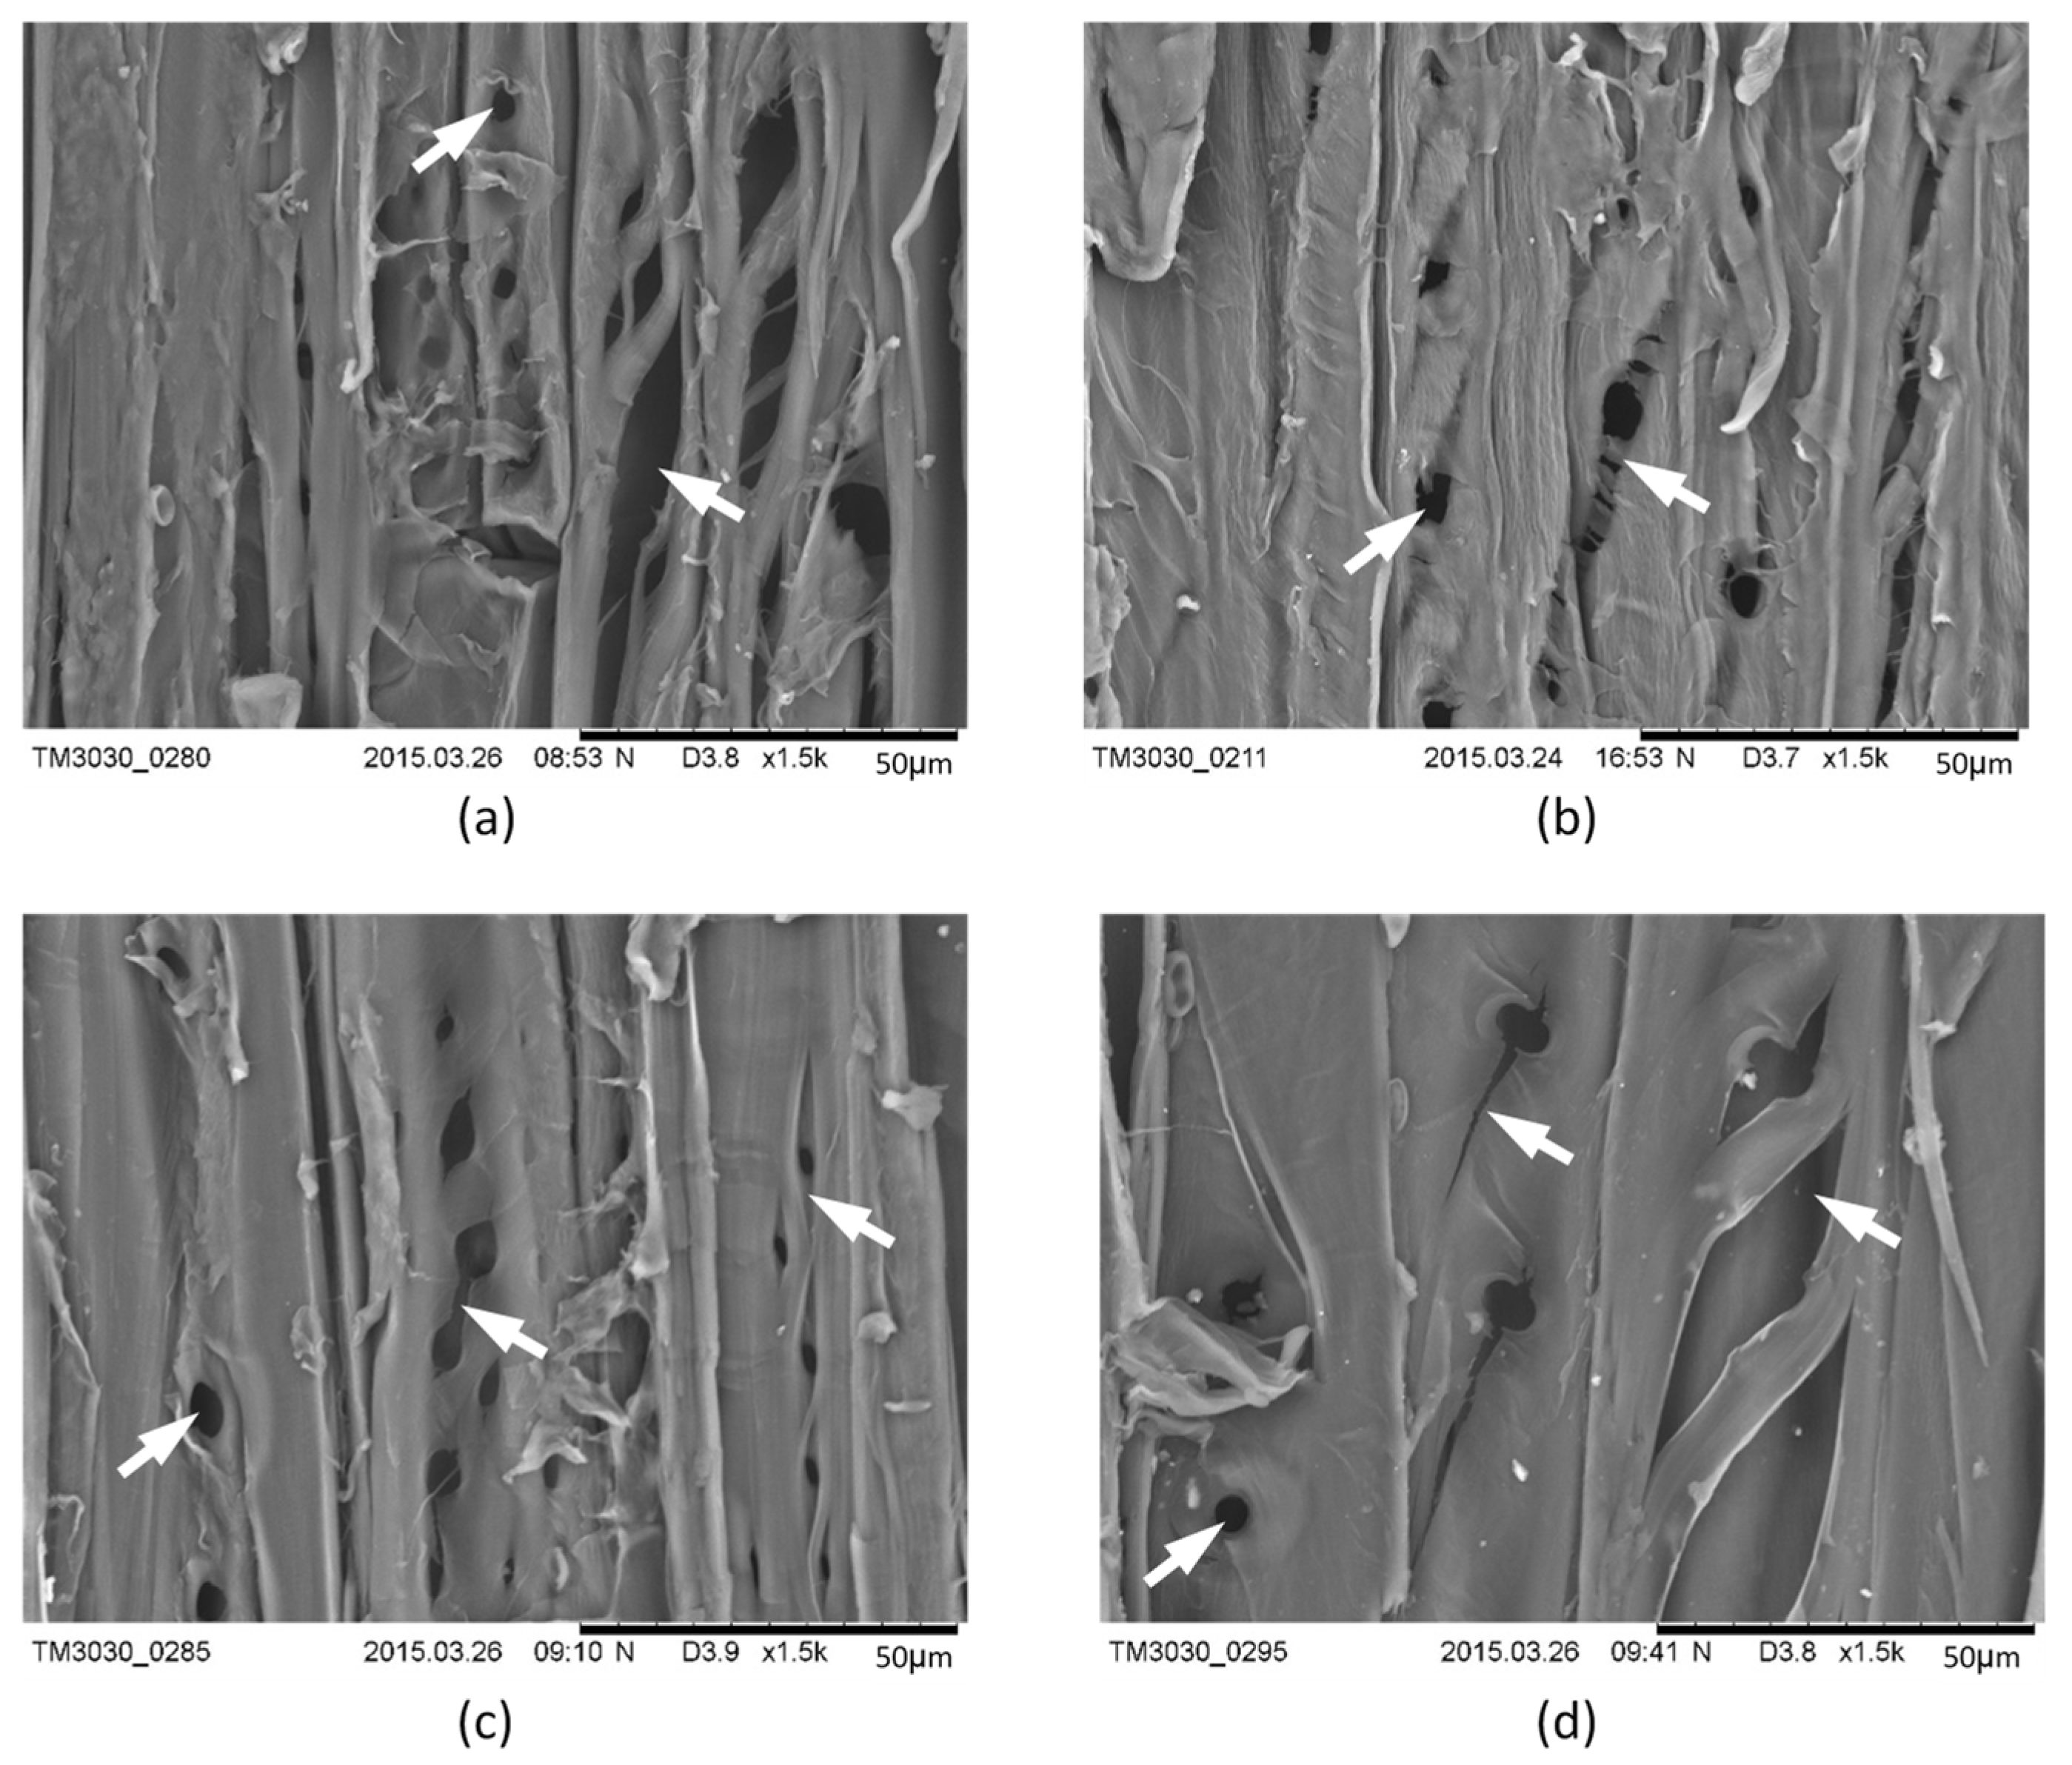
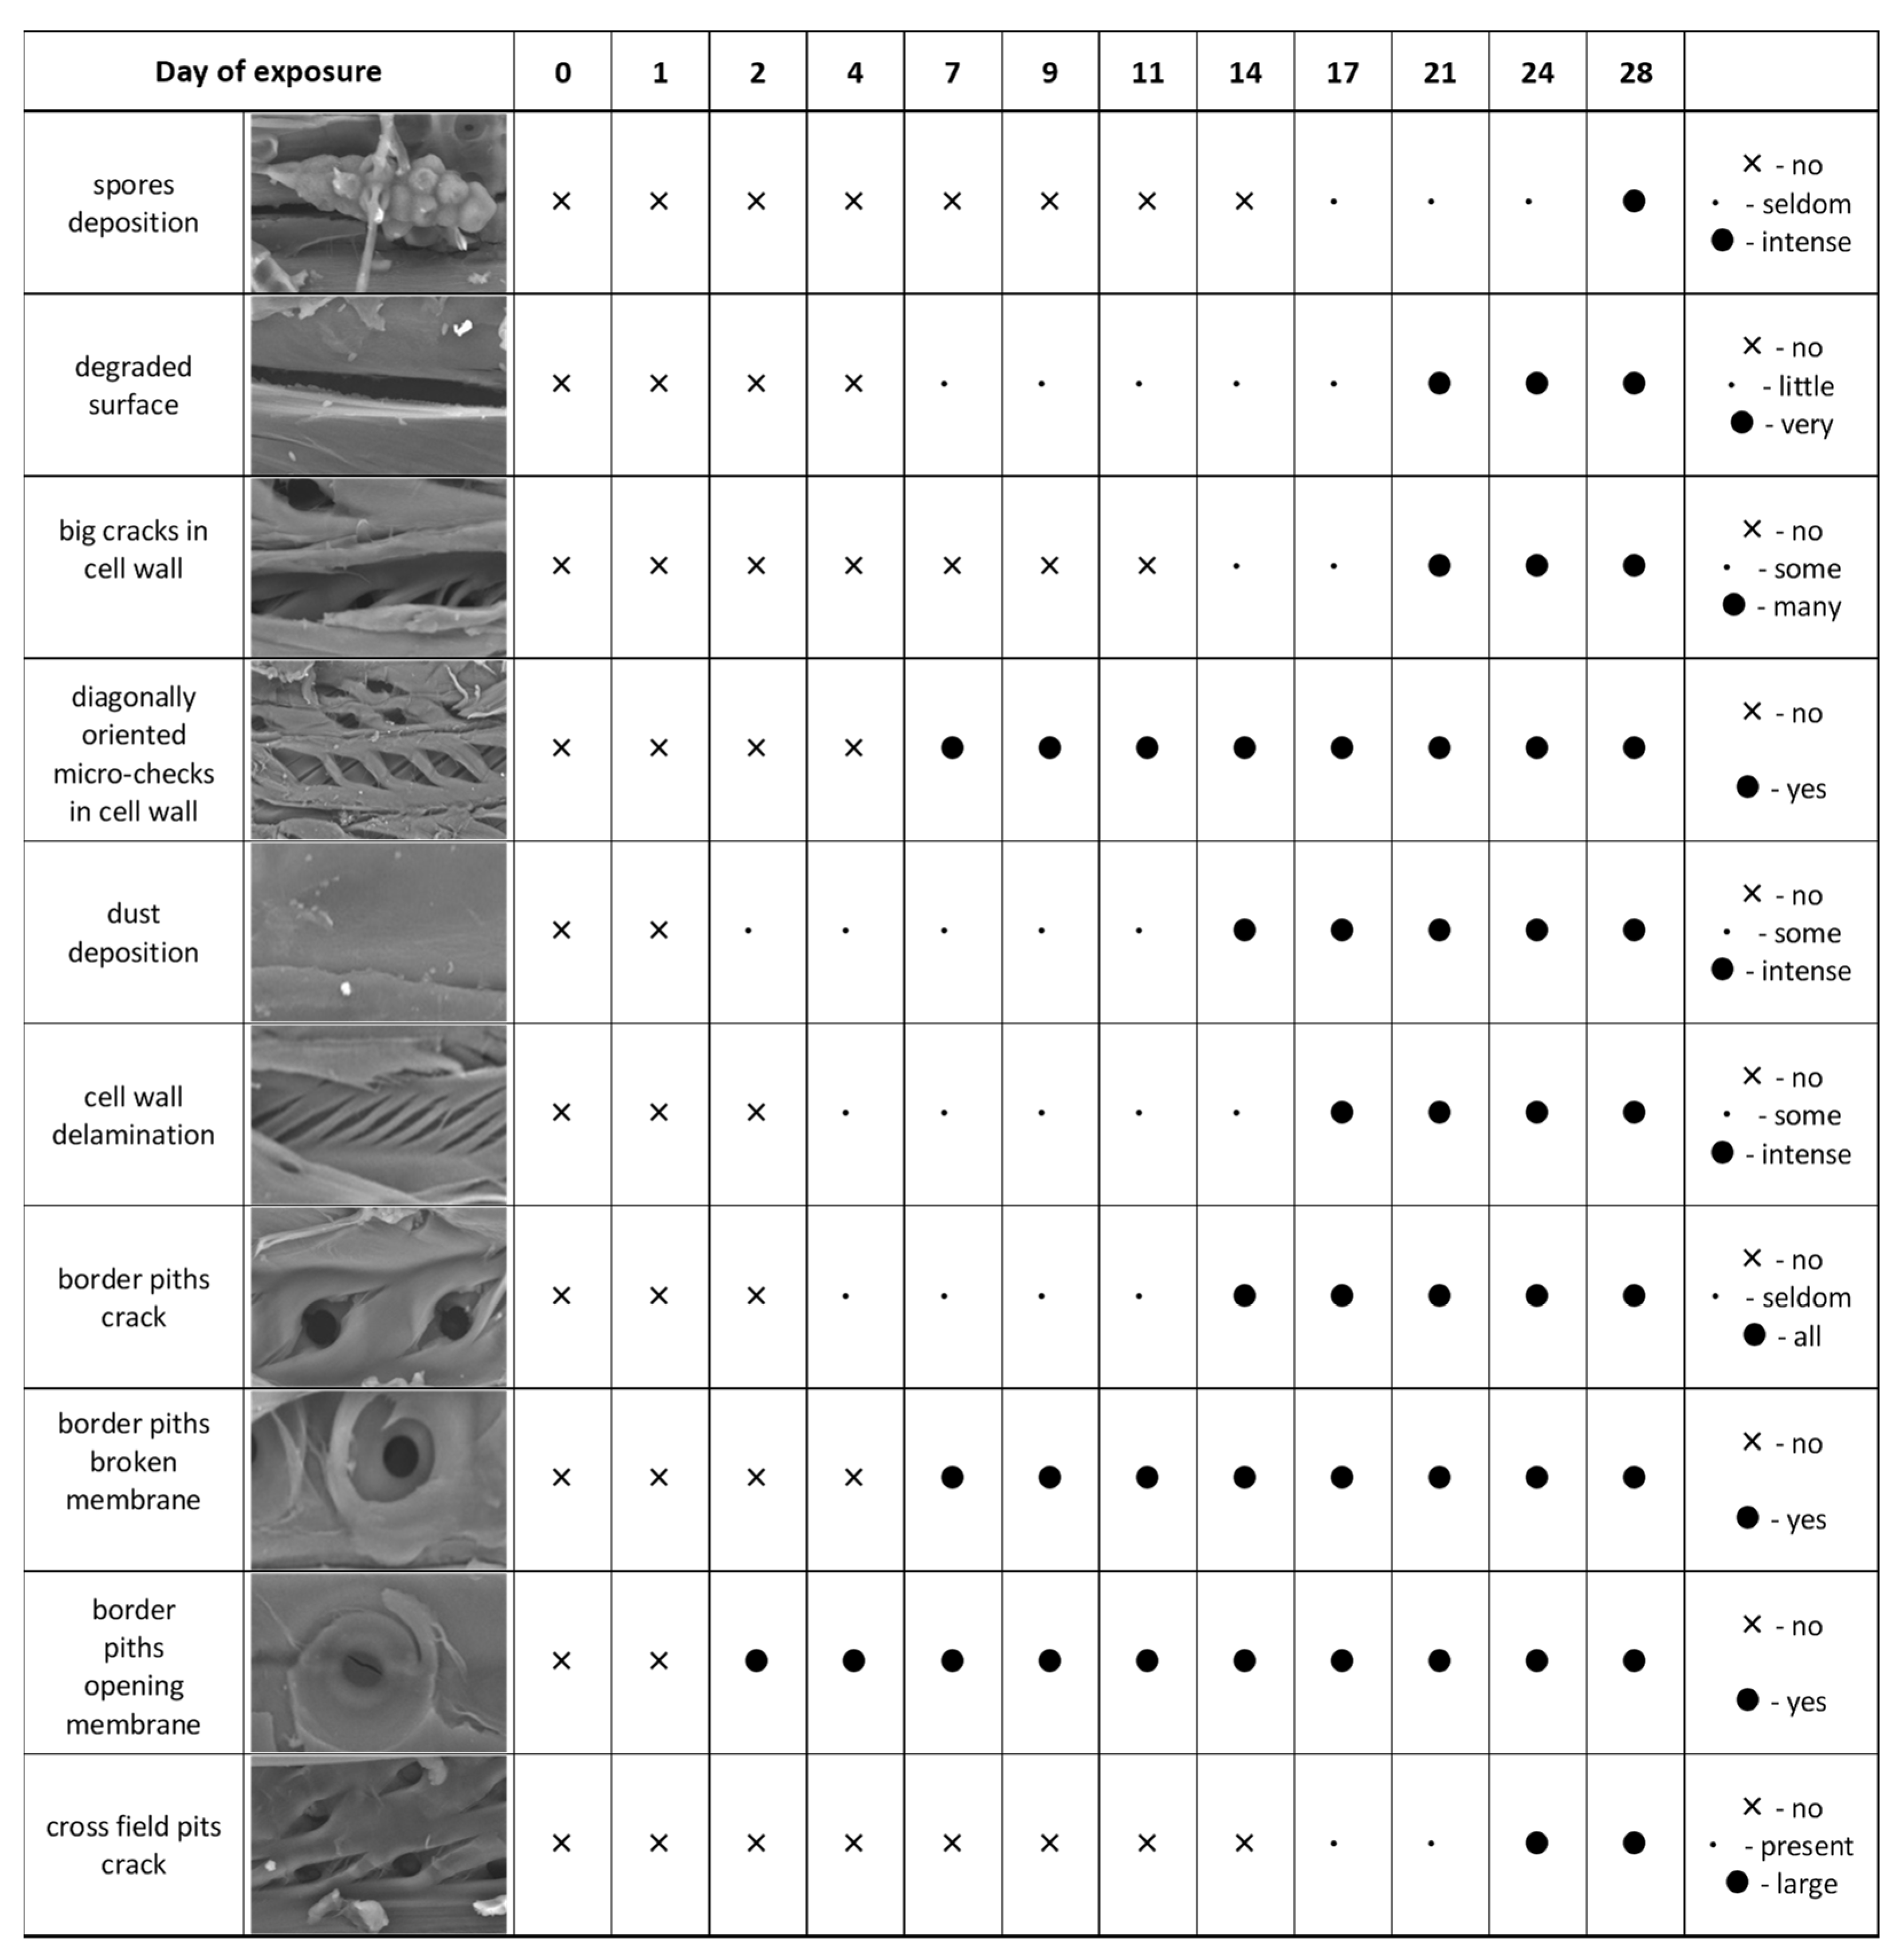
3.2. Cellular Level
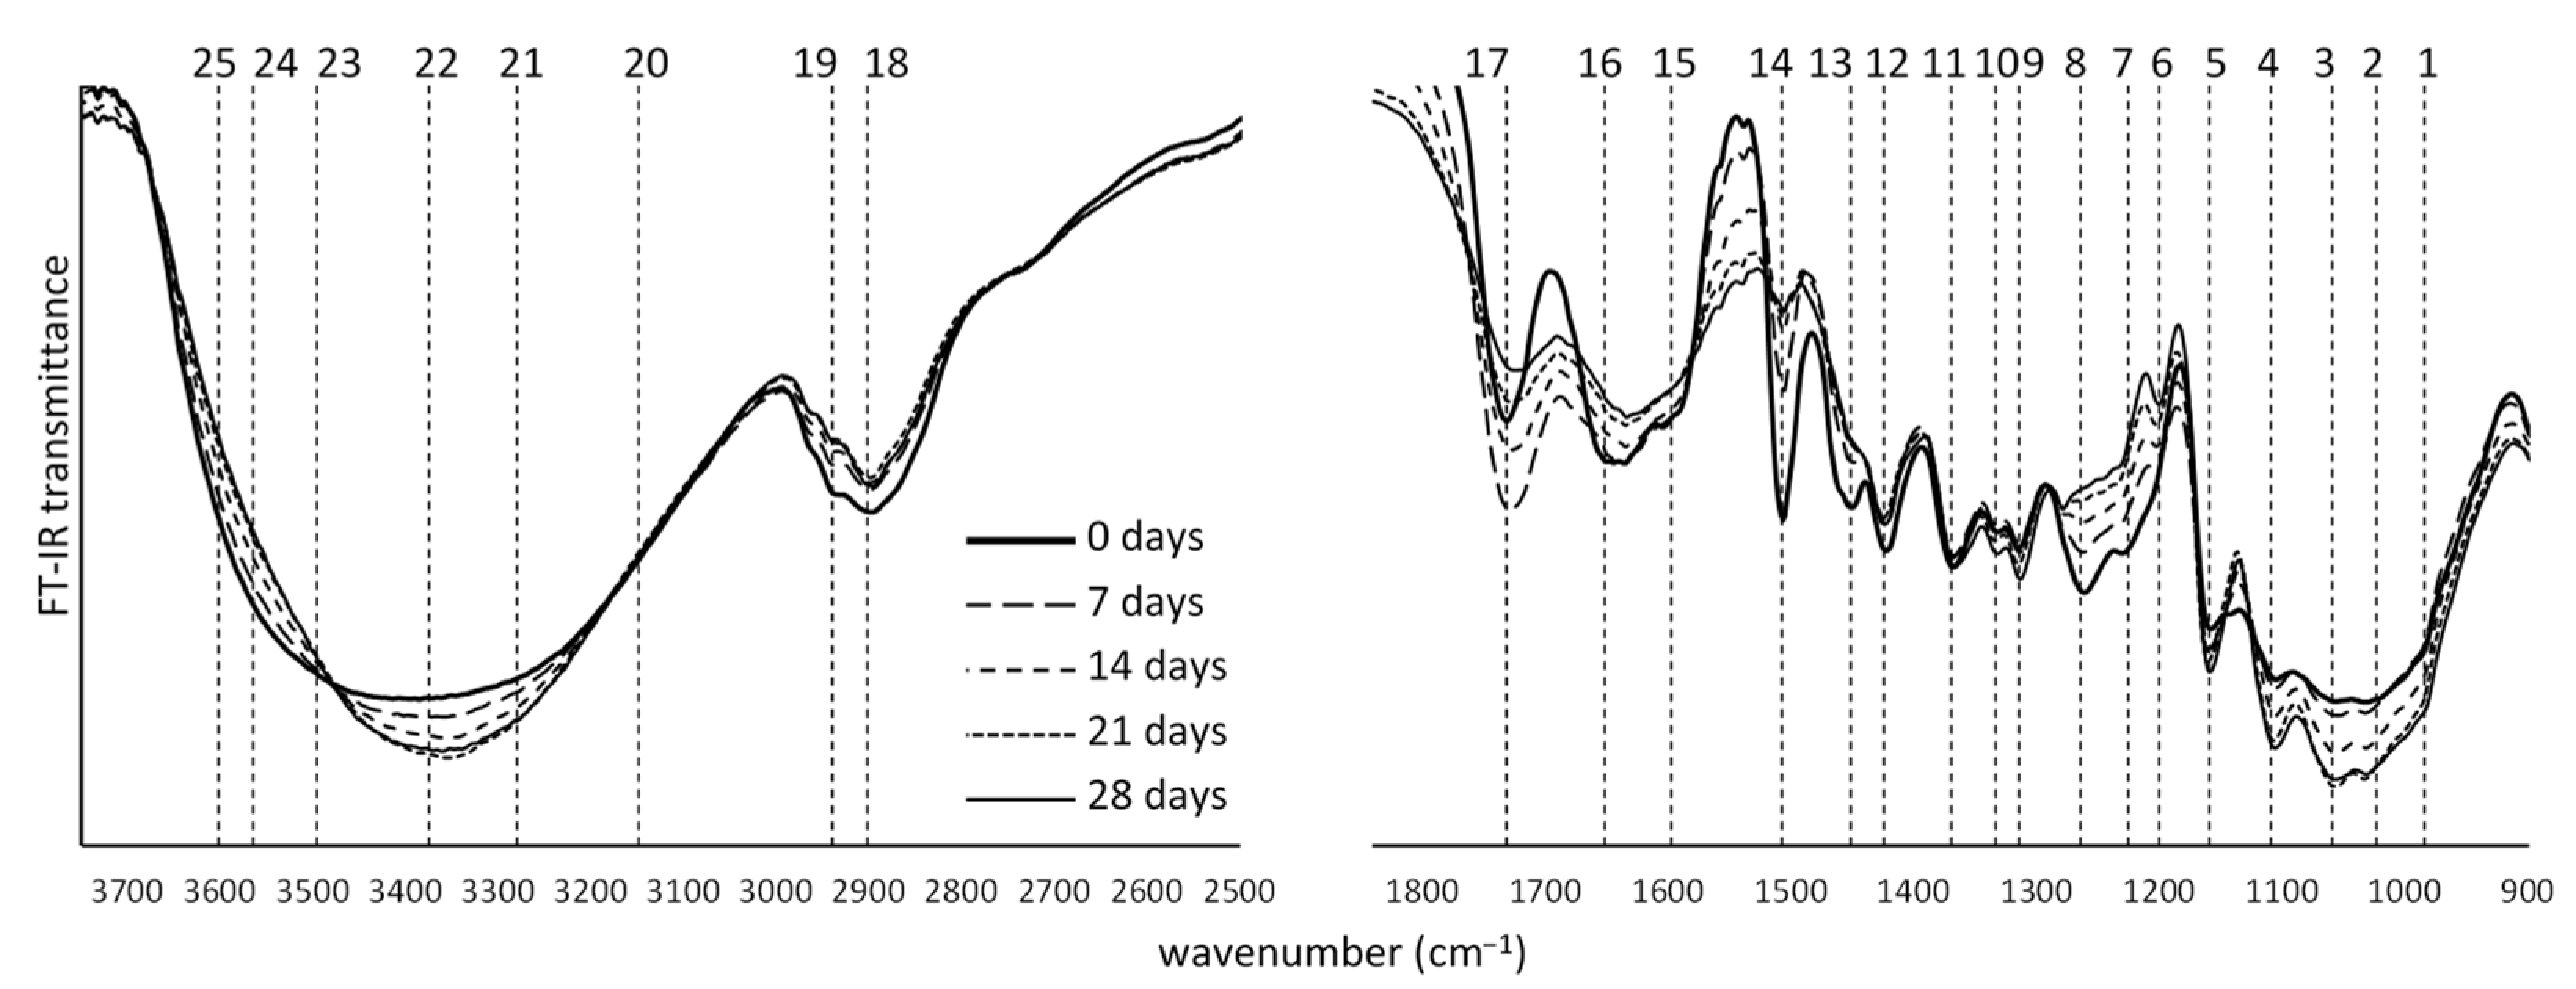
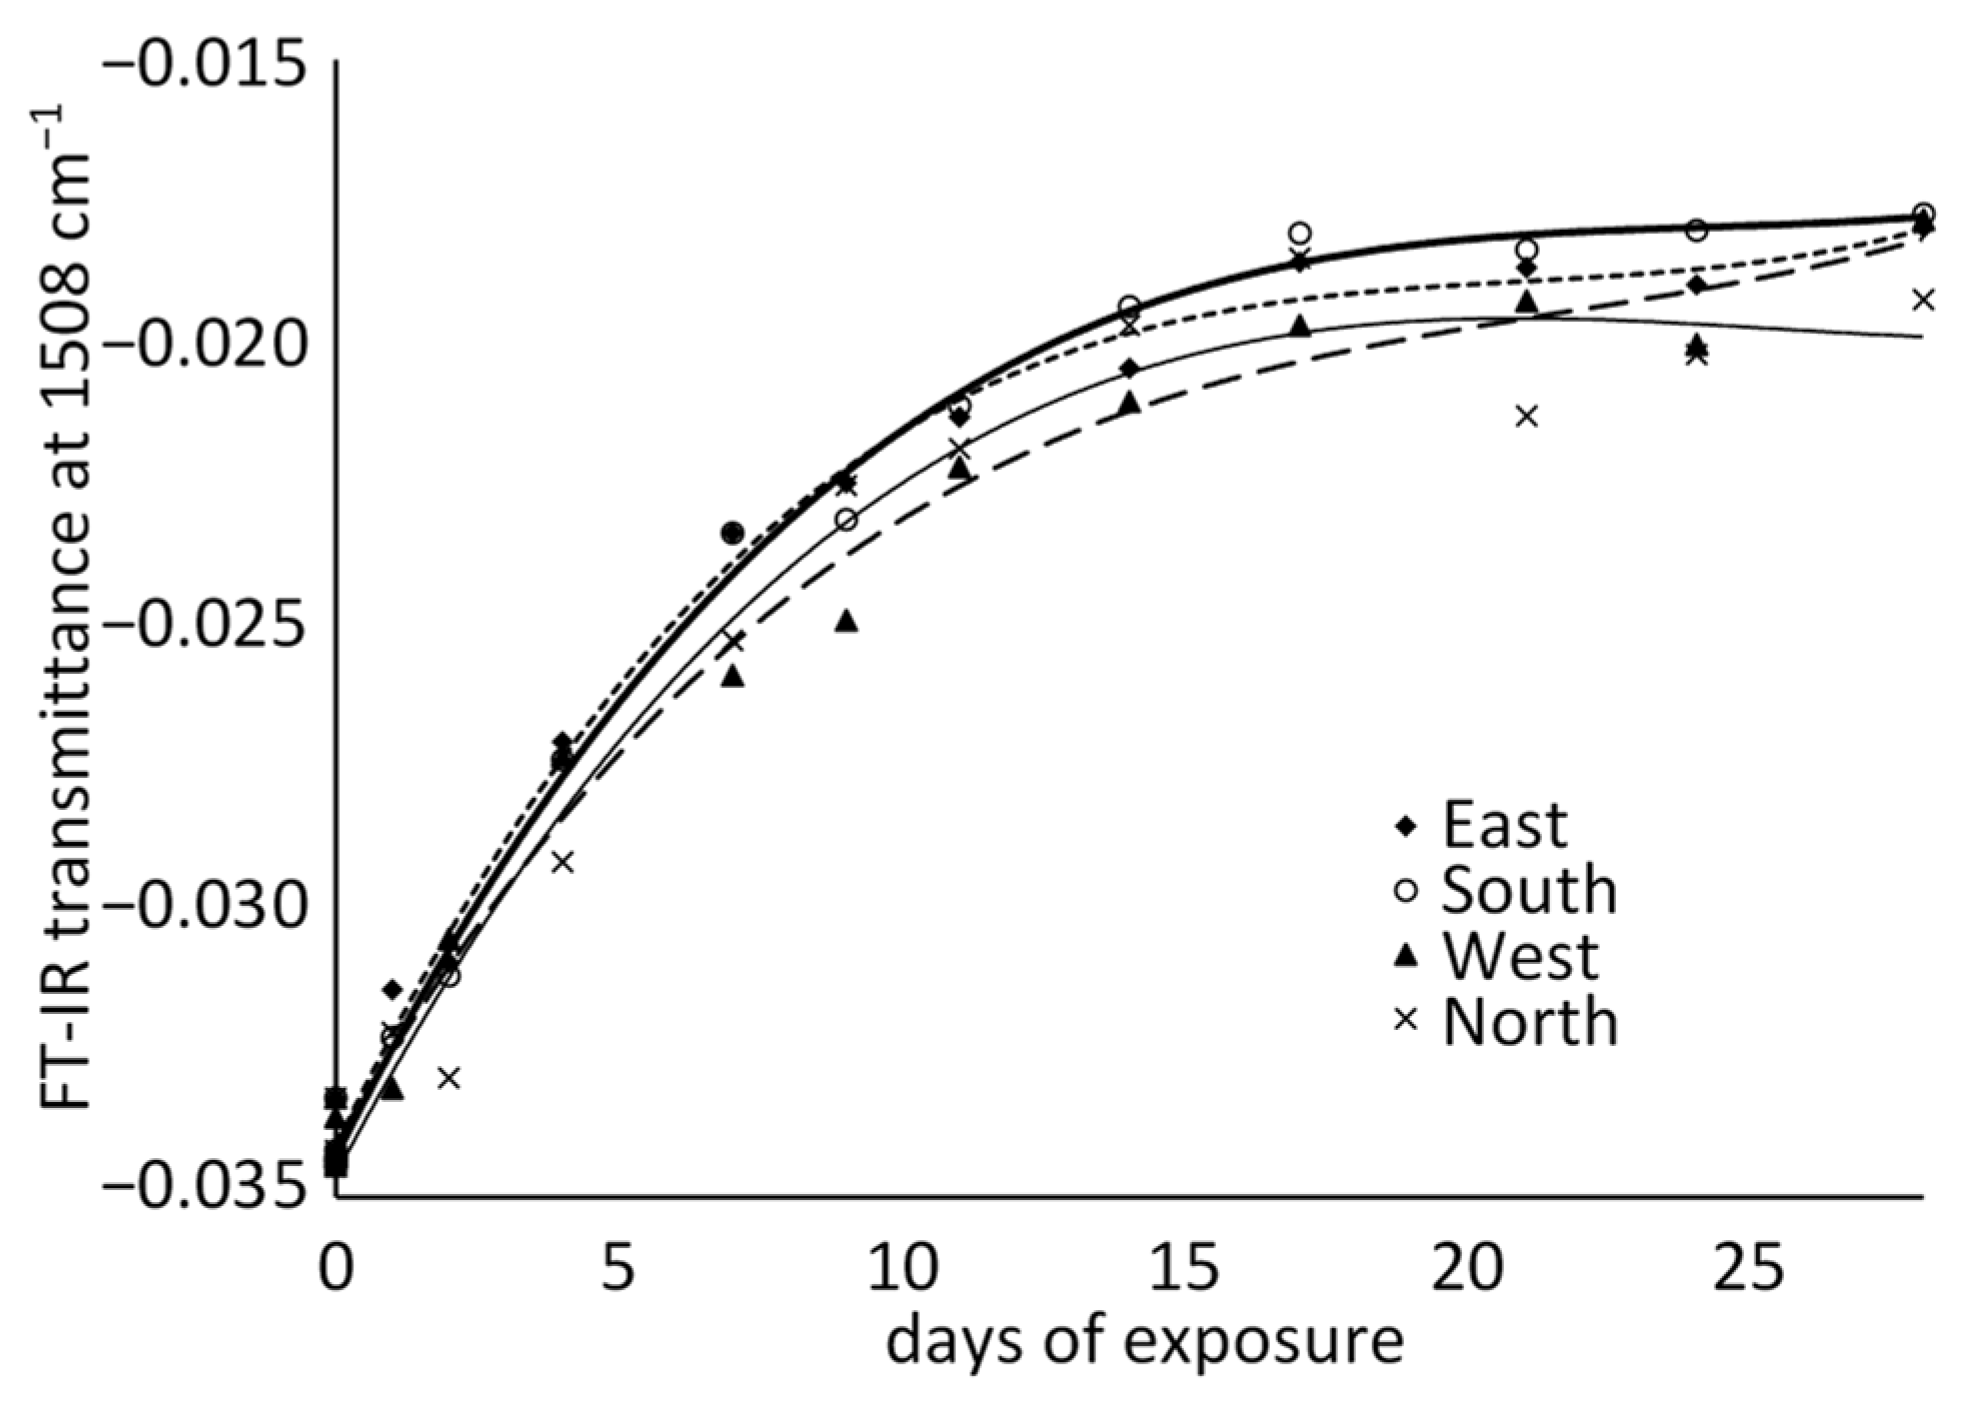
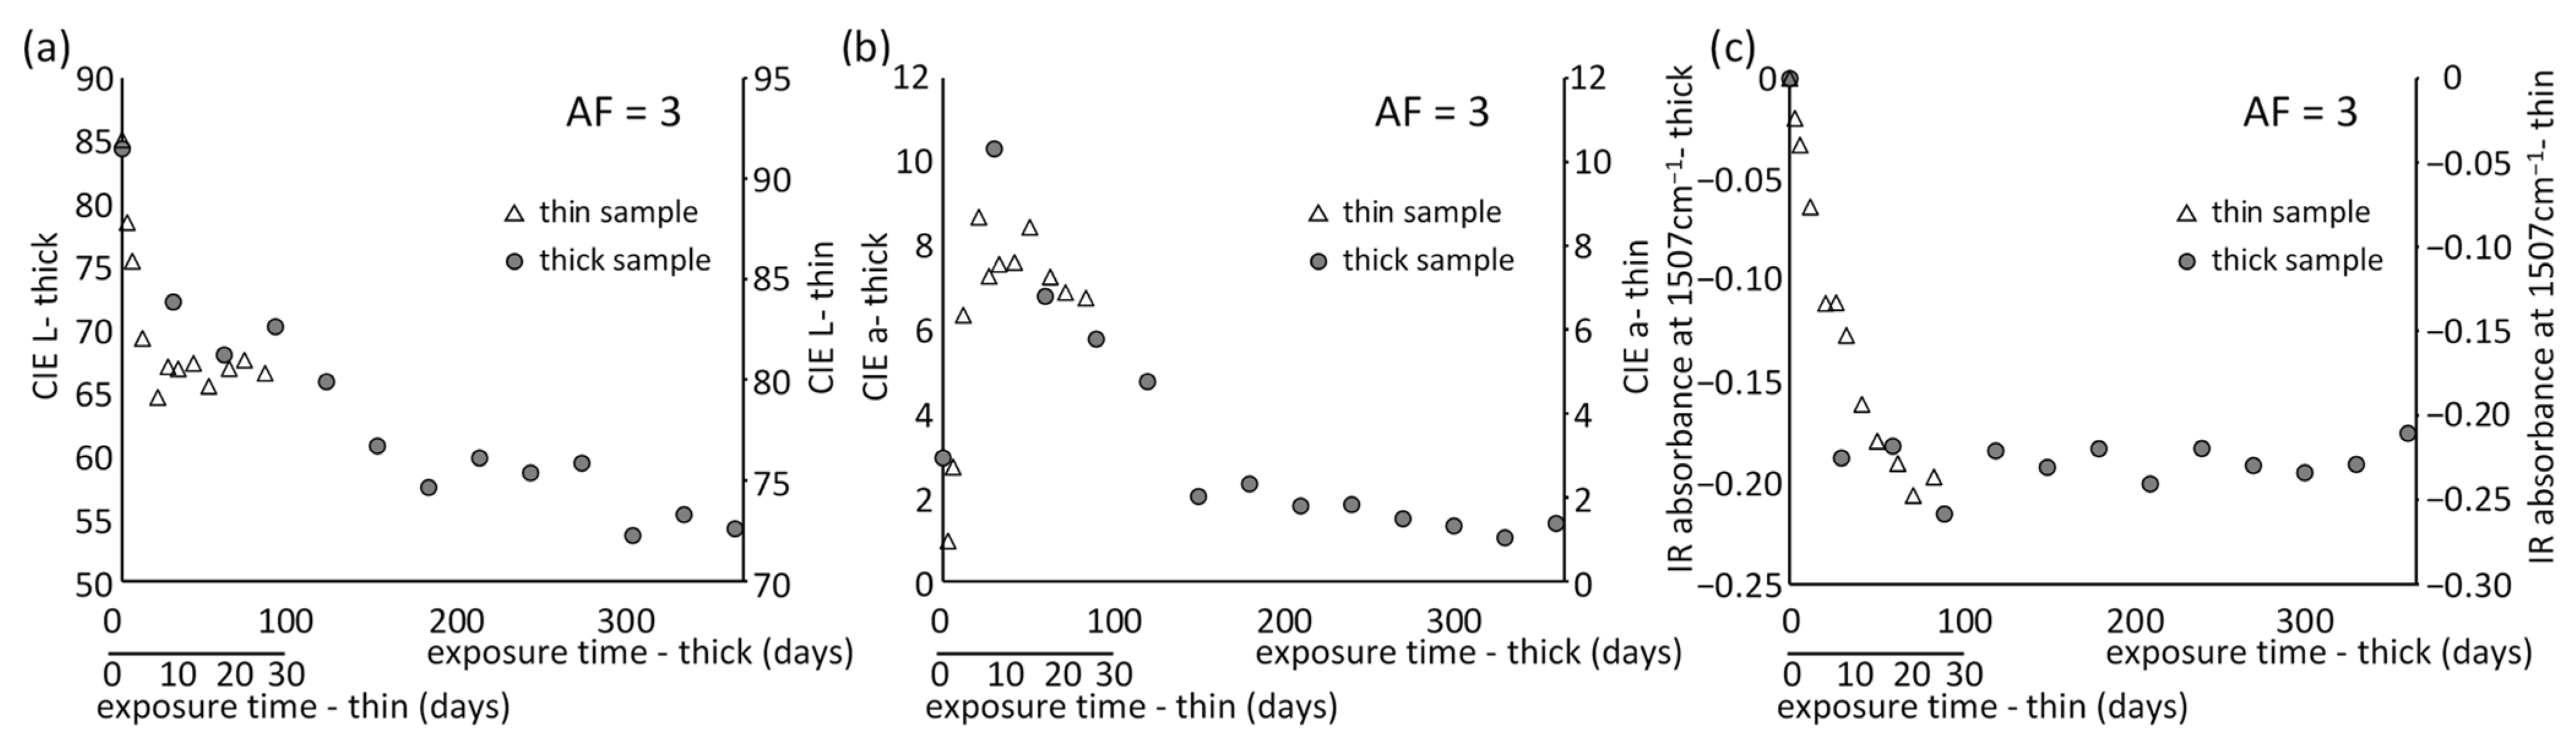
3.3. Molecular Level
4. Discussion
5. Conclusions
Author Contributions
Funding
Institutional Review Board Statement
Informed Consent Statement
Data Availability Statement
Acknowledgments
Conflicts of Interest
References
- Ivanović-Šekularac, J.; Čikić-Tovarović, J.; Šekularac, N. Application of wood as an element of façade cladding in construction and reconstruction of architectural objects to improve their energy efficiency. Energy Build. 2016, 115, 85–93. [Google Scholar] [CrossRef]
- De Vetter, L.; Cnudde, V.; Masschaele, B.; Jacobs, P.J.S.; Van Acker, J. Detection and distribution analysis of organosilicon compounds in wood by means of SEM-EDX and micro-CT. Mater. Charact. 2006, 56, 39–48. [Google Scholar] [CrossRef]
- Petrillo, M.; Sandak, J.; Grossi, P.; Sandak, A. Chemical and appearance changes of wood due to artificial weathering—Dose-response model. J. Near Infrared Spectrosc. 2019, 27, 26–37. [Google Scholar] [CrossRef]
- Williams, R.R. Weathering of wood. In Handbook of Wood Chemistry and Wood Composites, 1st ed.; Rowell, R.M., Ed.; CRC Press: Boca Raton, FL, USA, 2005; pp. 139–185. [Google Scholar]
- Low-Temperature EMMA®/EMMAQUA®. Available online: https://www.atlas-mts.com/products/accelerated-weathering-test-services/natural-weathering/accelerated-weathering-test/emmaqua-weathering-test (accessed on 3 January 2021).
- Kennedy, R.W.; Ifju, G. Application of microtensile testing to thin wood sections. Tappi 1962, 45, 725–733. [Google Scholar]
- Manwiller, F.G.; Godfrey, P.R. Microtensile strength of spruce pine after exposure to acids and bases. Wood Sci. 1973, 5, 295–297. [Google Scholar]
- Raczkowski, J. Natural atmospheric corrosion of microtome wood sections. In Proceedings of the 10th Symp. on Wood Protection, Rogów, Poland, 17–19 October 1978. (In Polish). [Google Scholar]
- Raczkowski, J. Seasonal effects on the atmospheric corrosion of spruce micro-sections. Holz Roh Werkst. 1980, 38, 231–234. [Google Scholar] [CrossRef]
- BS EN 927-6 Paints and Varnishes. Coating Materials and Coating Systems for Exterior Wood; European Committee for Standardization: Brussels, Belgium, 2018.
- Arnold, M.; Sell, J.; Feist, W.C. Wood weathering in fluorescent ultraviolet and xenon arc chambers. For. Prod. J. 1991, 41, 40–44. [Google Scholar]
- Podgorski, L.; Arnold, M.; Hora, G. A reliable artificial weathering test for wood coatings. Coat. World 2003, 2, 39–48. [Google Scholar]
- Grüll, G.; Tscherne, F.; Spitaler, I.; Forsthuber, B. Comparison of wood coating durability in natural weathering and artificial weathering using fluorescent UV-lamps and water. Eur. J. Wood Prod. 2014, 72, 367–376. [Google Scholar] [CrossRef]
- Ozgenc, O. Comparing durability of wood material in natural and artificial weathering conditions. ProLigno 2016, 12, 3–11. [Google Scholar]
- Rüther, P.; Jelle, B.P. Color changes of wood and wood-based materials due to natural and artificial weathering. Wood Mater. Sci. Eng. 2013, 8, 13–25. [Google Scholar]
- Brischke, C.; Thelandersson, S. Modelling the outdoor performance of wood products—A review on existing approaches. Constr. Build. Mater. 2014, 66, 384–397. [Google Scholar] [CrossRef]
- Rüther, P.; Time, B. External wood claddings—Performance criteria, driving rain and large-scale water penetration methods. Wood Mater. Sci. Eng. 2016, 10, 287–299. [Google Scholar] [CrossRef]
- Thiis, T.K.; Burud, I.; Kranitis, D.; Gobakken, L.R. Simulation of surface climate and mould growth on wooden facades. In The International Research Group on Wood Protection IRG/WP 16-20585; IRG Secretariat: Stockholm, Sweden, 2016. [Google Scholar]
- Sandak, J.; Sandak, A.; Riggio, M. Characterization and monitoring of surface weathering on exposed timber structures with multi-sensor approach. Int. J. Archit. Herit. 2015, 9, 674–688. [Google Scholar] [CrossRef]
- Sandak, J.; Sandak, A.; Burud, I. Modelling of weathering. In Performance of Bio-Based Building Materials, 1st ed.; Jones, D., Brischke, C., Eds.; Woodhead Publishing: Cambridge, UK, 2017; pp. 502–510. [Google Scholar]
- Salmén, L. Wood morphology and properties from molecular perspectives. Ann. For. Sci. 2015, 72, 679–684. [Google Scholar] [CrossRef]
- Wiedenhoeft, A. Structure and function of wood. In Wood Handbook: Wood as an Engineering Material; Rowell, R.M., Ed.; Forest Products Laboratory: Madison, WI, USA, 2010; pp. 3.1–3.18. [Google Scholar]
- Fengel, D.; Wegener, G. Wood—Chemistry, Ultrastructure, Reactions; Walter de Gruyter: New York, NY, USA, 1989. [Google Scholar]
- Chinga-Carrasco, G.; Johnsen, P.O.; Øyaas, K. Structural quantification of wood fibre surfaces—Morphological effects of pulping and enzymatic treatment. Micron 2010, 41, 648–659. [Google Scholar] [CrossRef] [PubMed]
- Hamed, S.A.M.; Ali, M.F.; El Hadidi, N.M.N. Using SEM in monitoring changes in archaeological wood: A review. In Current Microscopy Contributions to Advances in Science and Technology; Méndez-Vilas, A., Ed.; Formatex Research Center: Badajoz, Spain, 2012; pp. 1077–1084. [Google Scholar]
- Jingran, G.; Jian, L.; Jian, Q.; Menglin, G. Degradation assessment of waterlogged wood at Haimenkou site. Frat. Integrità Strutt. 2014, 30, 495–501. [Google Scholar] [CrossRef]
- Nicole, M.; Chamberland, H.; Rioux, D.; Xixuan, X.; Blanchette, R.A.; Geiger, J.P.; Ouellette, G.B. Wood degradation by Phellinus noxius: uItrastructure and cytochemistry. Can. J. Microbiol. 1995, 41, 253–265. [Google Scholar] [CrossRef]
- Popescu, C.M.; Tibirna, C.M.; Nanoliu, A.; Gradinariu, P.; Vasile, C. Microscopic study of lime wood degraded by Chaetomium globosum. Cellul. Chem. Technol. 2011, 45, 565–569. [Google Scholar]
- Singh, A.P.; Singh, T.; Rickard, C.L. Visualising impregnated chitosan in Pinus radiata early wood cells using light and scanning electron microscopy. Micron 2010, 41, 263–267. [Google Scholar] [CrossRef]
- Singh, A.P.; Anderson, R.; Parka, B.D.; Nuryawana, A. A novel approach for FE-SEM imaging of wood-matrix polymer interface in a biocomposite. Micron 2013, 54–55, 87–90. [Google Scholar] [CrossRef] [PubMed]
- Turkulin, H.; Arnold, M.; Derbyshire, H.; Sell, J. Structural and fractographic SEM analysis of exterior coated wood. Surf. Coat. Int. Part B Coat. Trans. 2001, 84, 67–75. [Google Scholar] [CrossRef]
- Pfeffer, A.; Mai, C.; Militz, H. Weathering characteristics of wood treated with water glass, siloxane or DMDHEU. Eur. J. Wood Prod. 2012, 70, 165–176. [Google Scholar] [CrossRef]
- Kocaefe, D.; Huang, X.; Kocaefe, Y. Comparison of weathering behaviours of heat-treated jack pine during different artificial weathering conditions. In Proceedings of the 4th International Conference on Fluid Mechanics and Heat & Mass Transfer (FLUIDSHEAT’13), Dubrovnik, Croatia, 25–27 June 2013; pp. 74–79. [Google Scholar]
- Ganne-Chedeville, C.; Volkmer, T.; Letsch, B.; Lehmann, M. Measures for the maintenance of untreated wood facades. In Proceedings of the WCTE, Auckland, New Zealand, 15–19 July 2012; p. 6. [Google Scholar]
- Fackler, K.; Schwanninger, M. How spectroscopy and microspectroscopy of degraded wood contribute to understand fungal wood decay. Appl. Microbiol. Biotechnol. 2012, 96, 587–599. [Google Scholar] [CrossRef]
- Sandak, A.; Sandak, J.; Riggio, M. Assessment of wood structural members degradation by means of infrared spectroscopy: An overview. Struct. Control Health 2016, 23, 396–408. [Google Scholar] [CrossRef]
- Popescu, C.M.; Popescu, M.C.; Vasile, C. Structural changes in biodegraded lime wood. Carbohydr. Polym. 2010, 79, 362–372. [Google Scholar] [CrossRef]
- Popescu, C.M.; Froidevaux, J.; Navi, P.; Popescu, M.C. Structural modifications of Tilia cordata wood during heat treatment investigated by FT-IR and 2D IR correlation spectroscopy. J. Mol. Struct. 2013, 1033, 176–186. [Google Scholar] [CrossRef]
- Huang, A.; Zhou, Q.; Liu, J.; Fei, B.; Sun, S. Distinction of three wood species by Fourier transform infrared spectroscopy and two-dimensional correlation IR spectroscopy. J. Mol. Struct. 2008, 883, 160–166. [Google Scholar] [CrossRef]
- Sandak, A.; Sandak, J.; Burud, I.; Gobakken, L.R. Weathering kinetics of thin wood veneers assessed with near infrared spectroscopy. J. Near Infrared Spectrosc. 2016, 24, 549–553. [Google Scholar] [CrossRef]
- Gallagher, N.B.; Blake, T.A.; Gassman, P.L. Application of extended inverse scatter correction to mid-infrared reflectance spectra of soil. J. Chemometr. 2005, 19, 271–281. [Google Scholar] [CrossRef]
- Faix, O. Classification of lignins from different botanical origins by FT-IR spectroscopy. Holzforschung 1991, 45, 21–27. [Google Scholar] [CrossRef]
- Schwanninger, M.; Rodrigues, J.; Pereira, H.; Hinterstoisser, B. Effects of short-time vibratory ball milling on the shape of FT-IR spectra of wood and cellulose. Vib. Spectrosc. 2004, 36, 23–40. [Google Scholar] [CrossRef]
- Popescu, C.M.; Vasile, C.; Popescu, M.C. Degradation of lime wood painting supports II. Spectral characterisation. Cellul. Chem. Technol. 2006, 40, 649–658. [Google Scholar]
- McLean, J.P.; Jin, G.; Brennan, M.; Nieuwoudt, M.K.; Harris, P.J. Using NIR and ATR-FTIR spectroscopy to rapidly detect compression wood in Pinus radiata. Can. J. For. Res. 2014, 44, 820–830. [Google Scholar] [CrossRef]
- Guo, X.; Wu, Y.; Yan, N. In situ micro-FTIR observation of molecular association of adsorbed water with heat-treated wood. Wood Sci. Technol. 2018, 52, 971–985. [Google Scholar] [CrossRef]
- Nejad, S.M.M.; Madhoushi, M.; Vakili, M.; Rasouli, D. Evaluation of degradation in chemical compounds of wood in historical buildings using FT-IR and FT-Raman vibrational spectroscopy. Maderas Cienc. Tecnol. 2019, 21, 381–392. [Google Scholar]
- Noda, I.; Ozaki, Y. Two-Dimensional Correlation Spectroscopy; John Willey & Sons Ltd.: Chichester, UK, 2005. [Google Scholar]
- Noda, I. Two-dimensional infrared spectroscopy. J. Am. Chem. Soc. 1989, 111, 8116–8118. [Google Scholar] [CrossRef]
- Evans, P.D. Effect of angle of exposure on the weathering of wood surfaces. Polym. Degrad. Stabil. 1989, 24, 81–87. [Google Scholar] [CrossRef]
- Cogulet, A.; Blanchet, P.; Landry, V. Wood degradation under UV irradiation: A lignin characterization. J. Photochem. Photobiol. B 2016, 158, 184–191. [Google Scholar] [CrossRef]
- Kishino, M.; Nakano, T. Artificial weathering of tropical woods. Part1: Changes in wettability. Holzforschung 2004, 58, 552–557. [Google Scholar] [CrossRef]
- EN 927-3 Paints and Varnishes—Coating Materials and Coating Systems for Exterior Wood—Part 3: Natural Weathering Test; European Committee for Standardization: Brussels, Belgium, 2000.
- Müller, U.; Rätzsch, M.; Schwanninger, M.; Steiner, M.; Zöbl, H. Yellowing and IR-changes of spruce wood as result of UV-irradiation. J. Photochem. Photobiol. B 2003, 69, 97–105. [Google Scholar] [CrossRef]
- Tolvaj, L.; Faix, O. Artificial ageing of wood monitored by DRIFT spectroscopy and CIE L*a*b* colour measurements. Holzforschung 1995, 45, 397–404. [Google Scholar] [CrossRef]
- Turkulin, H. SEM Methods in Surface Research on Wood; COST E 18 Final Seminar; CTBA: Paris, France, 2004. [Google Scholar]
- Sandberg, D. Weathering of radial and tangential wood surfaces of pine and spruce. Holzforschung 1999, 53, 355–364. [Google Scholar] [CrossRef]
- Pandley, K.K.; Pitman, A.J. Weathering characteristics of modified rubberwood (Hevea brasiliensis). J. Appl. Polym. Sci. 2002, 85, 622–631. [Google Scholar] [CrossRef]
- Owen, J.A.; Owen, N.L.; Feist, W.C. Scanning electron microscope and infrared studies of weathering in southern pine. J. Mol. Struct. 1993, 300, 105–114. [Google Scholar] [CrossRef]
- Timar, M.C.; Varodi, A.M.; Gurǎu, L. Comparative study of photodegradation of six wood species after short-time UV exposure. Wood Sci. Technol. 2016, 50, 135–163. [Google Scholar]
- Noda, I. Advances in two-dimensional correlation spectroscopy (2DCOS). In Frontiers and Advances in Molecular Spectroscopy, 1st ed.; Laane, J., Ed.; Elsevier Science Publishing Co Inc.: Cambridge, MA, USA, 2017; pp. 47–75. [Google Scholar]
- Grossman, D.M. Errors caused by using Joules to time laboratory and outdoor exposure tests. In Accelerated and Outdoor Durability Testing of Organic Materials; Grossman, D., Ketola, W., Eds.; ASTM International: West Conshohocken, PA, USA, 1994; pp. 68–87. [Google Scholar]
- Burud, I.; Sandak, A.; Sandak, J.; Flö, A.; Thiis, T.; Gobakken, R.L.; Smeland, K.A.; Kvaal, K. Weather degradation of thin wood samples assessed with NIR hypersepctral imaging in transmission mode. In Proceedings of the 17th International Conference on Near Infrared Spectroscopy, Foz do Iguassu, Brazil, 18–23 October 2015; pp. 23–25. [Google Scholar]
- Groves, K.W.; Banana, A.Y. Weathering characteristics of Australian grown radiata pine. J. Inst. Wood Sci. 1986, 10, 210–213. [Google Scholar]
- Wang, Y.; Zhu, W.; Zhang, X.; Cai, G.; Wan, B. Influence of thickness on water absorption and tensile strength of BFRP Laminates in water or alkaline solution and a thickness-dependent accelerated ageing method for BFRP laminates. Appl. Sci. 2020, 10, 3618. [Google Scholar] [CrossRef]
- Jelle, B.P. Accelerated climate ageing of building materials, components and structures in the laboratory. J. Mater. Sci. 2012, 47, 6475–6496. [Google Scholar]
- Jankowska, A.; Rybak, K.; Nowacka, M.; Boruszewski, P. Insight of weathering processes based on monitoring surface characteristic of tropical wood species. Coatings 2020, 10, 877. [Google Scholar] [CrossRef]


| Day of Exposure | 0 | 1 | 2 | 4 | 7 | 9 | 11 | 14 | 17 | 21 | 24 | 28 |
|---|---|---|---|---|---|---|---|---|---|---|---|---|
| Mean temp (°C) | – | 18 | 20 | 22 | 17 | 18 | 20 | 22 | 24 | 20 | 21 | 19 |
| ∑ radiation (MJ/m2) | – | 30 | 60 | 105 | 162 | 202 | 251 | 324 | 407 | 469 | 527 | 581 |
| ∑ insolation (h) | – | 14 | 26 | 46 | 70 | 90 | 108 | 139 | 173 | 202 | 229 | 255 |
| total rain (mm) | – | 11 | 0 | 2 | 43 | 0 | 2 | 0 | 0 | 0 | 0 | 13 |
| RH (%) | – | 84 | 59 | 73 | 93 | 68 | 68 | 68 | 60 | 80 | 70 | 89 |
| mean wind speed (m/s) | – | 0.8 | 1.9 | 0.5 | 0.5 | 0.9 | 1.2 | 0.9 | 1.0 | 0.1 | 0.8 | 0.5 |
| Month | July | August | September | October | November | December | January | February | March | April | May | June |
|---|---|---|---|---|---|---|---|---|---|---|---|---|
| Mean temp (°C) | 19 | 17 | 10 | 6 | 4 | 1 | −4 | −2 | 0 | 6 | 8 | 13 |
| RH (%) | 68 | 69 | 77 | 83 | 71 | 76 | 84 | 84 | 79 | 76 | 76 | 78 |
| Wind speed (m/s) | 0.6 | 0.5 | 0.4 | 0.3 | 1.0 | 1.0 | 0.9 | 0.4 | 0.4 | 0.7 | 0.3 | 0.6 |
| Wind direction (°) | 199 | 165 | 159 | 62 | 333 | 338 | 317 | 337 | 1 | 187 | 168 | 185 |
| ∑ rainfall (kg/m2) | 99 | 176 | 147 | 192 | 4 | 2 | 26 | 61 | 21 | 115 | 237 | 312 |
| ∑ snowfall (kg/m2) | 0 | 1 | 8 | 24 | 11 | 1 | 25 | 102 | 81 | 29 | 16 | 8 |
| ∑ irradiation (kWh/m2) | 195 | 175 | 126 | 87 | 68 | 54 | 55 | 70 | 134 | 157 | 179 | 171 |
| Number | Peak Position | Band Assignment |
|---|---|---|
| 1 | 985 | CO valence vibrations |
| 2 | 1024 | CO stretching in cellulose and non-cellulose polysaccharides |
| 3 | 1060 | C–O + C–C stretch of cellulose |
| 4 | 1110 | Aromatic skeletal; C–C stretch |
| 5 | 1160 | CO stretching in ester groups in lignin |
| 6 | 1201 | untreated cellulose (ρ OH; δ CH) |
| 7 | 1226 | syringil ring; C–O stretching lignin and xylan |
| 8 | 1265 | guaiacyl ring vibrations and CO stretching lignin |
| 9 | 1315 | C–H vibration in cellulose; C–O in syringil derivatives |
| 10 | 1334 | vibration in CH and stretching in CO related to syringil ring |
| 11 | 1370 | CH bending in cellulose and non-cellulosic polysaccharides |
| 12 | 1425 | vibration of aromatic structures in lignin |
| 13 | 1452 | aromatic skeletal vibrations of lignin and CH2 vibration in cellulose |
| 14 | 1508 | aromatic skeletal vibrations of lignin and C=O stretching |
| 15 | 1598 | aromatic skeletal vibrations of lignin and C=O stretching |
| 16 | 1652 | stretching vibrations of conjugated C=O |
| 17 | 1732 | C=O–OH stretching in glucuronic acid in xylan |
| 18 | 2902 | symmetric CH2 valence vibrations |
| 19 | 2940 | asymmetric stretching vibrations of CH related to methyl and methylene in lignin, cellulose and hemicellulose |
| 20 | 3149 | –OH stretching in cellulose |
| 21 | 3280 | C–H stretching in methyl and methylene groups |
| 22 | 3375 | –O(3)H O(5) intramolecular hydrogen bonds in cellulose |
| 23 | 3496 | moderately H-bonded water |
| 24 | 3565 | valence vibration of H bonded OH groups |
| 25 | 3602 | weakly H-bonded water |
Publisher’s Note: MDPI stays neutral with regard to jurisdictional claims in published maps and institutional affiliations. |
© 2021 by the authors. Licensee MDPI, Basel, Switzerland. This article is an open access article distributed under the terms and conditions of the Creative Commons Attribution (CC BY) license (http://creativecommons.org/licenses/by/4.0/).
Share and Cite
Sandak, A.; Sandak, J.; Noël, M.; Dimitriou, A. A Method for Accelerated Natural Weathering of Wood Subsurface and Its Multilevel Characterization. Coatings 2021, 11, 126. https://doi.org/10.3390/coatings11020126
Sandak A, Sandak J, Noël M, Dimitriou A. A Method for Accelerated Natural Weathering of Wood Subsurface and Its Multilevel Characterization. Coatings. 2021; 11(2):126. https://doi.org/10.3390/coatings11020126
Chicago/Turabian StyleSandak, Anna, Jakub Sandak, Marion Noël, and Athanasios Dimitriou. 2021. "A Method for Accelerated Natural Weathering of Wood Subsurface and Its Multilevel Characterization" Coatings 11, no. 2: 126. https://doi.org/10.3390/coatings11020126
APA StyleSandak, A., Sandak, J., Noël, M., & Dimitriou, A. (2021). A Method for Accelerated Natural Weathering of Wood Subsurface and Its Multilevel Characterization. Coatings, 11(2), 126. https://doi.org/10.3390/coatings11020126