Article

Evaluating the Protective Effects of Calcium Carbonate Coating on Sandstone Cultural Heritage

1
School of Materials and Energy, Yunnan University, Kunming 650091, China
2
Literature Arrangement and Protection Foundation Laboratory, School of History and Archives, Yunnan University, Kunming 650091, China
*
Author to whom correspondence should be addressed.
Coatings 2021, 11(12), 1534; https://doi.org/10.3390/coatings11121534
Submission received: 23 September 2021 / Revised: 22 November 2021 / Accepted: 6 December 2021 / Published: 14 December 2021

Abstract

:
The purpose of this work was to use different surfactants to deposit different crystalline calcium carbonate films on the surface of sandstone through a simple double displacement reaction. This was done to test the protective effects of calcium carbonate coatings based on water absorption, moisture permeability and weather resistance. Experimental results showed that the air permeability of the stone treated with vaterite calcium carbonate was reduced, but that this did not affect water vapor’s access into and out of the stone. Compared with untreated stone, the water absorption rate was reduced 0.5 times, and the weather resistance increased by 4 times due to small crystal grains, high solubility, and deep penetration hindering the erosion of water and soluble salts. These findings are expected to provide useful suggestions for the protection of stone cultural heritage.

1. Introduction

The decay of stone is a key issue in the protection of stone cultural relics, and much research on the subject has focused on the protection and restoration of stone. Sandstone is an ordinary sedimentary rock encountered in heritage buildings [1], for example: the Piatra Church in Romania [2], the Museum of Contemporary Art in Sydney [3], and the Fines Towers of San Gimignano in Tuscany of Italy [4]. However, outdoor macroporous sandstone is vulnerable to severe damage by soluble salt. If the internal structural integrity of stone is destroyed, its preservation will be extremely difficult in the future [5].
Coating materials can protect sandstone buildings and have received extensive attention from researchers. However, most of the coating materials currently used are organic materials. Organic protective materials tend to have a short life, poor chemical compatibility and, due to limited permeability, a hydrophilic-hydrophobic interface can form within the stone. This can cause aggravated stress damage and acceleration of the weathering rate [6]. Additionally, organic coatings have other drawbacks, such as the yellowing and low Tg (depending on the materials) that—in a warm environment—can lead to the contaminants of pollutants on the surface of the artefact [7]. Other inorganic-organic hybrid materials, such as those obtained by the sol-gel method, also have the disadvantages of poor compatibility, permeability and anti-aging properties, and are likely to produce a hard crust on the surface of the stone and cause damage [8]. Therefore, a need exists for non-polluting, well-permeable, and compatible coating protection materials.
In the past few years, researchers have discovered an environmentally friendly consolidation strategy based on the ability of bacteria to induce the formation of calcium carbonate in the porous system of the material [9]. The metabolic activities of bacteria change the external environment of minerals. Their cellular structure, fragments, and secreted exosomes (EPS) provide nucleation sites for calcium carbonate [10]. Fadwa Jroundi et al. used the bacteria to mineralize and consolidate the gypsum materials in situ; the bacteria produced newly formed calcium carbonate formed by the vaterite and embedded in an organic matrix. This enhanced the mechanical resistance of gypsum without transforming the appearance of the calcium carbonate material [11]. Willem De Muynck et al. studied the effects of bacterial carbonate precipitation (biological deposition) on the durability of mortar samples with different porosities. Durability was evaluated from the permeability and the degradation resistance. The results showed that the biological deposition treatment formed a protective coating on the surface of the mortar, which increased the resistance of the mortar samples to carbonization, chloride penetration, freezing and thawing [12]. Bacterial mineralization can produce calcium carbonate, which is an environmentally friendly technology that operates under mild conditions and can be used to reinforce and consolidate soil/sand, protect and repair the stone and concrete structures. The application of bacterial mineralized calcium carbonate as a protective coating on stone cultural relics is feasible, but the bacterial mineralization method is complicated to operate. Additionally, the cost is high and it is difficult to apply outdoors.
Recent studies have shown that the reaction process can be controlled by adding a surfactant to synthesize different crystal forms of calcium carbonate. As an example, Chen Zhiying et al. studied the effects of sodium dodecyl sulfate (SDS), an anionic surfactant, on the crystallization of calcium carbonate. The results showed that when the SDS concentration was controlled at 0.5 mM, agglomerated rod-shaped aragonite could be obtained. When the SDS concentration was 1 mM, pure vaterite with a novel flower-like morphology could be obtained, and when the SDS concentration was increased to 2.5 mM, it formed a mixture of vaterite and calcite [13]. Li et al. synthesized a three-dimensional vaterite self-supporting film by a simple gas diffusion method, under the action of polyvinyl alcohol (PVA) [14]. Guo et al. synthesized aragonite calcium carbonate with complex morphology by homogeneous precipitation method under the action of polyvinylpyrrolidone (PVP). The morphology and structure of calcium carbonate particles were characterized by Scanning Electron Microscopy, X-ray diffraction, and Fourier Transform Infrared Absorption Spectroscopy (SEM, XRD and FTIR). The results show that the calcium carbonate particles are mainly aragonite, with rod-like, bouquet-like and dumbbell-like shapes [15]. Naoyuki Kubo et al. used polyvinyl alcohol (PVA) as a template, and calcite calcium carbonate was biomimetically synthesized at room temperature [16]. Il Won Kim et al. studied the effects of different degrees of hydrolysis and different contents of polyvinyl alcohol on the crystal form and morphology of calcium carbonate. The results showed that, by adjusting the degree of hydrolysis of polyvinyl alcohol, the content could produce vaterite with different crystal forms. When the content of polyvinyl alcohol was higher, more vaterite could be formed. Additionally, they showed that less PVA could be used to form aragonite, and the vaterite still existed [17].
In Supplementary Materials, we used orthogonal experiments to select different active agents (polyvinyl alcohol-PVA; polyvinylpyrrolidone-PVP; sodium lauryl sulfate-SDS) to prepare the calcium carbonate as shown in Table S1, and Table S2 is the specific scheme of the orthogonal experiment. The XRD diffraction pattern of the sample obtained by the orthogonal experiment is shown in Figure S1. According to the mole fraction of different crystal forms as the inspection index, and the results are shown in Table S3, and range analysis of the evaluation indexes aragonite mole fraction is shown in Table S4, and range analysis of the evaluation indexes vaterite mole fraction is shown in Table S5. Using range analysis to study effect of factors in different levels on difference crystal form as shown in Figure S2, the greater the range, the greater the impact, and the optimal level for the preparation of aragonite and vaterite crystal form calcium carbonate corresponds to the maximum range of factor levels. We were able to use the surfactant to control the crystallization process of calcium carbonate, and to directly deposit different crystal types of calcium carbonate on the surface of the sandstone as a protective layer. XRD, IR, SEM and other methods were used to characterize the structure and performance of calcium carbonate powder samples, with special attention paid to the influence of calcium carbonate protective film on the permeability, water absorption and weather resistance of the sandstone surface. Compared with traditional bacterial mineralization technology, the method we used in this article was more convenient to operate, more able to control the crystal form of calcium carbonate, was low cost, and showed a strong protective effect.

2. Materials and Methods

2.1. Materials

In this study, we chose the following analytical reagents (purity over 99.7%): calcium chloride (CaCl2; Aladdin, Waukesha, WI, USA), sodium carbonate (Na2CO3; Aladdin), anhydrous ethanol (C2H5OH; Aladdin), deionized water (H2O; laboratory-made), anhydrous sodium sulfate (Na2SO4; Aladdin), polyvinyl alcohol (PVA; Aladdin), and polyvinylpyrrolidone (PVP; Aladdin).
We used sandstone, purchased from Guizhou province of China, to evaluate the protective effect of materials. We use X-ray diffraction to analyze the rock composition, among which the maximum content of quartz was 98.5% and potassium feldspar content was 1.5%. All samples were sliced 5 cm in length and width and 3 cm in height.

2.2. Stone Treatment

The sandstone surface was washed with running water to remove the dust. It was then dried in a vacuum drying oven to remove water, weighed every 6 h until the mass change was less than 0.1 g, and soaked in ethanol for several h. The samples were taken out and then dried in the air. At room temperature, the stock solution of the CaCl2 and Na2CO3 reactants were prepared to a concentration of 0.05 mol/L, with water was as solvent. According to Supplementary Materials, for preparing aragonite calcium carbonate and vaterite calcium carbonate, the sandstone surface was treated under the same conditions.
Figure 1 shows the flow chart of the stone treatment experiment. The stone processing steps were as follow: first, a certain amount of PVP was added to calcium chloride solution, then stirred to dissolve. The concentration of the surfactant was 4 g/L. After 6 h of action, the saturated calcium chloride containing the surfactant PVP was added dropwise to the washed stone. It naturally appeared on the surface of the stone, after which saturated sodium carbonate solution was added dropwise at a rate of 1 mL/min. A protective film of aragonite calcium carbonate formed, which gradually thickened over 5 repeated operations. This operation was repeated on each face of the sandstone and the entire sandstone was covered by the coating material. Then, a certain amount of PVA was added to saturated calcium chloride, the surfactant was stirred and dissolved at a concentration of 4 g/L. After 6 h of action, saturated calcium chloride containing the surfactant PVA was added to the washed stone and allowed to flow naturally on the surface. Then, we added saturated sodium carbonate solution dropwise at a speed of 5 mL/min. A protective film of vaterite calcium carbonate was formed, and the film gradually thickened after 5 repeated operations. This operation was repeated on each face of sandstone and the entire sandstone was covered by the coating material. All samples were dried under the same conditions for 24 h. The untreated blank sandstone sample was denoted as B, the treatment of aragonite crystalline calcium carbonate was denoted as A, and the treatment of vaterite crystalline calcium carbonate was denoted as V, as shown in Table 1.
We prepared suspensions of different crystal forms of calcium carbonate under the same conditions, washed with deionized water and filtered 3 to 5 times, dried in a vacuum drying oven at 60 °C for 24 h, and secondarily fully ground to make powder samples.

2.3. Characterization of Calcium Carbonate Powders and Stone Samples

We used X-ray diffraction (XRD) (Rigaku, D/Max-3B, Tokyo, Japan) under the following measurement conditions: Cu radiation, 20°–80° 2θ exploration range, steps of 1°/min. Fourier Transform Infrared Absorption Spectroscopy (FTIR, PerkinElmer, Waltham, MA, USA) was used to analyze the structure of powder samples. The prepared samples were pressed and KBr at a mass ratio of 1:400, the test range was 500–4000 cm−1, and the resolution was 4 cm−1. The sample was scanned repeatedly a total of 32 times. Scanning Electron Microscopy (SEM) ((FEI), Nova Nano SEM 450, Hillsboro, OR, USA) was used to observe the surface microtopography, and a Nano Measurer calculated the average grain size of nanoparticles. To obtain information about calcium carbonate penetration in the sample, Energy Dispersive Spectroscopy (EDS, Hillsboro, OR, USA) microscopic analysis was performed. All SEM-EDS analyses were performed under 20 kV acceleration voltage and low vacuum conditions (10−3 pressure). Detection conditions: Before SEM characterization, calcium carbonate particles were coated with a thin layer of gold (about 5 nanometers) using a high-resolution sputtering coating. A WBD-1B digital whiteness meter (Jinjia Scientific Instrument Co., Ltd., Shanghai, China) was used to test the color change of the sample surface. Tests were carried out at room temperature, and the surface of the sample was flat when viewed with the naked eye. The mercury intrusion experiment was completed on the AutoPore V 9600 mercury intrusion instrument (McMuritik Instruments Co., Ltd., Shanghai, China); the temperature was 25 °C, the relative humidity was 35%–50%, the range mercury intrusion pressure was 0.1–61,000 Pa. Before the mercury intrusion test, all samples were crushed and sieved to a size of 1 cm, with a mass of approximately 2–3 g. The samples were placed in a remote drying oven and placed at 60–80 °C for 24 h, and then tested.

2.4. Test of Stone Surface Color Change

After cultural relics are processed, the surface cannot show obvious color changes that destroy their integrity. In many cases, color changes on the surface cannot be observed with the naked eye and must be tested with the aid of an instrument. In this paper, a WBD-1b digital whiteness meter was used to measure the total color difference and evaluate color change. The test principle was the same as the fluorescent whiteness meter, but the result obtained was the total color difference of the surface. First, we used a ceramic whiteboard for baseline calibration to ensure the accuracy of the measurement results. The surface of the sample was kept flat, without cracks, and the sample was removed and placed on the automatic whiteness meter for testing. Using the CIE La*b* color space, the total color difference (ΔE✗) was used to evaluate the color change of sandstone samples before and after processing. The calculation formula of the total color difference ΔE* is as follows [18]:
Δ E = L L 0 2 + a a 0 2 + b b 0 2
where L 0 , a 0 and b 0 are the blank sandstone sample CIE La*b* coordinates, and L , a and b are the coordinates of pf-treated sandstone samples. Each sample was tested 3 times before and after treatment.

2.5. Protection Performance of the Stone Coatings P

In order to analyze the protective performance of the protective materials, according to the requirements of JC/T973-2005 [19], we tested the water vapor permeability, weather resistance, and water absorption of the sandstone surface before and after treatment.

2.5.1. Test of Water Absorption

The water absorption test measured changes in the weight of the water absorbed by the sandstone samples immersed in distilled water after treatment. In detail: first, the stone samples were measured as M0 (g), and then immersed in distilled water for 48 h. Then, the samples were removed and their weight was recorded as M1 (g). The calculation of the water absorption ∆M (%) is shown below:
Δ M = M 1 M 0 M 0 × 100 %
Counting every calculation of the samples data as a cycle, this experiment was repeated until the mass change is less than 0.1%.

2.5.2. Test of Water Vapor Permeability

Our water vapor test steps were as follows: first, we poured 300 mL of water into a glass, placed the sandstone samples at the top of the glass and sealed the seam with glass glue. The water vapor permeability test experimental device is shown in Figure 2. We used conical flasks of the same caliber for testing, and used glue to firmly attach the interface to prevent water from evaporating from the interface. In the beginning, the water level in all bottles was the same. As shown in Figure 2, B corresponded to untreated sandstone, while A corresponded to sandstone treated with aragonite calcium carbonate coating and V corresponded to sandstone treated with vaterite calcium carbonate coating. Then, we recorded the initial weight as M0 (g) and kept the system at room temperature for 24 h. Finally, we recorded the final weight as M1 (g). The calculation of the water vapor permeability of the samples was supported by the formula below:
M = M0M1
Counting every calculation of the samples data as a cycle, we weighed it every 24 h until the mass loss was less than 0.1 g.

2.5.3. Contact Angle Test

We used a contact angle meter (SDC-100, Shengding Precision Instrument Co., Ltd., Dongguan City, China) to test the static contact angle of sandstone samples. The test result was obtained by taking an average of 5 measurements. According to the national standard [19], the wettability can be divided into the following grades, as shown in Table 2 [20]:

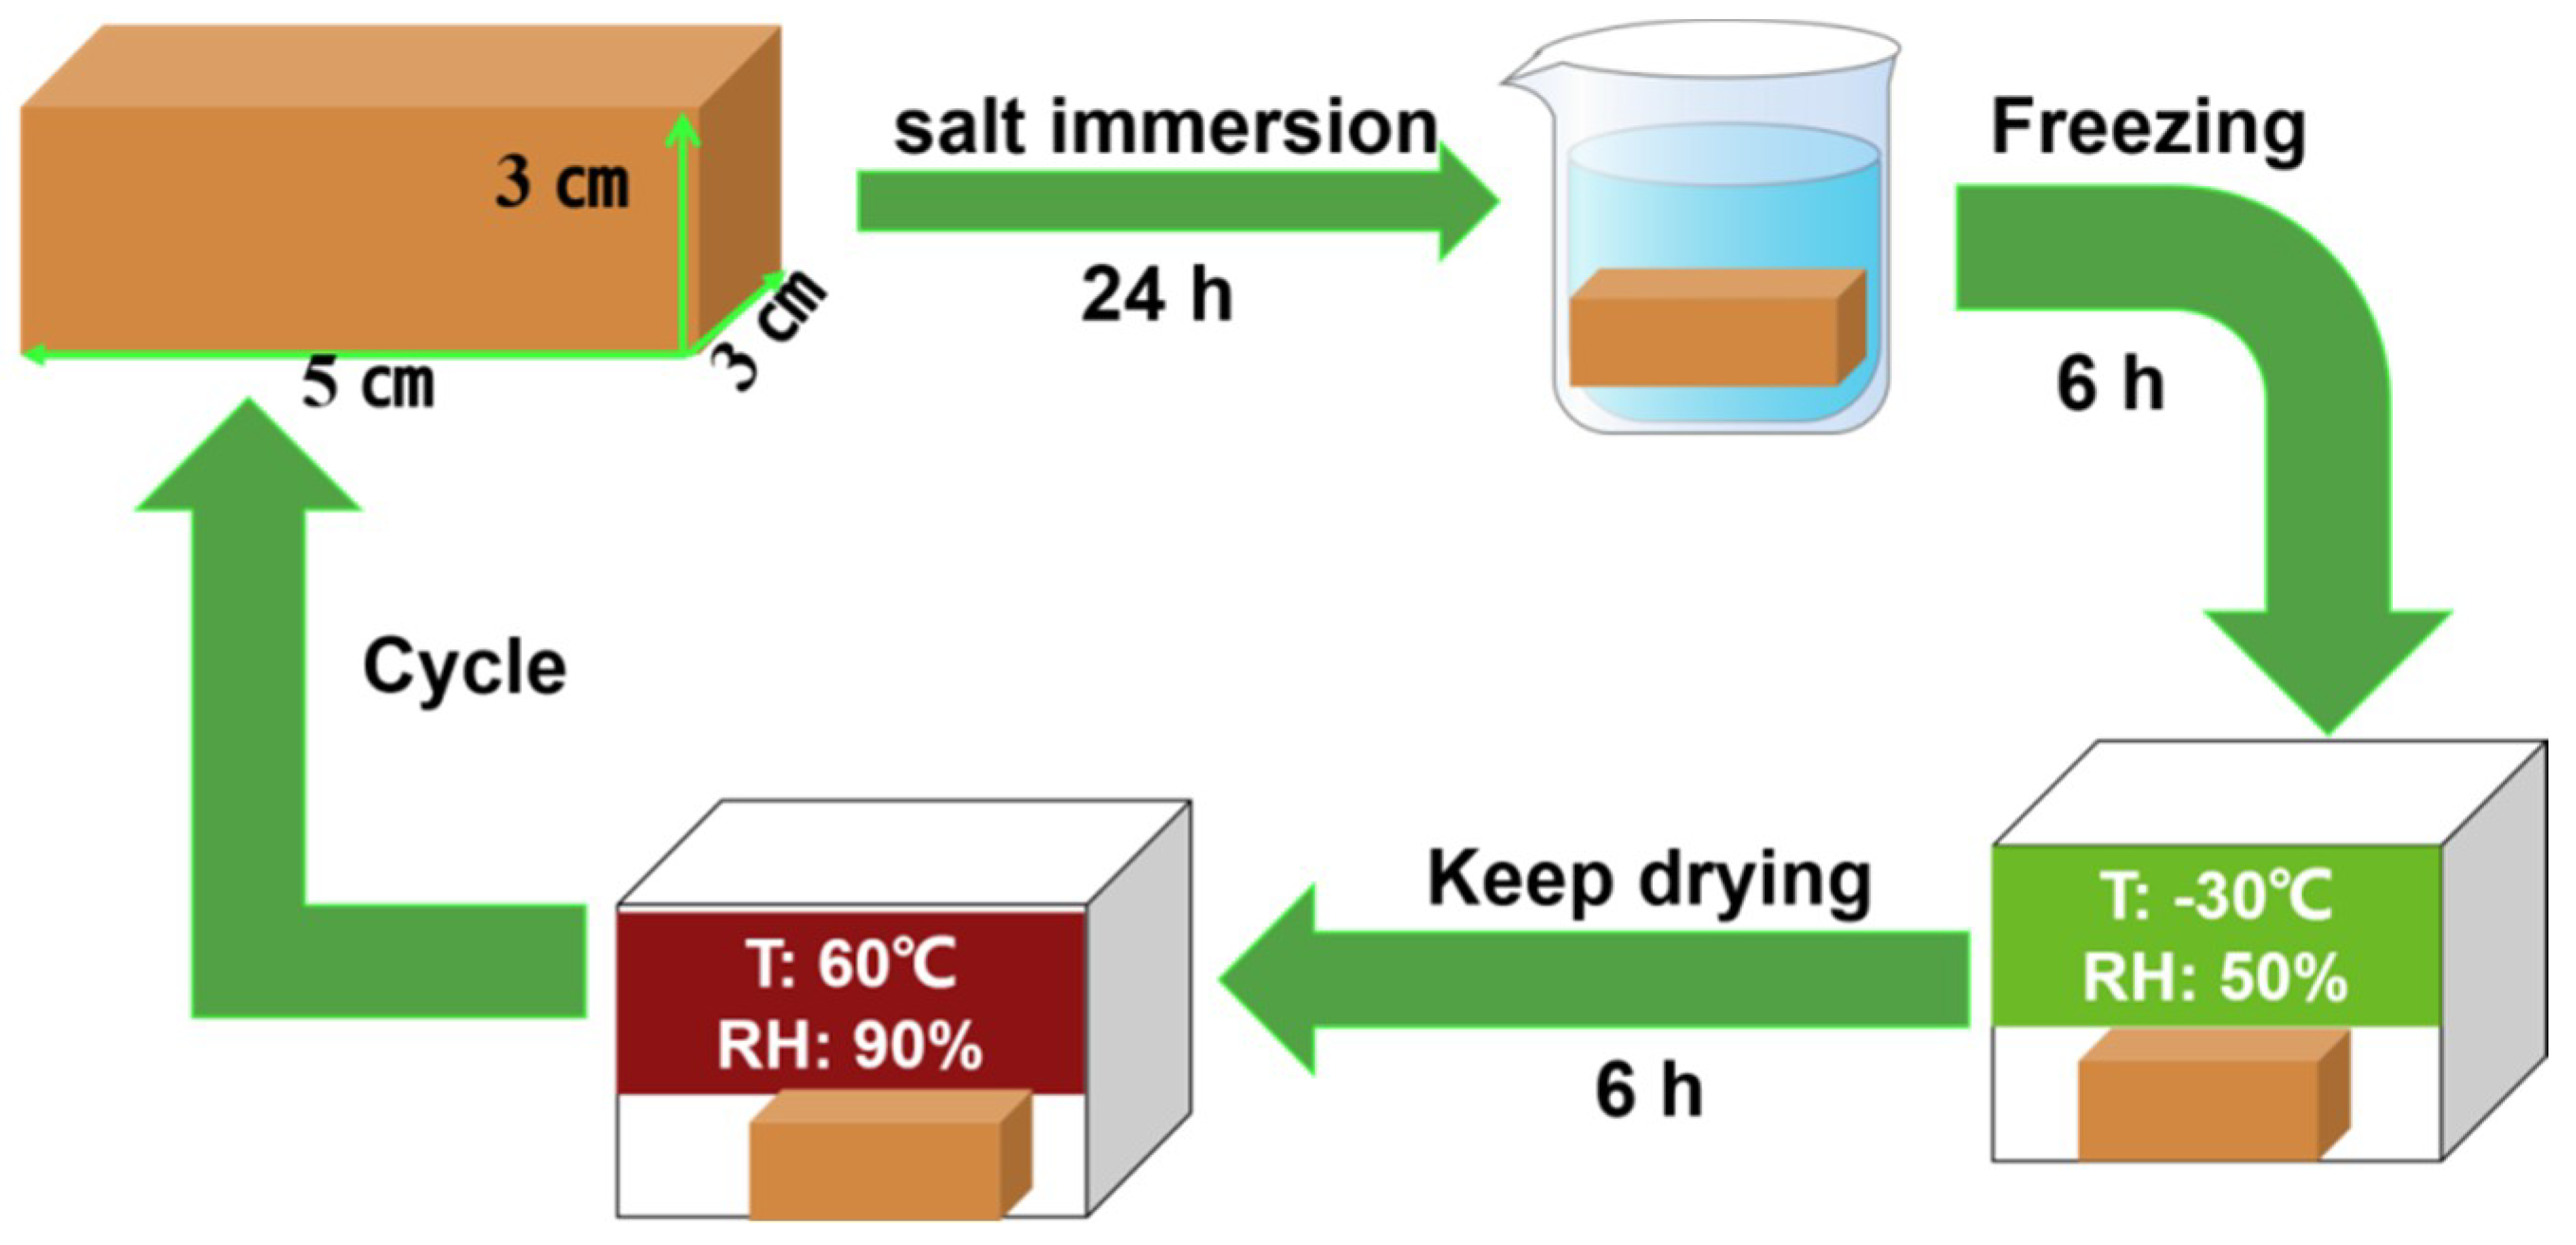
2.5.4. Test of Weather Resistance

Figure 3 shows the weather resistance cycle steps. First, we recorded the initial weight of the sandstone sample as M0 (g), soaked the sample in 0.5 M Na2SO4 solution for 24 h, wiped off the surface moisture, and froze it at −30 °C for 6 h. Then, we removed it and placed it at room temperature and, finally, put it in a vacuum drying oven, dried it at 60 °C for 6 h, recorded the final weight as M1 (g), using Formula (2) to calculate the quality change in weather-resistant stone [21]. From the first cycle to the last, the weathered appearance and the quality loss of the aged sandstone samples were recorded until their surfaces began to fall off.

3. Results and Discussion

3.1. Characterization and Analysis of Powder Samples

In order to easily analyze the structure of materials (and of calcium carbonate powders, which were directly precipitated by the same precursor solutions instead of the film on the stone) we used XRD, IR and SEM.

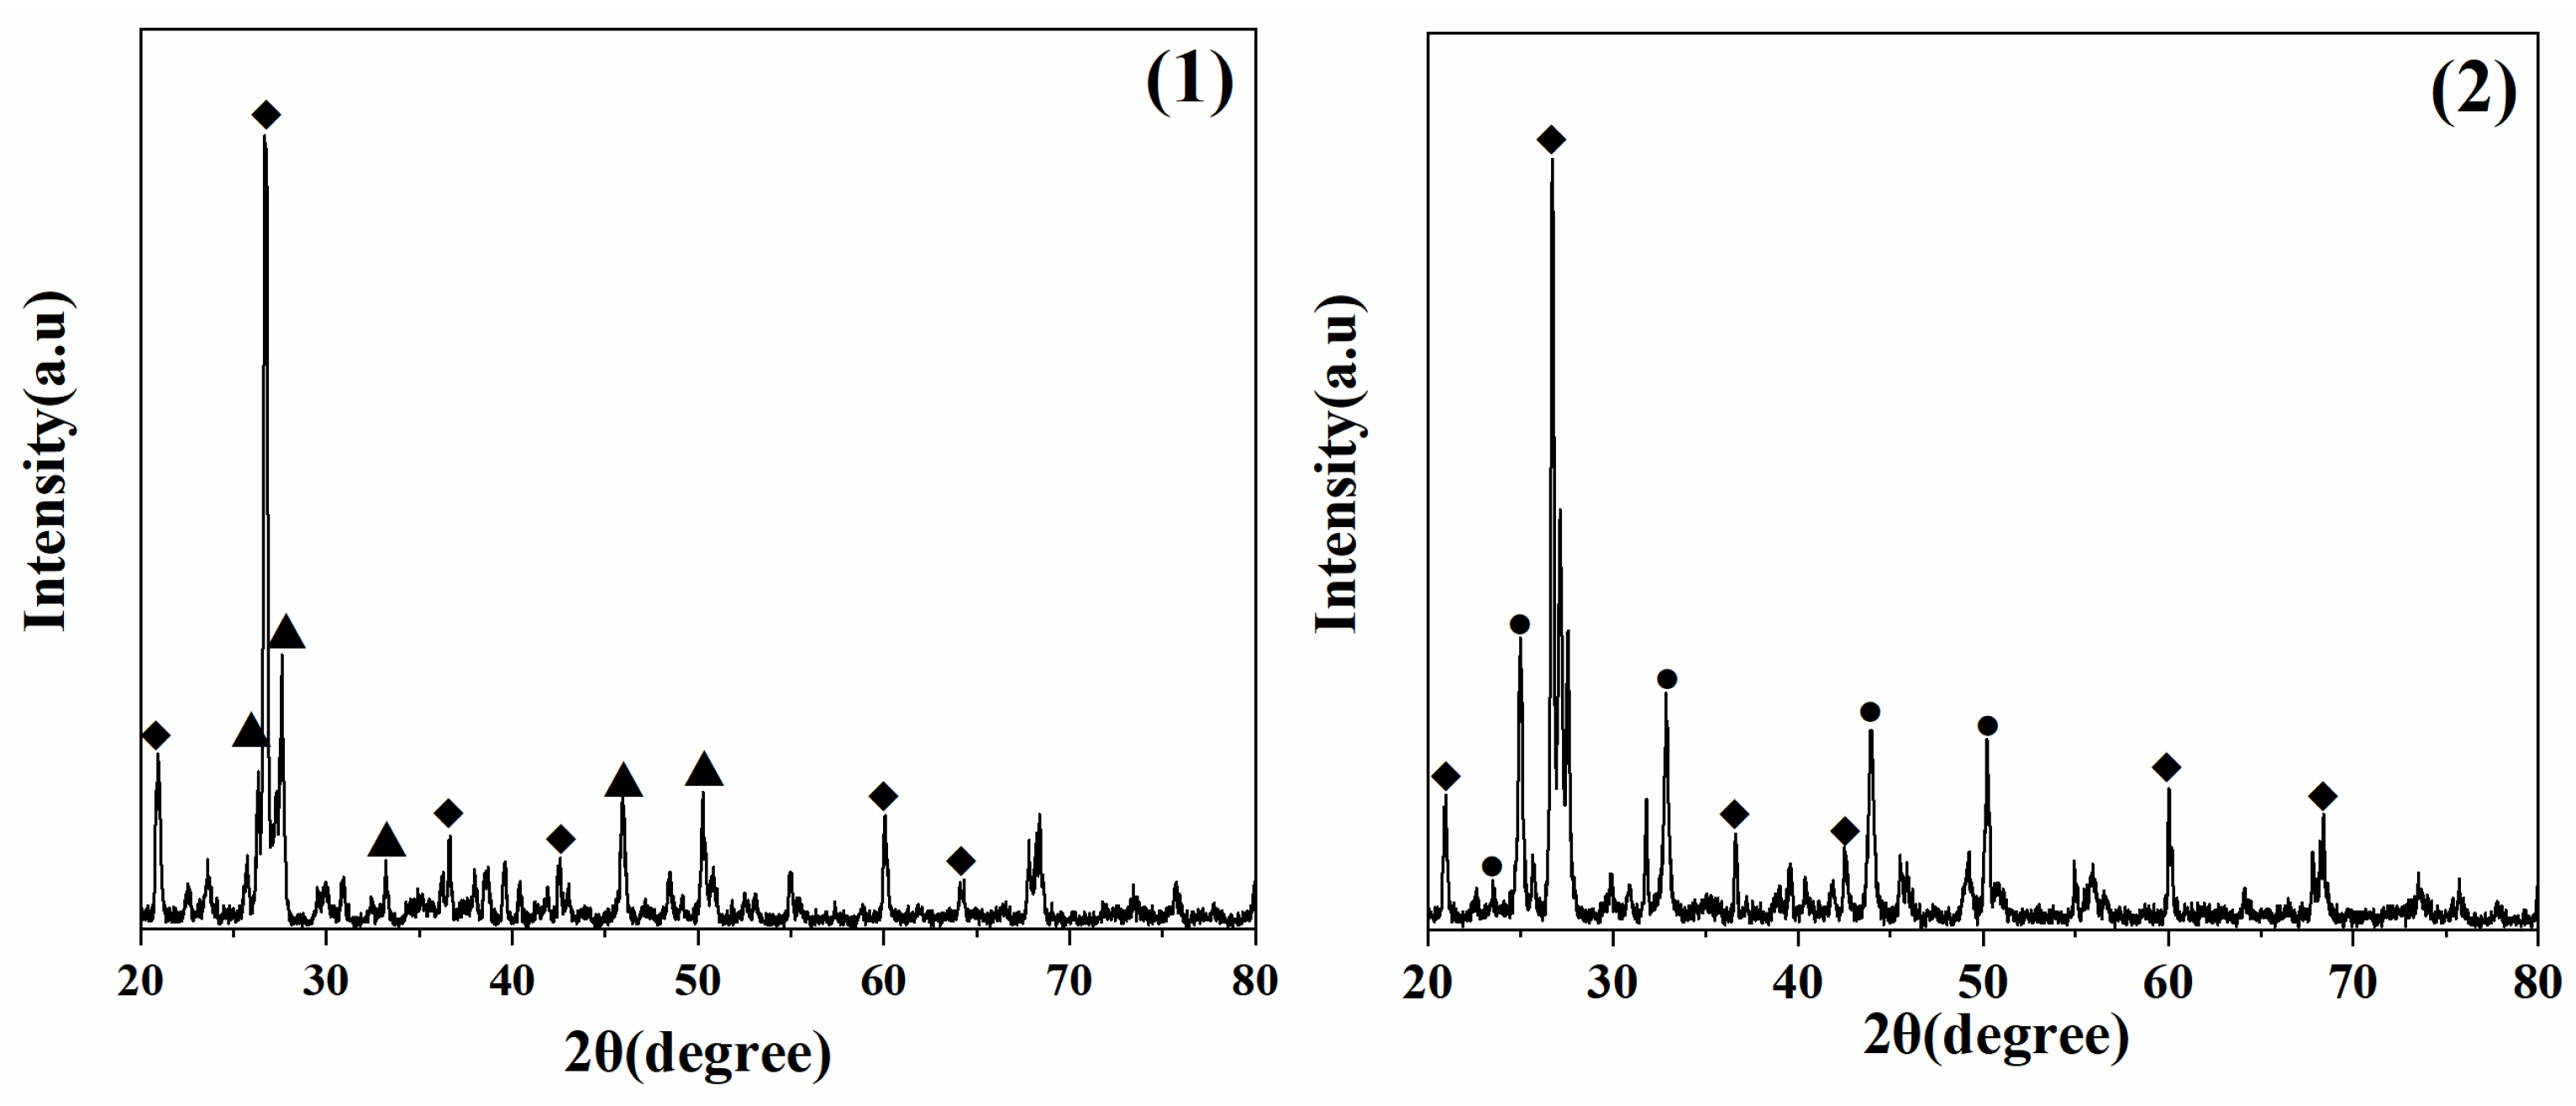
3.1.1. X-ray Analysis

Figure 4 shows the XRD diffraction spectra of calcium carbonate powder samples; as shown in the figure, 2θ = 26.3°, 27.3°, 33.1°, 36.3°, 37.9°, 38.5°, 42.9°, 45.9° and 48.4° [22], which corresponded to (111), (021), (012), (102), (112), (130), (122), (221) and (202) crystal planes of aragonite as shown in Table 3, respectively. The sharp peak shape and the lack of miscellaneous peaks in the figure indicated high crystallinity and high crystal purity. The peak’s shape corresponded with PDF 76-0606. The characteristic peak of vaterite was located at 2θ = 21.0°, 25.0°, 27.1°, 32.8°, 43.8°, 49.1°, 49.9° and 55.7° [23], which corresponded to (002), (100), (101), (102), (110), (112), (104) and (202) crystal planes of vaterite respectively as shown in Table 3. According to the Scherrer formula, the half-height width of the diffraction peak was narrow, the average crystal grain size was small, the crystal purity was high, and there was no impurity peak. The peak shape corresponded to PDF 72-0506.

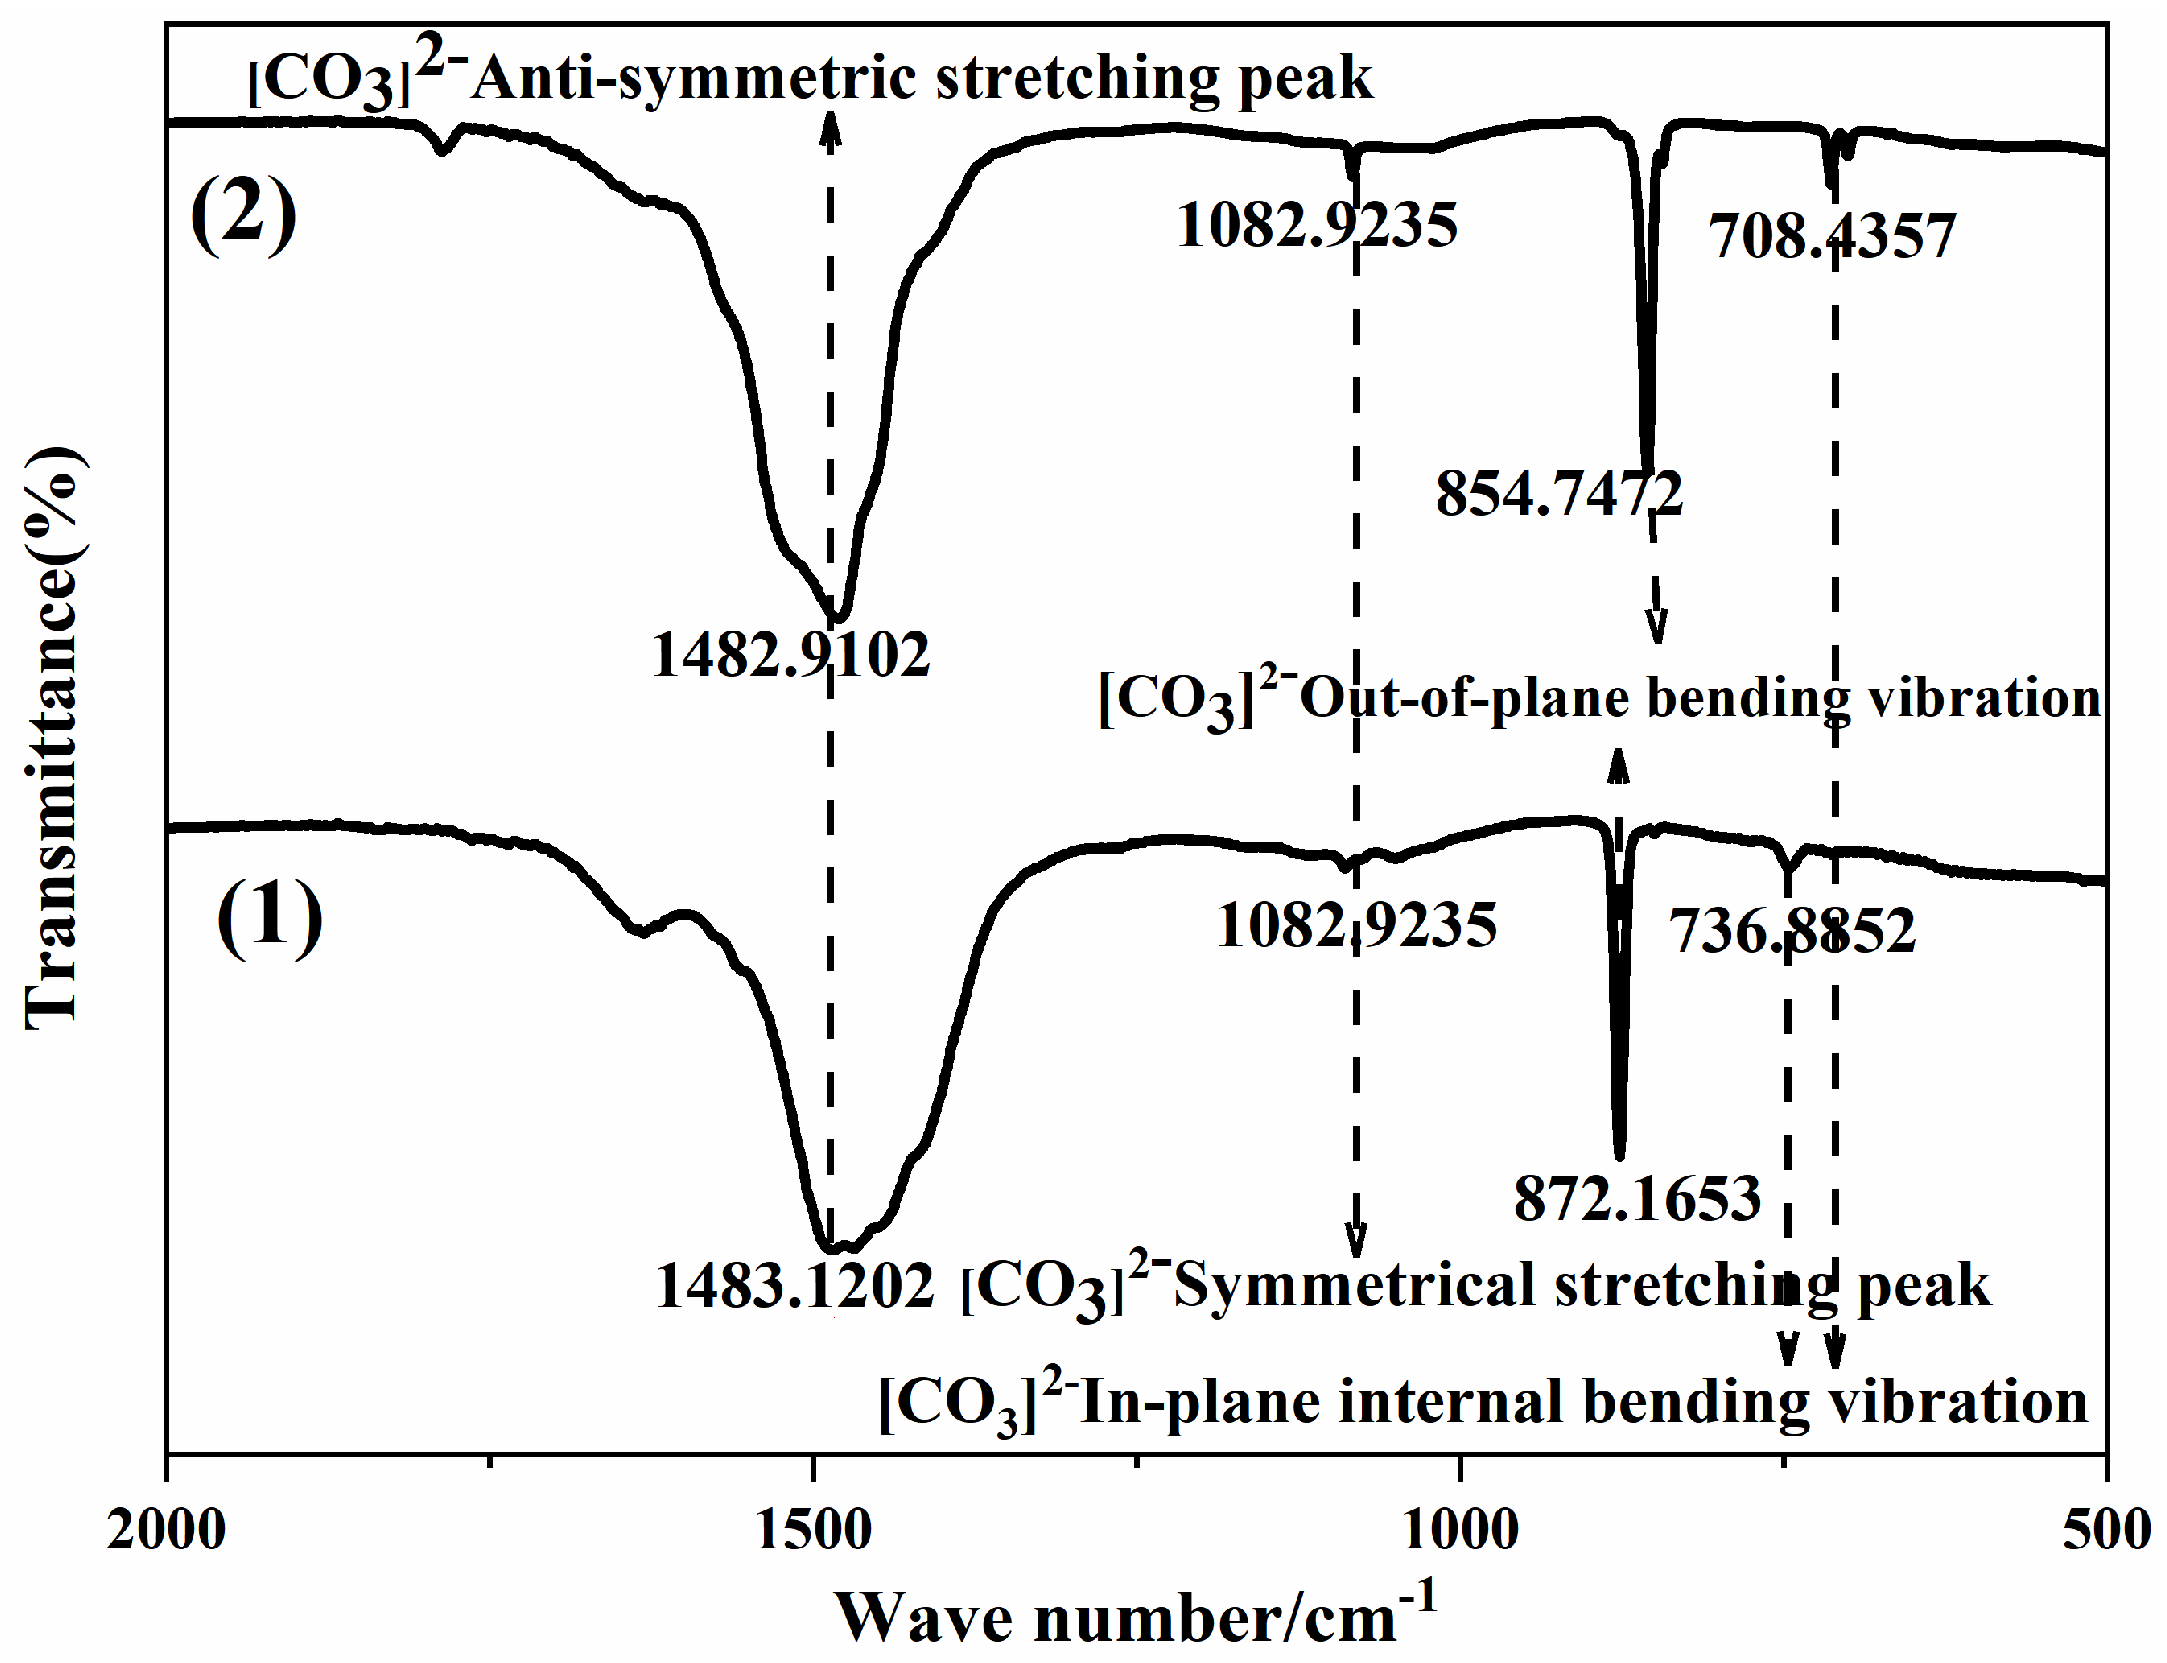
3.1.2. Fourier Transform Infrared Absorption Spectrum Analysis

Figure 5 shows infrared absorption spectra of calcium carbonate powder samples. We observed that the characteristic absorption peaks belonging to the aragonite had strong absorption bands at 1082, 872, and 736 cm−1, due to the stretching of carbonate (v1 model), the bending vibration out of the plane (v2 model), and the in-plane bending vibration (v4 model) [24]. The infrared absorption spectra of three crystal forms of calcium carbonate contained the plane bending vibration (v2 mode), but their positions were different. The characteristic absorption peak of vaterite appeared near 855 cm−1. The plane bending vibration positions of aragonite and calcite were very close and appeared near 875 cm−1 [25]. The characteristic absorption peaks of vaterite were located at 1082, 854 and 708 cm−1 respectively. They were caused by the bending vibration out of the plane, the symmetrical carbonate stretching, and the bending of the aragonite inplane. Additionally, the two curves exhibited carbonate anti-symmetric stretching and shrinking vibrations at the 1492 cm−1 peak, which was consistent with XRD test results. There was no functional group related to the surfactant in the infrared absorption spectrum because the surfactant was removed by deionized water during the washing process.

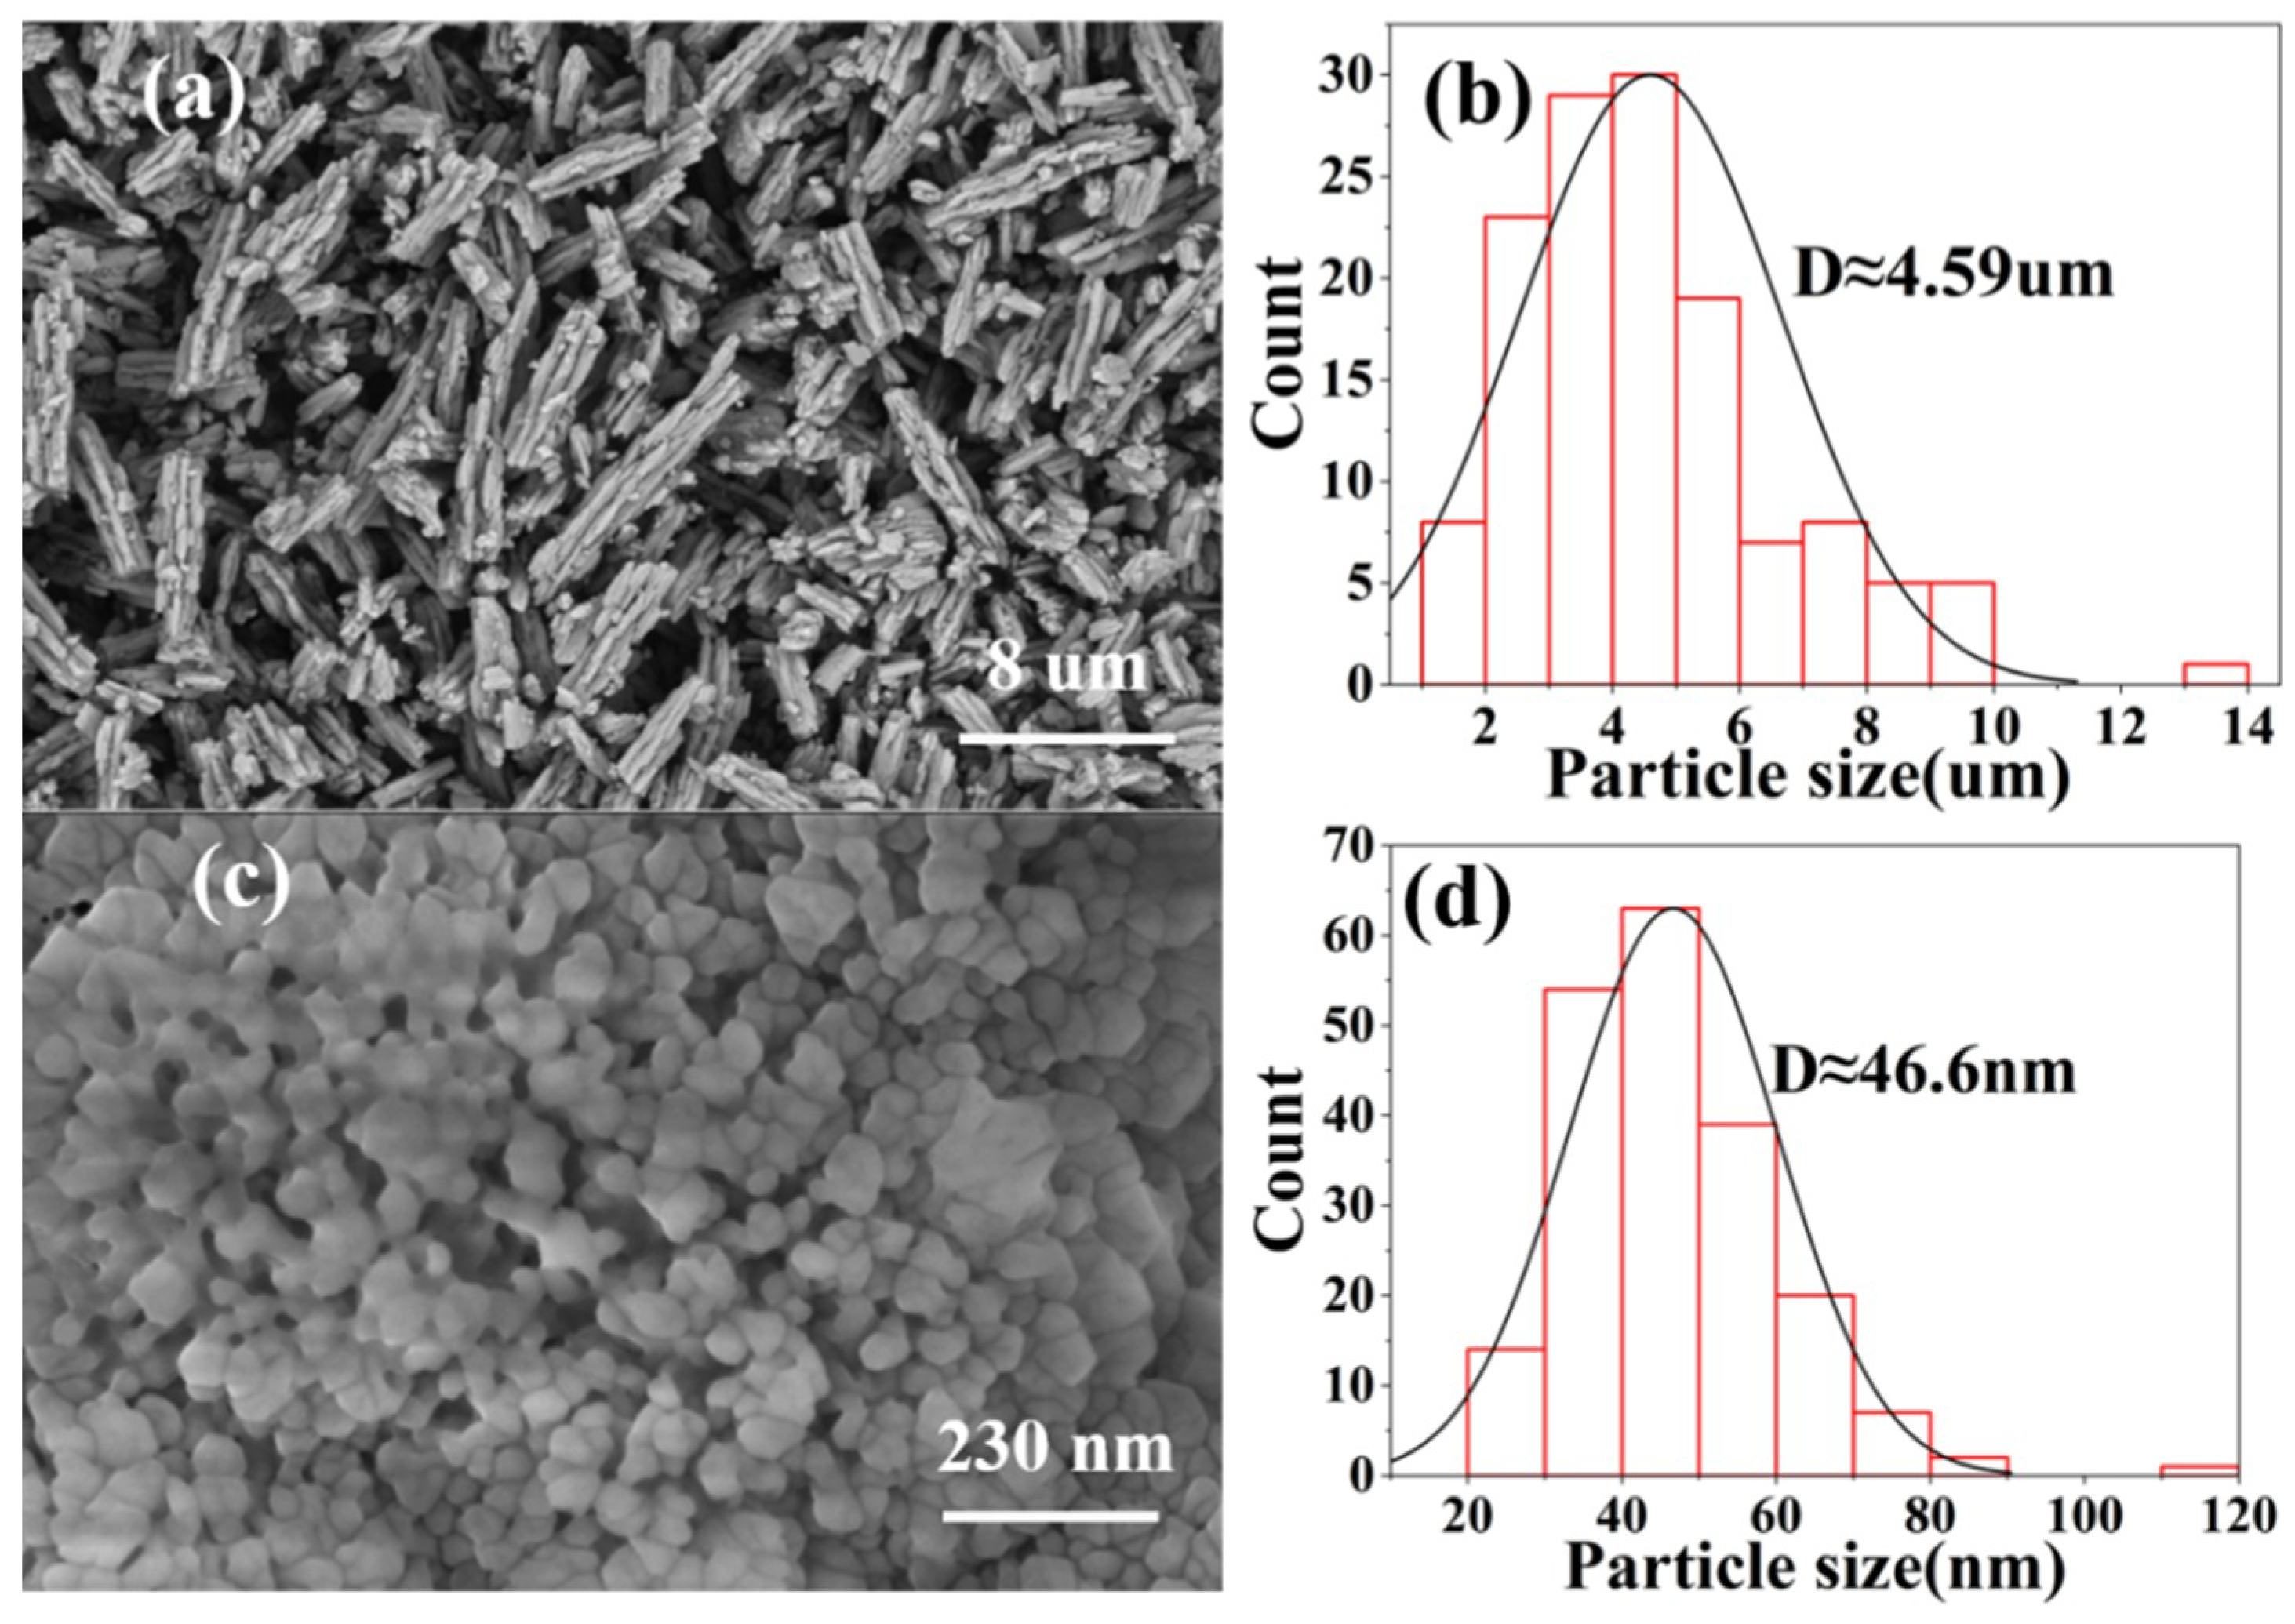
3.1.3. Scanning−Electron Microscopic Analysis

Figure 6 shows the morphology of calcium carbonate powder samples. As shown in Figure 6a, we observed that the aragonite crystal type calcium carbonate was rod-shaped and had a large aspect ratio, which was consistent with the literature [13]. We used the software Nano Measurer to calculate the particle size distribution in Figure 6b. According to the particle size distribution diagram, we noted that the average particle size of the aragonite crystal form was about 4 microns. The morphology of vaterite calcium carbonate is shown in Figure 6c; the small particle size led to serious agglomeration. According to the particle size distribution diagram in Figure 6d, the average particle size of the vaterite crystal form was about 46 nanometers. Irregular morphology may be caused by the rapid growth of a certain crystal plane or the influence of controlled formulations, consistent with literature records that the stretching of the surfactant PVA affects the nucleation rate and crystal growth direction of calcium carbonate [17]. The average particle size of vaterite was smaller than that of aragonite.

3.2. Characteristics and Properties of the Coatings on the Stone

3.2.1. X-ray Diffraction Analyses

Figure 7 shows the XRD pattern of the sandstone treated with calcium carbonate deposition. As shown in Figure 1, 2θ = 26.3°, 27.3°, 33.1°, 45.9°, 48.4°, which corresponded to (111), (021), (012), (221) and (202), crystal planes of aragonite, respectively, and the peak shape corresponded to the card PDF 76-0606. As shown in Figure 2, there were characteristic peaks of vaterite at 2θ = 21.1°, 24.9°, 27.1°, 32.8°, 43.9°, and 50.2°, corresponding to (002), (100), (101), (102), (110), (104) crystal planes, respectively, and the peak shape corresponded to the card PDF 72-0506. There were characteristic peaks of silica at 2θ = 20.9°, 26.7°, 36.6°, 42.5°, 60.1°, 68.2°, corresponding to (100), (011), (110), (200), (21-1), (21-2) crystal planes; the peak-shaped card corresponded to PDF 85-1054. In the stone samples, the peak content of calcium carbonate was lower, and the peak of the stone substrate was stronger, indicating that the protective film of calcium carbonate formed may have been weak.

3.2.2. Scanning Electron Microscopic Analysis

Figure 8 shows the surface morphology of the stone samples. As shown, the blank stone samples had a rough surface and high porosity. Additionally, as shown in Figure 8b, the surface porosity of the sandstone treated with aragonite calcium carbonate was reduced, but a large number of cracks were generated. This occurred due to the large particle size and low penetration of the aragonite particles within the substrate, (not only within the pores on the surface), with a consequent accumulation on the stone surface and a high thickness of the coatings leading to microcracks. The surface of the sandstone treated with vaterite was uniform and dense, without cracks, as shown in Figure 8c. This was because, according to the particle size distribution results, the vaterite had a small particle size and high permeability in the substrate, not only in the pores on the surface, but also on the surface without accumulation.

3.2.3. SEM/EDS Analysis

Figure 9 shows the SEM-EDS study on the penetration depth of calcium carbonate particles in stone. We used the red dashed line as the boundary. EDS was used to test the distribution of Ca2+ along different depths. Figure 10 shows the overall decline in calcium ion content. In the penetration depth of calcium carbonate particles test, we generated multiple areas of different depths and repeated the test three times to obtain the Ca2+ concentration. For aragonite calcium carbonate, due to the larger average particle size, the penetration depth was significantly reduced after 0.8 mm, as shown in Figure 10a. Due to its small average particle size and high solubility, the calcium ion content of vaterite calcium carbonate could still be detected at a distance of 3 mm from the surface, as shown in Figure 10b. The penetration depth of vaterite crystal form on the surface was deeper than that of aragonite crystal [26].

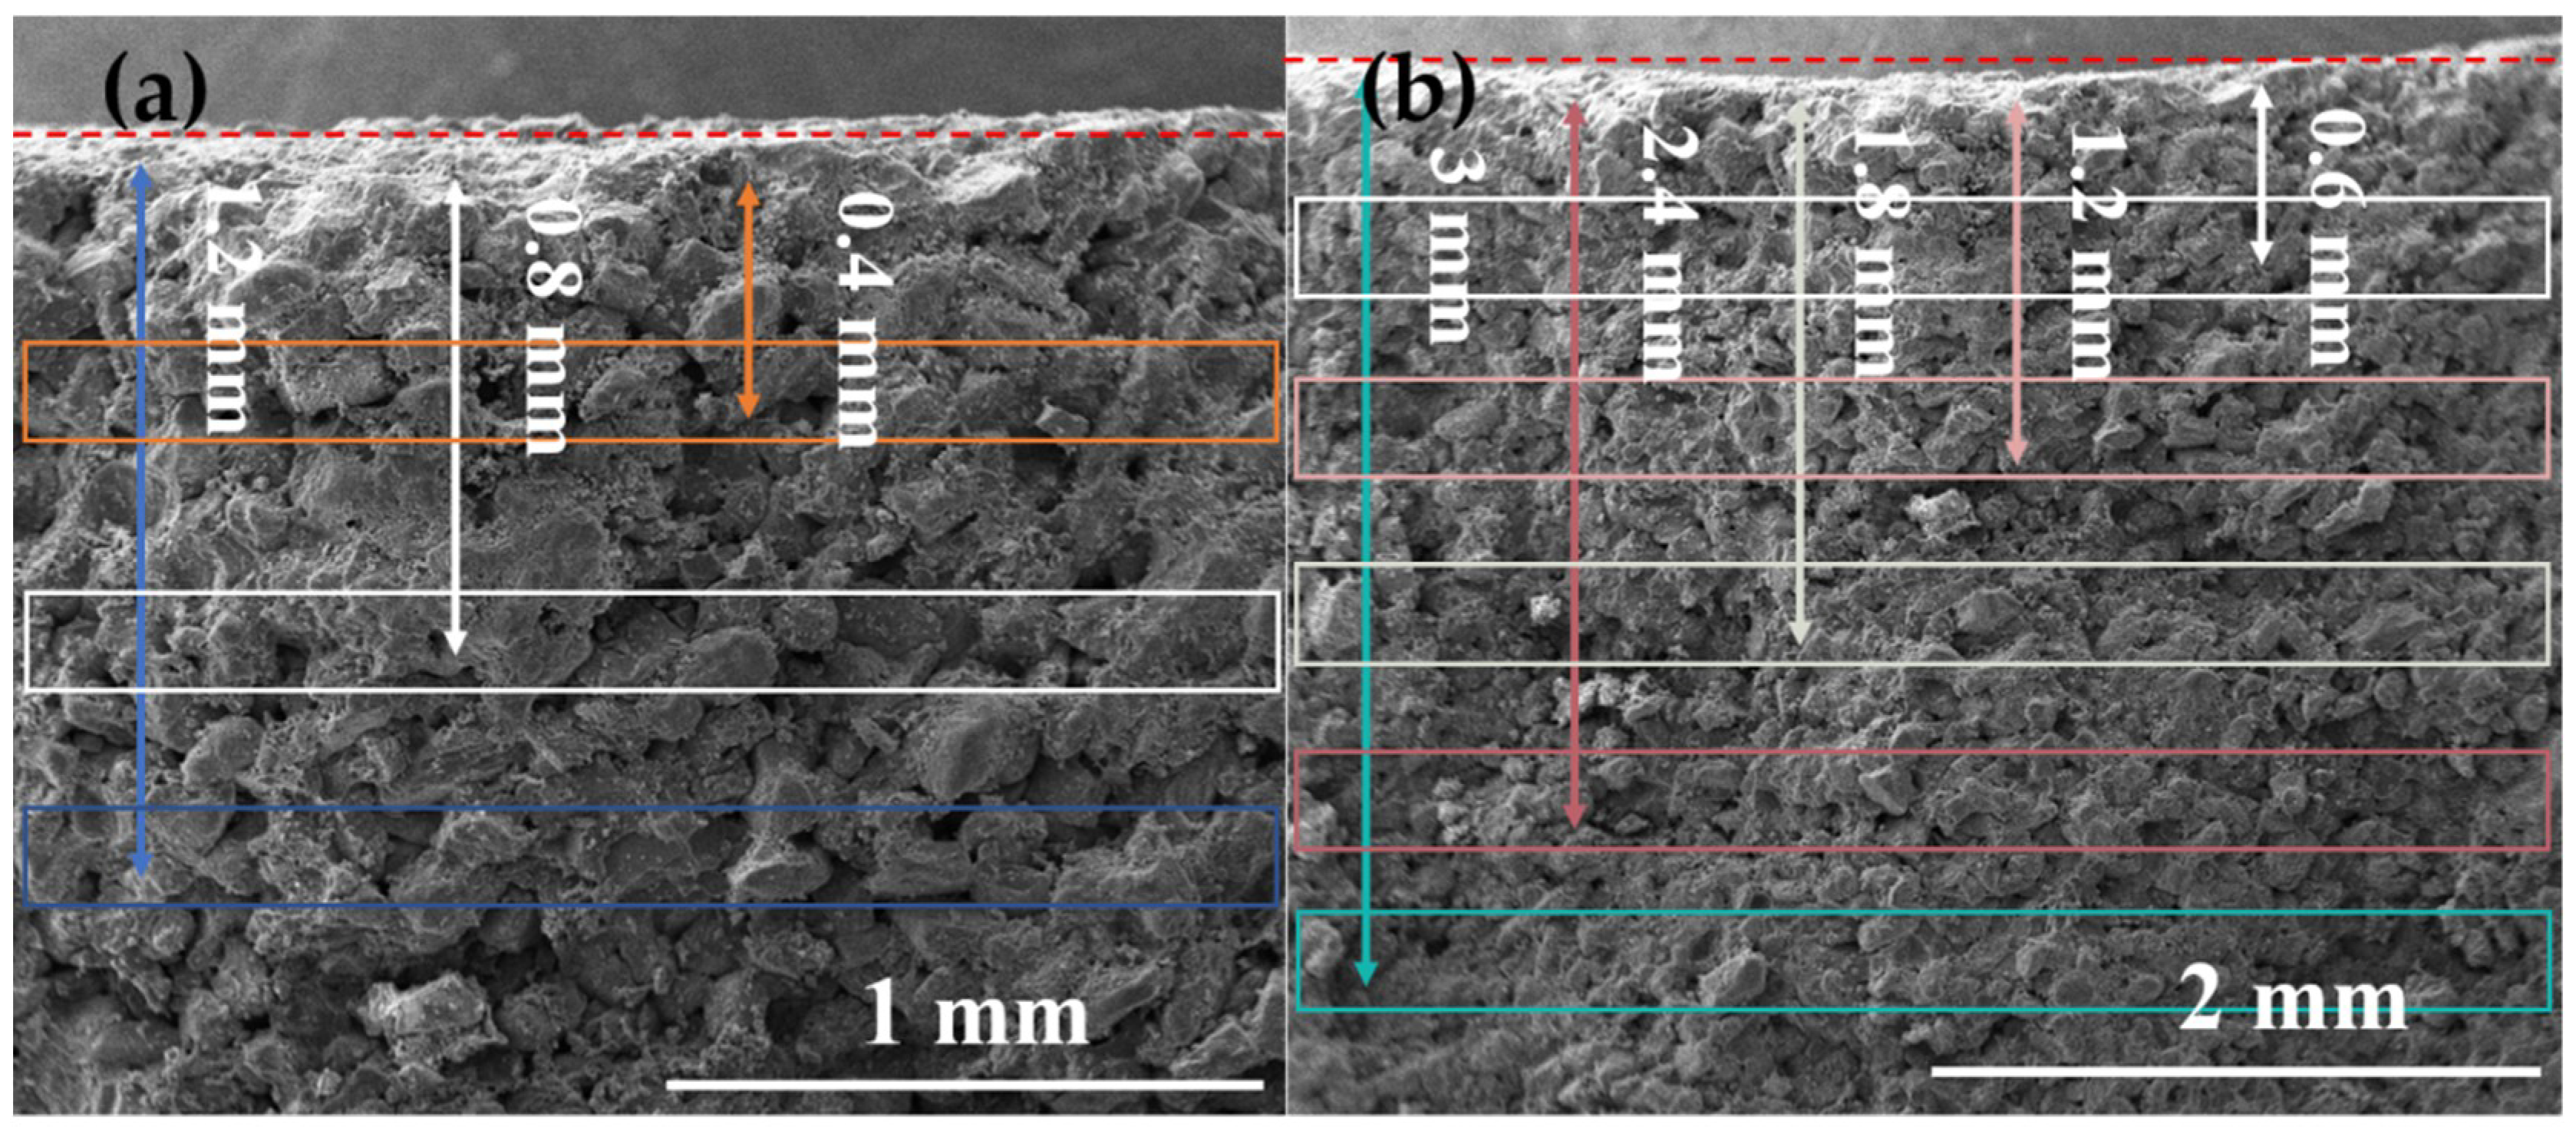
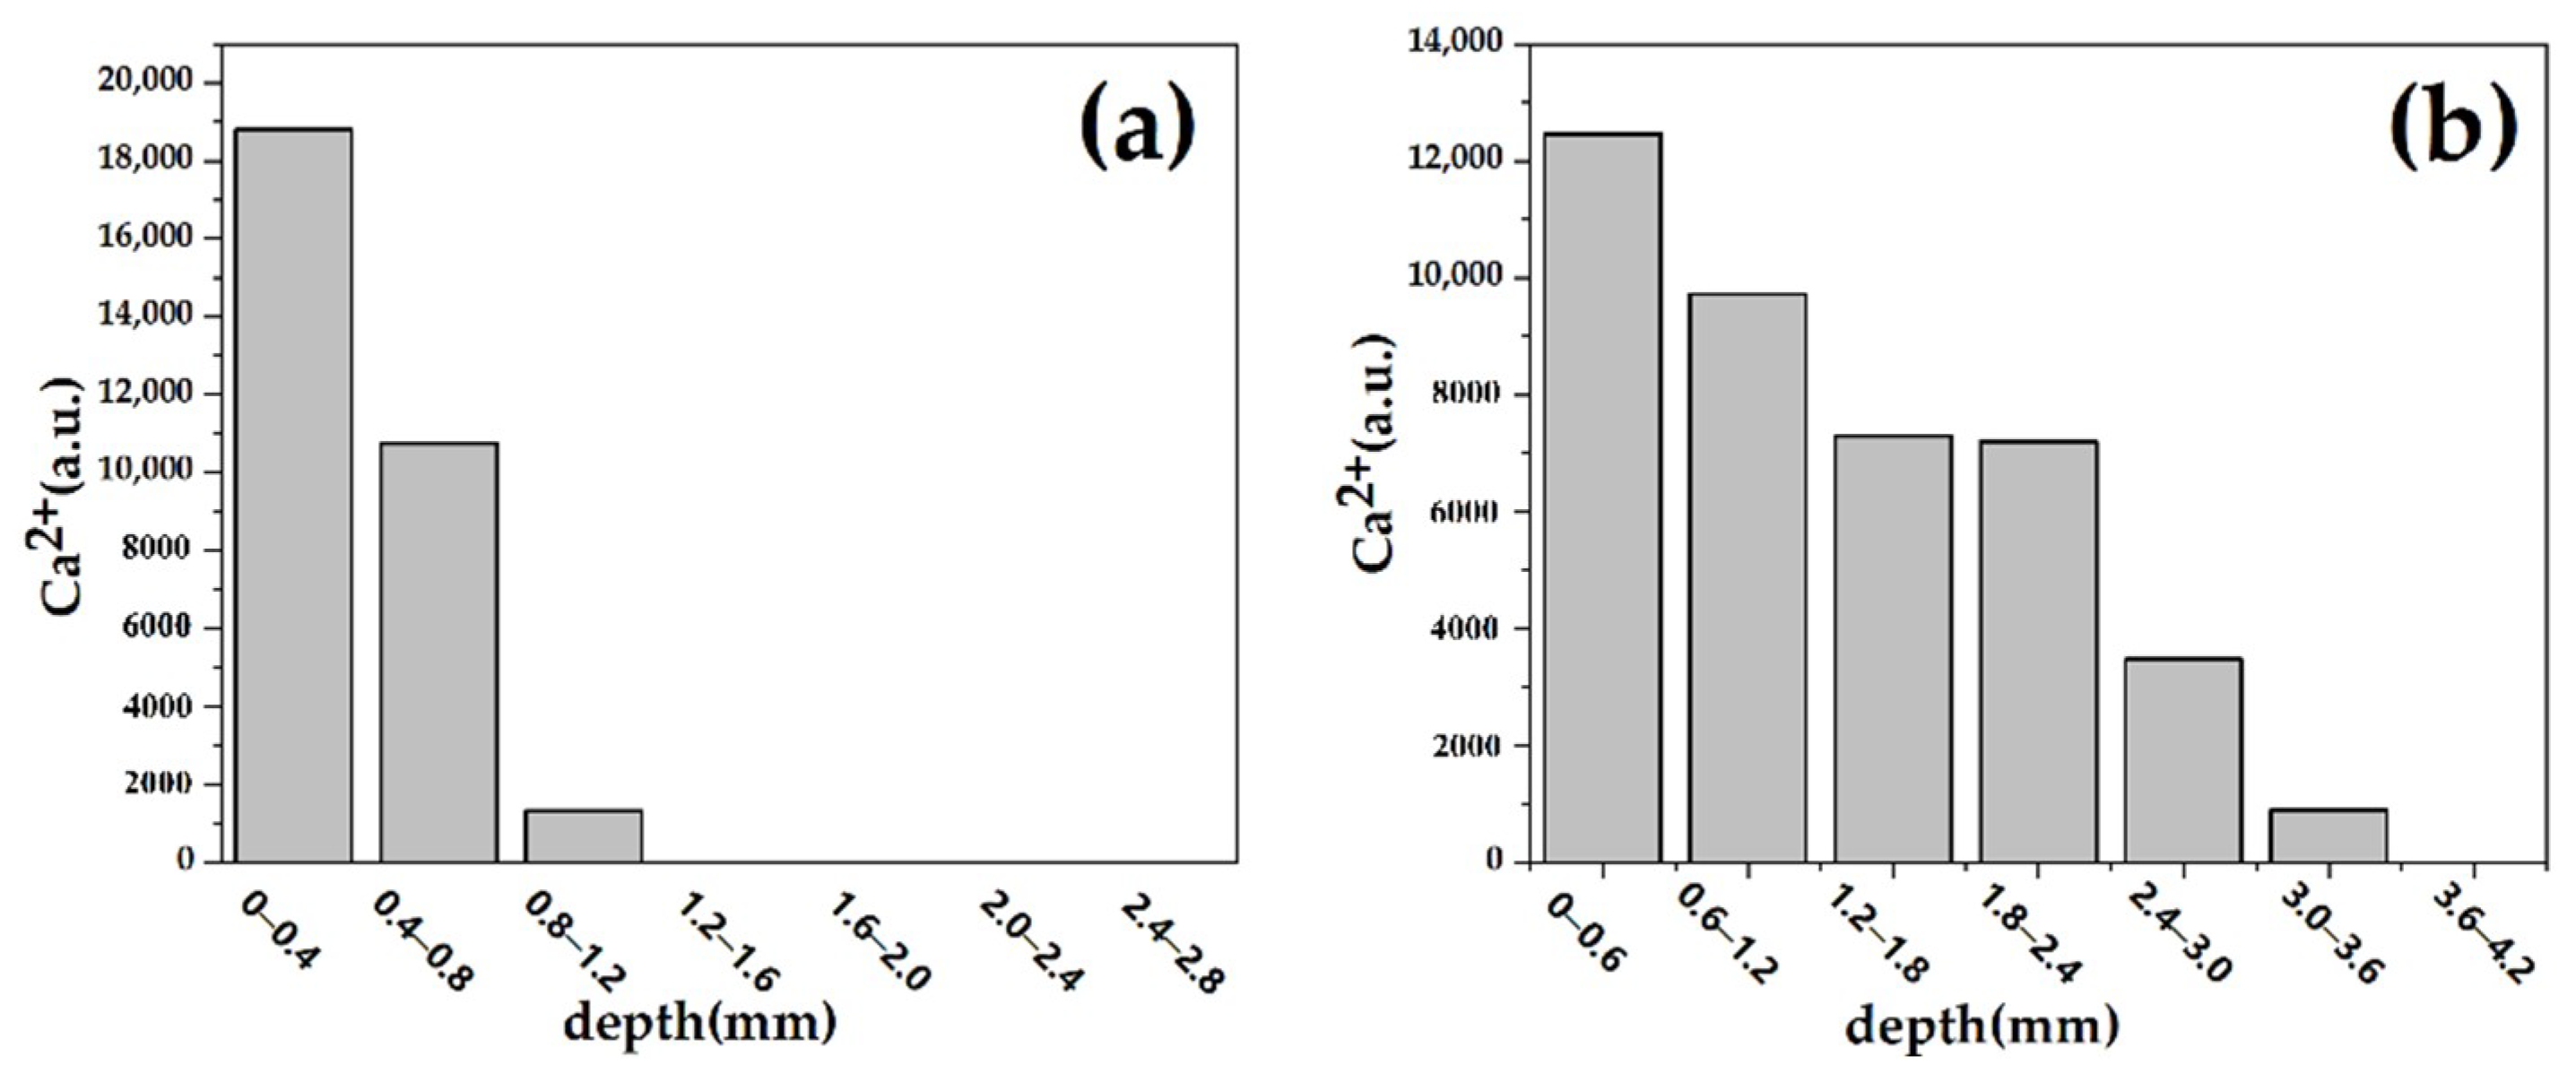
3.2.4. Sandstone Pore Characteristics Analysis

The mercury injection curve shows the relationship between the mercury injection volume and the sample mercury injection pressure, revealing information on pore connectivity and pore size distribution [27]. The mercury intrusion method test results revealed that the blank group sandstone had a porosity of 12.48% and an average pore size of 1272.68 nm, while the sandstone sample treated with aragonite calcium carbonate coating had a porosity of 12.05% and an average pore size of 1292.71 nm. The sandstone sample treated with vaterite calcium carbonate coating had a porosity of 5.55% and an average pore size of 1184.16 nm. The experimental results showed that the porosity of sandstone samples treated with calcium carbonate coating was reduced. During the reaction process, calcium chloride and sodium carbonate that had penetrated into the surface and internal pores of the sandstone continuously reacted to form calcium carbonate of different crystal types, which changed the internal pore structure of the sandstone and reduced the porosity of the sandstone.
Figure 11 shows the pore size distribution of sandstone samples. We observed that the pore size distributions of the three sandstone samples were concentrated in the range of 1–10 microns, but the pore size ratio of different sizes changed; the sandstone samples treated with calcium carbonate had fewer large-sized pores. Among the three sandstone samples, the sandstone samples treated with vaterite had the lowest porosity and very low content of macropores. According to the penetration depth test of calcium ions, the penetration depth of vaterite calcium carbonate was deeper than that of aragonite calcium carbonate. Therefore, during the reaction process, vaterite calcium carbonate could penetrate into the sandstone and adversely affect the internal pore structure, resulting in a change in pore size distribution and decreases in large pore size and porosity.

3.2.5. Effect of Layer Number and Reactant Concentration on the Appearance

According to the protective principle of stone cultural relics, the surface of the stone before and after treatment should not produce obvious color differences [28]. Therefore, we needed to consider the influence of the reactant concentration and the number of coatings on the color difference of the sandstone surface. Figure 12 shows variation curves of sandstone surface color change with the concentration of solutions and the number of coatings. Three values were taken each time, and the Δ E   value was obtained using the average of the color changes. According to the color difference curve, the greater the concentration, the greater the content of calcium carbonate particles and the greater the color difference change rate when the number of layers increased. When the number of coating layers was the same, the color induced by highly concentrated solutions was much higher than that obtained with low concentration solutions. Due to the limited number of nanoparticles adsorbed on the surface of sandstone, the chromatic modification did not change significantly with the increase of the number of layers and tended to be stable. Considering that the surface protection material must not only play a protective role, but also induce a minimal color change, the ideal conditions or best conditions individuated after all the tests were a 0.05 M solution deposited in 5 layers.

3.2.6. Wettability

The wettability of the stone sample surface was evaluated by static contact angle, water absorption and air permeability. The surface contact angle of the sandstone is shown in Figure 13. The static contact angle of sample B was 28°, the static contact angle of sample A was 18°, and the static contact angle of sample V was 13°. According to Table 2, the surfaces of the samples are all super-hydrophilic types. After our treatment, the contact angle of the sandstone sample surface decreased and the hydrophilicity increased. There are two reasons for the decrease in the contact angle of the sandstone surface: the first is that the calcium carbonate particles were on the sandstone surface, increasing the surface roughness of the hydrophilic stone and improving the surface hydrophilicity; the second is that the calcium carbonate deposited on the surface of sandstone produced a large number of hydrophilic hydroxyl groups in the aqueous solution, which attract water molecules [29].

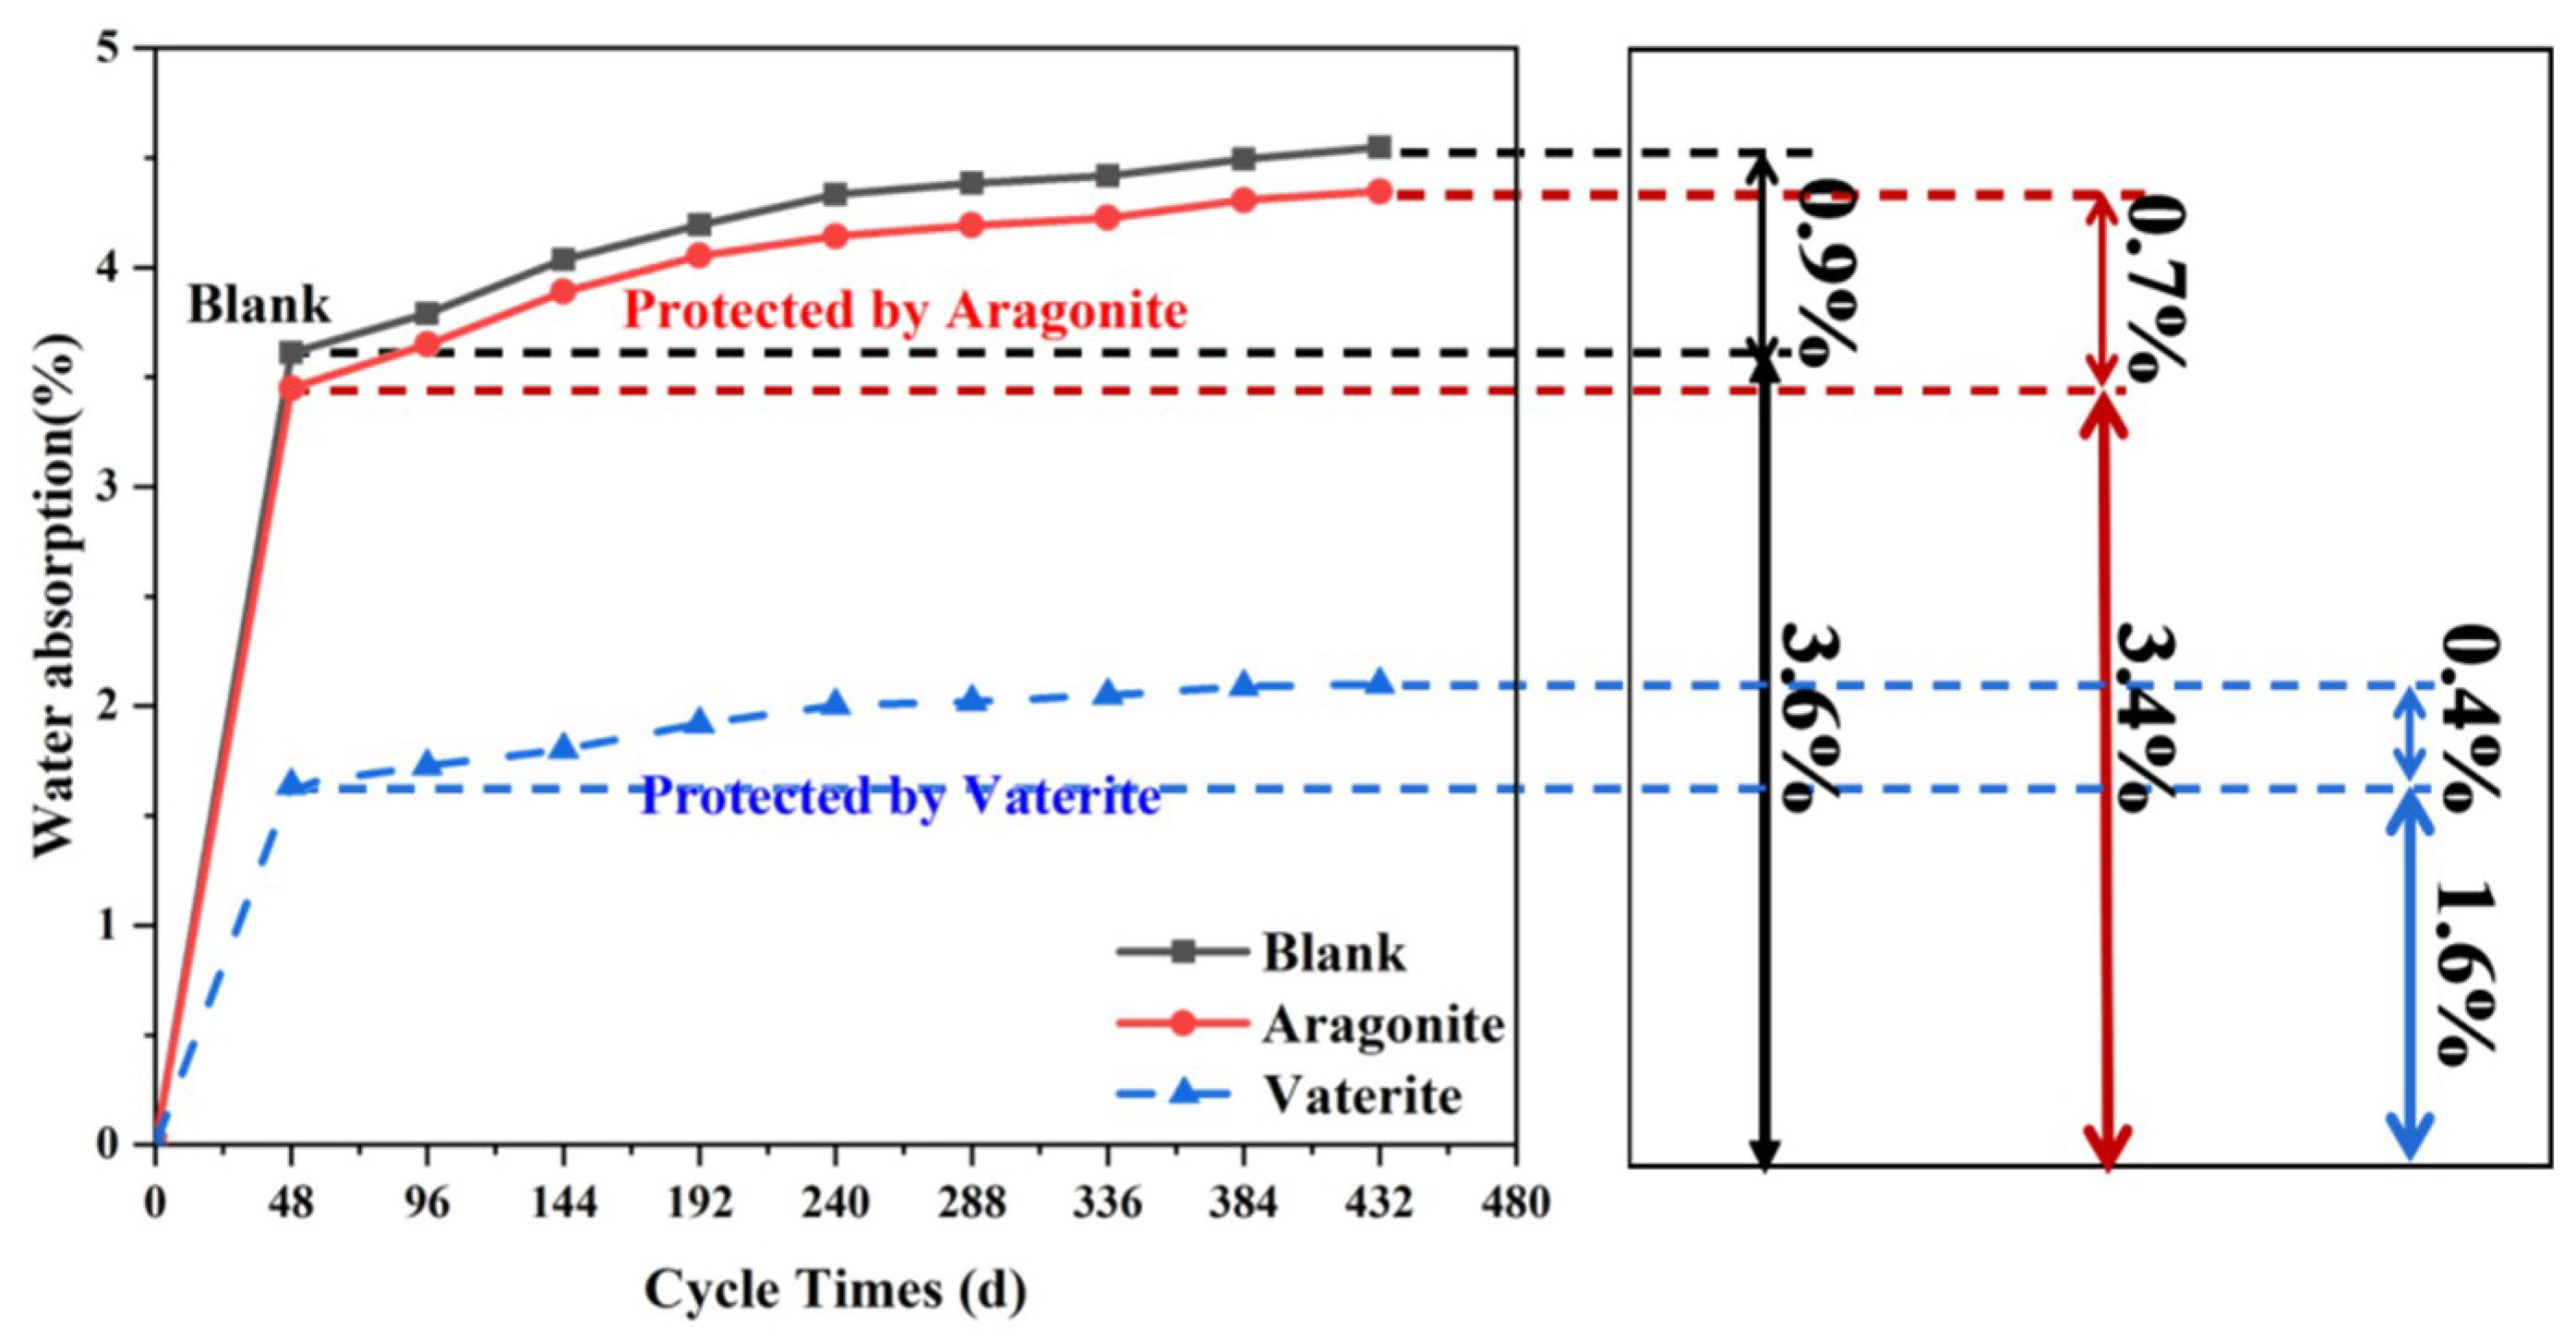
3.2.7. Water Absorption Analysis

According to the changes in the water absorption rate shown in Figure 14, the water absorption rate of the sandstone changed very quickly within 48 h of soaking in the first stage. The water absorption rate of the blank sandstone reached as high as 3.6%, the water absorption rate of the sandstone treated with aragonite calcium carbonate was 3.4%, (which is close to that of the blank stone sample), and the water absorption rate of the stone sample treated with vaterite was only 1.6%—less than half of the blank stone sample. The second stage of the change in water absorption ranged from 48 to 336 h. In this stage, the rate of change in water absorption slowed down. The third stage involved soaking for 336 to 432 h, during which the water absorption rate gradually tended toward constancy and the water absorption reached full saturation.
We observed that the water absorption rate changed very slightly until reaching saturation in the second stage. The water absorption rate of the blank sandstone only increased by 0.9%, while the water absorption rate of the sample treated with aragonite increased by 0.7%, and the water absorption rate of the stone sample treated with vaterite increased by 0.4%. These data showed that the water absorption rate of stone samples could reach maximum after soaking for 48 h. According to the water absorption test results, both materials had a protective effect, effectively reducing water absorption. However, sample V had the lowest water absorption rate. As shown in the surface morphology in Figure 8c, vaterite calcium carbonate with smaller average size and good permeability was able to form a uniform and dense coating on the surface of sandstone, effectively preventing water molecules from entering the interior of the stone. Meanwhile, aragonite calcium carbonate coating produced cracks, which did not affect the water absorption rate of the stone surface.

3.2.8. Water Vapor Permeability Analysis

Figure 15 shows changes in water vapor permeability. The coating material could not completely seal the surface of the stone, preventing water vapor from entering and leaving the stone, causing internal moisture condensation, and even accelerating the deterioration of the stone [30]. Generally speaking, the larger the pores, the better the air permeability. The blank sample B did not undergo any treatment, and its porosity was not affected in any way; thus, its air permeability was the best [31]. The porosity of samples after coating material treatment was affected to a certain extent. According to the surface morphology shown in Figure 8, there were large cracks on the surface of sample A, which were beneficial to the exchange of water vapor inside and outside. This had a small impact on gas permeability [32], consistent with water absorption test results. The surface of sample V was uniform and dense, which may have hindered the exchange of water vapor and had a greater impact on the air permeability. This confirmed that vaterite calcium carbonate greatly reduced the porosity of the sandstone, resulting in a decrease in air permeability. However, observing the entire change process, we observed that the differences between the three curves were not very large. In fact, with the increase of the number of cycles, the changes of the three curves were the same, the mass change was less than 0.1 g, and the overall fluctuation was very small, indicating that the two materials did not affect water vapor movement in and out of the stone.

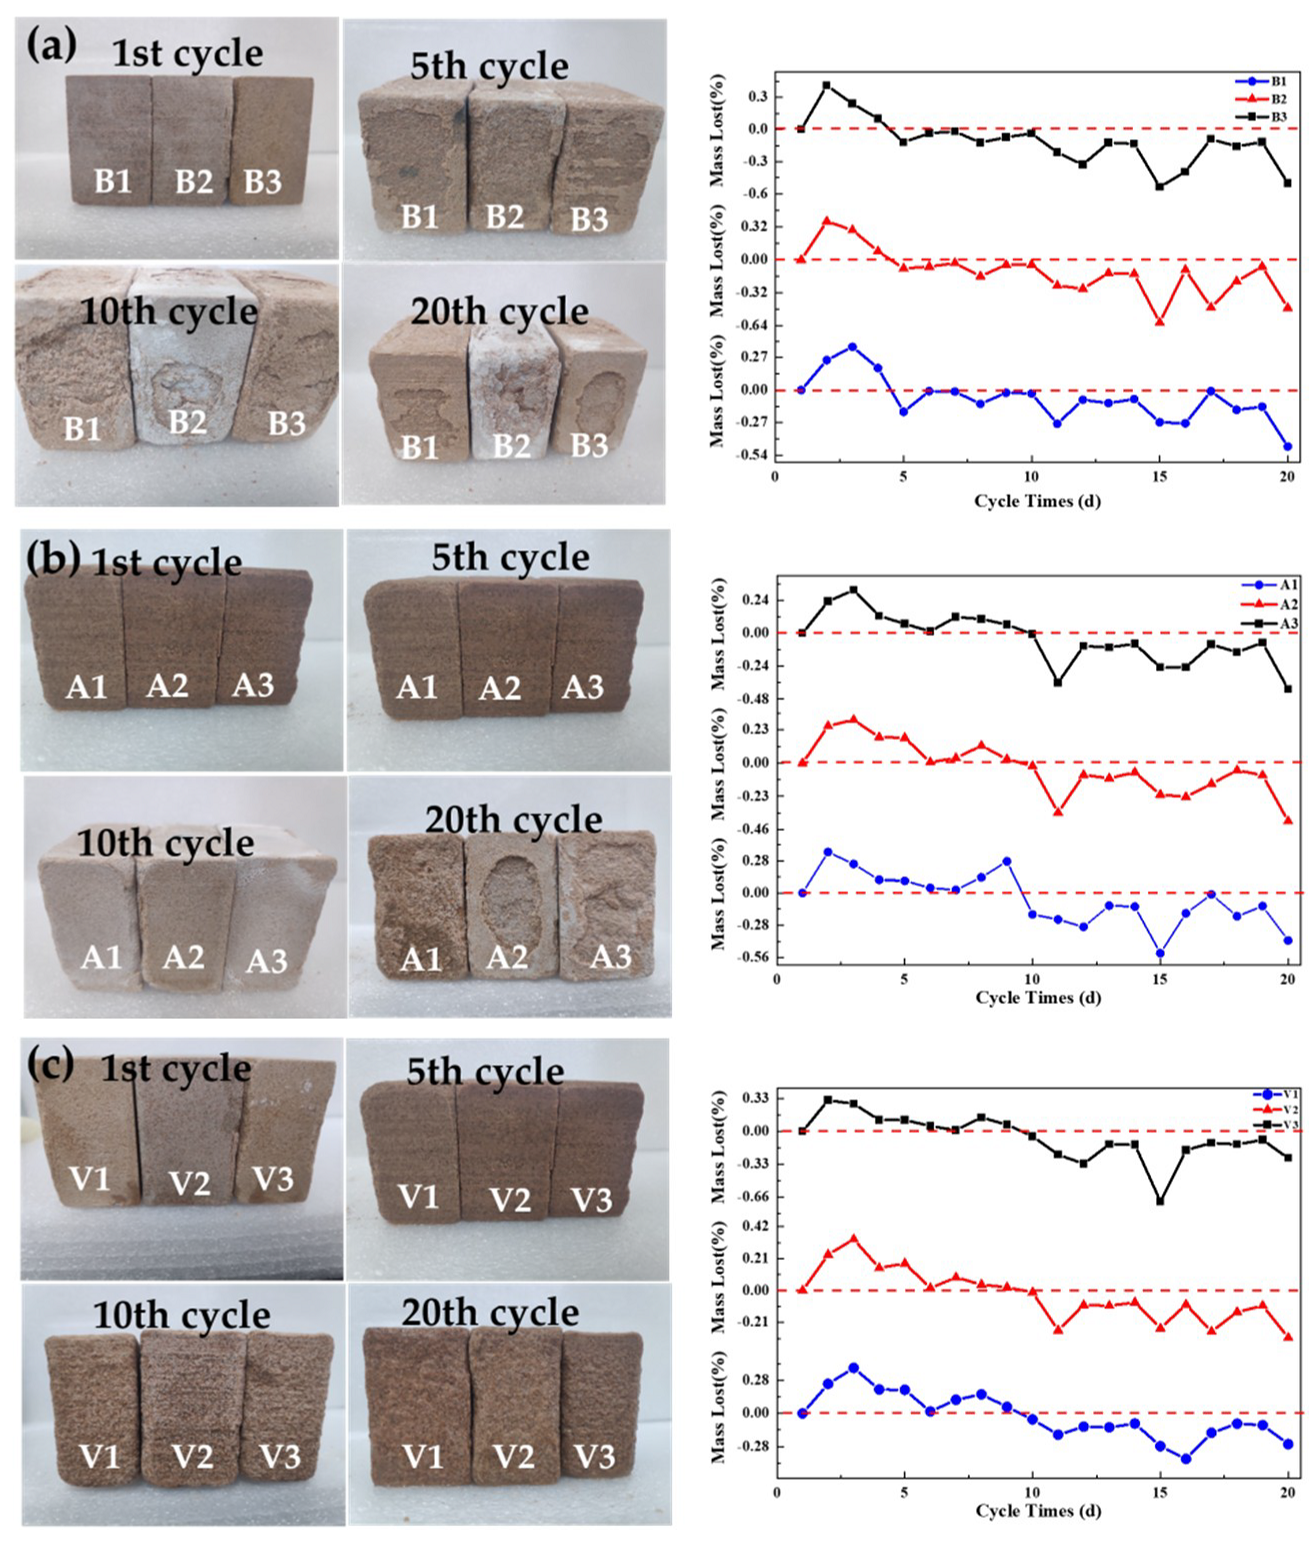
3.2.9. Weather Resistance of the Coated Stone

Most sandstone is in the outdoor environment and is easily corroded by soluble salt. To explore the feasibility of protecting materials, it was necessary to conduct tests of weather resistance on the treated sandstone. Sodium sulfate is one of the most destructive and ubiquitous salts insoluble salts. We chose it as the soluble salt in this experiment for the weather resistance test [33]. The results of the weathering resistance test are shown in Figure 16.
As shown for the blank sandstone in Figure 16a, the appearance of the three samples began to weather after the 5th cycle. After the 20th cycle, large areas began to fall off and the quality curve dropped significantly. For the sandstone treated with aragonite in Figure 16b, the surfaces of the three parallel specimens began to pulverize after the 10th cycle, and large areas fell off after the 20th cycle. Figure 16c shows that, after the vaterite treatment, the surface appearance and quality of the three samples did not change significantly. The quality curves of the first few cycles of all samples showed an upward trend, consistent with viewpoints in the literature [20]. By comparing the three curves, we concluded that the change of sample V was the smallest, indicating that the soluble salt content of sample V was lowest. Vaterite calcium carbonate led to small average particle sizes, good permeability and high solubility compared with aragonite calcium carbonate. Additionally, the nanoparticles did not accumulate on the surface, and a uniform and dense coating did form on the surface, effectively preventing soluble salt solution into the stone. Therefore, sandstone samples coated with vaterite suffered the least damage.

4. Conclusions

In this work, we used different surfactants to control the crystallization process of calcium carbonate and deposit different crystalline calcium carbonate protective coating materials on surfaces of sandstone samples. Color difference change test results showed that, when the concentration of the reactant was 0.05 mol/L and the number of coatings was limited to 5, the appearance of the sandstone was unaffected. Water vapor permeability test results revealed that the calcium carbonate coating did not affect the rate of water exchange in the sandstone. Water absorption test results also showed that the vaterite coating effectively prevented the entry of external moisture and had good stability (the water absorption rate was still low after 480 h). The results of weather resistance tests on coated sandstone showed that the coating effectively prevented soluble salts from entering the sandstone, and the weather resistance increased 4 times over compared to untreated sandstone samples. This was due to the small average particle size of vaterite crystal-type calcium carbonate and its effective permeability, which formed a uniform and dense film on the surface of the sandstone, preventing water and soluble salts from entering. These findings are expected to provide additional suggestions for the protection of stone cultural heritage.

Supplementary Materials

The following are available online at https://www.mdpi.com/article/10.3390/coatings11121534/s1, Figure S1: XRD diffraction pattern of orthogonal experiment sample, Figure S2: Effect of factors in different levels on difference crystal form, (1) is aragonite, and (2) is vaterite, Table S1: Orthogonal factor and level table, Table S2: L9 (34) Orthogonal array, Table S3: L9 (34) Orthogonal designed table and its results, Table S4: Range analysis of the evaluation indexes Aragonite mole fractions, Table S5: Range analysis of the evaluation indexes Vaterite mole fractions.

Author Contributions

Y.W., H.Q., H.S. and Q.L. conceived and designed the experiment. Y.W. analyzed the experimental results and performance; Y.W. wrote this paper. All authors have read and agreed to the published version of the manuscript.

Funding

This research was funded by The Science and Technology Project of the National Achieves Administration of China (2021B03, 2021B04), the construction project in the innovation team of philosophy and social sciences of Yunnan (No. 2021CX05), and the open project of Gansu Provincial Research Center for Conservation of Dunhuang Cultural Heritage (GDW2021YB03).

Institutional Review Board Statement

Not applicable.

Informed Consent Statement

Not applicable.

Data Availability Statement

Not applicable.

Acknowledgments

We would like to thank Hu Sha, School of Foreign Languages, Yunnan University, for her help in writing this thesis.

Conflicts of Interest

The authors declare no conflict of interest.

References

  1. Sun, Q.; Zhang, Y. Combined effects of salt, cyclic wetting and drying cycles on the physical and mechanical properties of sandstone. Eng. Geol. 2019, 248, 70–79. [Google Scholar] [CrossRef]
  2. Barzoi, S.C.; Luca, A.C. Significance of studying the petrography and miner-alogy of the geological environment of old rupestrian churches to prevent their deterioration. A case study from the South Carpathians. J. Cult. Herit. 2013, 14, 163–168. [Google Scholar]
  3. Franklin, B.J.; Young, J.F.; Powell, R. Testing of Sydney dimension sandstone for use in the con-servation of heritage buildings. Aust. J. Earth Sci. 2014, 61, 351–362. [Google Scholar] [CrossRef]
  4. Zhou, Z.; Cai, X.; Ma, D.; Cao, W.; Chen, L.; Zhou, J. Effects of water content on fracture and mechanical behavior of sandstone with a low clay mineral content. Eng. Fract. Mech. 2018, 193, 47–65. [Google Scholar] [CrossRef]
  5. Jia, M.; He, L.; Pan, A.; Ma, X.; Huang, S.; Simon, S. Silica-based hybrids for adhesive coatings and their anti-salt damage in the protection of ancient sandstone. Prog. Org. Coat. 2021, 151, 106037. [Google Scholar] [CrossRef]
  6. Liu, Q.; Zhang, B.J. Assessment of damage from organic protective coating treatments to historic stone buildings and sculptures. Appl. Mech. Mater. 2010, 44, 610–613. [Google Scholar] [CrossRef]
  7. Tesser, E.; Lazzarini, L.; Bracci, S. Investigation on the chemical structure and ageing transformations of the cycloaliphatic epoxy resin EP2101 used as stone consolidant. J. Cult. Herit. 2018, 31, 72–82. [Google Scholar] [CrossRef]
  8. Favaro, M.; Mendichi, R.; Ossola, F.; Simon, S.; Tomasin, P.; Vigato, P.A. Evaluation of polymers for conservation treatments of outdoor exposed stone monuments. Part II: Photo-oxidative and salt-induced weathering of acrylic–silicone mixtures. Polym. Degrad.Stab. 2007, 92, 335–351. [Google Scholar] [CrossRef]
  9. Rodriguez-Navarro, C.; Rodriguez-Gallego, M.; Ben Chekroun, K.; Gonzalez-Muñoz, M.T. Conservation of ornamental stone by Myxococcus can thus-induced carbonate biomineralization. Appl. Environ. Microbiol. 2003, 69, 2182–2193. [Google Scholar] [CrossRef] [Green Version]
  10. Jimenez-Lopez, C.; Rodriguez-Navarro, C.; Piñar, G.; Carrillo-Rosúa, F.J.; Rodriguez-Gallego, M.; González-Muñoz, M.T. Consolidation of degraded ornamental porous limestone stone by calcium carbonate precipitation induced by the microbiota inhabiting the stone. Chemosphere 2007, 68, 1929–1936. [Google Scholar] [CrossRef] [Green Version]
  11. Jroundi, F.; Gonzalez-Muñoz, M.T.; Garcia-Bueno, A.; Rodriguez-Navarro, C. Consolidation of archaeological gypsum plaster by bacterial biomineralization of calcium carbonate. Acta Biomater. 2014, 10, 3844–3854. [Google Scholar] [CrossRef]
  12. De Muynck, W.; Debrouwer, D.; De Belie, N.; Verstraete, W. Bacterial carbonate precipitation improves the durability of cementitious materials. Cem. Concr. Res. 2008, 38, 1005–1014. [Google Scholar] [CrossRef]
  13. Chen, Z.; Li, C.; Yang, Q.; Nan, Z. Transformation of novel morphologies and polymorphs of CaCO3 crystals induced by the anionic surfactant SDS. Mater. Chem. Phys. 2010, 123, 534–539. [Google Scholar] [CrossRef]
  14. Dong, L.; Yang, L.; Wang, Y.; Han, M. Free-standing crystalline CaCO3 films composed of three-dimensional microstructures with different morphologies. J. Cryst. Growth 2012, 343, 86–94. [Google Scholar] [CrossRef]
  15. Guo, H.; Qin, Z.; Qian, P.; Yu, P.; Cui, S.; Wang, W. Crystallization of aragonite CaCO3 with complex structures. Adv. Powder Technol. 2011, 22, 777–783. [Google Scholar] [CrossRef]
  16. Kubo, N.; Yamato, M. Drawing effect of poly (vinyl alcohol) on crystal growth of calcium carbonate. Chem. Lett. 2013, 42, 174–176. [Google Scholar] [CrossRef]
  17. Kim, I.W.; Robertson, R.E.; Zand, R. Effects of some nonionic polymeric additives on the crystallization of calcium carbonate. Cryst. Growth Design 2004, 5, 513–522. [Google Scholar] [CrossRef]
  18. JC/T973-2005. Natural Stone Protector for Building Decoration; National Development and Reform Commission of PRC: Beijing, China, 2005. [Google Scholar]
  19. Tokarský, J.; Martinec, P.; Kutláková, K.M.; Ovčačíková, H.; Študentová, S.; Ščučka, J. Photoactive and hydrophobic nano-ZnO/poly (alkyl siloxane) coating for the protection of sandstone. Constr. Build. Mater. 2019, 199, 549–559. [Google Scholar] [CrossRef]
  20. Shu, H.; Yang, M.; Liu, Q.; Luo, M. Study of TiO2 modified sol coating material in the protection of stone-built cultural heritage. Coatings 2020, 10, 179. [Google Scholar] [CrossRef] [Green Version]
  21. Zhang, H.; Liu, Q.; Liu, T.; Zhang, B. The preservation damage of hydrophobic polymer coating materials in the conservation of stone relics. Prog. Org. Coat. 2013, 76, 1127–1134. [Google Scholar] [CrossRef]
  22. Miliani, C.; Velo-Simpson, M.L.; Scherer, G.W. Particle-modified consolidants: A study on the effect of particles on sol–gel properties and consolidation effectiveness. J. Cult. Herit. 2007, 8, 1–6. [Google Scholar] [CrossRef]
  23. Adavi, K.; Dehkordi, A.M. Synthesis and polymorph controlling of calcite and aragonite calcium carbonate nanoparticles in a confined impinging-jets reactor. Chem. Eng. Process.-Process Intensif. 2021, 159, 108239. [Google Scholar] [CrossRef]
  24. Ma, L.; Zhao, L.; Li, Y.; Zhang, J. Controllable crystallization of pure vaterite using CO2 storage material and different Ca2+ sources. J. CO2 Util. 2021, 48, 101520. [Google Scholar] [CrossRef]
  25. La Russa, M.F.; Ruffolo, S.A.; Rovella, N.; Belfiore, C.M.; Palermo, A.M.; Guzzi, M.T.; Crisci, G.M. Multifunctional TiO2 coatings for cultural heritage. Prog. Org. Coat. 2012, 74, 186–191. [Google Scholar] [CrossRef]
  26. Jiang, J.; Xu, D.; Zhang, Y.; Zhu, S.; Gan, X.; Liu, J. From nano-cubic particle to micro-spindle aggregation: The control of long-chain fatty acid on the morphology of calcium carbonate. Powder Technol. 2015, 270, 387–392. [Google Scholar] [CrossRef]
  27. Yang, F.; Ning, Z.F.; Kong, D.T.; Liu, H.Q. Pore structure of shales from high pressure mercury injection and nitrogen adsorption method. Nat. Gas Geosci. 2013, 24, 450–455. [Google Scholar]
  28. Silva, R.; Pereira, G.M.; Muniz, E.C.; Rubira, A.F. Calcium carbonate crystallization on a polyethylene surface containing ultrathin layers of hydrophilic polymers. Cryst. Growth Des. 2009, 9, 3307–3312. [Google Scholar] [CrossRef]
  29. Peruzzi, R.; Poli, T.; Toniolo, L. The experimental test for the evaluation of protective treatments: A critical survey of the “capillary absorption index”. J. Cult. Herit. 2003, 4, 251–254. [Google Scholar] [CrossRef]
  30. Hou, P.; Gao, F.; Gao, Y.; Yang, Y.; Cai, C. Changes in breakdown pressure and fracture morphology of sandstone induced by nitrogen gas fracturing with different pore pressure distributions. Int. J. Rock. Mech. Min. Sci. 2018, 109, 84–90. [Google Scholar] [CrossRef]
  31. Lettieri, M.; Masieri, M. Performances and coating morphology of a siloxane-based hydrophobic product applied in different concentrations on a highly porous stone. Coatings 2016, 6, 60. [Google Scholar] [CrossRef]
  32. Hidema, R.; Toyoda, T.; Suzuki, H.; Komoda, Y.; Shibata, Y. Adhesive behaviour of a calcium carbonate particle to solid walls having different hydrophilic characteristics. Int. J. Heat Mass Transf. 2016, 92, 603–609. [Google Scholar] [CrossRef]
  33. Jia, M.; He, L.; Liang, J.; Pan, A.; Zhao, L.; Simon, S. Dispersant effect on coatings of POSS-based poly methylmethacrylate hybrids and their protective performance to sandstones. Prog. Org. Coat. 2019, 132, 388–398. [Google Scholar] [CrossRef]
Figure 1. Flow chart of stone treatment experiment.
Coatings 11 01534 g001
Figure 2. Schematic diagram of water vapor permeability test.
Coatings 11 01534 g002
Figure 3. Weather resistance cycle steps.
Coatings 11 01534 g003
Figure 4. XRD diffraction spectra of calcium carbonate powder samples. (1) is aragonite, and (2) is vaterite.
Coatings 11 01534 g004
Figure 5. Infrared absorption spectrum of the calcium carbonate powder samples. (1) is aragonite, and (2) is vaterite.
Coatings 11 01534 g005
Figure 6. Morphology and grain size distribution of calcium carbonate powder samples, (a) is aragonite, and (b) is the grain size distribution of aragonite, and (c) is vaterite, and (d) is the vaterite grain size distribution.
Coatings 11 01534 g006
Figure 7. XRD pattern of the processed stone sample. (1) is an aragonite-treated sample, and (2) is a vaterite-treated sample, ▲—Aragonite, ●—Vaterite, ◆—Silica.
Coatings 11 01534 g007
Figure 8. Surface morphology of the stone samples. (a) is a blank stone sample, (b) is an aragonite-treated sample, and (c) is a vaterite-treated sample.
Coatings 11 01534 g008
Figure 9. The cross-section of the processed sandstone sample was measured for calcium ion content in a straight line, (a) is an aragonite-treated sample, and (b) is a vaterite-treated sample.
Coatings 11 01534 g009
Figure 10. Penetration distribution of different crystal types of calcium carbonate in sandstone. (a) is an aragonite-treated sample and (b) is a vaterite-treated sample.
Coatings 11 01534 g010
Figure 11. Sandstone samples pore size distribution.
Coatings 11 01534 g011
Figure 12. Color difference of the sandstone surface varies with the concentration of solutions.
Coatings 11 01534 g012
Figure 13. Contact angle of a stone sample surface. B is a blank stone sample, A is an aragonite-treated sample, and V is a vaterite-treated sample.
Coatings 11 01534 g013
Figure 14. Water absorption curve. B is a blank stone sample, A is an aragonite-treated sample, and V is a vaterite-treated sample.
Coatings 11 01534 g014
Figure 15. Water vapor permeability curve. B is a blank stone sample, A is an aragonite-treated sample, and V is a vaterite-treated sample.
Coatings 11 01534 g015
Figure 16. The change of mass and surface morphology for the sandstones during Na2SO4 SLHA cycles, (a) Three parallel samples (B1–B3) are untreated blank sandstone samples, (b) three parallel samples (A1–A3) are sandstone samples treated with aragonite calcium carbonate, and (c) three parallel samples (V1–V3) are sandstone samples treated with vaterite calcium carbonate.
Coatings 11 01534 g016
Table 1. Stone sample number.
Sample NumberStone TypeCoatings
BSandstoneBlank
Aaragonite crystalline calcium carbonate
Vvaterite crystalline calcium carbonate
Table 2. Relationship between wettability and contact angle.
GradeStatic Contact Angle θ/°Wetting Effect
θ ≤ 30°super-hydrophilic
30° < θ ≤ 90°hydrophilic
90° < θ ≤ 110°hydrophobic
110° < θ ≤ 130°quitely hydrophobic
θ > 130°super-hydrophobic
Table 3. XRD patterns.
Aragonite26.3°27.3°33.1°36.3°37.9°38.5°42.9°45.9°48.4°
PDF76−0606Crystal planes(111)(021)(012)(102)(112)(130)(122)(221)(202)
Vaterite26.3°25.0°27.1°32.8°43.8°49.1°49.9°55.7°
PDF72−0506Crystal planes(002)(100)(101)(102)(110)(112)(104)(202)
Publisher’s Note: MDPI stays neutral with regard to jurisdictional claims in published maps and institutional affiliations.

