Article

Dual Use of Copper-Modified TiO2 Nanotube Arrays as Material for Photocatalytic NH3 Degradation and Relative Humidity Sensing

1
Ruđer Bošković Institute, Bijenička cesta 54, 10000 Zagreb, Croatia
2
Faculty of Geotechnical Engineering, University of Zagreb, Hallerova aleja 7, HR-42000 Varaždin, Croatia
*
Author to whom correspondence should be addressed.
Coatings 2021, 11(12), 1500; https://doi.org/10.3390/coatings11121500
Submission received: 7 November 2021 / Revised: 21 November 2021 / Accepted: 3 December 2021 / Published: 6 December 2021
(This article belongs to the Special Issue Photocatalytic Nanoporous Thin Films)

Abstract

:
In this paper, we emphasized the dual application of Cu-modified vertically aligned TiO2 nanotube arrays as photocatalyst and a relative humidity sensor. The TiO2 nanotube arrays were obtained by anodization of the titanium layer prepared using radio frequency magnetron sputtering (RFMS) and modified with different copper concentrations (0.5, 1, 1.5, and 2 M) by a wet-impregnation method. The sample modified with 2 M Cu(NO3)2 solution showed the highest efficiency for the NH3 photocatalytic degradation and the most pronounced humidity response in comparison to the other studied samples. In order to investigate the structure and impact of Cu modification, X-ray diffraction (XRD), scanning electron microscopy (SEM), and energy-dispersive X-ray spectroscopy (EDS) were used. The photocatalytic activity and the kinetic study of ammonia oxidation were studied in a mini-photocatalytic wind tunnel reactor (MWPT), while relative humidity sensing was examined by impedance spectroscopy (IS). Higher NH3 oxidation was a direct consequence of the increased generation of OH radicals obtained by a more efficient photogenerated charge separation, which is correlated with the increase in the DC conductivity.

Graphical Abstract

1. Introduction

Rapid population growth and technological advancements resulted in, among other things, an increase in anthropogenic pollution mostly related to industry, transport, and agriculture. CO2, CO, CH4, NH3, NOx, and volatile organic compounds (VOC) are among a plethora of others [1] that are persistently being emitted into the atmosphere, causing incomprehensible and irreversible damage to the biosphere. Emission management, or rather efficient treatment, is by far one of the more important goals with advanced oxidation processes (AOP) as a key feature.
Titanium (IV) oxide, because of its favorable chemical and mechanical stability and non-toxicity can be found in a wide range of uses from pigments [2], photocatalysis [3], photovoltaics [4], relative humidity sensors [5], etc. In almost all of the aforementioned uses, bulk TiO2 has given way to nanostructured TiO2 due to the significant increase in its specific surface. Nanostructuring TiO2 results in increased photo-induced reactions, light absorption, photogenerated carrier density, photo-reduction, and increased contact with the pollutant or the targeted gas in the case of sensing [6]. In both cases, photocatalysis and relative humidity sensing, TiO2 nanotube arrays (NT) have gained popularity [7,8] because of their large surface-to-volume ratio and shape. This one-dimensional nano-architecture offers more direct pathways for charge transport along their elongated axis and higher possibilities to form surface electric fields that reduce charge carrier recombination, which enhances the sensitivity for light and gas exposure [9]. The majority of the research has been done on TiO2 NTs prepared via the electrochemical anodization of Ti foils because of the method’s simplicity and low cost. By controlling the anodization parameters [10,11], i.e., reaction duration, voltage, electrolyte temperature, electrolyte content and type, different TiO2 NT morphologies can be prepared. The NTs prepared by this method are perpendicularly aligned in regard to the Ti foil substrate and firmly attached to it. This comes as a great benefit because, even though TiO2 in a broad sense is non-toxic and environmentally friendly, a problem of toxicity occurs when its free particulates become nano-scaled. It helps that in our case, the nanotubes are immobilized on a substrate as it prevents their emission into the environment. A review by Shakeel et al. 2016 [12] gave insight into the toxicity issue and shows all of the possible routes of exposure, distribution in the human body, and the effects of nanostructured TiO2 including oxidative stress, histopathological alterations, carcinogenesis, genotoxicity, and immune disruption. The main drawback of TiO2 NTs prepared on Ti foil is their non-transparency due to the underlying metal foil, which limits their further application possibilities. Thin film TiO2 is by default transparent, and so are TiO2 NT thin films. One method of overcoming the transparency problem is using physical Ti thin film deposition methods on transparent substrates. By using magnetron sputtering, Ti thin films can be deposited onto transparent conducting oxides on glass [4] or flexible substrates [13]. The preparation of NT from Ti thin films is analogous to the Ti foil method (electrochemical anodization) which, after thermal treatment, results in transparent thin film nanotubes. By using Ti thin films as a starting point, the applications of NT spreads to third-generation photovoltaics, more specifically perovskite solar cells [4], and broadens their use in the already established fields of photocatalysis and gas sensing with an added potential of covering glass reactor walls for photocatalytic and sensing applications.
In general, TiO2 as a material has some intrinsic flaws: a relatively high bandgap (Eg), which hinders the utilization of the whole solar spectrum, limiting it to the UV part, and high photogenerated charge recombination rates. To improve the efficiency of the material in photocatalytic applications, in other words, to shift absorption to the visible part of the spectrum or to improve the photogenerated charge separation of different materials, modifications can be implemented. One of the most common methods used is surface modification/decoration, usually with noble metals—silver, gold, platinum, or palladium—with the aim of creating p–n junctions [14] and/or surface plasmon resonance effects in the case of gold nanoparticles [15]. These methods of surface modification, although very effective, use expensive precursor materials that greatly increase the cost of preparation and limit potential scale-up. As a cheaper, low-cost alternative, copper can be used as a surface modification material for TiO2 [16,17].
There are many ways of implementing low-cost methods of creating Cu-TiO2 composites, which are mostly based on surface decoration or the doping of TiO2 nanostructures. Thus, Hejazi et al. [18] prepared intrinsically doped TiO2 nanotubes by anodizing Ti-Cu alloys with different copper contents for hydrogen production. Momeni et al. [19] prepared Cu-doped TiO2 nanotubes by anodizing Ti foil with an addition of different concentrations of Cu(NO3)2 to the electrolyte. The authors show an increase in photocatalytic properties for the removal of methylene blue (MB) dye and the production of hydrogen. Zaki et al. [20] have reported enhanced photocatalytic properties for degradation of methyl orange, of Cu decorated TiO2 nanotubes also prepared by anodizing Ti foils, and modified by soaking the nanotubes in a 0.01 M Cu(NO3)2 solution for 1, 3, and 6 h. On the other hand, Zhu et al. [21] have reported an improved photocatalysis of gaseous NH3 with composite Cu2O/TiO2 catalysts (1:10 ratio) prepared by the impregnation–reduction method. The improvement was mostly attributed to the reduced photogenerated charge recombination on the p–n junction of the composite.
It should be mentioned here that NH3 degradation has been thoroughly investigated [22,23] and, besides photocatalysis, there are different established advanced oxidation process (AOP) methodologies. One of the simpler ones, UV/O3 photolysis, has been investigated for its use in NH3 degradation with its mechanisms explained by Kočí et al. [24]. UV/O3 photolysis functions as a multifaceted reaction of generating oxygen and hydroxyl radicals, which serve as the driving force of NH3 degradation to N2. The radicals are formed by the products of UV photolysis and their interaction with water molecules. However, the more frequently implemented and more efficient AOP is photocatalysis. In the case of TiO2-based photocatalysts, there has yet to be an established consensus regarding the mechanisms of gaseous NH3. Even though the mechanism is contested, many agree that the electrons and holes in the conduction band cause the reduction to N2 in several steps. Yuzawa et al. [25] presented a reaction pathway for NH3 degradation over TiO2 loaded with different metal co-catalysts. The reaction pathway goes as follows: photogenerated holes oxidize NH3 to form amide radicals and protons that interact with the photogenerated electrons to create H2. The amide radicals produce hydrazine that can be degraded to N2 and H2. The group also pointed out the importance of the water vapor present in the reactor. During the photocatalytic reaction, ammonium ions are formed, and these are unfavorable by-products. Water restricts the accumulation of the ammonium ions on the TiO2 surface, which ensures the continuous progress of the reaction. Moreover, our previous study confirmed the role of humidity in ammonia oxidation [26]. The rate of ammonia oxidation was higher in the saturated system where the RH was above 75%. In that study, the photocatalytic reaction rate constant for gaseous NH3 degradation over P25 TiO2 supported on glass fiber mesh substrates was calculated. The results demonstrated how important it is to control the humidity levels during the photocatalytic degradation of NH3.
Regarding the surface copper modifications on TiO2 NT, there have been some instances of Cu implementation/integration with TiO2 in the means of doping or composite/multi-layer preparation of sensing materials for different targeted substance sensing. Wang et al. [27] improved the CO sensing capabilities of electrospun TiO2 nanofibers with Cu doping. Lupan et al. [28] prepared TiO2/Cu2O/CuO multi-nanolayers for H2 and VOC (ethanol vapor) sensing using radio frequency magnetron sputtering for the copper oxide layers and spray pyrolysis for the TiO2 top layer. Vathani et al. [29] prepared TiO2 and Cu-TiO2 thin film biosensors with spray pyrolysis for use in uric acid sensing with the copper doping improving the sensing capabilities of the thin film.
Only a few times has the dualistic use in gas sensing and photocatalysis been addressed in relation to different materials. Singh et al. [30] reported that the Pd and Au sensitization of nano-flowerlike structured TiO2 thin films resulted in higher CO sensing responses at lower temperatures and also increased the photocatalytic activity (malachite green dye) with respect to the unmodified nanostructured TiO2 thin film. Sagadevan et al. [31] reported the potential dualistic use of their reduced graphene oxide (rGO)-loaded TiO2 nanoparticles. The samples showed excellent sensitivity and selectivity toward different H2 and O2 concentrations, and the rGO modification also improved the photocatalytic properties (methylene blue) of TiO2 by about 12%. This synergistic combination of graphene and a semiconducting metal oxide can also be seen in the work of Zou et al. [32]. The group synthesized ZnO nanorod structures on top of flexible reduced graphene sheets (rGss) that showed high selectivity to gases (ethanol) and improved the photocatalysis (methylene blue) degradation rates three-fold with respect to comparable ZnO nanorods. A completely different approach for preparing materials for this dual use was reported in the work of Cao et al. [33]. It included a metal, Zn(II), in ternary polymers containing bis (benzimidazole) ligands that have shown promising results as photocatalysts (methyl violet) and demonstrated high Fe(III) and MnO4 selectivity and sensitivity. Similarly, in the work of Ding et al. [34], the group synthesized metal–organic frameworks (MOF) including Zn that showed potential in the photocatalysis of organic dyes and as a luminescent Fe(III) sensor. Among these dualistic uses, there were, to the best of our knowledge, none mentioning TiO2 NT modified with copper.
In this work, the focus was put on a low-cost synthesis of Cu-modified TiO2 nanotubes made from magnetron sputtered Ti thin films that have a dual use: as a photocatalyst for NH3 degradation and as a humidity sensor. In an effort to ensure and control the appropriate level of humidity during the photocatalytic oxidation of ammonia, which restricts the accumulation of ammonium ions on the TiO2 NT surface, we synthesized the photocatalytic material that acts also as a humidity sensor. In order to investigate the crystalline structure, morphology, and electrical properties of the Cu@TNT photocatalysts, X-ray diffraction (XRD), scanning electron microscopy (SEM), energy-dispersive X-ray spectroscopy (EDS), and impedance spectroscopy (IS) were used. The obtained results paved the way for the future optimization of the nanotube films regarding transparency, which could bring implementations that are not limited by the underlying and opaque Ti foil. These materials have the potential of creating intricate air filtering systems relying on solar irradiation, based on flexible, quartz or glass substrates or reactor sides.

2. Materials and Methods

2.1. Synthesis of Cu-Modified TiNT

Bi-layer thin films were deposited by radio frequency (RF) magnetron sputtering (base pressure 1 × 10⁻³ mbar) using a pure 99.995% Ti target. Prior to the deposition, the FTO (fluorine-doped tin oxide) glass substrates were ultrasonically cleaned in acetone and isopropanol for 8 min to be later rinsed with water and ethanol and dried in a stream of N2. To remove any other remaining organic compounds, the substrates were ozone-cleaned in a UV-light ozonator. Regarding the deposition, firstly, TiO2 was deposited onto FTO glass substrates, which acted as a blocking layer, ensuring homogeneous anodization. TiO2 was deposited using argon mixed with 5% O2 for 30 min at a working pressure of 4.0 × 10⁻³ mbar. Secondly, Ti was deposited on top of the TiO2 layer using pure argon for 4 h at a working pressure of 3.75 mTorr. The RF power in both depositions of the films was set at 150 W. To obtain the nanotube structure, the prepared bi-layer samples were anodized at room temperature using a DC power supply and a simple two-electrode system (anode–cathode) contained in a Teflon (PTFE) reactor. The chosen organic electrolyte was a solution of ethylene glycol, 0.6 wt.% NH4F and 2.0 wt.% H2O. The two-electrode system consisted of a platinum foil as the cathode (−) and the RF magnetron sputtered samples on FTO as the working electrode (anode, +). The thin films were anodized for 20 min at 40 V. The anodization process was stopped at the onset of transparency (subjective visual cue) coinciding with the point of sudden current increase (mA). Then, the samples containing nanotubes were rinsed with water and dried in a N2 stream to be later annealed for 2 h at 450 °C inside a tube furnace in air. TiO2 nanostructured samples were modified with copper by wet impregnation, immersing samples for 6 h in four different solutions containing 0.5, 1, 1.5, and 2 M concentrations of Cu(II) cations (Cu(II) source: Cu(NO3)2·3H2O), ethanol, and deionized water. All samples, including the reference sample denoted TNT, were additionally thermally treated at 450 °C for 1 h in air. Cu-modified samples were denoted: 0.5Cu@TNT, 1Cu@TNT, 1.5Cu@TNT, and 2Cu@TNT, respectively.

2.2. Structural, Electrical, and Morphological Characterization

The crystal structures of Cu-modified nanostructured TiO2 were investigated by X-ray diffraction (XRD) on XRD-6000 (Shimadzu, Kyoto, Japan) using Cu Kα irradiation at 40 kV accelerating voltage and 30 mA current. All samples were analyzed in the range 2θ 10°–65° in a continuous mode with a 2θ 0.02° step and a scan rate of 2°/min.
The morphology and elemental composition of the surface were investigated by field emission gun scanning electron microscope (JEOL model 7000F, JEOL Ltd., Tokyo, Japan), operating at 15 kV equipped with an energy-dispersive X-ray analyzer (Oxford Instruments EDS/INCA 350, Oxford, UK) attached to the above-described microscope. The EDS spectra were recorded at 15 kV accelerating voltage and 10 mm working distance.
All the experiments were performed in the mini-photocatalytic wind tunnel (MPWT) reactor (Figure 1). The reactor is made of laboratory glass (DURAN®, Mainz, Germany) that transmits UV radiation larger than 305 nm. The custom-made reactor has a cylindrical geometry (D = 40 mm, L = 155 mm), and it was made from two parts for the easier insertion of a catalyst and potential scale-up. Furthermore, a photocatalyst was placed 7 cm from the lamp in the middle of the photoreactor and illuminated with the full-spectrum linear fluorescent lamps simulating solar spectra; high color rendering Ra98/Class 1A with a color temperature of 6700 K (Exo Terra Repti Glo 2.0 UVB, T8, 60 cm, nominal power 20 W, Holm, Germany). Such a setup ensures the isoactinic conditions on the surface of the photocatalyst.
For the experimental purpose, 250 mL of ammonia solution was prepared (25% p.a., Kemika) with the initial concentration, C0 (NH3) = 100 ppm. The air pump (Fluval Q2, Hagen, Germany) was connected by pipes to an Erlenmeyer flask (evaporation chamber) with ammonia solution into which air was blown (maximum flow rate of 240 L/min and resulting gas flow velocity 3.4 cm/s). Ammonia in the air stream enters the reactor where the photocatalyst is located. Two outlets lead from the reactor: one that drains the excess gas into the Rettberg flusher (Rettberg GmbH, Göttingen, Germany) filled with distilled water, and the other that is connected to the measuring device, Geotech GA5000 (QED Environmental Systems Ltd., Coventry, UK), which is a portable device for measuring the concentration of landfill gases, including ammonia. Undesirable by-products of the photocatalytic oxidation of ammonia, nitrates and nitrites, were not detected in any of the experiments. The first set of experiments was conducted without the catalysts in dark and under irradiation in order to obtain the control baseline of NH3 measured in the outlet and respective residence time. The second set of experiments was conducted with Cu-modified TNT photocatalysts in dark (adsorption–desorption process). The resulting curves showed the NH3 concentration below the control baseline at all times, suggesting the NH3 adsorption on photocatalysts. The NH3 concentration in the outlet increased within the first 60 min, which was followed by the plateau. This plateau corresponds with the targeted baseline NH3 concentration used for determination of the degradation extents by photocatalytic NH3 oxidation on each Cu-modified TNT sample. Finally, a third set of experiments was done under irradiation (photocatalytic oxidation). In a typical photocatalytic experiment, NH3 was continuously introduced in the reactor, and its concentration was monitored in the outlet. To achieve the targeted baseline NH3 concentration, the reactor was kept in the dark for the first 60 min. The irradiation time lasted from 60 to 240 min in all experiments. During irradiation, a significant decrease in the NH3 outlet concentration was observed compared to the baseline (i.e., adsorption plateau). The difference was used to calculate the degradation extents. All experiments were performed in triplicates to discard possible experimental errors. The UVB and UVA intensities were measured by a UVP UVX radiometer, which was fitted with the corresponding UVB and UVA sensors, matching the distance of the photocatalytic film surface. The relative humidity and temperature were kept constant (RH > 90%, T = 23 ± 2 °C).
The surface electrical conductivity of the prepared thin films was measured at room temperature (RT) by impedance spectroscopy (Novocontrol Alpha-A Dielectric Spectrometer, Novocontrol Technologies GmbH & Co. KG, Hundsangen, Germany) in the frequency range from 0.1 to 1 MHz at a voltage of 50 mV. The relative humidity (RH) environment was controlled ranging from 30% to 94%, which is obtained using various salts (their saturated aqueous solutions) in a multifunctional chamber designed in our laboratory. For the electrical contacts, gold electrodes (4 mm × 2 mm) separated from each other by 4 mm were deposited on the sample surface using a Sputter Coater SC7620 (Quorum Technologies Ltd., Laughton, UK). To make a connection with the instrument BDS cell, platinum wires were attached on the surface of gold pads, thus enabling the electrical characterization of the film in surface sheet configuration. The experimental data were analyzed by electrical equivalent circuit (EEC) modeling using the complex non-linear least-squares (CNLLSQ) fitting procedure, and the corresponding parameters are determined with WinFit software (Version 3.2, Novocontrol Technologies GmbH & Co. KG, Hundsangen, Germany). The complex impedance plots typical for studied samples consist of a single semicircle with the center below the real axis. The equivalent circuit that represents such a depressed semicircle is a parallel combination of resistor (R) and constant-phase element (CPE). The CPE is an empirical impedance function of the type Z * C P E = 1 A ( i ω ) α , where A and a are the constants. Furthermore, for the low-frequency spur, the second CPE element connected in series is added to the model. The parameters for every circuit element (R, A, and α) were obtained by the complex non-linear least-squares (CNLLSQ) fitting procedure directly to the measured impedance data. The values of the resistance from the fitting procedures, R, and electrode dimensions (d is sample thickness and A is electrode area) were used to calculate the DC conductivity, σDC = d/(R A).

3. Results

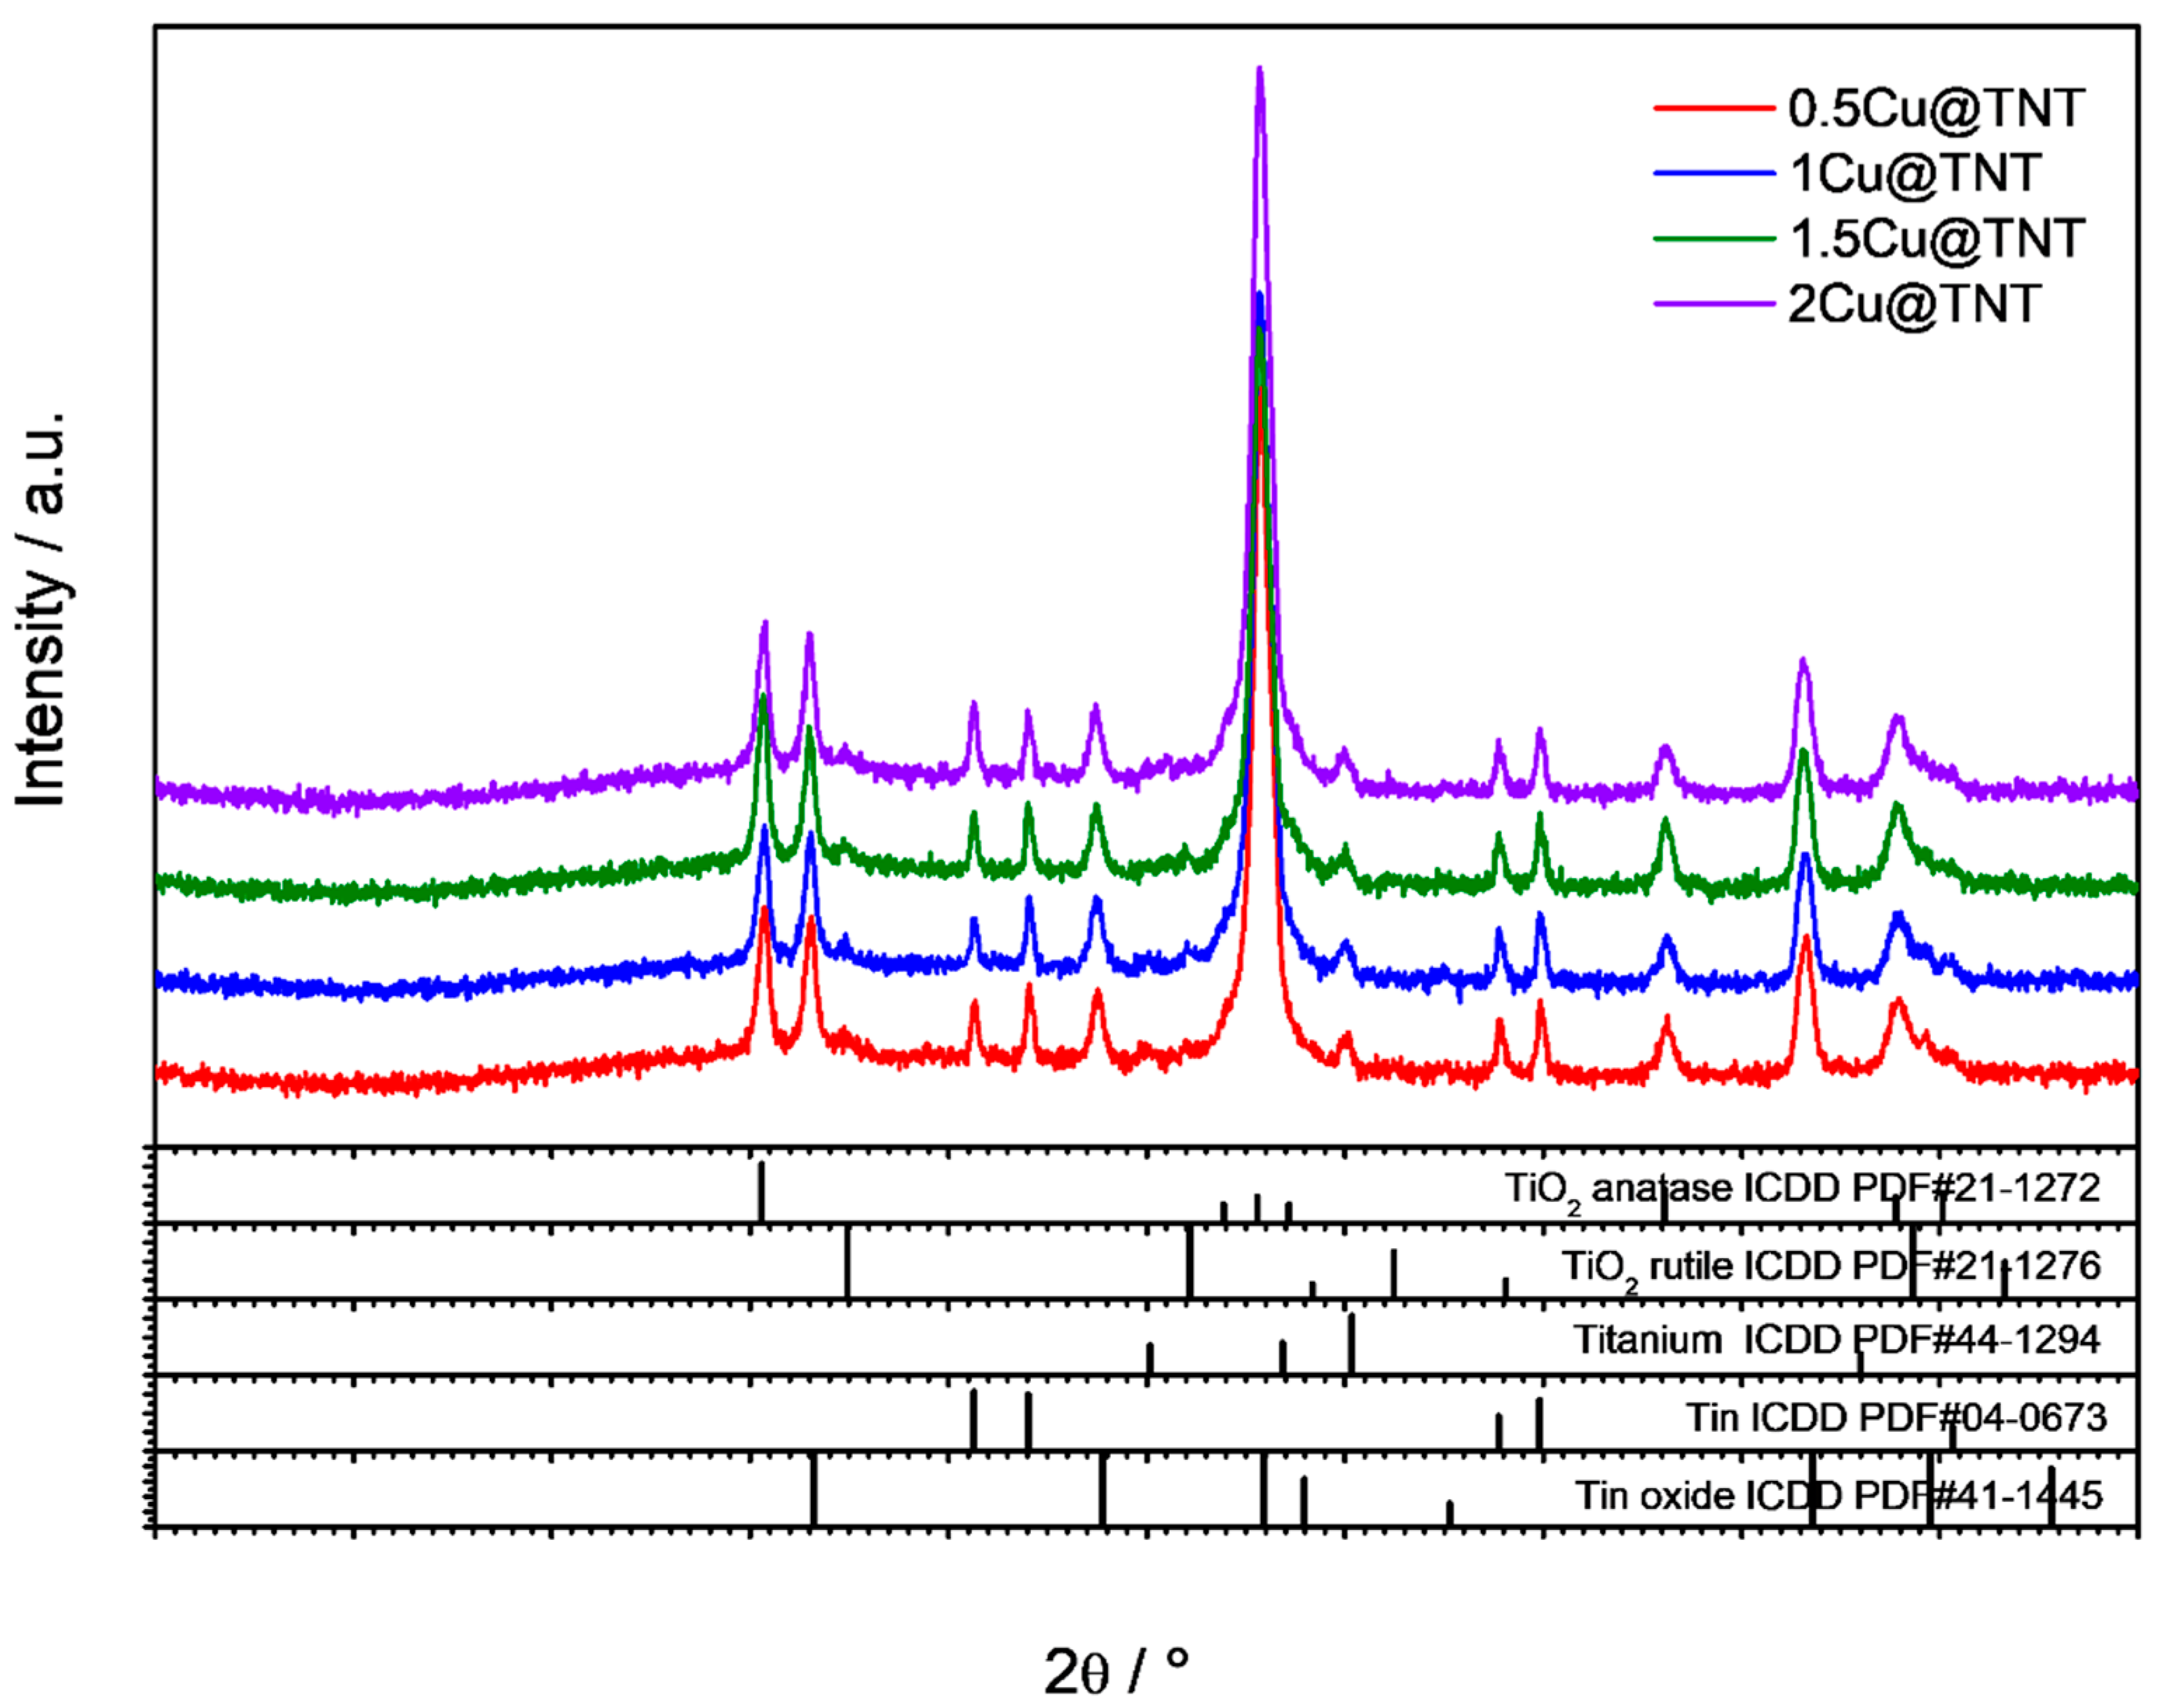
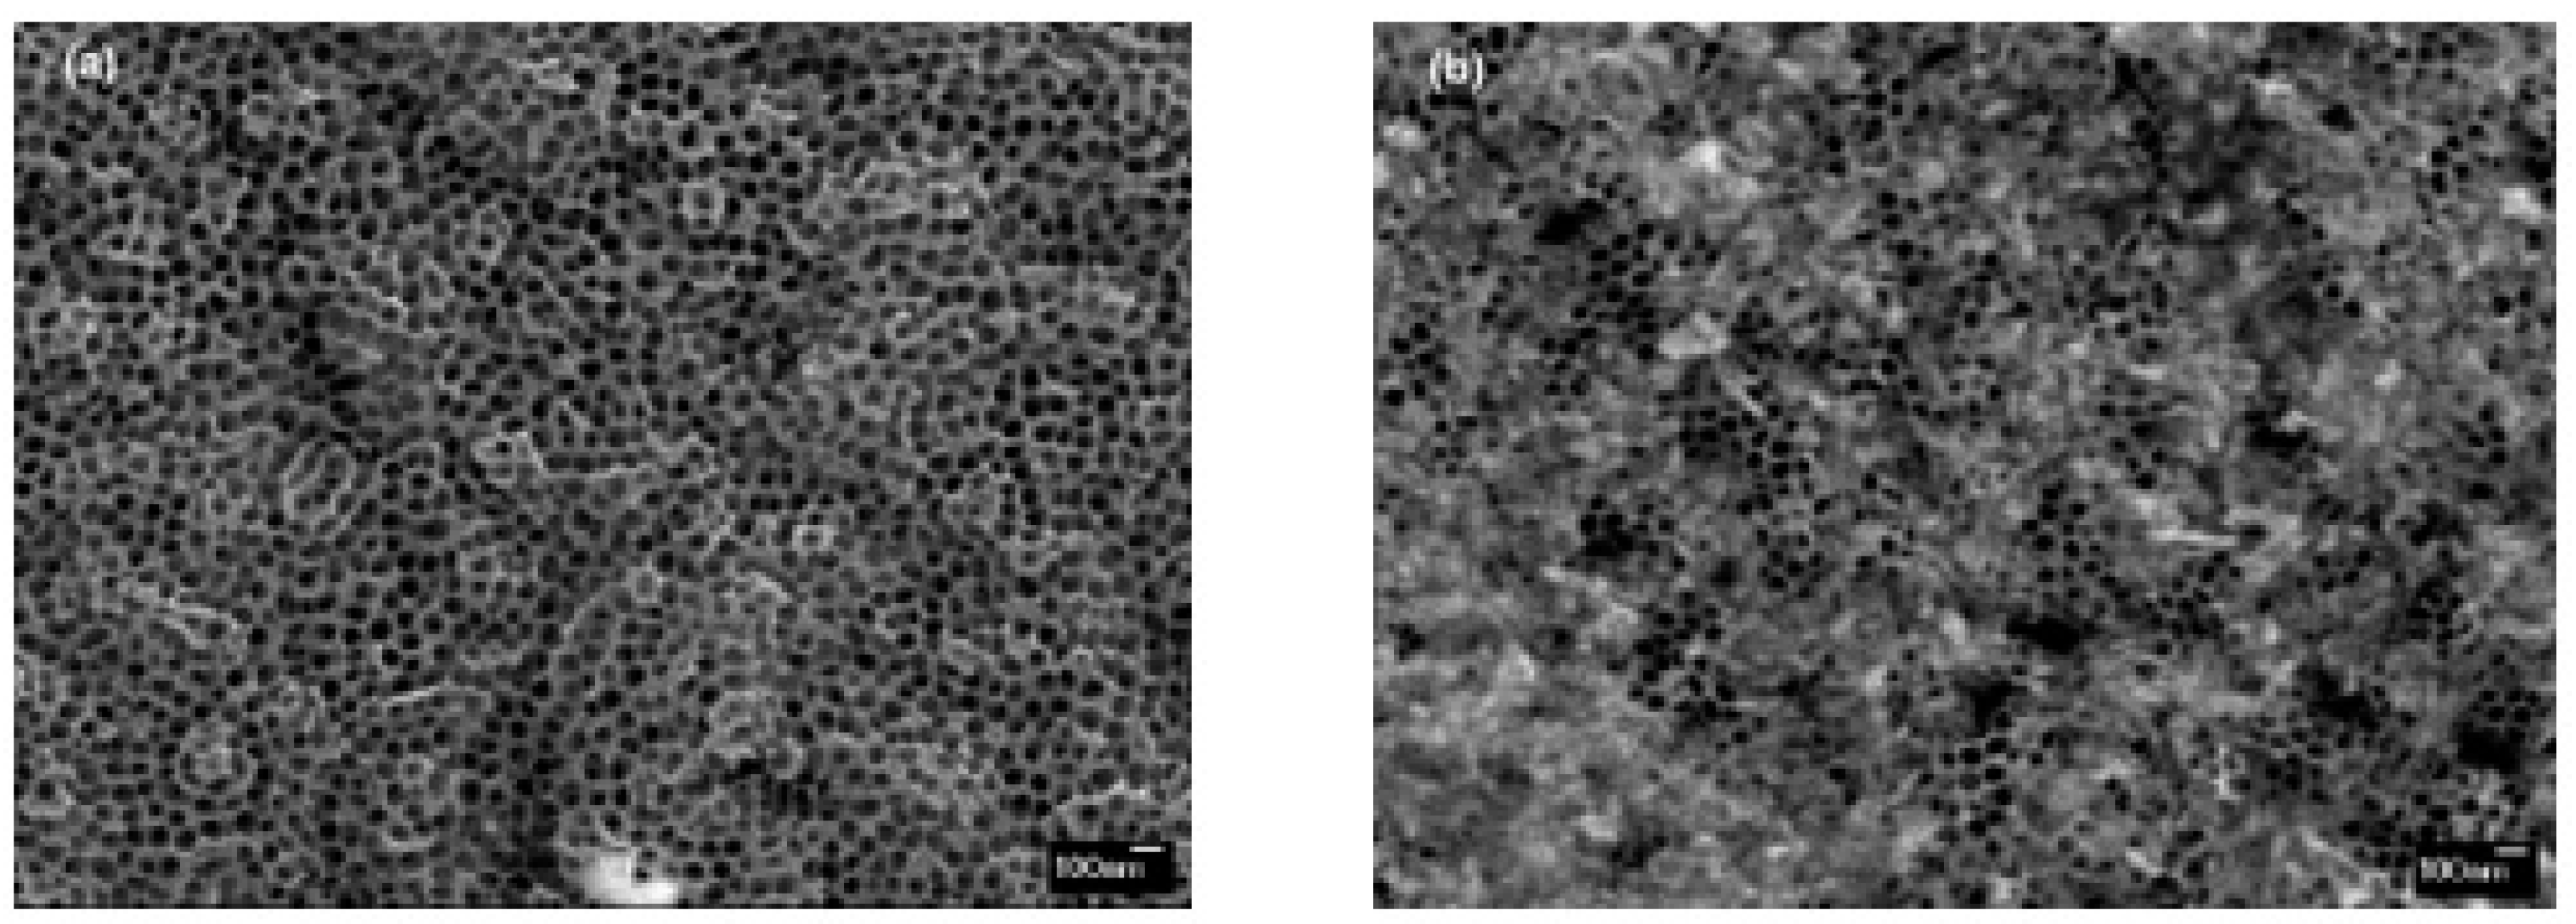
3.1. Structural and Morphological Properties

The X-ray diffraction patterns of the Cu-modified catalyst samples are shown in Figure 2. The main crystalline phases present in the samples are anatase (ICCD PDF#21-1272), tin (ICDD PDF#04-0673), and tin oxide (ICDD PDF#41-1445), with a minor amount of rutile phase (ICDD PDF#21-1276). Both tin and tin oxide originated from the FTO film on the glass substrate. Furthermore, due to a high-intensity peak originating from the FTO substrate, we could not observe peaks originating from the CuO nanoparticles, due to the peak overlapping. We could speculate that CuO is either amorphous or highly dispersed on the TNT surface.
The morphology of the unmodified and Cu-modified nanostructured TiO2 samples was examined by high-resolution scanning electron microscope with a field emission gun cathode (FEG-SEM). From the top-view FEG-SEM images (Figure 3), it can be observed that the photocatalyst samples prepared via RF magnetron sputtering, followed by electrochemical anodization, exhibit a homogenous structure comprised of nanotube arrays with pore diameters of 100 nm. All samples, unmodified and Cu modified, have similar morphologies. The amount of CuO formed on the TNT surface slightly varies between the Cu-modified samples, which indicate the formation of different quantities of highly dispersed nanoparticles (Figure 3b). These findings corroborate those of a prior study [17], where we used a similar Cu-modification pathway to decorate TiO2 nanotubes immobilized on Ti foil.
In order to determine the elemental composition of different Cu@TNT photocatalysts, EDS was used. The results confirmed that the modification of TNT with Cu was successful (0.3 to 1.6 at.%) (Table 1).

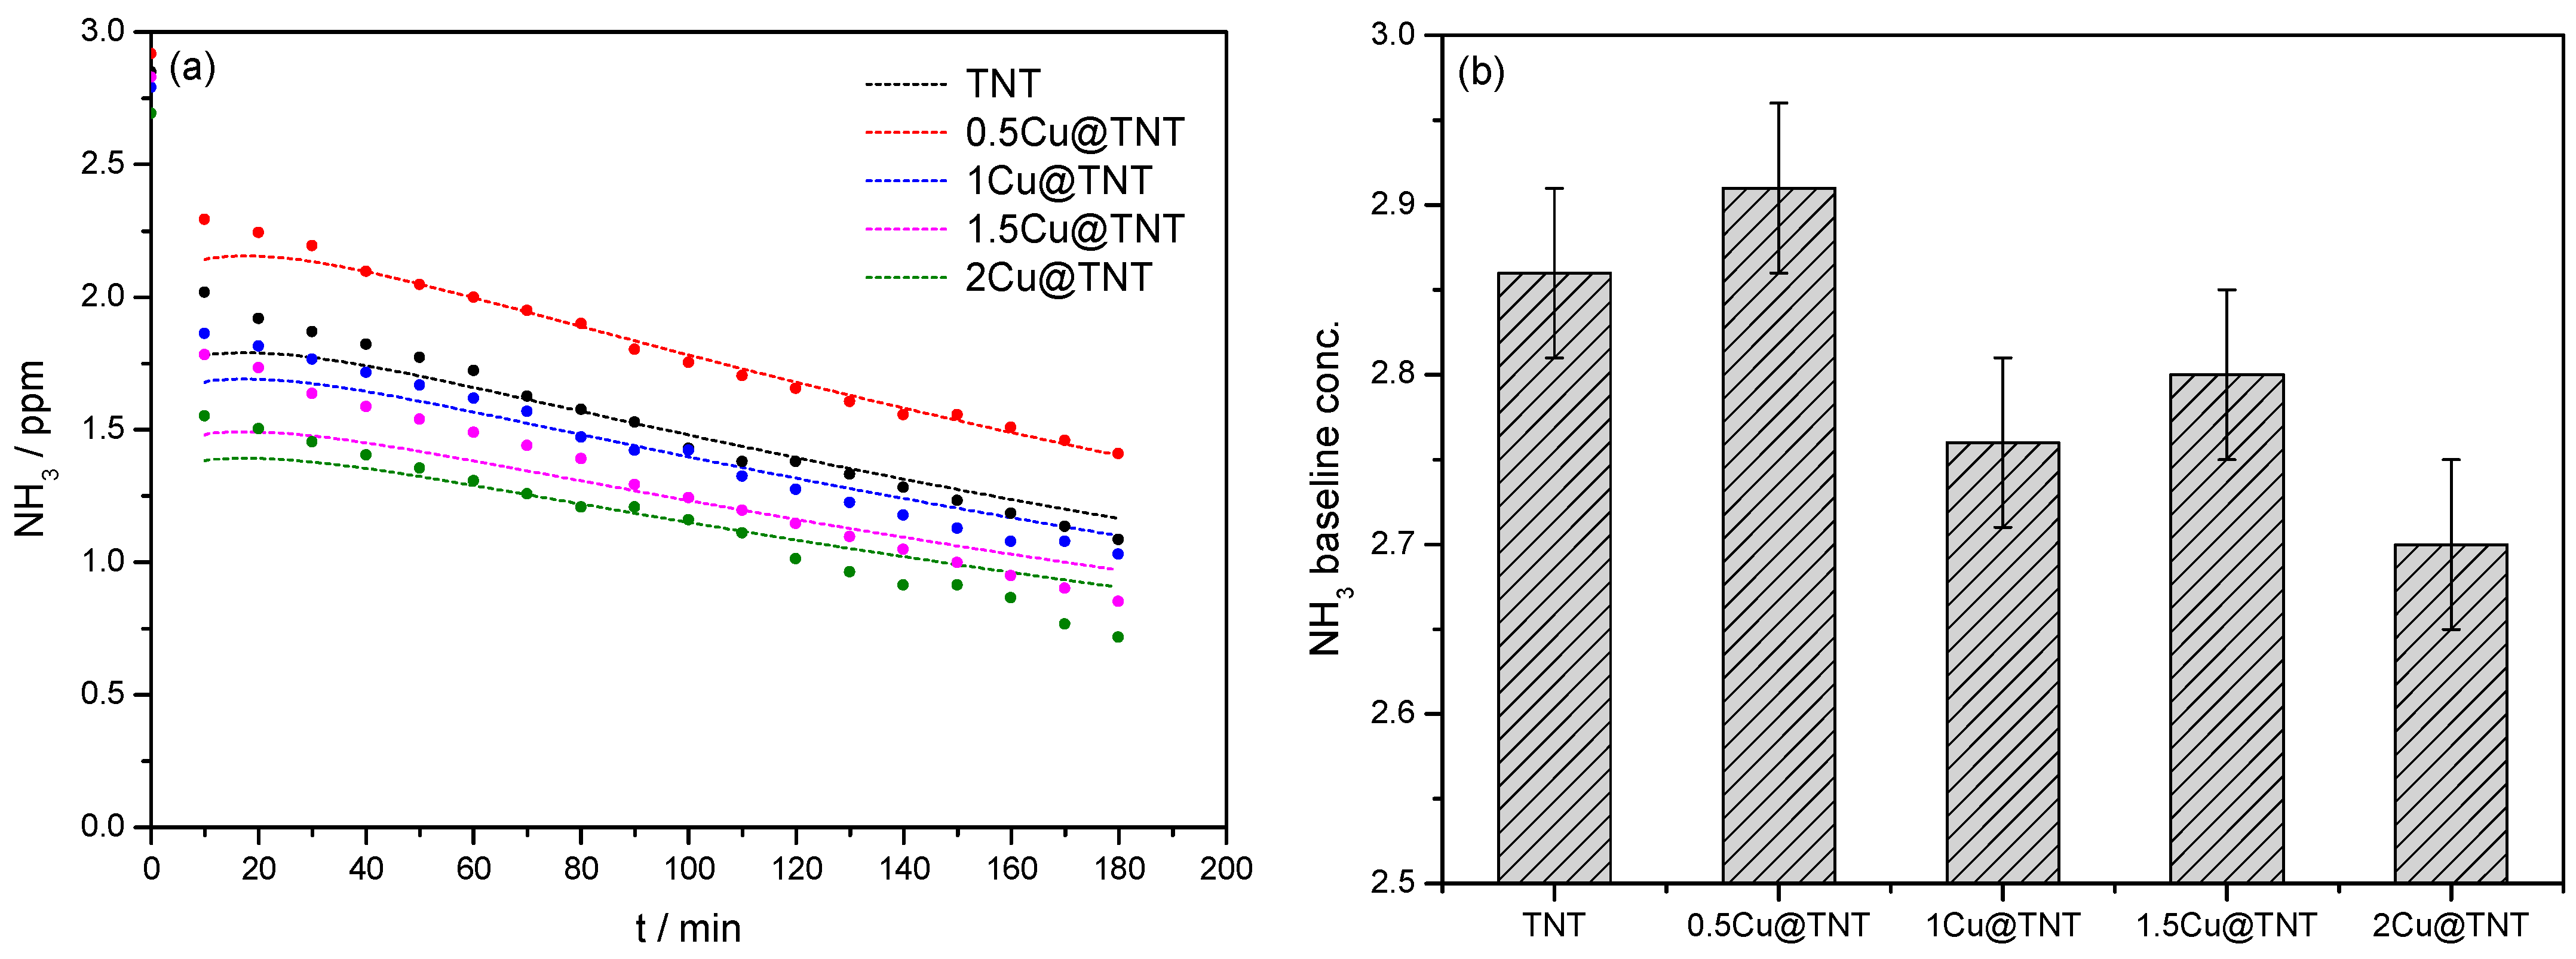
3.2. Results and Kinetic Study of Ammonia Photocatalytic Oxidation

Before the photocatalytic experiment, the evaporation rate from the chamber, corresponding to the NH3 concentration in the air in the empty reactor (baseline), was determined in the same manner as already described in [26]. To address the kinetics of NH3 photocatalytic oxidation properly, the simplified atmospheric dispersion equation was used considering ammonia transport in the axial direction only. Assuming that there is no radial concentration profile, considering the transport phenomena and kinetics together, the equation of continuity for the ammonia will be:
d C i d t + u ¯ z C i L = D ^ C i L 2 ( r i )
where i = NH3, D ^ is the dispersion coefficient in the reaction space, ūz is the average air velocity in the axial direction (cm/min), L is the path length per single pass through the MPWT, and ri stands for the photocatalytic reaction rate.
Under the assumption of first-order reaction rates of NH3, the rate is expressed as:
r i = k a p p C i
where kapp stands for the apparent first-order reaction rate constant (min−1).
The apparent reaction rate constants (Table 2) revealed little regarding the real reaction rates of NH3 photocatalytic oxidation since mass transfer and photon absorption effects were not considered. Since the photocatalysis can be phenomenologically described as a two-step process, the (a) mass transfer step and (b) chemical reaction step, the overall pollutant oxidation rate is composed of the mass transfer constant (km, cm/min) and photocatalytic reaction rate constant (kp, min−1), which are written as series resistances, as shown in Equation (3) [26,35]:
1 k = 1 k p + 1 k m +
The additive effect of a chemical reaction and mass transfer is better shown in rearranged expression, as shown in Equation (4) [36], giving the apparent rate constant that can be introduced in Equation (2).
k = k p k m a S k p + k m a S
In Equation (4), aS stands for the surface area per unit weight of a catalyst (cm2/g). The apparent rate k’ and kp were expressed in cm3/gmin.
Due to the positioning of the photocatalytic active layer in an MPWT reactor, a correlation for the average Sherwood number over the length of a plate, L, is given:
S h = 0.664   S c 0.33 R e L 0.5
where the Reynolds number is calculated over the length L, ReL = Luz/ν. Hereby, the mass transfer constant is related to the Sherwood number as km = Sh  D ^ /L [26].
Furthermore, to calculate the intrinsic constant for the reaction at the TiO2 surface, one independent of photon flux and the changes in irradiation level, the following expression was used:
k p = k p ,   i n t [ ( μ I 0 ) U V B 0.5 + ( μ I 0 ) U V A 0.5 + P v i s 0.5 ] .
here, kp,int is the intrinsic rate of photocatalytic oxidation of target pollutants (cm1.5 m/W0.5min), and I0 (mW/cm2) stands for the incident photon flux at the thin film surface along the whole flat surface in reaction space in the isoactinic MPWT. The μ (cm−1) is the absorption coefficient averaged over the spectrum of incident irradiation separately in the UVB and UVA regions, and 0.5 is the order of reaction with respect to irradiation absorption in well-irradiated systems [37]. The μ for the studied photocatalytic film in the UVA and UVB regions for TiO2-based photocatalyst was determined in our previous paper and used as a reference hereby [26]. In the case of photocatalysts with expected visible light absorption, the irradiation term was expanded using the Pvis term, estimating the overall photon absorption rate on the catalysts’ surface in the visible region. The set of equations is solved numerically following the time step for a single pass through the reactor (dt = L/ūz). All parameters used for modeling are summarized in Table 3.
The resulting concentration profiles are shown in Figure 4a. The experimental results shown in Figure 4 are extracted from the experimentally determined NH3 concentration in the third set of experiments; only data obtained under irradiation (60 to 240 min) were shown. It can be seen that the maximum concentration of ammonia changes due to the presence of different Cu-modified photocatalysts (0.5–2 Cu@TNT), and generally, values predicted by the model follow the trend of experimental results from MPWT. The initial NH3 concentration shown in Figure 4b varies depending on the photocatalyst, suggesting differences in the NH3 adsorption on the surface during the adsorption in dark. Note that 60 min of adsorption in dark whereby NH3 concentration plateau was achieved precedes the photocatalytic oxidation under irradiation. In the photocatalytic process, i.e., under the UV/Vis irradiation, a decrease in the NH3 concentration can be observed due to NH3 oxidation, mainly to N2. After 180 min, for the most active sample (2Cu@TNT), the initial NH3 concentration in the system decreased by 72.9% compared to the NH3 baseline concentration. For the other samples, NH3 concentrations decreased 70.3% for 1.5Cu@TNT, 63.1% for 1Cu@TNT, 51.5% for 0.5Cu@TNT, and 62.0% for TNT. Only the 0.5Cu@TNT sample was less effective compared to the referent TNT sample, while others exhibited higher photocatalytic efficiencies. Detailed modeling allowed tentative insight in the photocatalytic performance of Cu-modified TNT photocatalysts. In general, Cu-modified TNTs have lower absorption coefficients in UVA and UVB compared to pure TNT, but the corresponding photon absorption rates on the catalysts’ surface in the visible region dramatically increased by the addition of Cu.

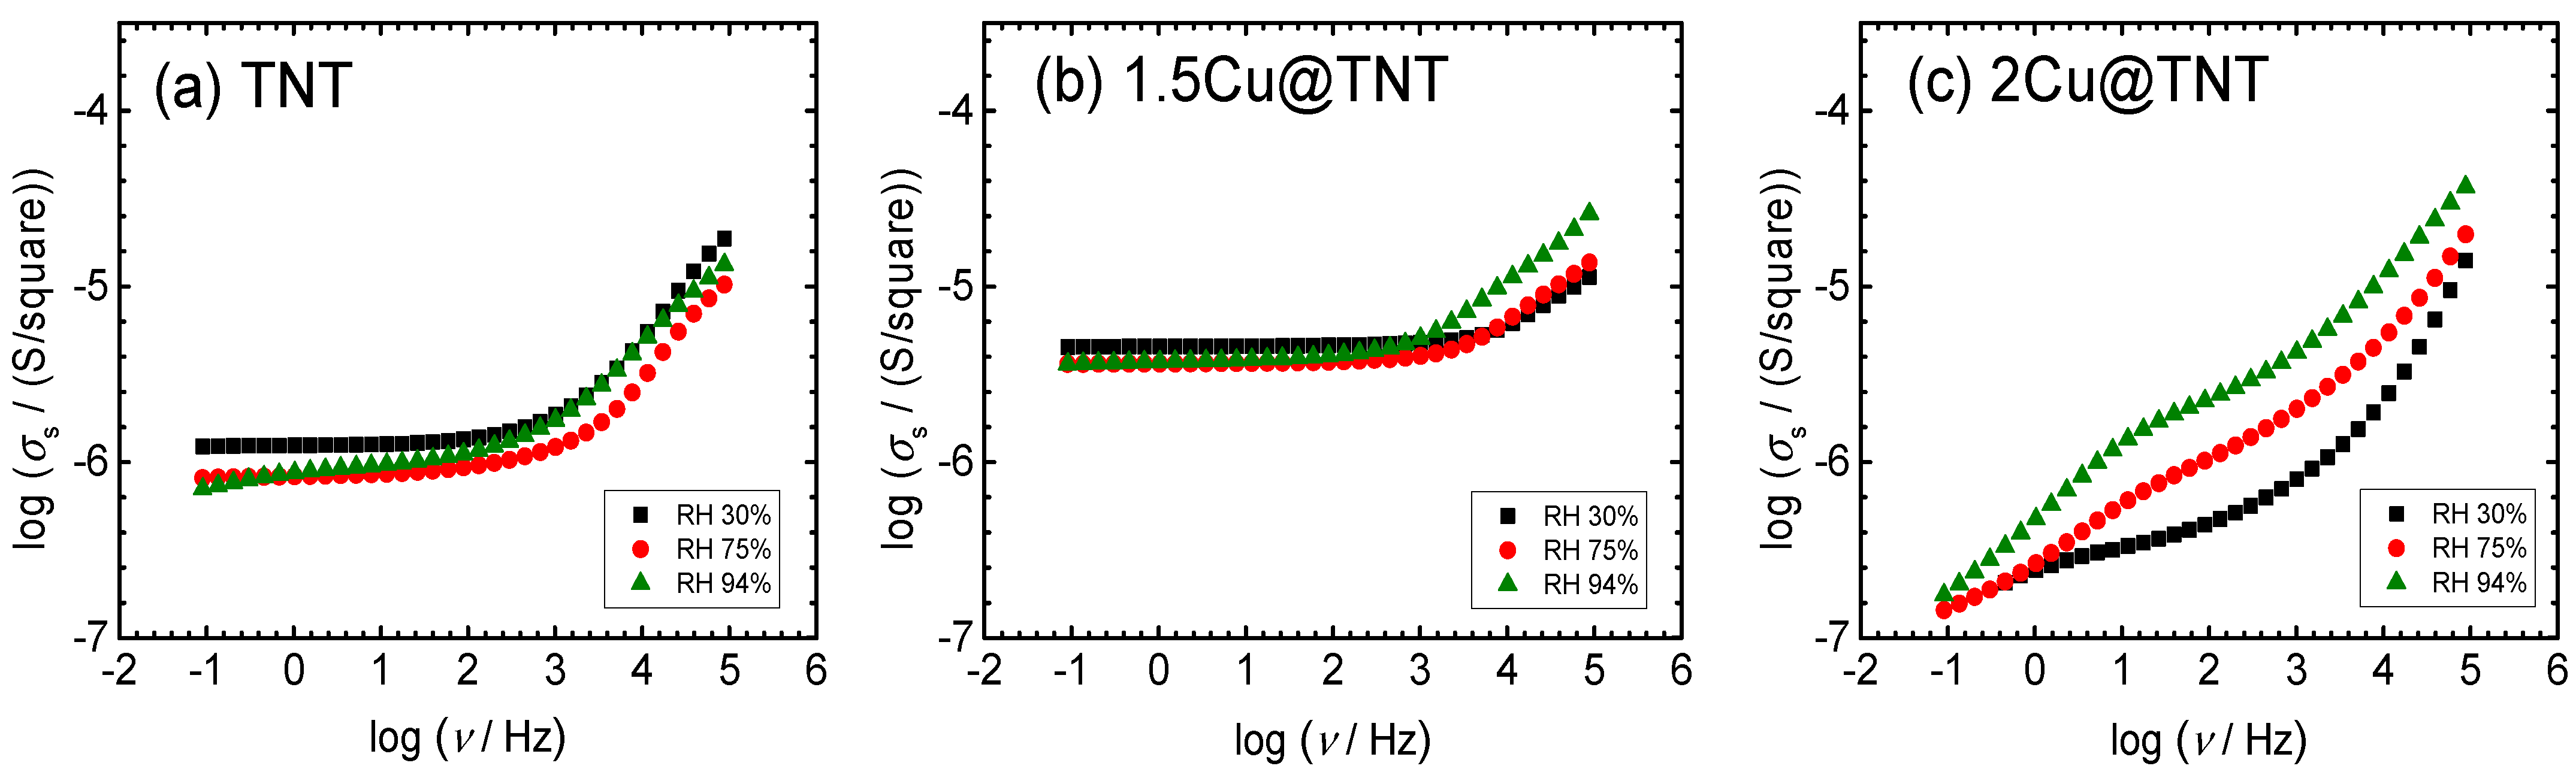
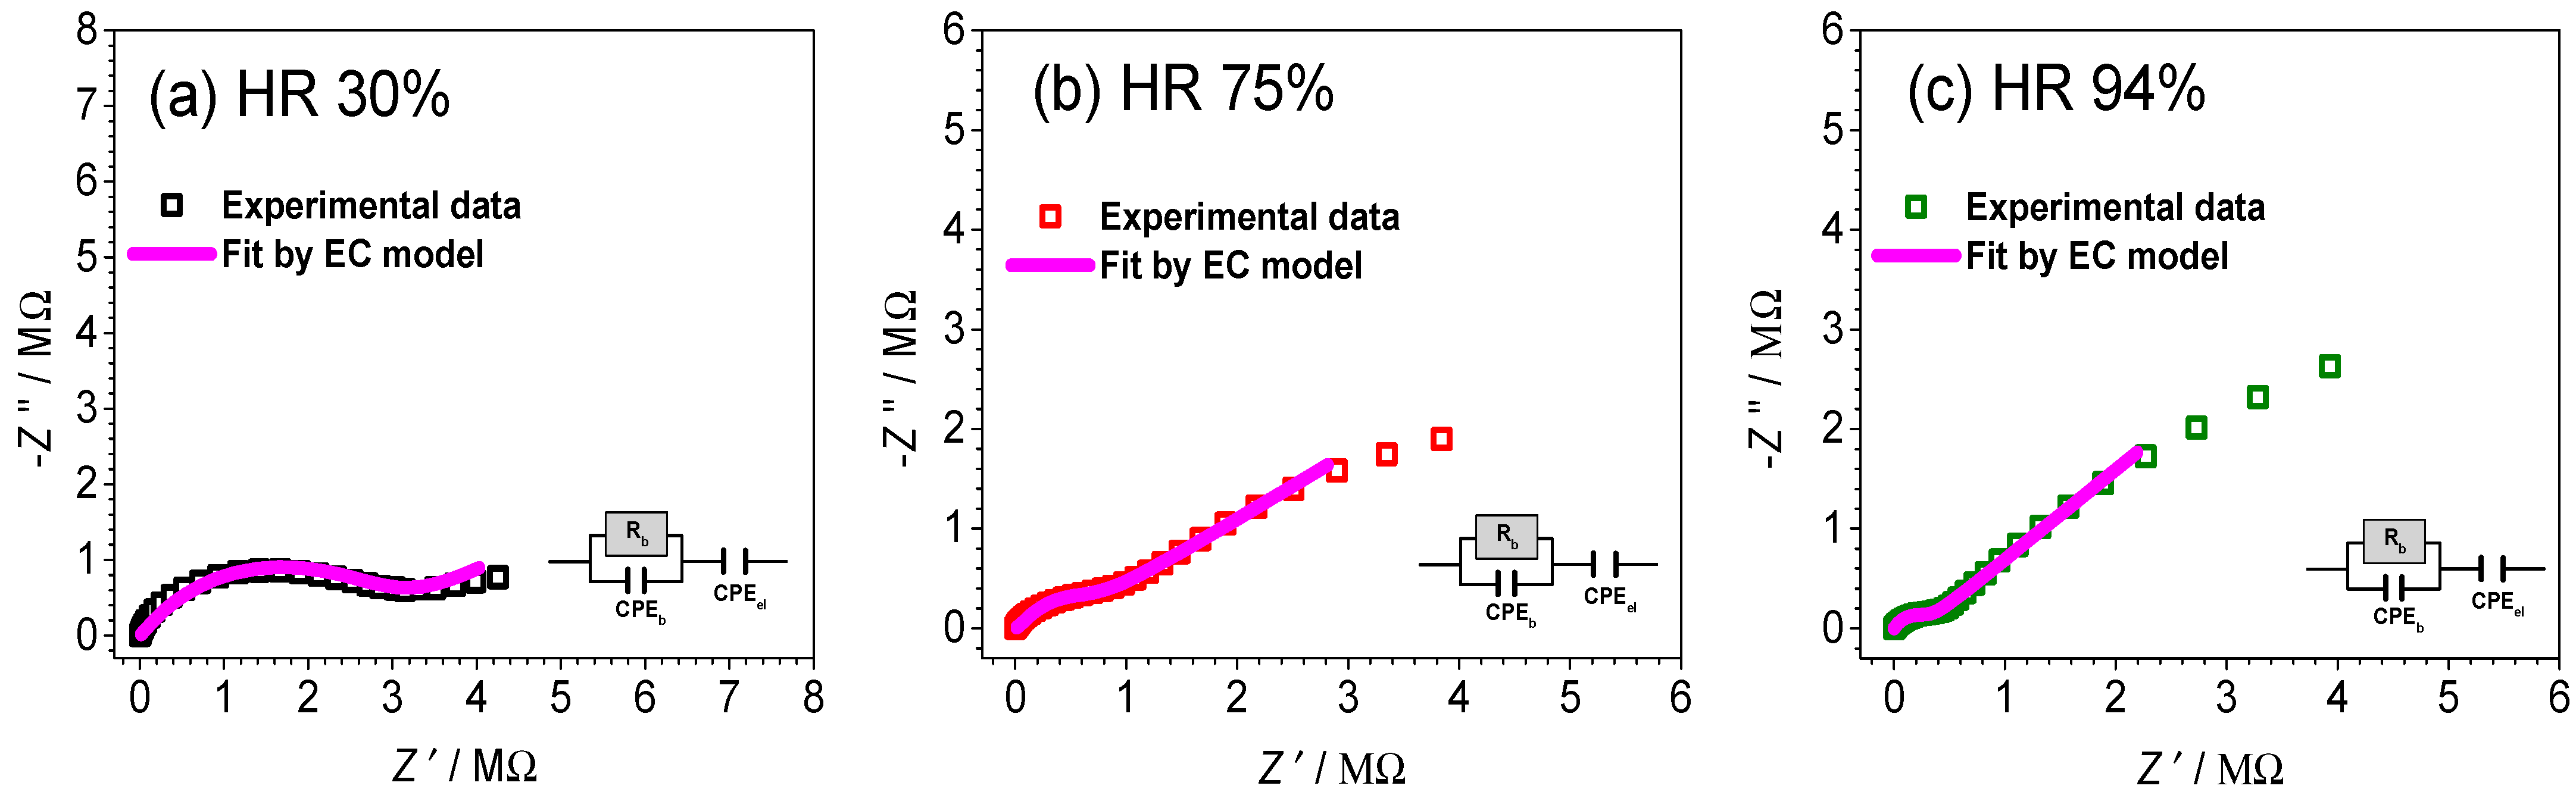
3.3. Impedance Spectroscopy and DC Conductivity under Controlled Humidity

Surface electrical conductivity spectra at different relative humidity for unmodified and Cu-modified nanostructured TiO2 samples are presented in Figure 5a–c. It is observed that conductivity isotherms for TNT and 1.5Cu@TNT samples are similar in shape, and different spectral features can be observed. Both thin films show conductivity isotherms that are frequency independent in a wide low-frequency range, which is related to the long-range transport of charge carriers, i.e., DC conductivity, whereas with increasing frequency, conductivity dispersion occurs in a power-law fashion due to their localized short-range motions. TiO2 is an n-type semiconductor due to the presence of oxygen vacancies and free electrons that are the charge carriers [38]. With the modifications, in this case, with copper, a change in transport properties is very likely, but it seems that the modification of nanostructured TiO2 samples up to 1.5Cu@TNT still does not affect the transport properties based on conductivity spectra and level of relative humidity.
The relative humidity (RH) is controlled from ambient 30% up to 94%. The change in RH does not have a significant effect on the DC conductivity nor does it have a significant effect on the shape of the conductivity spectra of the samples 0Cu@TNT and 1.5Cu@TNT; see Figure 5a,b. However, a detailed look at the DC region reveals a slight variation in DC conductivity; see Table 4.
We can move further in the analysis of electrical properties of the 2Cu@TNT sample and present the experimental data in a complex impedance plot; see Figure 6. It can be observed that the shape is evolving as the relative humidity is increasing, which is indicated from conductivity spectra. The corresponding equivalent circuit used for fitting the experimental data and obtained fitting parameters are shown in Figure 6 and given in Table 4, respectively. According to the appropriate equivalent circuit model used, various processes can be identified and separated. The impedance plots, at controlled RH levels, consist of a high-frequency semicircle related to the bulk behavior and a low-frequency spur that emanates from electrode polarization. As shown in Figure 6, with an increase in relative humidity, the high-frequency bulk process is less pronounced and shifts to the edge of the frequency range of the measurements, while at the same time, a low-frequency spur starts to dominate the spectrum for the 2Cu@TNT sample. This observation is in line with the expressed humidity response, which could be attributed to the adsorbed water molecules.

4. Discussion

The Cu-modified vertically aligned TiO2 nanotubes synthesized by anodizing Ti/TiO2 bi-layer thin films, modified with copper using a wet-impregnation method by immersing samples in four different solutions containing Cu(NO3)2 in various concentrations (0.5, 1, 1.5, and 2 M concentrations of Cu(II)), were tested for their photocatalytic and relative humidity sensing properties.
As it can be seen in Figure 4, in 180 min under a UV/Vis irradiation, the maximum concentration of ammonia changed in the presence of different photocatalyst samples, i.e., the initial NH3 concentration in the MPWT reactor decreased by different values. To be specific, for the unmodified TNT sample, NH3 concentration decreased 20.8% in comparison to the baseline. As for the Cu-modified samples, the concentration decreased as follows: 0.5Cu@TNT 40.5%, 1Cu@TNT 41.3%, 1.5Cu@TNT 52.4%, and 2Cu@TNT 62.5%. The sample modified with 2 M Cu showed the highest efficiency for the NH3 removal in comparison to the other samples studied in this work.
The kinetics of the decomposition of NH3 follows the first-order kinetics with given values of the photocatalytic reaction rate constant (k, min−1), suggesting an oxidation mechanism via OH radicals. Usually, conversion to harmless gaseous N2 is not a single-step reaction. It could be comprised of oxidation, firstly to NO or NO2. These oxides immediately undergo redox reactions and are reduced to N2. Reduction of NOx to N2 occurs on the photocatalyst’s surface in the presence of NH3, which acts as a reducing agent [39]. Charge carrier generation (Equation (7)):
TiO2 + hν → eCB + h+VB
h+VB + H2OadsOHads + H+
h+VB + OHadsOHads
eCB + O2ads → O2ads•−
and trapping of the electrons and holes (Equations (8)–(10)), produce hydroxyl (OH) and oxygen radicals on the photocatalyst surface. According to the literature, humidity represents an important factor as the photo-oxidation of NO strongly depends on the presence of the water vapor in the system, and in our case, RH was >90%.
It is widely known that charge transfer capability is the main factor affecting the material’s photocatalytic efficiency. As the results showed, all Cu-modified samples have higher NH3 removal efficiency than the unmodified reference sample (TNT). CuO nanoparticles dispersed on the TiO2 surface promoted the photocatalytic degradation of NH3. That is a consequence of the more efficient photogenerated charge separation; i.e., CuO nanoparticles acted as free electron traps, reducing the fast recombination rate between electrons and holes at the TiO2 surface. As for the 2Cu@TNT sample, the copper concentration was optimal for the maximum increase in photocatalytic activity.
Impedance spectroscopy measurements showed that an increase in conductivity is correlated with an increase in Cu(II) concentration. The 1.5Cu@TNT sample shows a maximum in DC conductivity at RH 30%, whereas a decrease for the 2Cu@TNT sample can be explained by the tendency of Cu(II) ions to act as charge carrier traps [40]. The conductivity spectra for the 2Cu@TNT sample differ significantly from those of the TNT and 1.5Cu@TNT samples. The presence of a DC conductivity plateau, as well as dispersion at higher frequencies, may be seen in the intermediate-frequency region. Moreover, the shape is also affected by the increase in RH, and the pronounced electrode polarization effect starts to dominate the spectra for the high RH; see Figure 5c. Farzaneh et al. [41] showed that Cu-doped TiO2 gives a better humidity response than pure TiO2 films. In our case, for the 2Cu@TNT sample, an increase in RH results in an increase in DC conductivity of one order of magnitude, from 3.57 × 10⁻⁷ (Ω cm)−1 at 30% RH to 4.18 × 10⁻⁶ (Ω cm)−1 at 94% RH, respectively. In the study by Garcia-Belmonte et al. [42], the observed change in conductivity when porous TiO2 is exposed to different relative humidity is explained by the hopping of protons through a percolation cluster formed by adsorbed water molecules. In addition, the enhanced hydrophilicity in doped thin films can be ascribed to an alteration in the surface chemistry because of a greater number of surface defects, such as oxygen vacancies, acting as binding sites for water molecules [40]. Thus, we can say that the 2Cu@TNT sample showed the most pronounced humidity response and change in conductivity in comparison to the other studied samples in this work along with an emphasized polarization effect. The latter is even visible at the lowest relative humidity, which further indicates the particular sensitivity of this sample. The increase in the DC conductivity for sample 2Cu@TNT can be related to an increase in the concentration of charge carriers on the surface of the sample. Additionally, with the change in the shape of conductivity spectra in a whole measured frequency range, we can conclude that any change in humidity influences long-range and short-range charge carriers at the same time. A low resistance is beneficial for charge transfer. The IS measurements showed that 2Cu@TNT has the lowest resistance for RH >90% in comparison to the other samples. Generally speaking, a low resistance has a beneficial influence on charge transfer; i.e., it enhances the utilization of the photogenerated electrons and holes, and it increases the photocatalytic activity. Higher NH3 oxidation is a direct consequence of the increased generation of OH radicals obtained by a more efficient photogenerated charge separation. That is in correlation with the increase in the DC conductivity and with an increase in charge carriers’ concentration on the surface of the given photocatalyst. The 2Cu@TNT sample proved to be the most effective for ammonia oxidation. Therefore, photocatalytic activity results were in agreement with impedance spectroscopy measurements.

5. Conclusions

A low-cost synthesis route was used for preparing immobilized nanostructured Cu-modified TiO2 nanotube arrays used for the ammonia oxidation and relative humidity sensing. The 2Cu@TNT sample demonstrated improved ammonia oxidation together with superior RH sensing properties. The improved photocatalytic activity is a direct consequence of a successful charge carrier separation, which increased the OH generation responsible for NH3 oxidation. Furthermore, the 2Cu@TNT sample showed the most pronounced humidity response and change in conductivity in comparison to the other samples studied in this work. The increase in the DC conductivity can be related to an increase in the concentration of charge carriers on the surface of the sample, which is in agreement with the results obtained from the photocatalytic experiment. These results indicate the possibility of the simultaneous use for the 2Cu@TNT sample, i.e., as a humidity sensor in the photocatalytic reactor that could detect the optimal RH percentage necessary for the successful photocatalytic degradation of ammonia.

Author Contributions

Conceptualization, T.Č.; methodology, T.Č., M.B. and L.P.; validation, A.G. and L.P. and I.G.; formal analysis, I.G., T.Č. and L.P.; investigation, M.R., M.B. and I.G.; resources, A.G. and I.G.; data curation, M.R., M.B. and T.Č.; writing—original draft preparation, T.Č. and M.B.; writing—review and editing, T.Č., I.G., M.B., L.P. and A.G.; visualization, T.Č.; supervision, A.G.; funding acquisition, A.G. and I.G. All authors have read and agreed to the published version of the manuscript.

Funding

This work was supported by the Croatian Science Foundation under the project HrZZ-IP-2018-01-5246, Centre of Excellence for Advanced Materials and Sensing Devices, Ruđer Bošković Institute, Zagreb, Croatia, KK.01.1.1.01.0001, and partially supported by European Regional Development Fund (ERDF) under the projects “Waste & Sun for photocatalytic degradation of micropollutants in water” (OS-Mi), KK.01.1.1.04.0006 and “Recycled rubber & Solar photocatalysis: an innovation for passive air and health protection”, KK.01.1.1.07.0058.

Institutional Review Board Statement

Not applicable.

Informed Consent Statement

Not applicable.

Data Availability Statement

Not applicable.

Conflicts of Interest

The authors declare no conflict of interest.

References

  1. Manisalidis, I.; Stavropoulou, E.; Stavropoulos, A.; Bezirtzoglou, E. Environmental and health impacts of air pollution: A review. Front. Public Health 2020, 8, 14. [Google Scholar] [CrossRef] [PubMed] [Green Version]
  2. Lan, Y.; Lu, Y.; Ren, Z. Mini review on photocatalysis of titanium dioxide nanoparticles and their solar applications. Nano Energy 2013, 2, 1031–1045. [Google Scholar] [CrossRef]
  3. Obata, K.; Kishishita, K.; Okemoto, A.; Taniya, K.; Ichihashi, Y.; Nishiyama, S. Photocatalytic decomposition of NH3 over TiO2 catalysts doped with Fe. Appl. Catal. B 2014, 160, 200–203. [Google Scholar] [CrossRef]
  4. Kisslinger, R.; Askar, A.M.; Thakur, U.K.; Riddell, S.; Dahunsi, D.; Zhang, Y.; Zeng, S.; Goswami, A.; Shankar, K. Preferentially oriented TiO2 nanotube arrays on non-native substrates and their improved performance as electron transporting layer in halide perovskite solar cells. Nanotechnology 2019, 30, 204003. [Google Scholar] [CrossRef] [PubMed]
  5. Capelli, I.; Fort, A.; Grasso, A.L.; Panzardi, E.; Mugnaini, M.; Vignoli, V. RH sensing by means of TiO2 nanoparticles: A comparison among different sensing techniques based on modeling and chemical/physical interpretation. Chemosensors 2020, 8, 89. [Google Scholar] [CrossRef]
  6. Nyankson, E.; Agyei-Tuffour, B.; Asare, J.; Annan, E.; Rwenyagila, E.R.; Konadu, D.S.; Yaya, A.; Dodoo-Arhin, D. Nanostructured TiO2 and their energy applications—A review. ARPN J. Eng. Appl. Sci. 2013, 8, 17. [Google Scholar]
  7. Zhang, J.; Shi, C.; Chen, J.; Wang, Y.; Li, M. Preparation of ultra-thin and high-quality WO3 compact layers and comparison of WO3 and TiO2 compact layer thickness in planar perovskite solar cells. J. Solid State Chem. 2016, 238, 223–228. [Google Scholar] [CrossRef]
  8. Farahani, E.; Mohammadpour, R. Fabrication of flexible self-powered humidity sensor based on super-hydrophilic titanium oxide nanotube arrays. Sci. Rep. 2020, 10, 13032. [Google Scholar] [CrossRef]
  9. Wang, Q.; Pan, Y.Z.; Huang, S.S.; Ren, S.T.; Li, P.; Li, J.J. Resistive and capacitive response of nitrogen-doped TiO2 nanotubes film humidity sensor. Nanotechnology 2011, 22, 025501. [Google Scholar] [CrossRef]
  10. Mohan, L.; Dennis, C.; Padmapriya, N.; Anandan, C.; Rajendran, N. Effect of electrolyte temperature and anodization time on formation of TiO2 nanotubes for biomedical applications. Mater. Today Commun. 2020, 23, 101103. [Google Scholar] [CrossRef]
  11. Wang, J.; Lin, Z. Anodic formation of ordered TiO2 nanotube arrays: Effects of electrolyte temperature and anodization potential. J. Phys. Chem. C 2009, 113, 4026–4030. [Google Scholar] [CrossRef]
  12. Shakeel, M.; Jabeen, F.; Shabbir, S.; Asghar, M.S.; Khan, M.S.; Chaudhry, A.S. Toxicity of nano-titanium dioxide (TiO2-NP) through various routes of exposure: A review. Biol. Trace Elem. Res. 2016, 172, 1–36. [Google Scholar] [CrossRef]
  13. Farsinezhad, S.; Mohammadpour, A.; Dalrymple, A.N.; Geisinger, J.; Kar, P.; Brett, M.J.; Shankar, K. Transparent anodic TiO2 nanotube arrays on plastic substrates for disposable biosensors and flexible electronics. J. Nanosci. Nanotech. 2013, 13, 2885–2891. [Google Scholar] [CrossRef] [PubMed]
  14. Liang, H.; Li, X.; Nowotny, J. Photocatalytical properties of TiO2 nanotubes. Solid State Phenom. 2010, 162, 295–328. [Google Scholar] [CrossRef] [Green Version]
  15. Wen, Y.; Liu, B.; Zeng, W.; Wang, Y. Plasmonic photocatalysis properties of au nanoparticles precipitated anatase/rutile mixed TiO2 nanotubes. Nanoscale 2013, 5, 9739. [Google Scholar] [CrossRef]
  16. Čižmar, T.; Panžić, I.; Salamon, K.; Grčić, I.; Radetić, L.; Marčec, J.; Gajović, A. Low-cost synthesis of Cu-modified immobilized nanoporous TiO2 for photocatalytic degradation of 1H-Benzotriazole. Catalysts 2020, 10, 19. [Google Scholar] [CrossRef] [Green Version]
  17. Čižmar, T.; Panžić, I.; Capan, I.; Gajović, A. Nanostructured TiO2 photocatalyst modified with Cu for improved imidacloprid degradation. Appl. Surf. Sci. 2021, 569, 151026. [Google Scholar] [CrossRef]
  18. Hejazi, S.; Mohajernia, S.; Wu, Y.; Andryskova, P.; Zoppellaro, G.; Hwang, I.; Tomanec, O.; Zboril, R.; Schmuki, P. Intrinsic Cu nanoparticle decoration of TiO2 nanotubes: A platform for efficient noble metal free photocatalytic H2 production. Electrochem. Commun. 2019, 98, 82–86. [Google Scholar] [CrossRef]
  19. Momeni, M.M.; Ghayeb, Y.; Ghonchegi, Z. Fabrication and characterization of copper doped TiO2 nanotube arrays by in situ electrochemical method as efficient visible-light photocatalyst. Ceram. Int. 2015, 41, 8735–8741. [Google Scholar] [CrossRef]
  20. Zaki, S.M.; Sreekantan, S. Preparation and characterization of Cu loaded TiO2 nanotube arrays and their photocatalytic activity. Adv. Mater. Res. 2011, 364, 377–381. [Google Scholar] [CrossRef]
  21. Zhu, J.; Jian, Y.; Long, D.; Wang, H.; Zeng, Y.; Li, J.; Xiao, R.; Pu, S. Degradation of ammonia gas by Cu2O/{001}TiO2 and its mechanistic analysis. RSC Adv. 2021, 11, 3695–3702. [Google Scholar] [CrossRef]
  22. Wu, H.; Ma, J.; Li, Y.; Zhang, C.; He, H. Photocatalytic oxidation of gaseous ammonia over fluorinated TiO2 with exposed (001) Facets. Appl. Catal. B 2014, 152, 82–87. [Google Scholar] [CrossRef]
  23. Sopyan, I. Kinetic analysis on photocatalytic degradation of gaseous acetaldehyde, ammonia and hydrogen sulfide on Nanosized porous TiO2 films. Sci. Technol. Adv. Mater. 2007, 8, 33–39. [Google Scholar] [CrossRef]
  24. Kočí, K.; Reli, M.; Troppová, I.; Prostějovský, T.; Žebrák, R. Degradation of ammonia from gas stream by advanced oxidation processes. J. Environ. Sci. Health. Part A 2019, 55, 433–437. [Google Scholar] [CrossRef]
  25. Yuzawa, H.; Mori, T.; Itoh, H.; Yoshida, H. Reaction mechanism of ammonia decomposition to nitrogen and hydrogen over metal loaded titanium oxide photocatalyst. J. Phys. Chem. C 2012, 116, 4126–4136. [Google Scholar] [CrossRef]
  26. Grčić, I.; Marčec, J.; Radetić, L.; Radovan, A.M.; Melnjak, I.; Jajčinović, I.; Brnardić, I. Ammonia and methane oxidation on TiO2 supported on glass fiber mesh under artificial solar irradiation. Environ. Sci. Pollut. Res. 2020, 28, 18354–18367. [Google Scholar] [CrossRef] [PubMed]
  27. Wang, B.; Zhao, Y.; Hu, L.; Cao, J.; Gao, F.; Liu, Y.; Wang, L. Improved and excellent CO sensing properties of Cu-doped TiO2 nanofibers. Chin. Sci. Bull. 2010, 55, 228–232. [Google Scholar] [CrossRef]
  28. Lupan, O.; Santos-Carballal, D.; Ababii, N.; Magariu, N.; Hansen, S.; Vahl, A.; Zimoch, L.; Hoppe, M.; Pauporté, T.; Galstyan, V.; et al. TiO2/Cu2O/CuO multi-nanolayers as sensors for H2 and volatile organic compounds: An experimental and theoretical investigation. ACS Appl. Mater. Interfaces 2021, 13, 32363–32380. [Google Scholar] [CrossRef] [PubMed]
  29. Vathani, A.M. Synthesis and electrochemical studies on Cu-TiO2 thin films deposited by spray pyrolysis technique for sensing uric acid. Int. J. Nano Dimens. 2019, 10, 230–241. [Google Scholar]
  30. Singh, A.K.; Patil, S.B.; Nakate, U.T.; Gurav, K.V. Effect of Pd and Au sensitization of bath deposited flowerlike TiO2 thin films on CO sensing and photocatalytic properties. J. Chem. 2013, 2013, 370578. [Google Scholar] [CrossRef] [Green Version]
  31. Sagadevan, S.; Lett, J.A.; Weldegebrieal, G.K.; ud Dowla Biswas, M.R.; Oh, W.C.; Alshahateet, S.F.; Fatimah, I.; Mohammad, F.; Al-Lohedan, H.A.; Paiman, S.; et al. Enhanced gas sensing and photocatalytic activity of reduced graphene oxide loaded TiO2 nanoparticles. Chem. Phys. Lett. 2021, 780, 138897. [Google Scholar] [CrossRef]
  32. Zou, R.; He, G.; Xu, K.; Liu, Q.; Zhang, Z.; Hu, J. ZnO Nanorods on reduced graphene sheets with excellent field emission, gas sensor and photocatalytic properties. J. Mater. Chem. A 2013, 1, 8445. [Google Scholar] [CrossRef]
  33. Cao, Q.-L.; Yu, Q.; Han, C.; Dong, G.-Y.; Fu, L. Sensing and photocatalytic properties of two Zinc(II) coordination polymers containing Bis(Benzimidazole) ligands. Polyhedron 2021, 203, 115237. [Google Scholar] [CrossRef]
  34. Ding, Q.; Pan, Y.; Luo, Y.; Zhou, M.; Guan, Y.; Li, B.; Trivedi, M.; Kumar, A.; Liu, J. Photocatalytic and ferric ion sensing properties of a new three-dimensional metal–organic framework based on cuboctahedral secondary building units. ACS Omega 2019, 4, 10775–10783. [Google Scholar] [CrossRef] [PubMed] [Green Version]
  35. Assadi, A.A.; Bouzaza, A.; Wolbert, D. Photocatalytic oxidation of trimethylamine and isovaleraldehyde in an annular reactor: Influence of the mass transfer and the relative humidity. J. Photochem. Photobiol. A Chem. 2012, 236, 61–69. [Google Scholar] [CrossRef]
  36. Tepe, O.; Dursun, A.Y. Combined effects of external mass transfer and biodegradation rates on removal of phenol by immobilized Ralstonia eutropha in a packed bed reactor. J. Hazard. Mater. 2008, 151, 9–16. [Google Scholar] [CrossRef]
  37. Grčić, I.; Papić, S.; Brnardić, I. Photocatalytic activity of TiO2 thin films: Kinetic and efficiency study. Int. J. Chem. React. Eng. 2017, 16, 20160153. [Google Scholar] [CrossRef]
  38. Coronado, J.M.; Hernandez-Alonso, M.D. Design of advanced photocatalytic materials for energy and environmental applications. In Design of Advanced Photocatalytic Materials for Energy and Environmental Applications, 1st ed.; Coronado, J.M., Fresno, F., Hernández-Alonso, M.D., Portela, R., Eds.; Springer: London, UK, 2013; pp. 5–35. [Google Scholar]
  39. Lasek, J.; Yu, Y.-H.; Wu, J.C.S. Removal of NOx by photocatalytic processes. J. Photochem. Photobiol. C Photochem. 2013, 14, 29–52. [Google Scholar] [CrossRef]
  40. Garlisi, C.; Lai, C.Y.; George, L.; Chiesa, M.; Palmisano, G. Relating photoelectrochemistry and wettability of sputtered Cu-and N-doped TiO2 thin films via an integrated approach. J. Phys. Chem. C. 2018, 122, 12369–12376. [Google Scholar] [CrossRef]
  41. Farzaneh, A.; Mohammadzadeh, A.; Esrafili, M.D.; Mermer, O. Experimental and theoretical study of TiO2 based nanostructured semiconducting humidity sensor. Ceram. Int. 2019, 45, 8362–8369. [Google Scholar] [CrossRef]
  42. Garcia-Belmonte, G.; Kytin, V.; Dittrich, T.H.; Bisquert, J. Effect of humidity on the Ac conductivity of nanoporous TiO2. J. Appl. Phys. 2003, 94, 5261–5264. [Google Scholar] [CrossRef]
Figure 1. Schematic representation of MPWT reactor.
Coatings 11 01500 g001
Figure 2. XRD diffractograms of Cu-modified nanostructured TiO2.
Coatings 11 01500 g002
Figure 3. FE-SEM micrographs of (a) unmodified (TNT) and (b) Cu-modified TiO2 (2Cu@TNT).
Coatings 11 01500 g003
Figure 4. (a) Comparison of determined model values (calculated Ci) and experimentally determined NH3 in the reactor outlet (Ci, out) during photocatalytic experiments in MPWT. The presented time scale is correlated only with the irradiation period (adsorption in dark was omitted). (b) The baseline NH3 concentration for each photocatalyst.
Coatings 11 01500 g004
Figure 5. Conductivity spectra for selected samples measured under controlled relative humidity (30%, 75%, and 94%): (a) TNT, (b) 1.5Cu@TNT, (c) 2Cu@TNT.
Coatings 11 01500 g005
Figure 6. Complex impedance spectra for sample 2Cu@TNT measured at various relative humidity: (a) 30%, (b) 75%, and (c) 94%. The symbols (colored open squares) denote experimental values, whereas the solid magenta line corresponds to the best fit. The corresponding equivalent circuit model, comprised of multiple parallel combinations of the resistor (R) and the constant-phase element (CPE), used for fitting the data of an individual spectrum, and its interpretation is shown in each figure (defined as follows: b—bulk phase, and el—electrode polarization).
Coatings 11 01500 g006
Table 1. The average percentage of O, Ti, and Cu for each photocatalyst.
ElementAtomic %
0.5Cu@TNT1Cu@TNT1.5Cu@TNT2Cu@TNT
O55.4 ± 0.454.2 ± 0.553.4 ± 0.452.1 ± 0.3
Ti44.3 ± 0.245.2 ± 0.345.5 ± 0.246.3 ± 0.4
Cu0.3 ± 0.20.6 ± 0.31.1 ± 0.31.6 ± 0.2
Table 2. The modeling results: the apparent reaction rate constants.
Photocatalystkapp, s−1
TNT0.00035
0.5Cu@TNT0.00024
1Cu@TNT0.00038
1.5Cu@TNT0.00044
2Cu@TNT0.00047
Table 3. Summary of model parameters and irradiation conditions.
Model ParameterPhotocatalyst
TNT0.5Cu@TNT1Cu@TNT1.5Cu@TNT2Cu@TNT
km, NH3, cm min−10.5693
kp,int, NH3, cm1.5 mW−0.5 min−13.59 × 10−63.53 × 10−63.56 × 10−63.57 × 10−63.60 × 10⁻⁶
D ^ NH3, cm2 min−10.18
μUVA, cm−14.95 × 1041.45 × 104
μUVB, cm−11.33 × 1056.30 × 104
Pvis, mW cm−30050,000120,000165,000
I0@photocatalytic surface, mW cm−2I0, UVA = 0.571
I0, UVB = 0.678
as, cm2 g−176,923.07
Table 4. Selected parameters obtained from EEC modeling and fitting the complex impedance data for sample 2MCu@TNT measured under various relative humidity, along with calculated corresponding DC conductivity, σDC for selected samples.
SampleRelative Humidity (%)Ra/(Ω)
± 0.5%
σDCb/(Ω cm)−1
± 0.5%
TNT307.94 × 1051.26 × 10−6
1.5Cu@TNT302.19 × 1054.57 × 10−6
2Cu@TNT30
75
94
2.67 × 10⁶
3.70 × 10⁵
2.39 × 10⁵
3.57 × 10⁻⁷
2.70 × 10⁻⁶
4.18 × 10⁻⁶
a Individual value obtained by EEC. b Individual value calculated from the equation σDC = 1/R.
Publisher’s Note: MDPI stays neutral with regard to jurisdictional claims in published maps and institutional affiliations.

