Article

Structural Characteristics and Sliding Friction Properties of 40CrNiMo Steel after Broadband Laser Hardening

1
State Key Laboratory of High-Performance and Complex Manufacturing, Central South University, Changsha 410083, China
2
College of Mechanical and Electrical Engineering, Central South University, Changsha 410083, China
3
College of Mechanical Engineering, Hunan Industry Polytechnic, Changsha 410208, China
*
Authors to whom correspondence should be addressed.
Coatings 2021, 11(11), 1282; https://doi.org/10.3390/coatings11111282
Submission received: 4 September 2021 / Revised: 15 October 2021 / Accepted: 18 October 2021 / Published: 21 October 2021

Abstract

:
The surface of 40CrNiMo steel, which is commonly used for the sprag clutch wedge, is prone to wear. In this study, hardening of the matrix material was conducted by broadband-laser scanning at various scanning speeds. The hardness distribution and structure evolution were analyzed along the vertical direction. Characteristics of the hardened layer were explored using scanning electron microscopy, transmission electron microscopy, and X-ray diffractometry. The friction coefficient, wear amount, and wear morphology of sliding friction against GCr15 steel were investigated under various conditions. The results show that the depth of the hardened zone decreases with increasing scanning speed. Under the experimental power and defocus, a laser scanning speed between 700–1020 mm/min can meet the general surface requirements of the sprag clutch wedge. After laser hardening, the main components of the hardened layer included lath-shaped and needle-shaped martensite and retained austenite. In terms of friction and wear, when the relative movement speed was within 300–500 mm/min, the relative movement speed decreased and the normal force increased, which led to an increase in the friction coefficient and its fluctuation, as well as an increase in wear volume of the hardened layer. The wear mechanism of the hardened layer included abrasive wear, adhesive wear, and oxidative wear. Excessive normal force resulted in obvious delamination of the sample. Within the scope of the experiment, the best laser hardening results were obtained with a scanning speed of 800 mm/min.

1. Introduction

Wear of the sprag clutch wedge often occurs during service, and failure due to surface wear is a prominent problem that can seriously affect the service life of the sprag clutch. As a material for manufacturing the wedge, improving the surface quality of 40CrNiMo steel by ordinary heat treatments is time-consuming. In order to improve the surface properties of 40CrNiMo steel, Li et al. [1] used low-temperature laser shot peening (CLP) to surface treatment of 40CrNiMo steel. It was found that CLP can effectively improve the microhardness and produce a large number of ultra-fine twins with high-density dislocation structure. The crystal grains significantly reduced the wear quality loss and improved the high temperature wear performance. However, the requirements for experimental conditions are relatively high. Liu et al. [2] discussed the microstructure and composition of niobiumizing layer of carburized and subsequently niobiumized 40CrNiMo steel. The results indicated that the main phases are NbC and Nb6C5 in the niobiumized layer, and the loss of weight of carburized and subsequently niobiumizing strengthening specimens was 58.4% of conventional strengthening ones. Laser hardening is a relatively new surface treatment technology that uses a laser to heat the surface of a material to above its phase transition point. Hardening occurs as the surface of the material cools. The approach offers several advantages such as short heating times, low surface roughness, and convenient operation [3].
Many scholars have theoretically analyzed the characteristics of laser hardening. For example, Wang et al. [4] calculated the laser absorption rate of an actual surface with fractal properties and proposed an algorithm for tracking multiple reflection paths of light passing through the rough surface structure. Fakir et al. [5] proposed a numerical method for predicting the temperature distribution in cylindrical specimens made of AISI 4340 steel based on laser surface hardening parameters. Mosavi et al. [6] introduced a mathematical model to calculate the temperature distribution during laser quenching. Temperature exhibited a Gaussian distribution on the horizontal axis and exponentially decreased along the horizontal and vertical directions. These research results confirmed that the laser energy transferred to the surface of the object determined the surface temperature, and the temperature distribution presented a certain law, which provided support for predicting the size of the phase transition area and other content. The theoretical research was helpful for practical applications.
Research on laser hardening has also been performed using experimental methods. For example, aiming at the fatigue problem of 40CrNiMo steel, Kong et al. [7] carried out a tensile–tensile fatigue test on the surface of 40CrNiMo high-strength steel which was quenched and strengthened with a CO2 laser, and the fatigue limit of the specimen before and after laser quenching was found by the Locati method. The results showed that after laser quenching, a strengthening layer, martensite, and residual compressive stress are formed on the surface of the sample, which significantly increased the fatigue strength of 40CrNiMo. In addition, after laser quenching, the source of fatigue cracks of the specimens originated in the subsurface layer of the specimens, and the process of extending to fracture is relatively slow. Anusha et al. [8] analyzed the strengthened layer of 100Cr6 bearing steel treated with a pulsed laser. While the surface friction coefficient was reduced, the inner performance remained unchanged. Chen et al. [9] studied the characteristics of D1 wheel steel after partial laser hardening. The hardening process accelerated surface spalling damage and led to uneven wear. Wagh et al. [10] maximized the surface hardness depth of CK45 steel components by controlling the power, scanning speed, and distance of the laser beam. Shariff et al. [11] studied diode-laser surface treatment of rail steel and showed that the thickness of the hardened layer is controlled by process parameters and properties of the base steel. Furthermore, Idan et al. [12] used a 500 W fiber laser to improve the efficiency in hardening of ICD-5 tool steel and showed that laser power density determines the hardening efficiency. Buling et al. [13] studied the effect of laser pretreatment on the surface structure and microhardness of 100Cr6 steel. The optimal parameter settings resulted in the formation of very hard white etching zones and changes in morphology. Ganeev [14] investigated the effect of low-power CO2 laser irradiation on the surface hardness of steel. Laser irradiation effectively improved the microhardness of surfaces of low-carbon and medium-carbon steels. Taniet et al. [15] predicted optimal process parameters for axisymmetric hollow AISI 420B martensitic stainless steel mechanical parts. Farshidianfaret et al. [16] developed an automatic real-time thermal monitoring system for studying single-track laser heat treated samples made of AISI 1020 low carbon steel and evaluated thermal changes under various input process parameters. Through these studies, some conclusions that were helpful to the development of technology had been obtained. For example, the effect of laser hardening was related to the characteristics of materials, process parameters, and other factors. The area affected by laser hardening was controllable, but the analysis of the influence law for more materials with specific requirements was very important. Scholars have also analyzed the friction and wear behavior of materials. For example, Cozza [17] studied the influence of multiple factors on the friction coefficient of the ball pit wear test. In general, the abrasive slurry concentration and abrasive wear mode did not affect the magnitude of the friction coefficient. Gomez et al. [18] mixed two grinding powders with different abrasive grain sizes in various mass fractions and carried out abrasion tests on ASTM 1020 carbon steel. The mass fraction of the original powder has a significant impact on wear patterns observed on the microscopic scale. Baptista et al. [19] studied the influence of the ball surface texture on micro-wear and found that as the ball surface roughness and size of abrasive particles increase, the abrasive wear mechanism evolves from rolling abrasion to grooving abrasion. García-León et al. [20] statistically analyzed specific wear rate, wear depth, and friction coefficient as response variables to evaluate the influence of various wear factors. It can be seen that the research on friction coefficient, wear rate, and wear mode had received extensive attention, and the conclusions also provided support for follow-up research. As the friction objects were diverse, it was necessary to carry out targeted research.
At present, there are only a few examples of using laser hardening to strengthen clutch materials. There is still room for further research on the change of the structure characteristics of laser hardening and friction performance, which can be adapted to the working conditions of the clutch. In this paper, the use of laser broadband hardening for strengthening the surface of 40CrNiMo steel was explored. The hardness distribution was analyzed under different scanning speeds, and suitable parameters were obtained according to the hardness requirements of the sprag clutch. The structure and characteristics of the laser hardened 40CrNiMo steel were analyzed using scanning electron microscopy, transmission electron microscopy, and X-ray diffractometry. In addition, the sliding friction properties against GCr15 were analyzed under different relative movement speeds and normal force. This study provides a reliable basis for application of laser hardening to strengthen the surface of 40CrNiMo steel.

2. Experimental Procedure

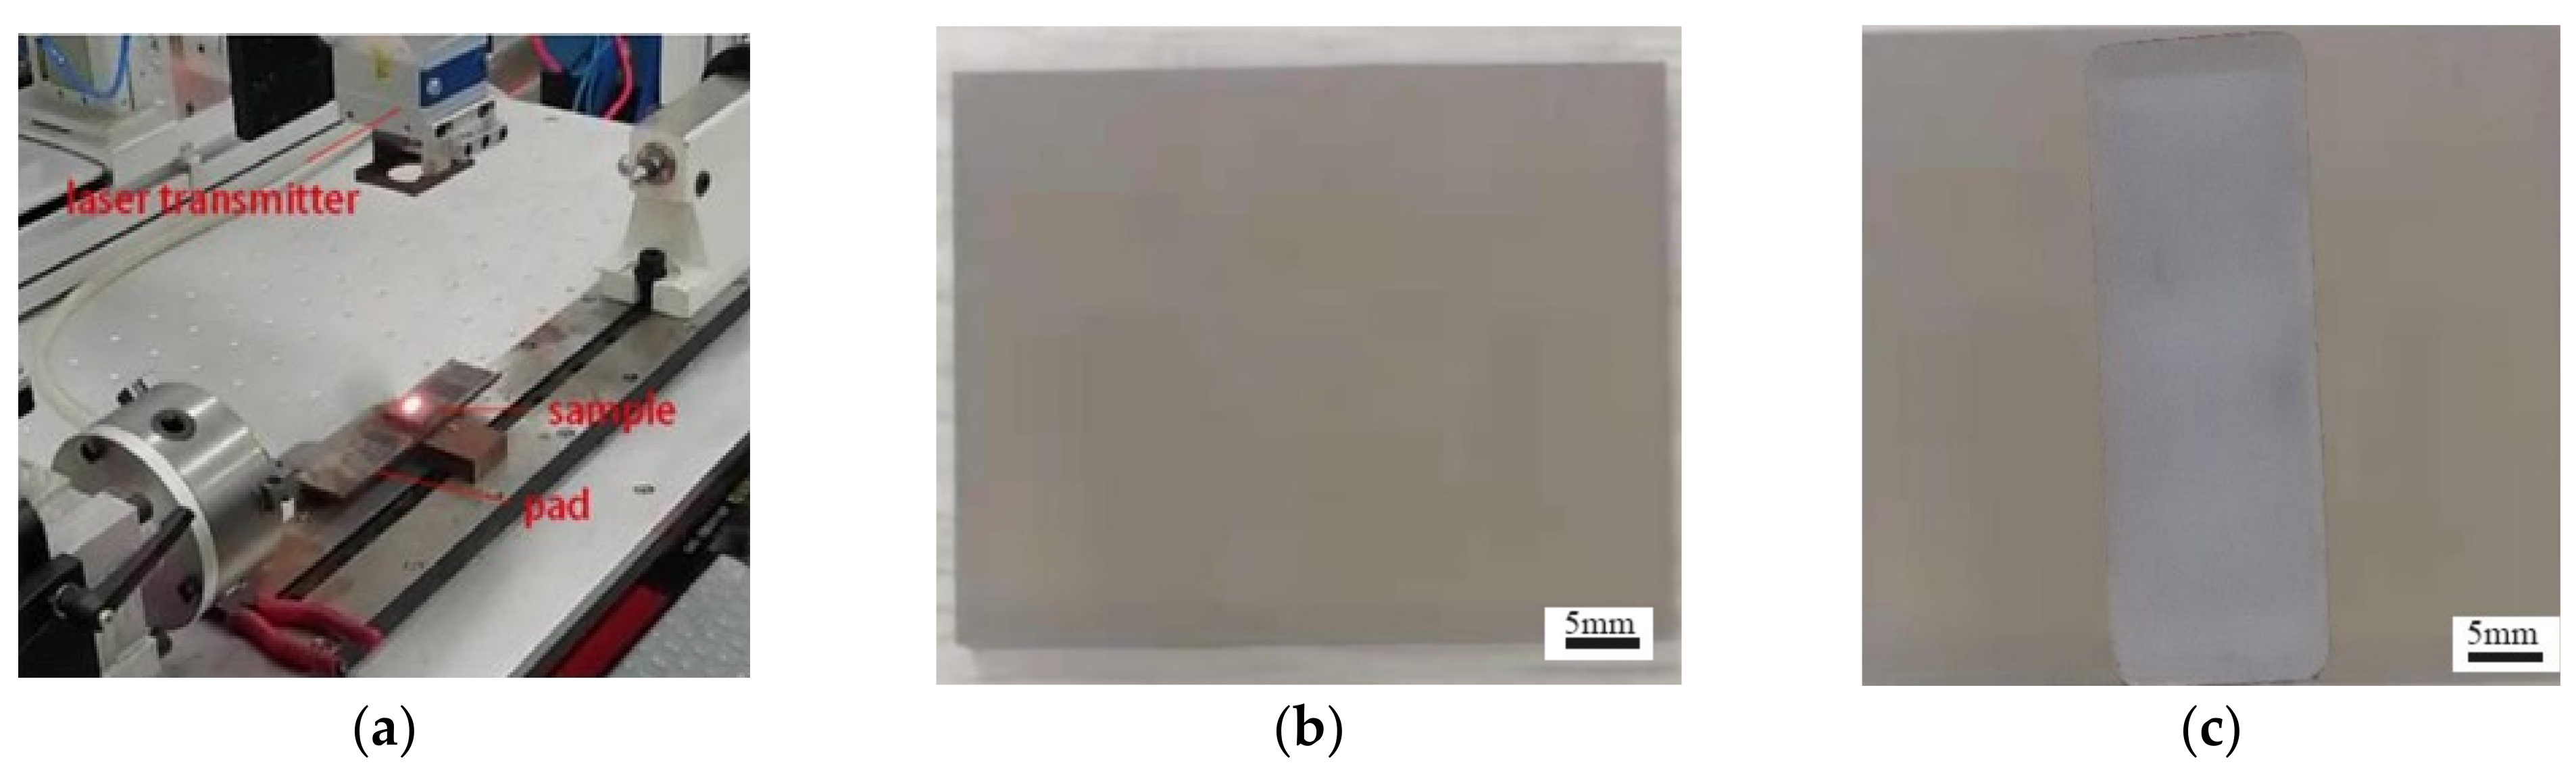
2.1. Sample Processing and Preparation

The material used in the experiment was 40CrNiMo steel, which was provided by Daye Special Steel Co. Ltd., Huangshi, China. From the product qualification certificate, the chemical composition and the initial hardness were known. The main chemical components are listed in Table 1.
The initial hardness of the material was about 320 HV0.5. Samples with dimensions of 50 mm × 40 mm × 6 mm were cut using a DK7720 electrical-discharge wire-cutting machine (Renzong CNC Technology Co. Ltd., Suzhou, China). An M7120 surface grinder (Jingchi Precision Machinery Equipment Co. Ltd., Guangzhou, China) was used form mechanical surface finishing to a roughness of Ra 0.32 μm. The samples were then ultrasonically cleaned in absolute ethanol for 15 min and dried using a hair dryer on the cool air setting. A fiber laser was used for laser hardening experiments, without surface gloss. Generally, the surface hardness of the clutch wedge should be 61.0–66.0 HRC.

2.2. Experimental Method

Laser hardening was carried out using a ZKSX-3000-D01 fiber laser quenching machine (ZhongkeSixiang Laser Technology Co. Ltd., Zhenjiang, China) with a power range of 1000–3000 W. Experiments were performed at 2010 W. The scanning speed was 600–1200 mm/min, the spot size was 1 mm × 14 mm, and the defocus was 192 mm. The laser hardening process is shown in Figure 1.
The HVS-1000Z automatic turret digital display microhardness tester was used to detect the hardness distribution characteristics of cross sections. The load was 0.5 N, and the loading time was 10 s. Samples with the best surface quality, surface hardness, and depth of hardening layer were selected. The cross sections of the samples were smoothed with water-abrasive paper, then the samples were polished and corroded for 8 s using a 4% nitric acid alcohol solution. The microstructure was observed using an Olympus BX53M metallurgical microscope and Sigma300 field emission scanning electron microscope (Zeiss, Oberkochen, Germany).
To obtain deeper understanding of the characteristics of the hardened layer, a DK7720 computer numerical control (CNC) wire electrical discharge machining (EDM) machine (Changde Machinery Manufacturing Co. Ltd., Taizhou, China) was used to cut laser hardened samples into discs with a thickness of about 0.8 mm and a diameter of Φ 3 mm. Water SiC abrasive paper with grit sizes of 12.6, 10.3, 3.5, and 1 μm was used to grind and polish both sides of the samples to about 40 μm. The small round samples were pitted with a GATAN656 pit tester, then thinned with the GATAN691 ion thinner to obtain the final sample. A JEM-2100 transmission electron microscope (JEOL, Tokyo, Japan) was used to observe the microstructure.
Typical laser surface hardening was performed using a D/MAX RAPID IIR X-ray diffractometer (Rigaku, Tokyo, Japan). In X-ray examination, copper target was used to produce Kα line with a wave length of 1.54056 Å. The voltage was 40 kV, the current was 250 mA, the test time was 20 min, the spot diameter was 100 µm, and the spot center was on the surface of the hardened layer.
To analyze friction and wear of the material before and after hardening under different conditions, a CFI-1 friction and wear testing machine was used to conduct multiple friction tests. The equipment is shown in Figure 2.
GCr15 (62.0–65.0 HRC) is a common material used for manufacturing the inner and outer rings of clutches. As friction is generated between the clutch and the wedge, friction and wear tests were carried out using a GCr15steel ball (62.0–65.0 HRC) with a diameter of 6.35 mm and surface roughness Ra of 0.32 μm. The ball was heat-treated via oil quenching at 1150 °C and tempering at 565 °C for 2 h. During the experiment, the ball was clamped by the fixture and the sample was fixed to the working platform with a ring-shaped fixture. A motor was used to drive linear reciprocating motion of the sample. The reciprocating length was 5 mm. The influence of relative movement speed and normal force on friction properties was analyzed.
Specifically, considering the typical working conditions of a clutch, the following conditions were used in the experiment: a normal force of 20 N, temperature of 20 °C, humidity of 55%, experiment time of 20 min, and the reciprocating speed of the sample was set to 300, 400, or 500 mm/min. The ambient temperature was controlled by Gree KFR-72LW air conditioner. The ambient humidity was controlled by Yangtze CS10E dehumidifier.
Three experiments were carried out for each case and the average value was used as the experimental result. A relative movement speed of 500 mm/min was selected and a normal force of 20, 50, or 80 N was applied to the best samples. Three experiments were carried out for each case and the average value was used as the experimental result.
The mass of the sample was measured before and after the test using a Mettler XP56 electronic balance with an accuracy of 0.001 mg. The surface morphology of each sample was observed after the test using either a Zeiss Sigma300 scanning electron microscope or TESCAN Mira 3 scanning electron microscope (TESCAN, Brno, Czech Republic).

3. Results and Analysis

3.1. Hardness before Laser Hardening

The hardness of five adjacent points in the center of the surface was measured before laser hardening. The average Vickers hardness was about 320 HV0.5, which is equivalent to a Rockwell hardness of 32.2 HRC.

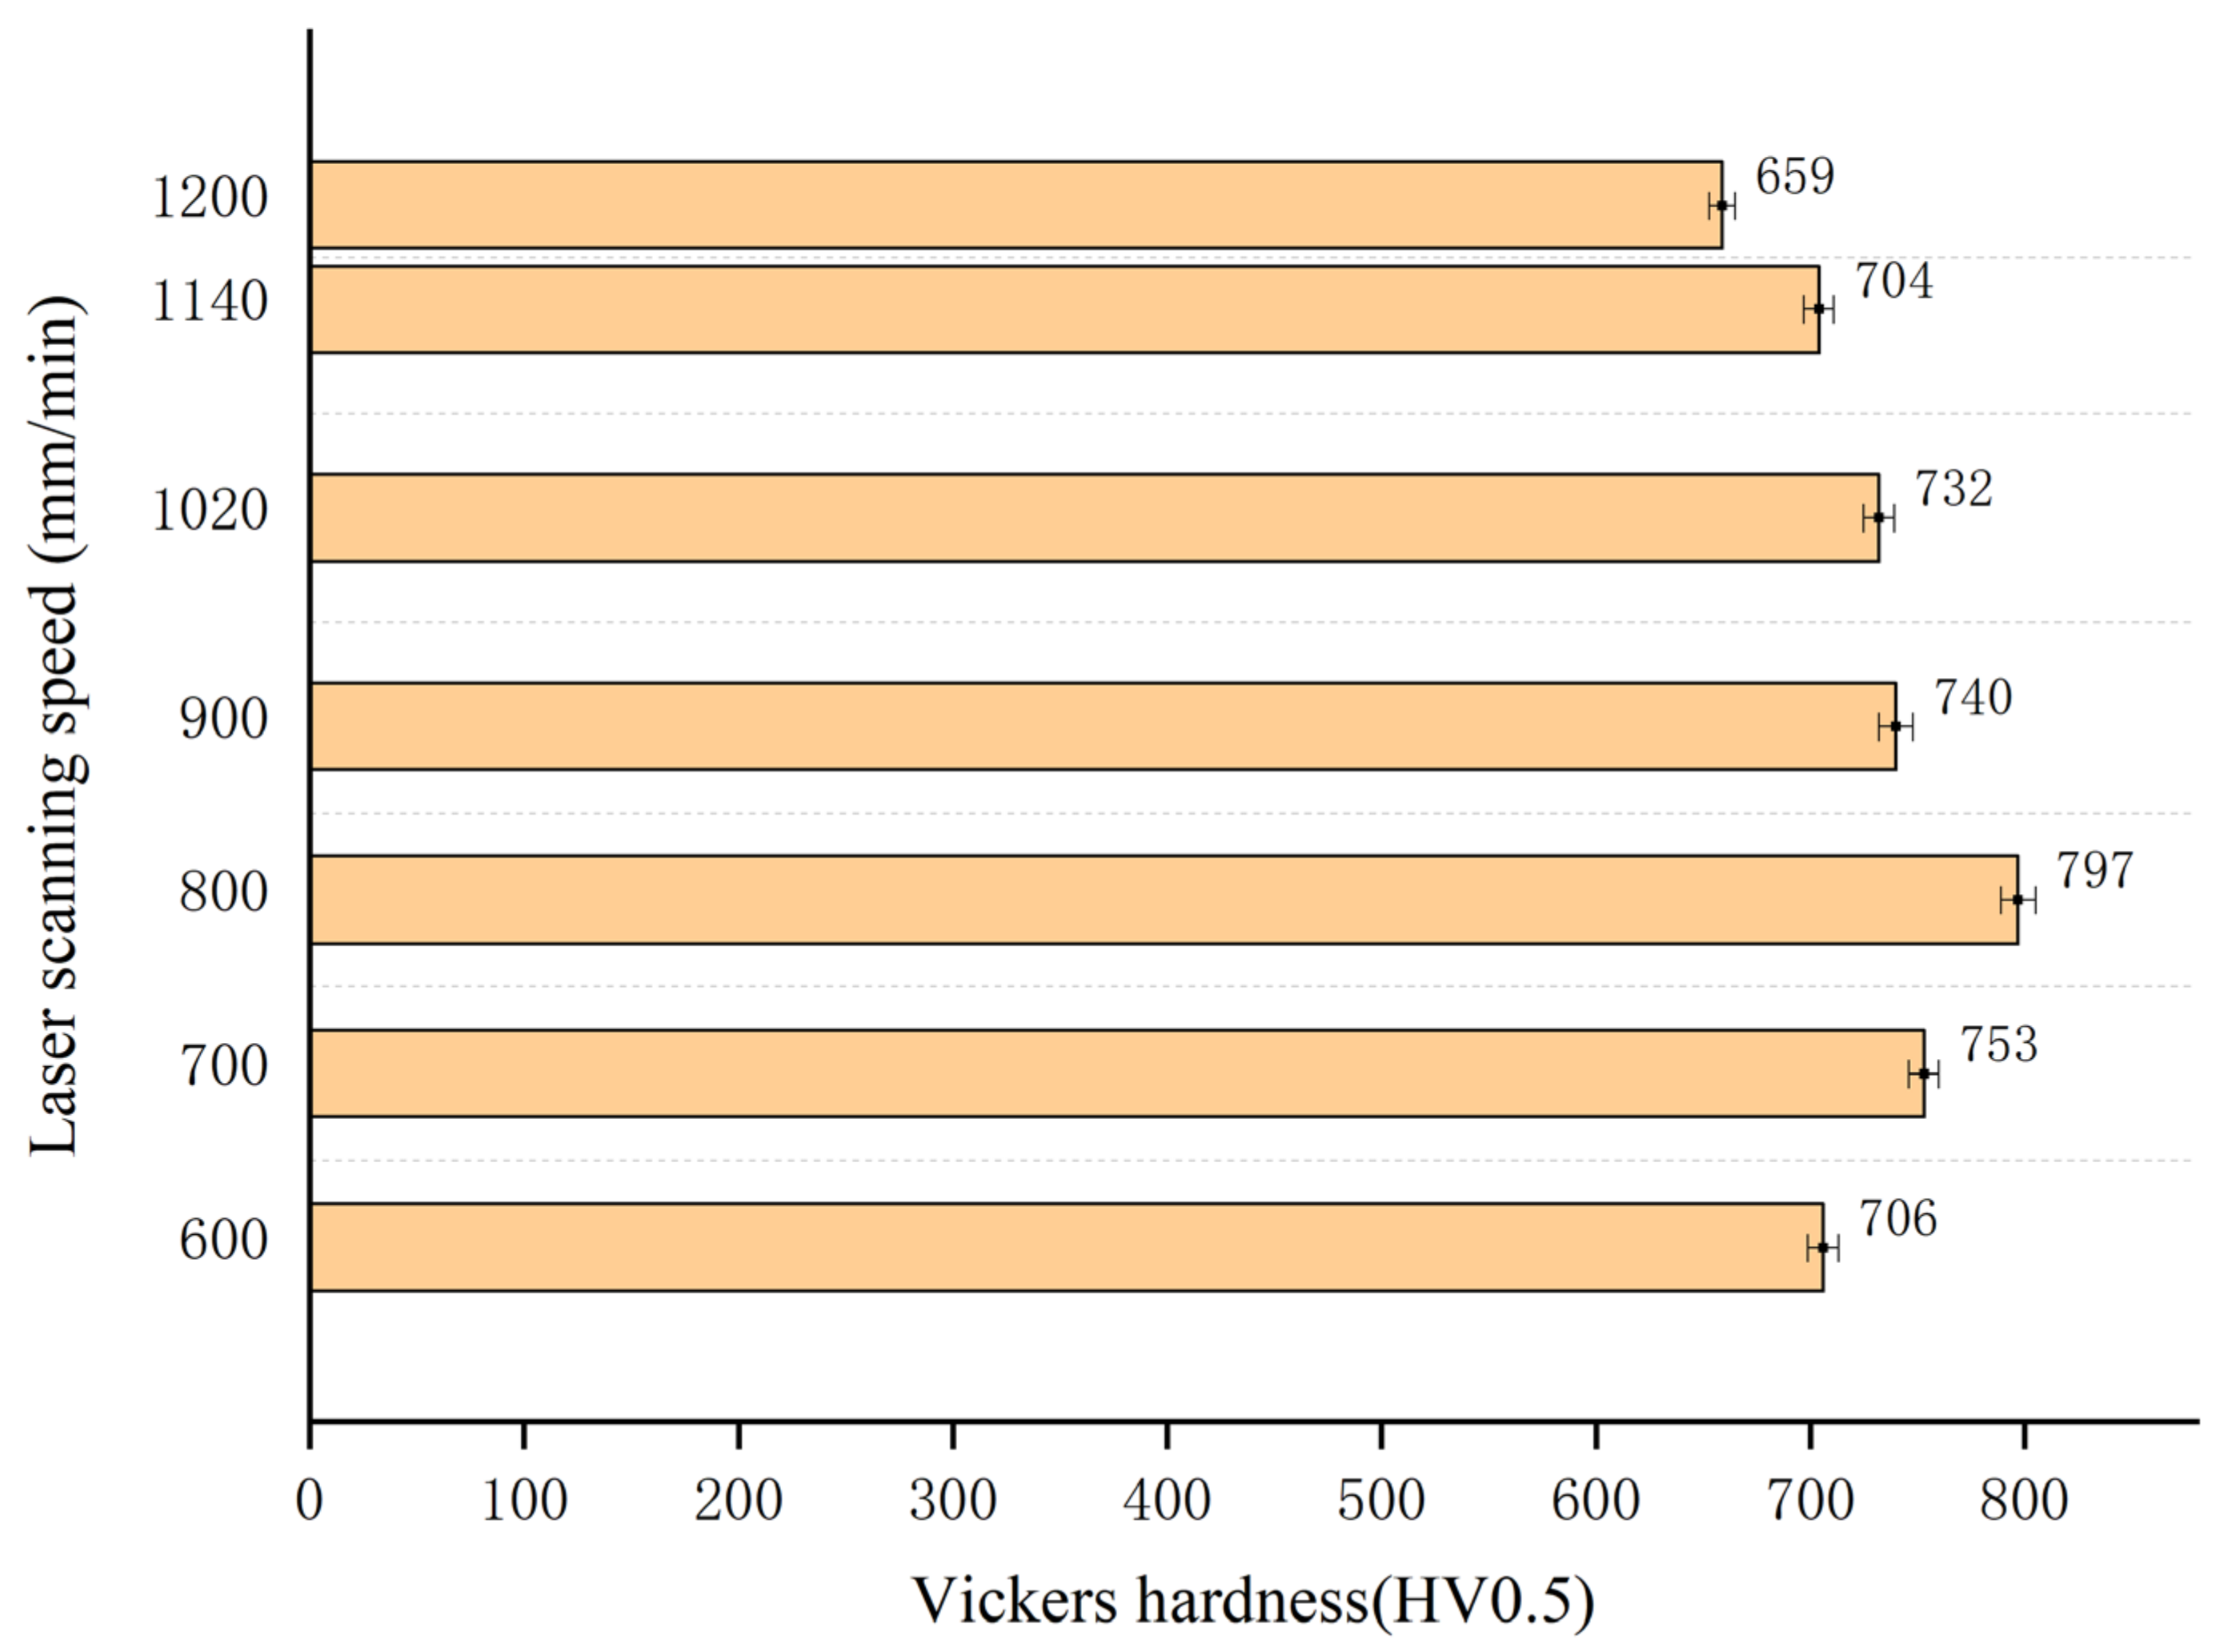
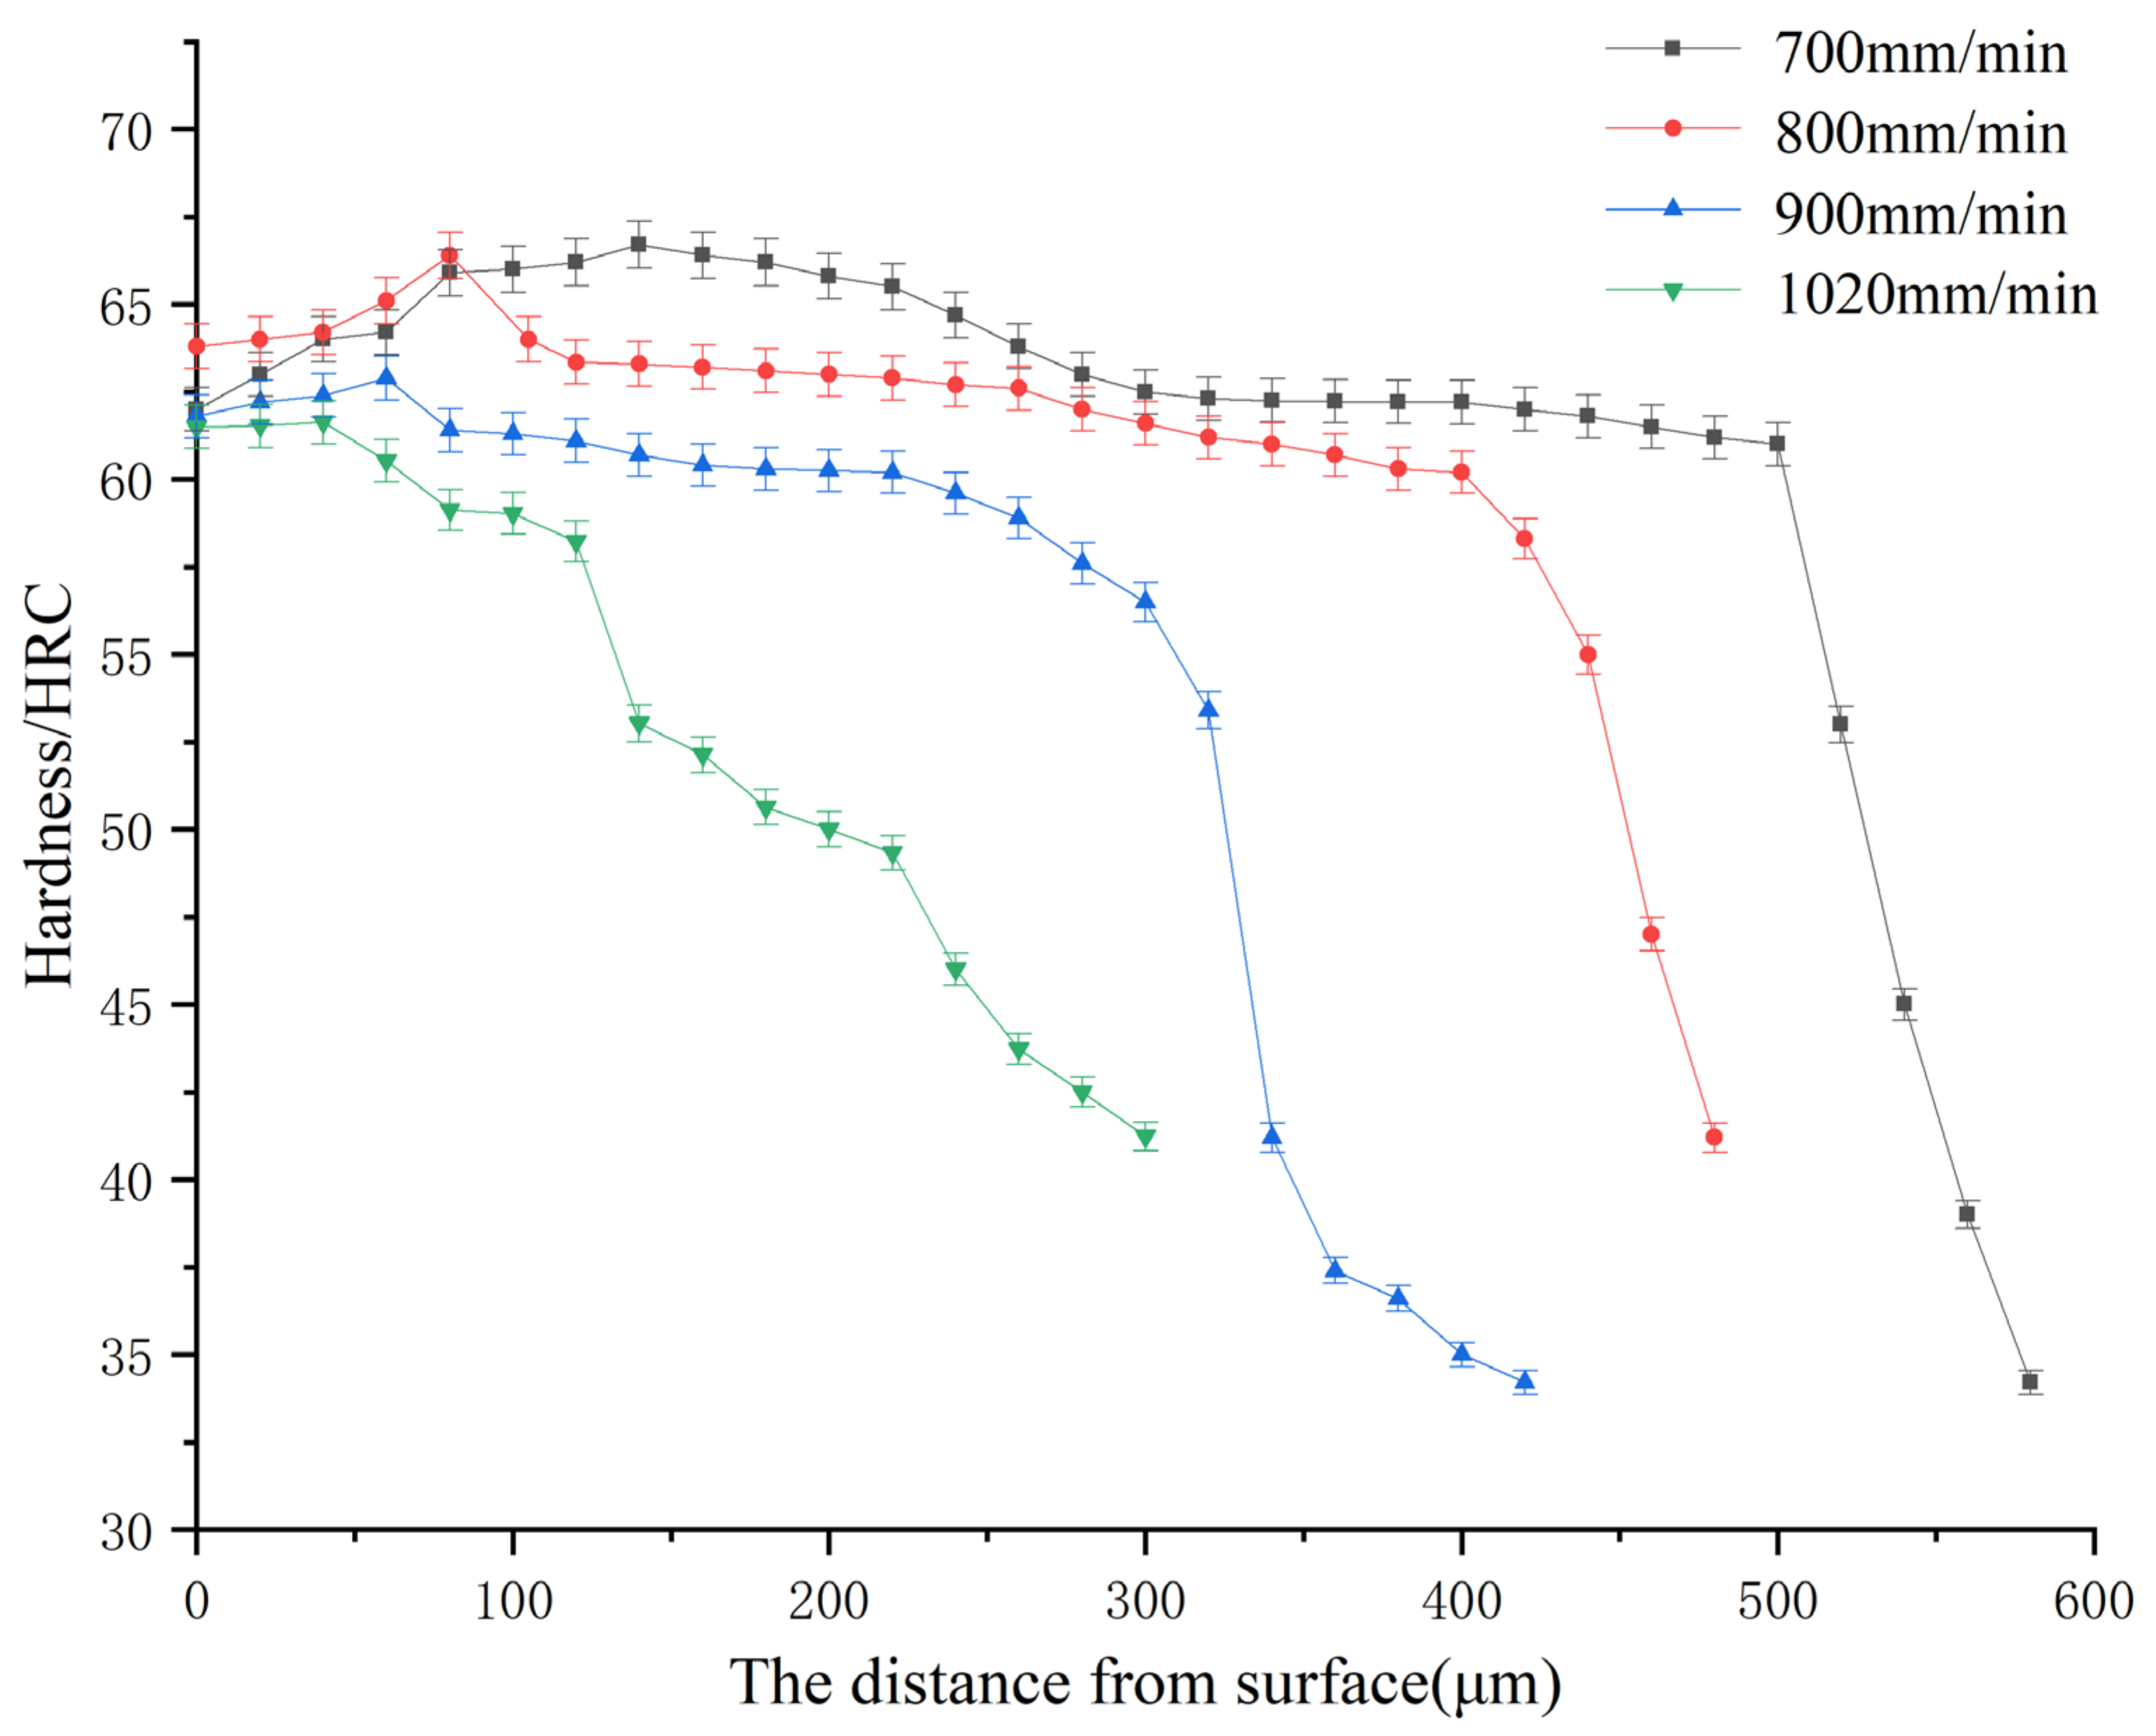
3.2. Micro-Hardness Test and Analysis of Laser Hardening Hardened Zone

In accordance with the conventional method of increasing the scanning speed by equal value, starting from 600 mm/min, laser hardening was performed at a scanning speed increment of 100 mm/min. When the scanning speed reached 900 mm/min, in order to explore the special phenomena that may be caused by the increase in scanning speed increment, laser hardening was performed at a scanning speed increment of 120 mm/min. When the scanning speed reached 1140 mm/min, and the surface hardness was expected to be low. Laser hardening was performed once at a scanning speed increment of 60 mm/min to reduce unnecessary time. Additionally, then laser scanning speeds of 600, 700, 800, 900, 1020, 1140, and 1200 mm/min were used in the experiment. After laser hardening, the surface hardness was measured at five similar positions on each sample, and the average value was taken as the final surface hardness value. The surface Vickers hardness of samples after laser scanning speeds of 600, 700, 800, 900, 1020, 1140, and 1200 mm/min were 706 ± 7 HV0.5, 753 ± 7 HV0.5, 797 ± 8 HV0.5, 740 ± 8 HV0.5, 732 ± 7 HV0.5, 704 ± 7 HV0.5, and 659 ± 6 HV0.5, respectively, namely 60.3 ± 0.4 HRC, 62.2 ± 0.4 HRC, 63.8 ± 0.5 HRC, 61.8 ± 0.5 HRC, 61.5 ± 0.4 HRC, 60.3 ± 0.4 HRC, and 58.2 ± 0.3 HRC. The relationship between the laser scanning speed and the surface Vickers hardness of the hardened layer is presented in Figure 3.
When the laser scanning speed was 600 mm/min, micro-melting occurred on the surface of the material. Therefore, the surface temperature was too high. When the scanning speed was 800 mm/min, the maximum surface hardness of the test specimens was obtained. For the sprag clutch wedge, the surface hardness must be between 61.0–66.0 HRC; therefore, a scanning speed in the range of 700–1020 mm/min is appropriate. Compared with vacuum quenching, the laser hardening process is simpler and more convenient.
Suitable samples were selected for hardness testing, which was carried out from the surface layer of the laser hardened layer to the inside. Through positions were measured every 20 µm along the vertical direction and the average value was calculated. The measured Vickers hardness was automatically converted to Rockwell hardness by the test device. Considering 42.0 HRC is already much lower than the surface hardness demand of the clutch wedge, when the measured hardness was lower than 42.0 HRC, the hardness measurement randomly stopped.
Surface hardness of the clutch wedge is usually expressed as Rockwell hardness. Here, the Rockwell hardness was used to express the changes in hardness under various laser scanning speeds, as shown in Figure 4.
Compared with the matrix material hardness of 32.2 HRC, laser hardening at different scanning speeds led to a two-fold increase in surface hardness. Due to rapid heating and cooling processes, the matrix underwent phase changes to form a martensite structure with a higher carbon content, which increased the hardness in the hardened layer. At a certain depth, austenite growth was incomplete due to insufficient energy and the hardness decreased again. In addition, the following phenomena occurred:
(1) Along the cross section, the positions of maximum hardness varied under different scanning speeds. Distances between the position of maximum hardness and the surface at scanning speeds of 700, 800, 900, and 1020 mm/min were about 140, 80, 60, and 40 µm, respectively. As the scanning speed increased, the position of maximum hardness shifted farther away from the surface. This is as the faster the scanning speed, the lower the surface energy and the lower the surface temperature. Therefore, less energy is transferred to the inside of the material and to a shallower depth. As the temperature drops in a stepped manner, the temperature that forms the maximum hardness will appear farther outside. In addition, when the scanning speed is fast, the surface temperature will be low [21], and the temperature increase in the material will be smaller, the size of the finest grains of the hardened layer will be larger, and the maximum hardness value will be smaller.
(2) Maximum surface hardness was observed with a scanning speed was 800 mm/min. At a scanning speed of 600 mm/min, obvious micro-melting occurred. Although no micro-melting was observed at a scanning speed of 700 mm/min, the surface temperature was close to liquidus, which allowed coarser austenite to easily form, resulting in coarser martensite. The laser scanning speed of 900 mm/min and 1040 mm/min were faster, so less energy is transferred to the surface of the material. Thereby austenite growth was incomplete, which eventually made the surface hardness lower.
(3) For all scanning speeds, the maximum surface hardness did not appear on the surface, but on the subsurface. When the surface temperature is high, carbon will migrate from the inside to the outside of the material and react with oxygen on the surface, resulting in a lower surface carbon content than in the subsurface layer. In addition, austenite generated in the rapid heating process will be coarser due to the higher temperature. During the rapid cooling process, the surface layer is in contact with air and the subsurface layer is in contact with the material. As the heat transfer coefficient of air is greater than the heat transfer coefficient of the material, heat will be dissipated faster, and the austenite generated on the surface is larger than the austenite generated on the subsurface layer. According to the Hall–Petch formula [22], the hardness of the material will be lower.
(4) Under various scanning rates, the depth of the hardened layer also varied. According to the law of energy conservation, the slower the scanning speed, the higher the energy on the surface, the greater the transmission depth, and the deeper the depth of the hardened layer [23].

3.3. Microstructure Analysis

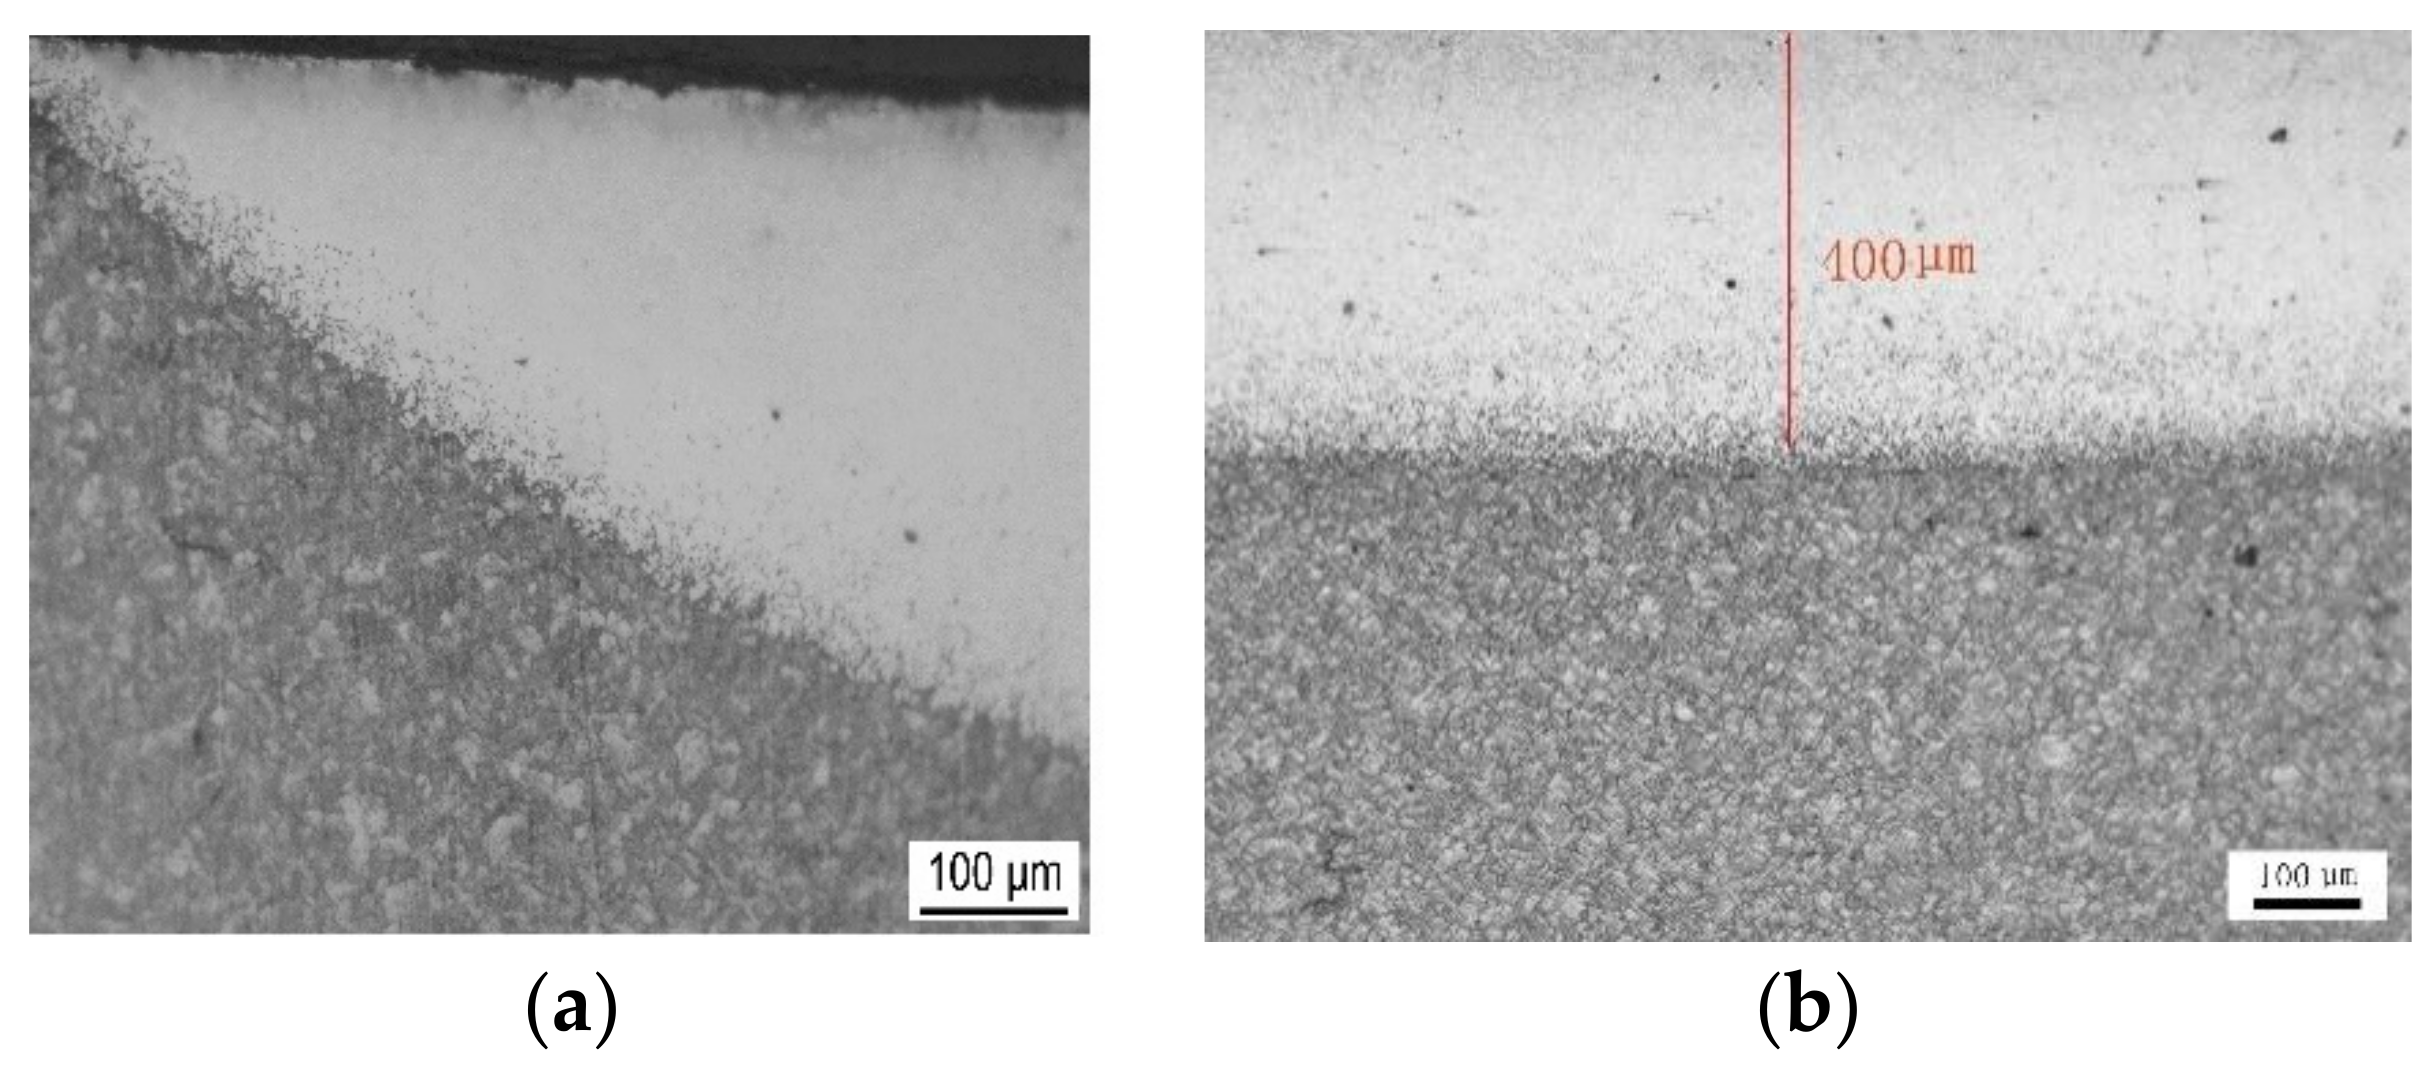
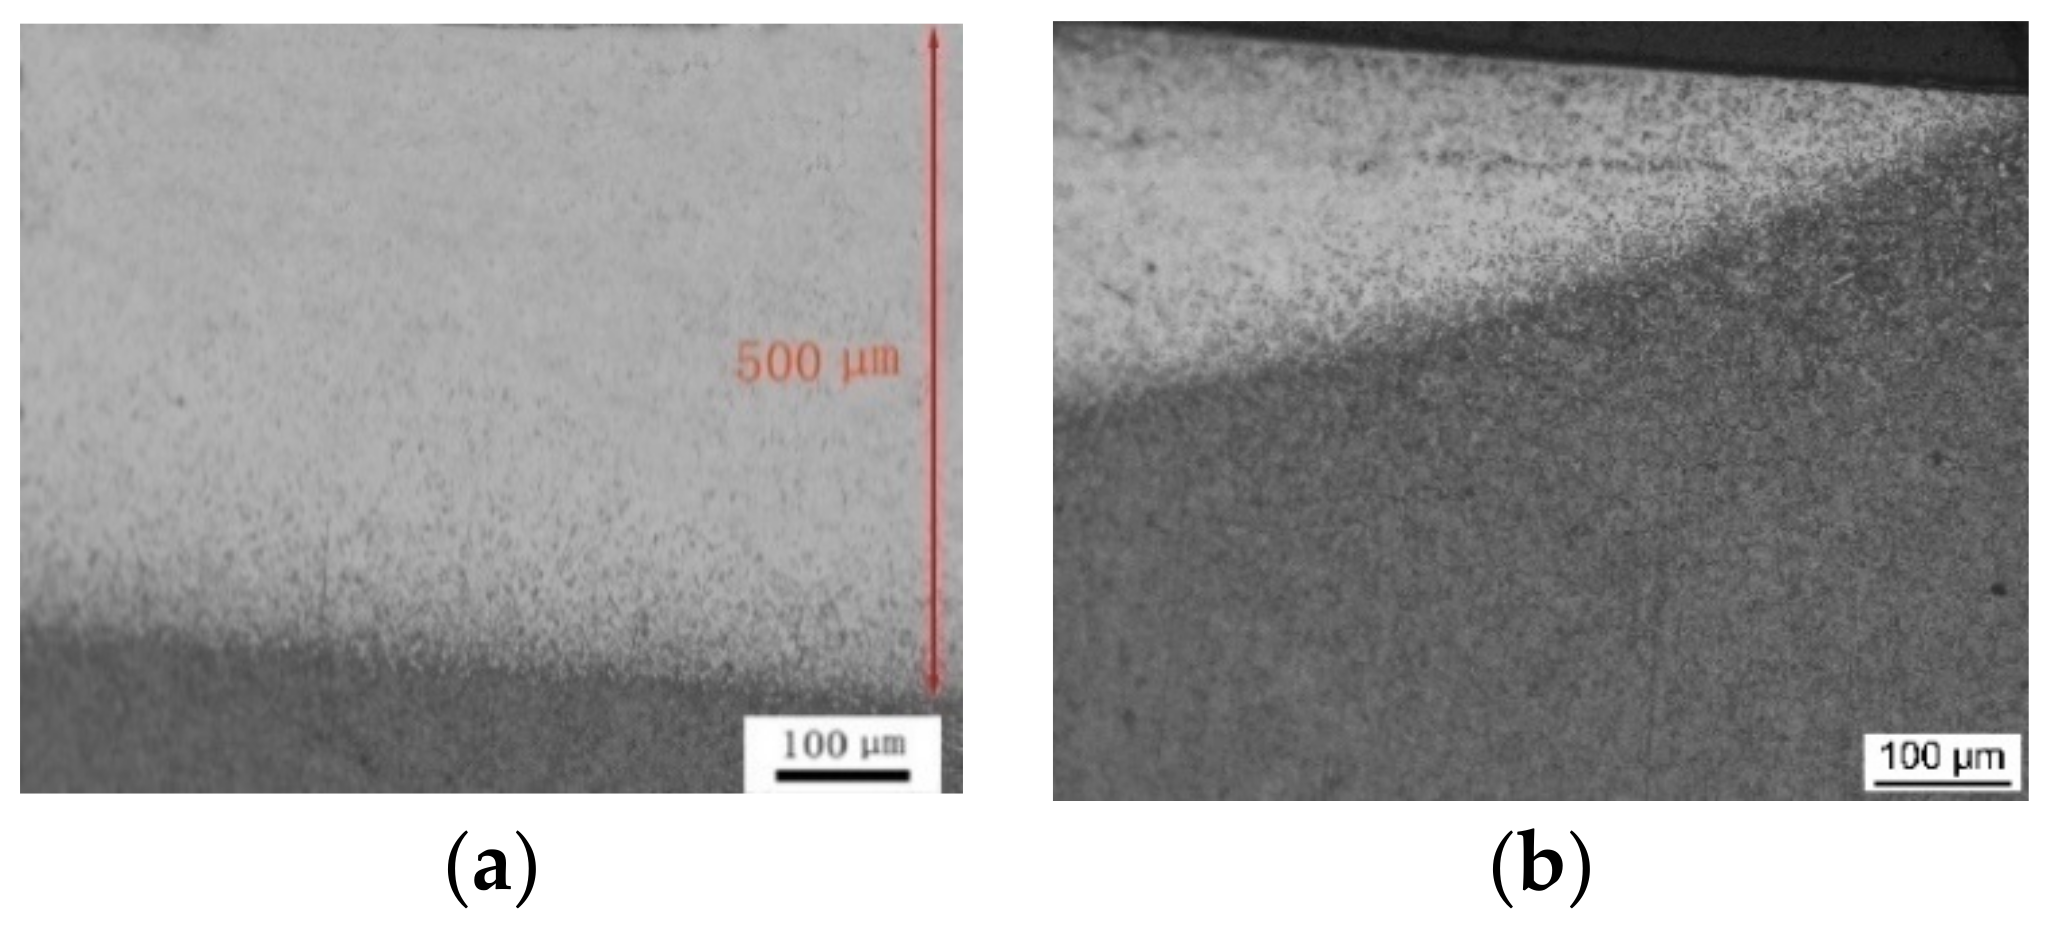
3.3.1. Metallographic Analysis

As shown in Figure 5, after laser hardening at a scanning speed of 800 mm/min, the metallographic cross section can be clearly divided into three layers: the hardened layer, transition layer, and matrix material. In the center of the hardened area, the hardened layer reached a depth of about 400 µm, which was the deepest. An obvious crescent shape can be observed on each side of the cross section.
The same method was used to analyze the sample delamination with a scanning speed of 700 mm/min. As shown in Figure 6, differences between the hardened layer and the base material were obvious.
Compared with 800 mm/min, at a scanning speed of 700 mm/min, the distribution of the hardened layer still presented a crescent shape, and the depth of the middle position is deeper, about 500 µm.

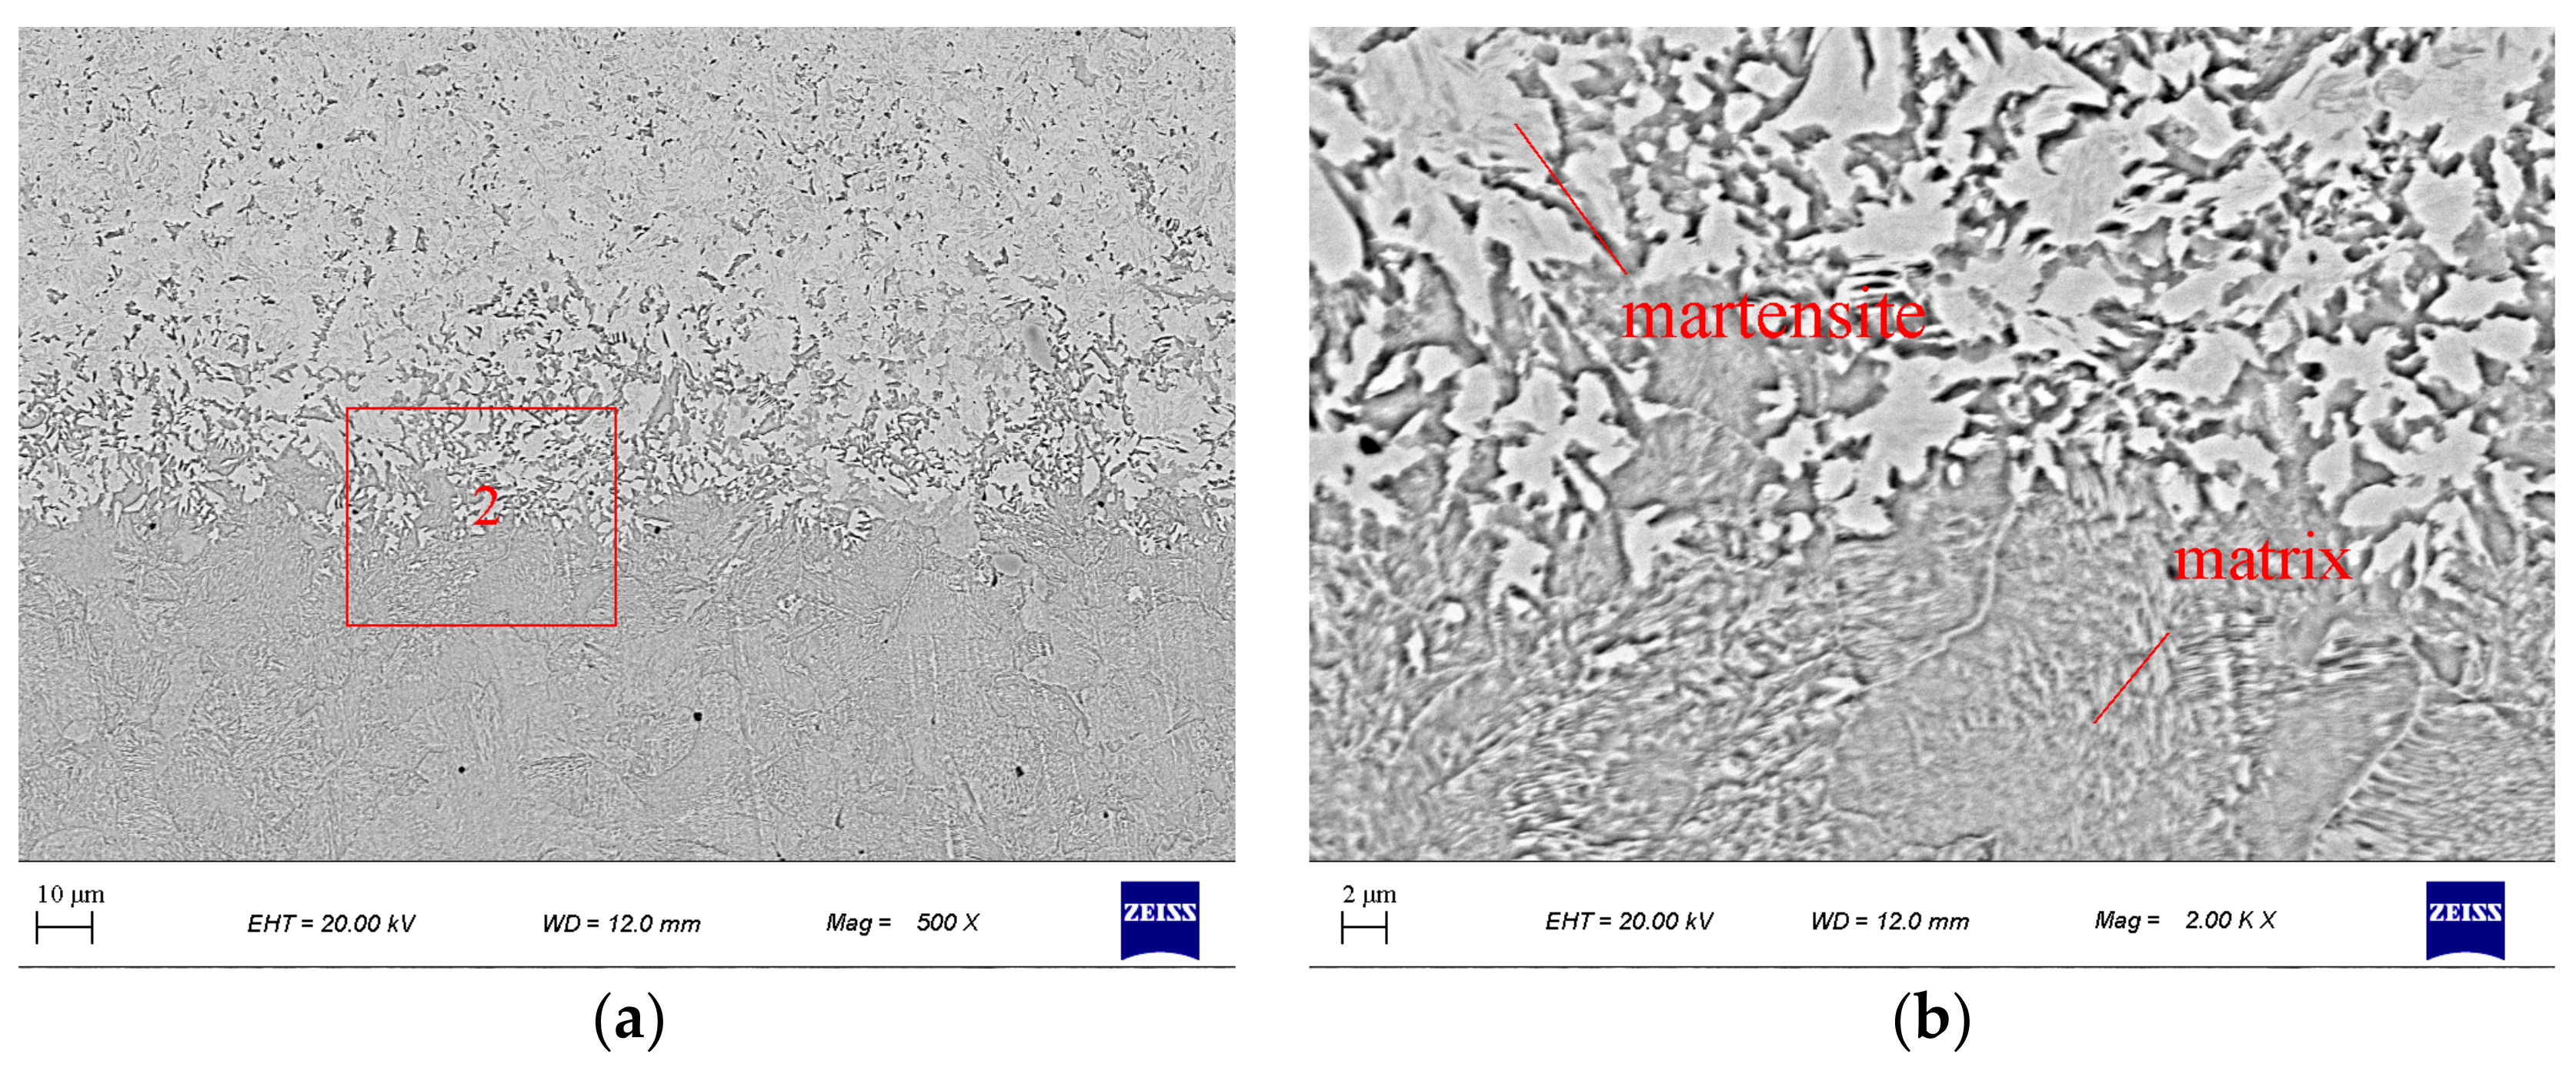
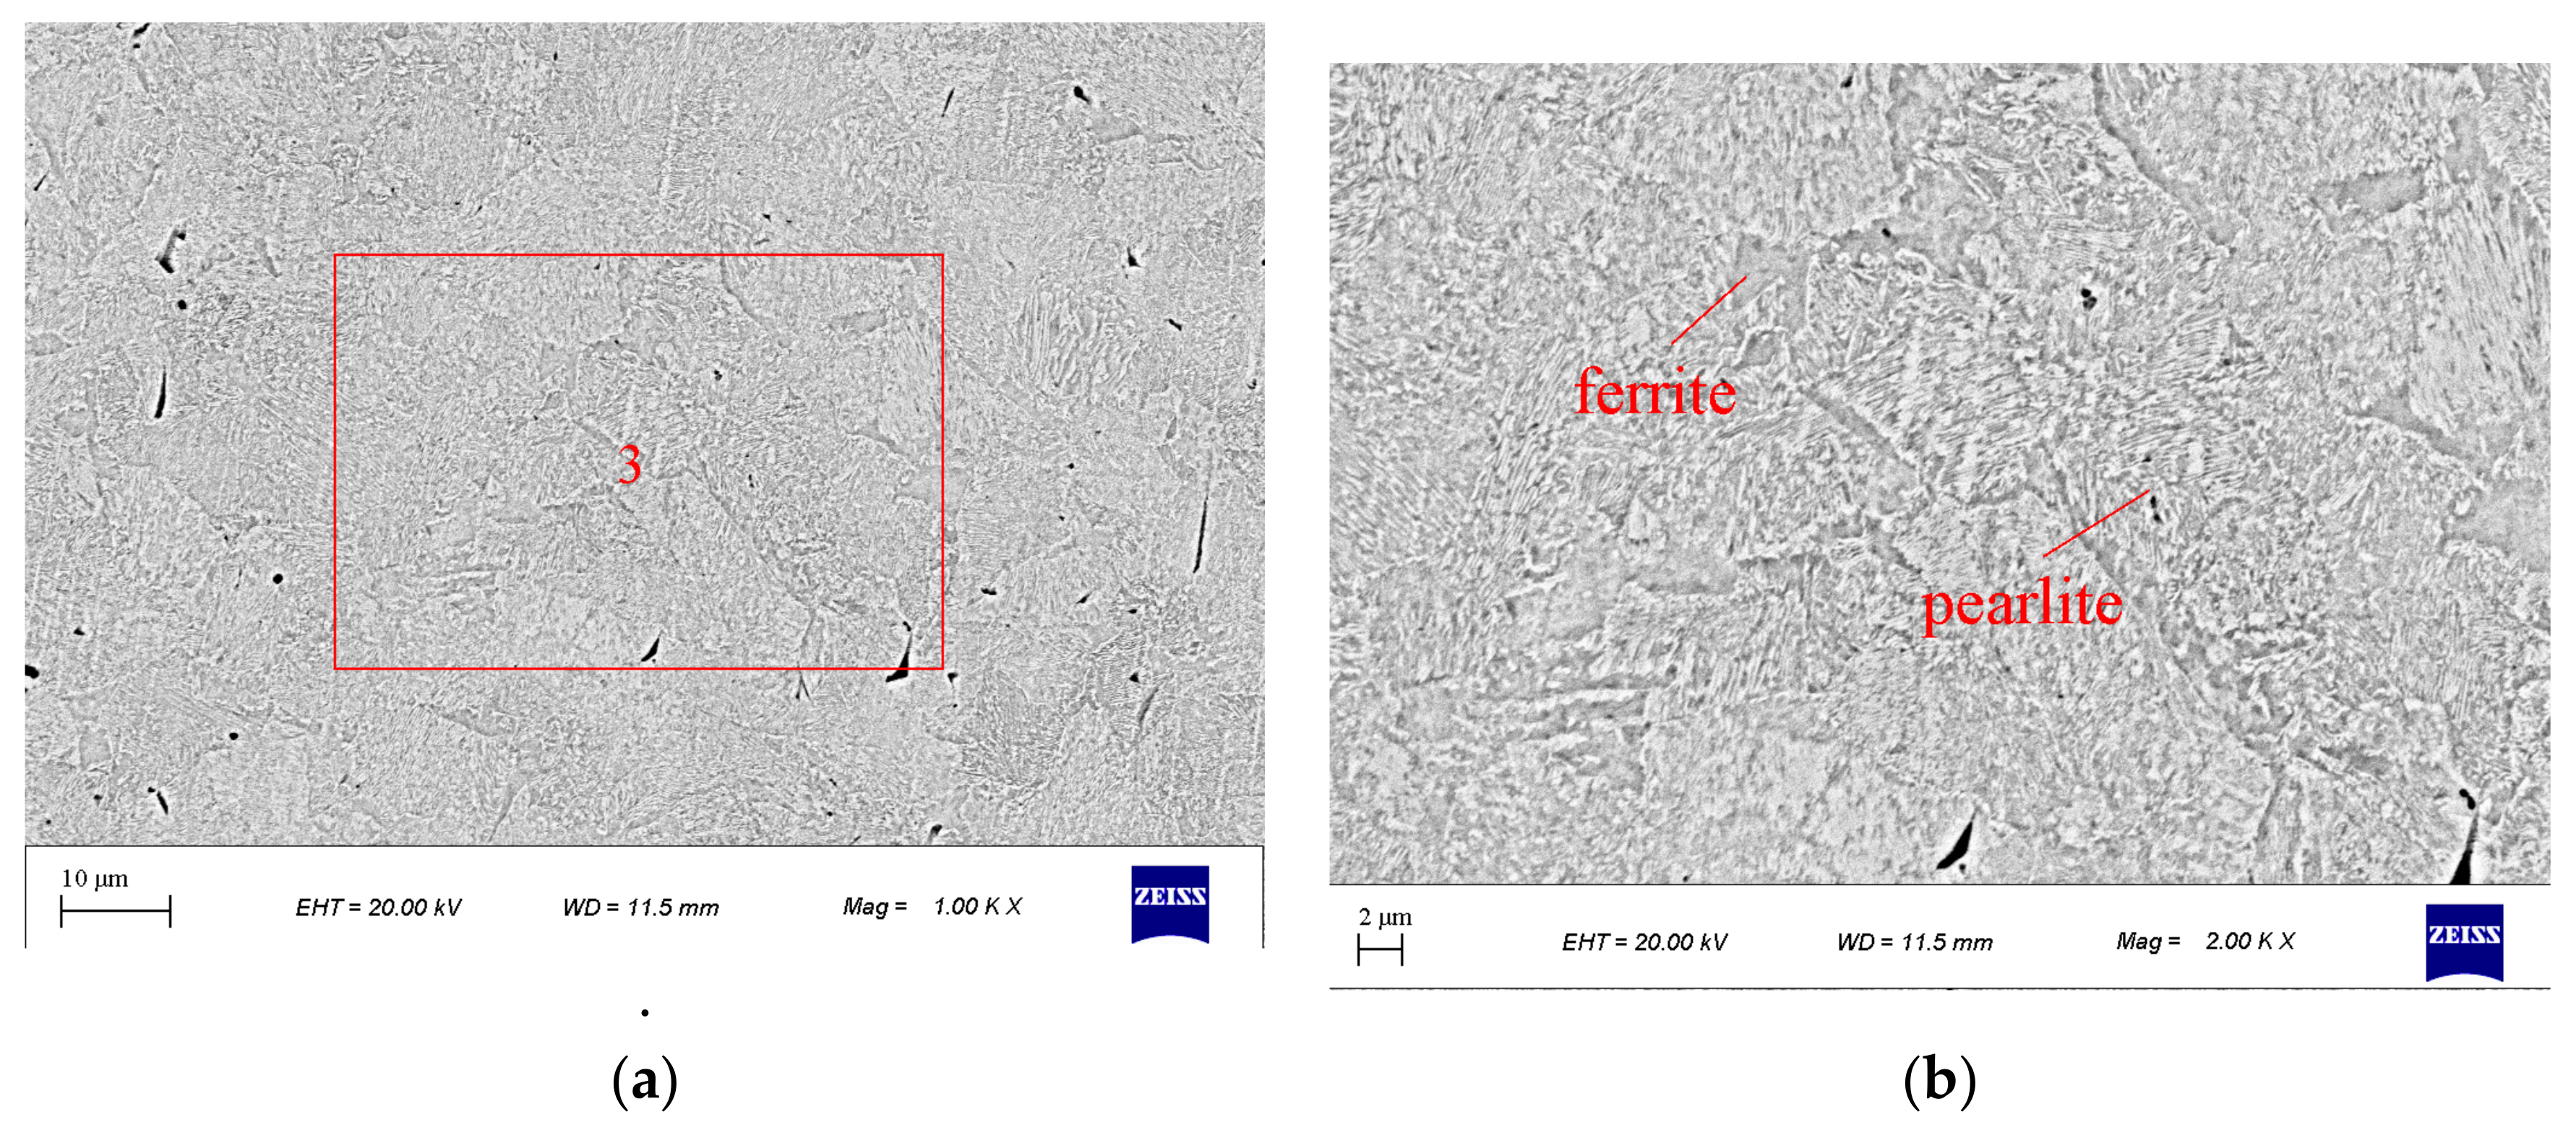
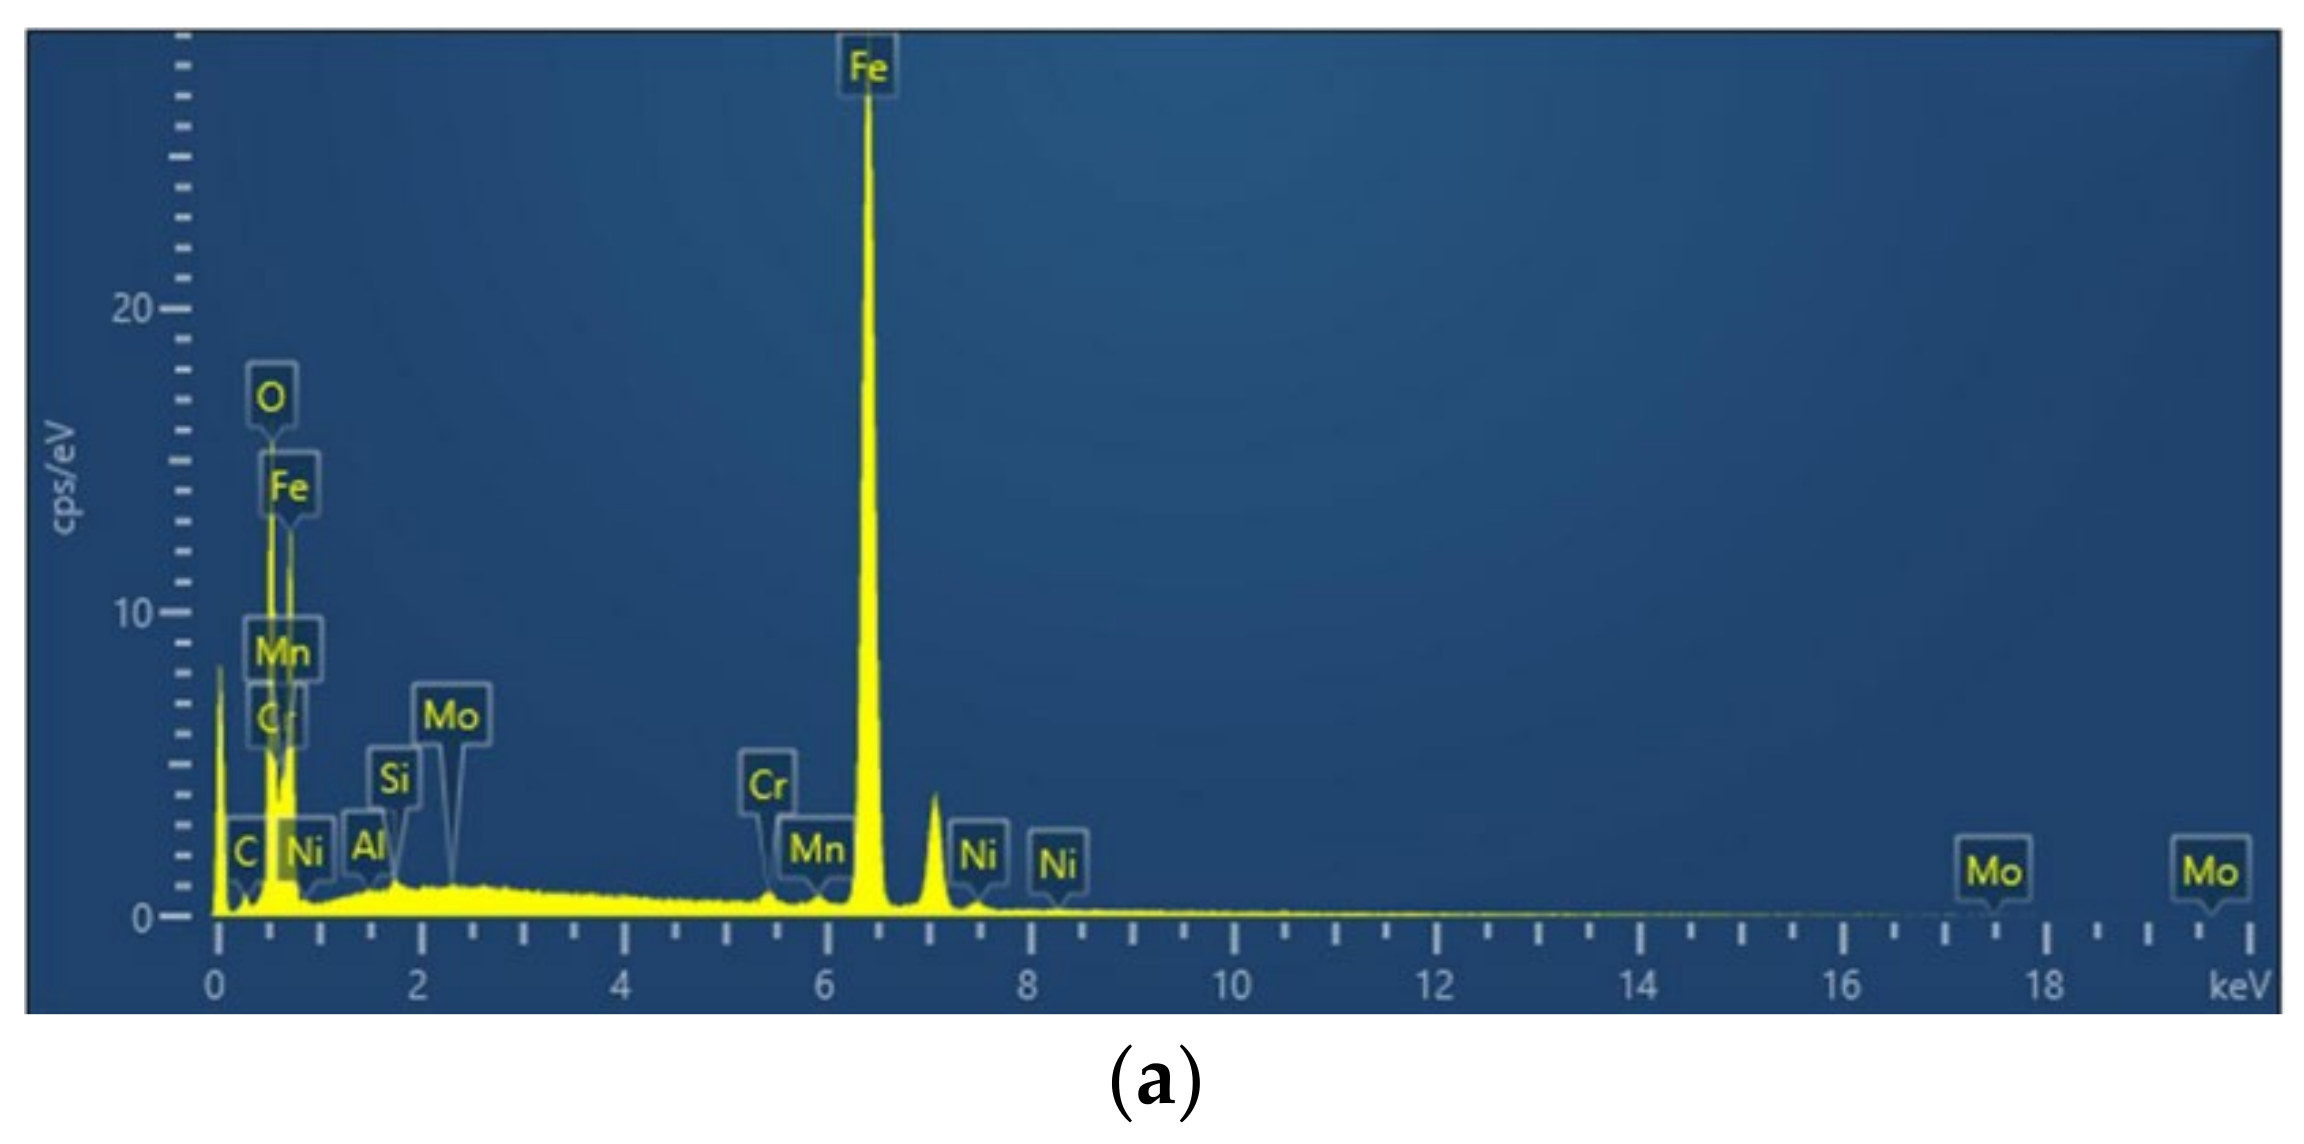
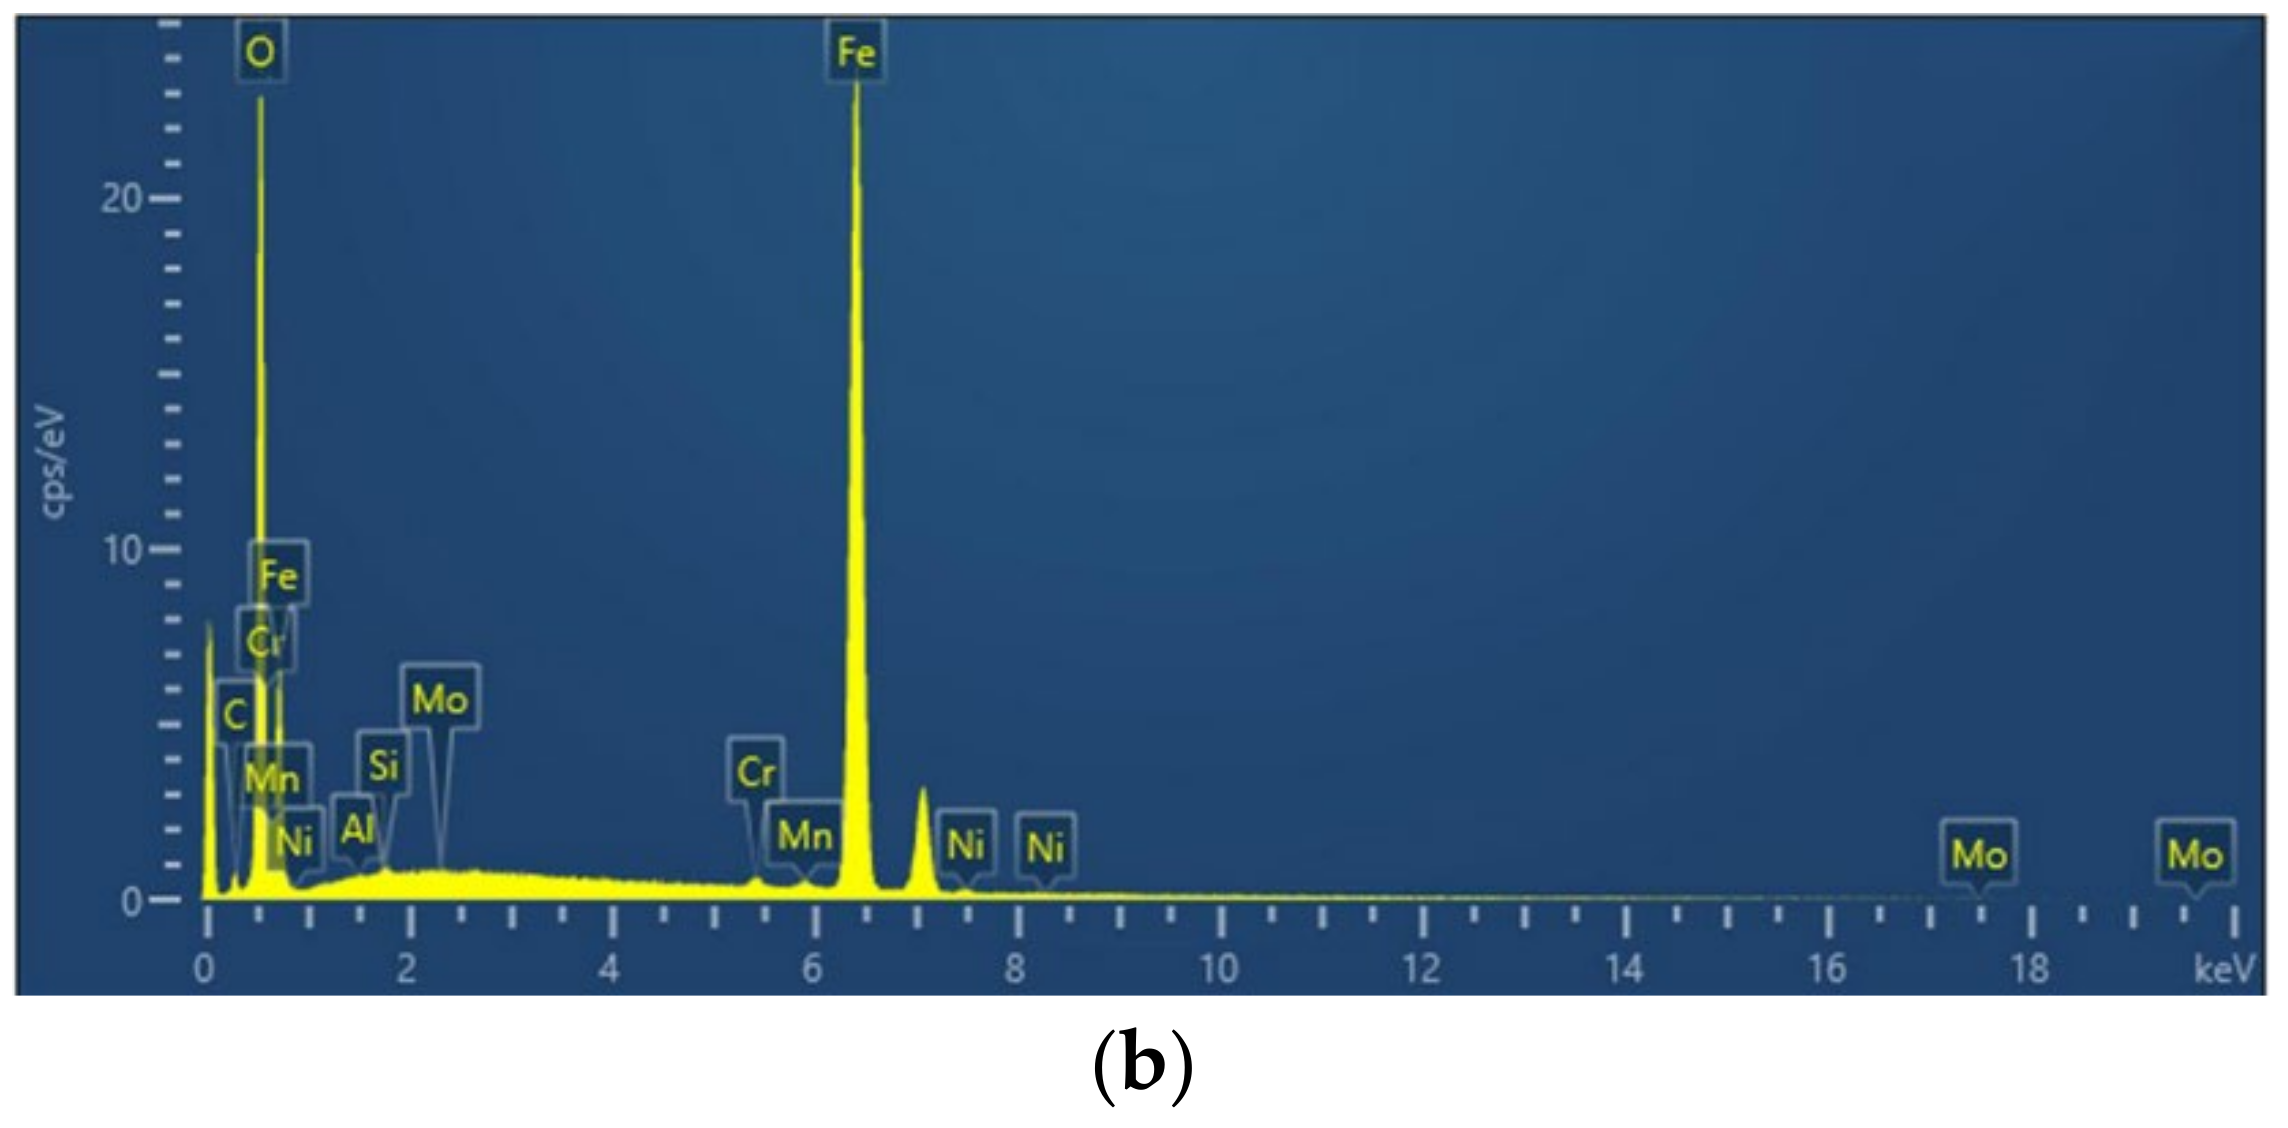
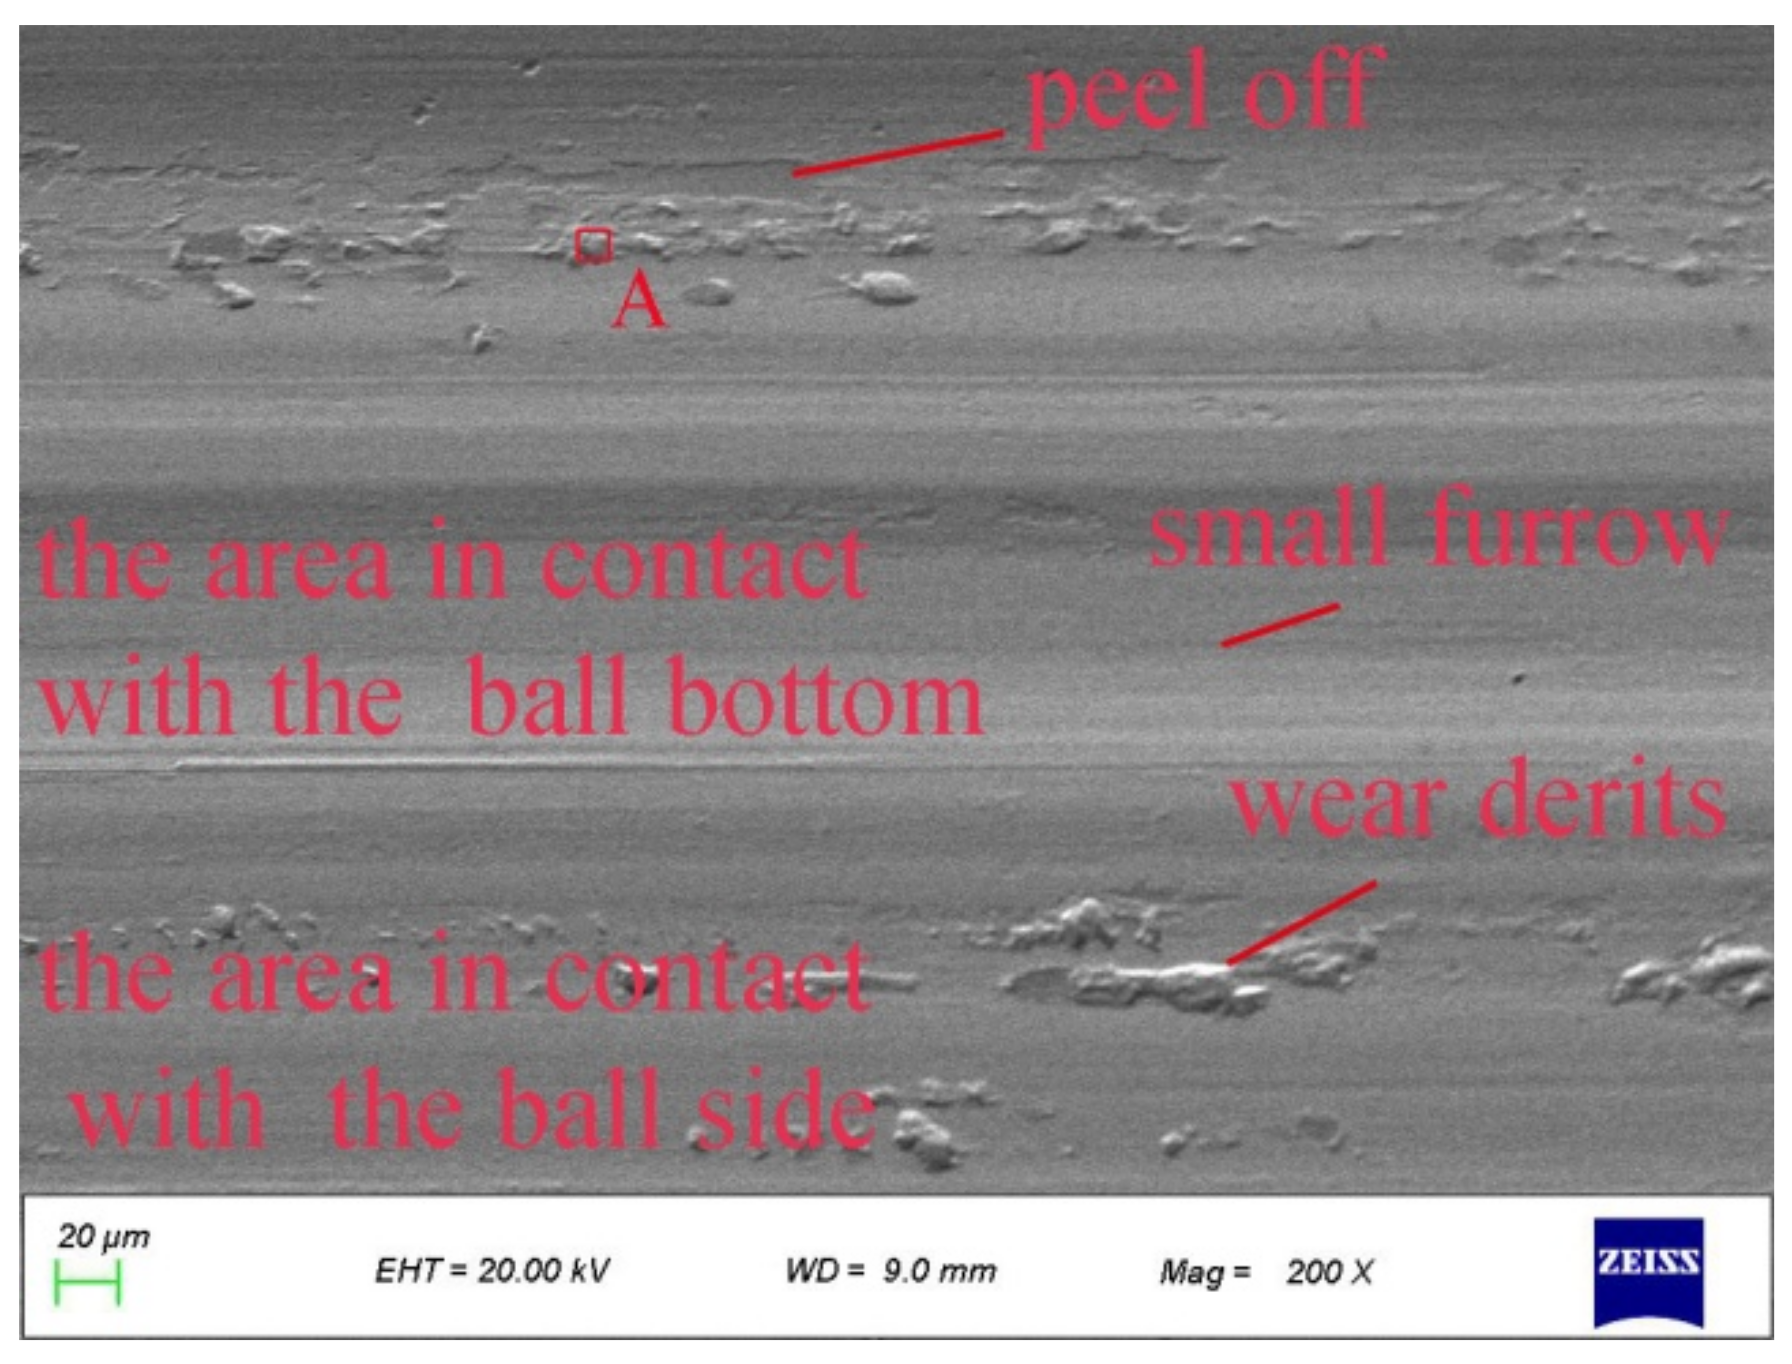
3.3.2. Scanning Electron Microscopy Analysis

Figure 7 shows the scanning electron microscope mages of the hardened zone at the depth of about 80 µm from the surface with a laser scanning speed of 800 mm/min.
Based on our existing knowledge of steel, the hardened layer should be composed of acicular martensite and lath martensite, retained austenite, and partial carbides. At this scale, the martensite is relatively small and inconsistent. The dislocation density was large, which was another important reason for the observed increase in hardness. The rapid cooling and heating processes were affected by many factors, which also hindered the effective growth of martensite. An uneven temperature distribution also led to an uneven distribution of martensite. In some locations, there were collisions and twists in the martensite, which may increase local stress.
Figure 8 shows the transition zone at a laser scanning speed is 800 mm/min.
Farther away from the surface, more matrix remains. The transition zone was far from the surface and less heat was transferred to the transition layer. Therefore, the temperature was lower, and the laser had little effect on the transition zone. Due to uneven heat transfer, martensitization is uneven and the transition zone exhibits a diffuse shape.
Figure 9 shows a representative scanning electron micrograph of the matrix material when the laser scanning speed was 800 mm/min.
The matrix structure is distributed in ferrite in the pearlite structure, with some additional impurities.
(2) When the laser scanning speed is 700 mm/min, the hardened zone is still mainly martensite.
Figure 10 shows the transition zone.
Compared with a scanning speed of 800 mm/min, martensitization of the transition zone at a scanning speed of 700 mm/min was more complete. The lower scanning speed resulted in higher energy on the surface, therefore the temperature was higher, and heat was transferred deeper into the sample. As the temperature step in the transition zone was larger, the cooling rate was faster. In addition, martensitization of the transition zone was more uniform due to the higher energy, the bulge phenomenon was more obvious, and the internal stress was greater.

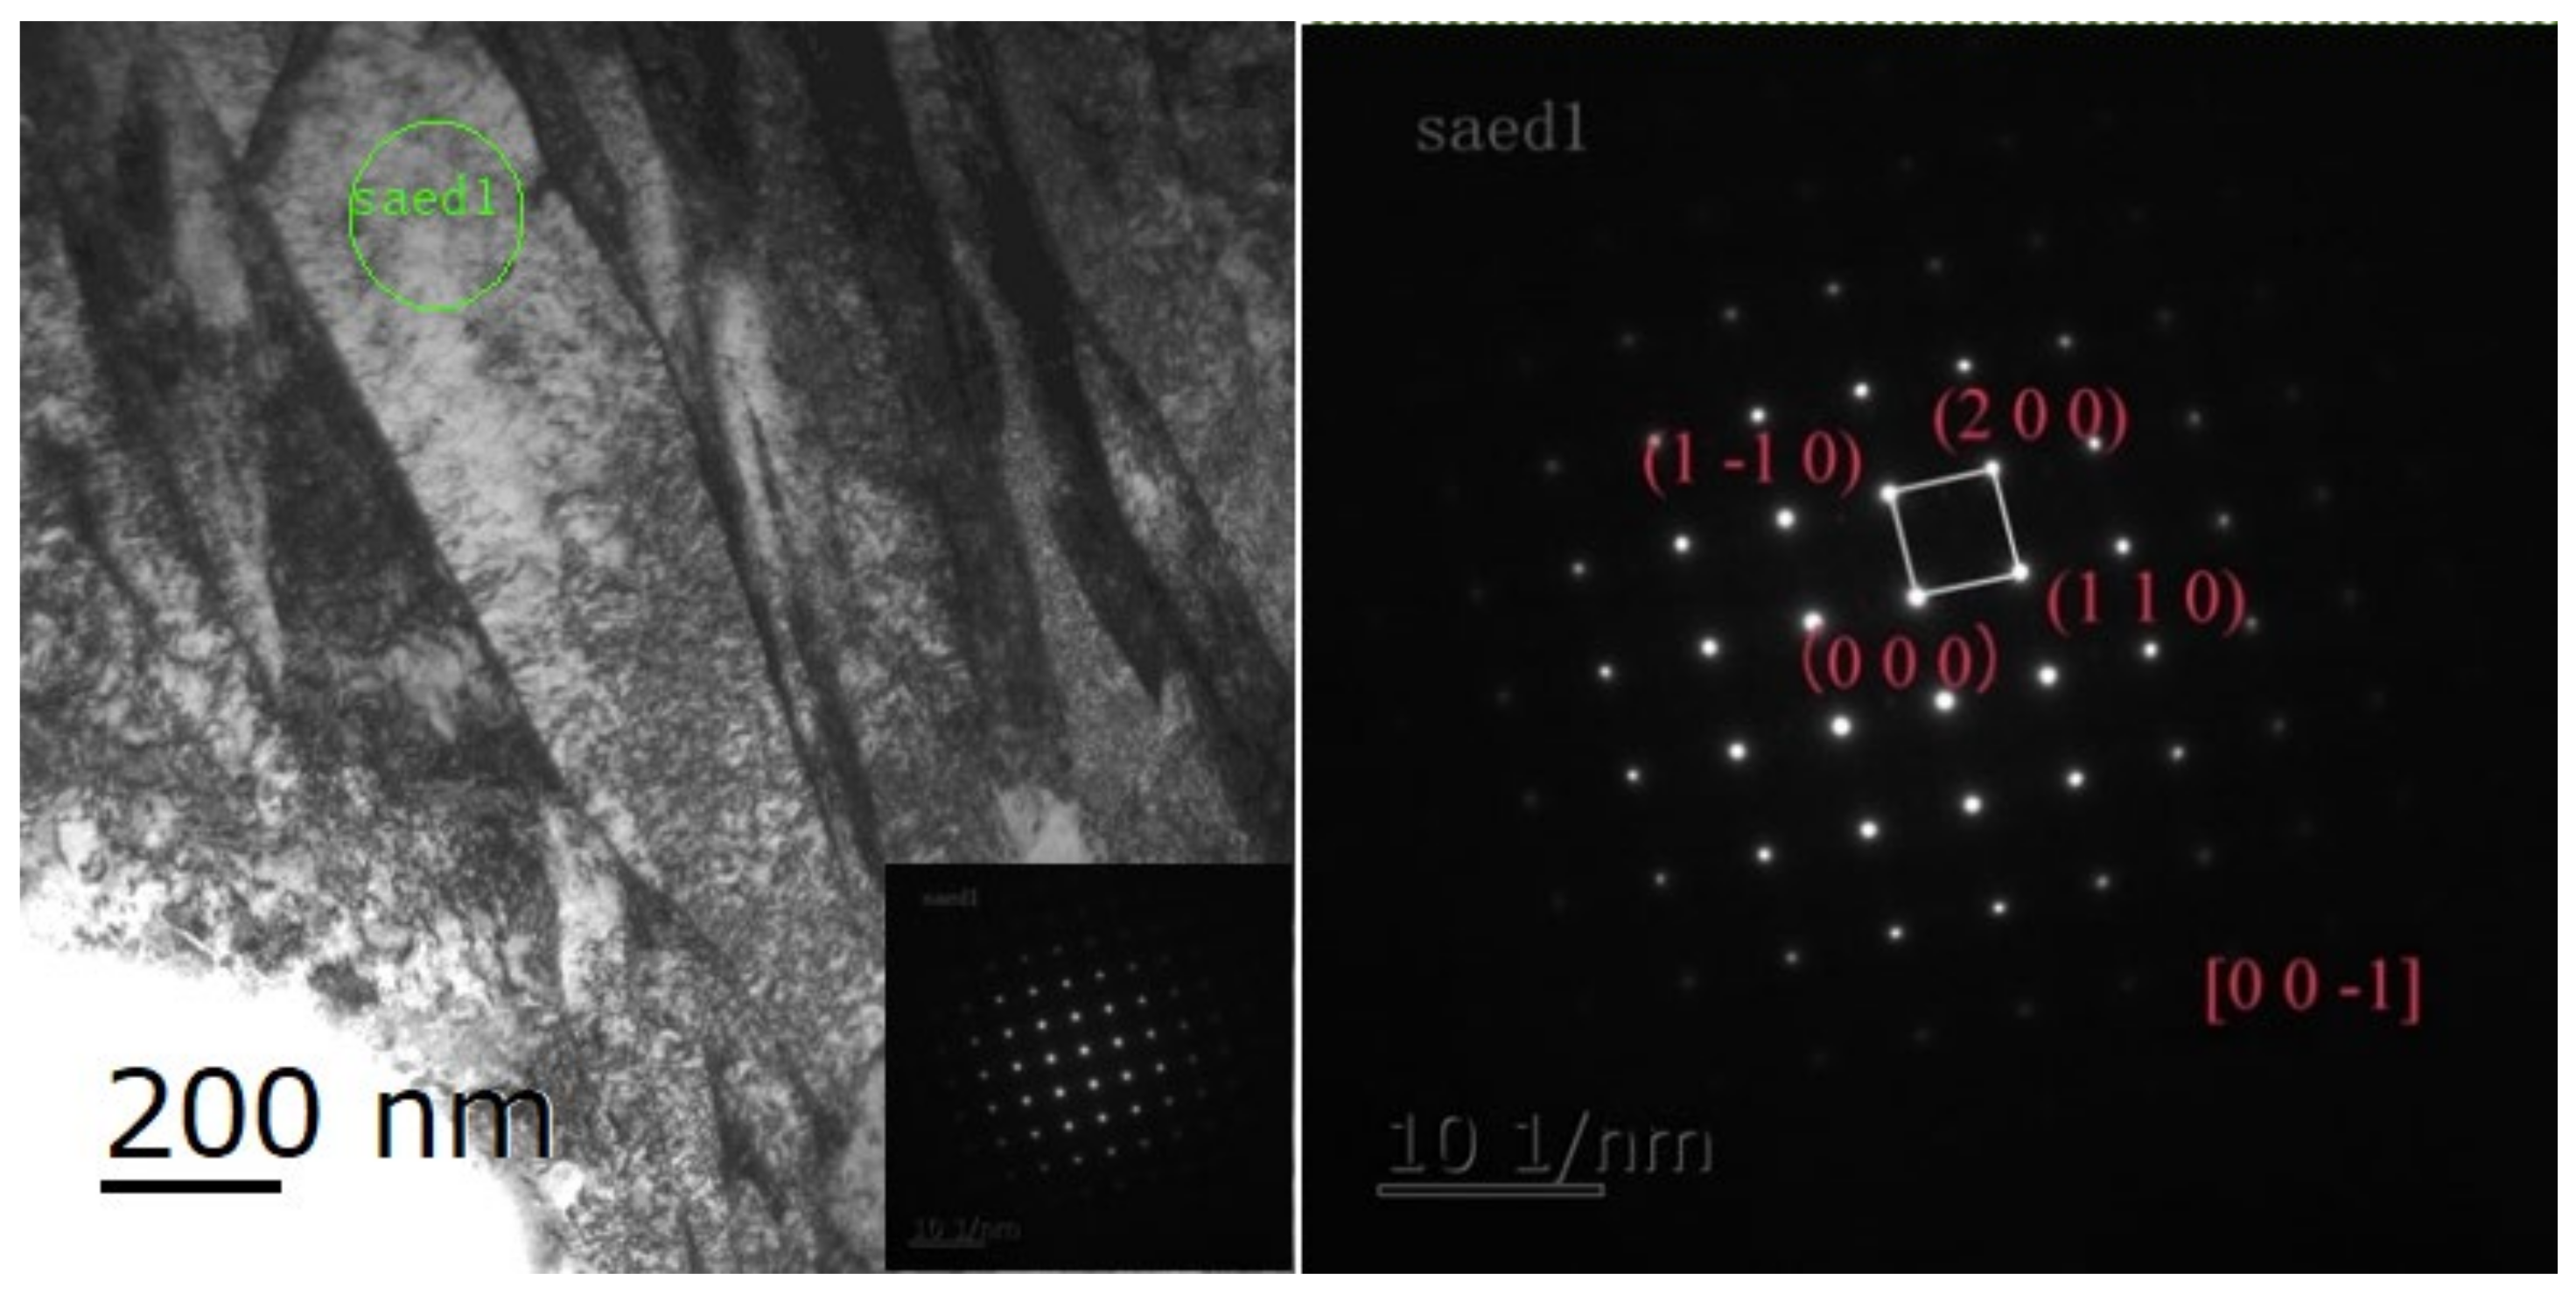
3.3.3. Transmission Electron Microscopy Analysis

A laser hardened sample at a scanning speed of 800 mm/min was selected for TEM observation [24]. The lath martensite structure was confirmed by selected-area electron diffraction. Figure 11 shows the diffraction pattern. Figure 12 shows the austenite and the diffraction pattern.
As shown in Figure 13, a high density of martensite dislocations was observed in the microstructure, which was directly related to surface hardening. Some lamellar martensite with ridges can be observed, accompanied by a high density of fine twins. The martensite was slightly distorted, likely due to collisions between the crystal planes, however, no cracks formed. From Figure 14, flake-like and lath martensite formed, and some martensite regions were smaller in size. The size of martensite regions was determined by austenite growth.

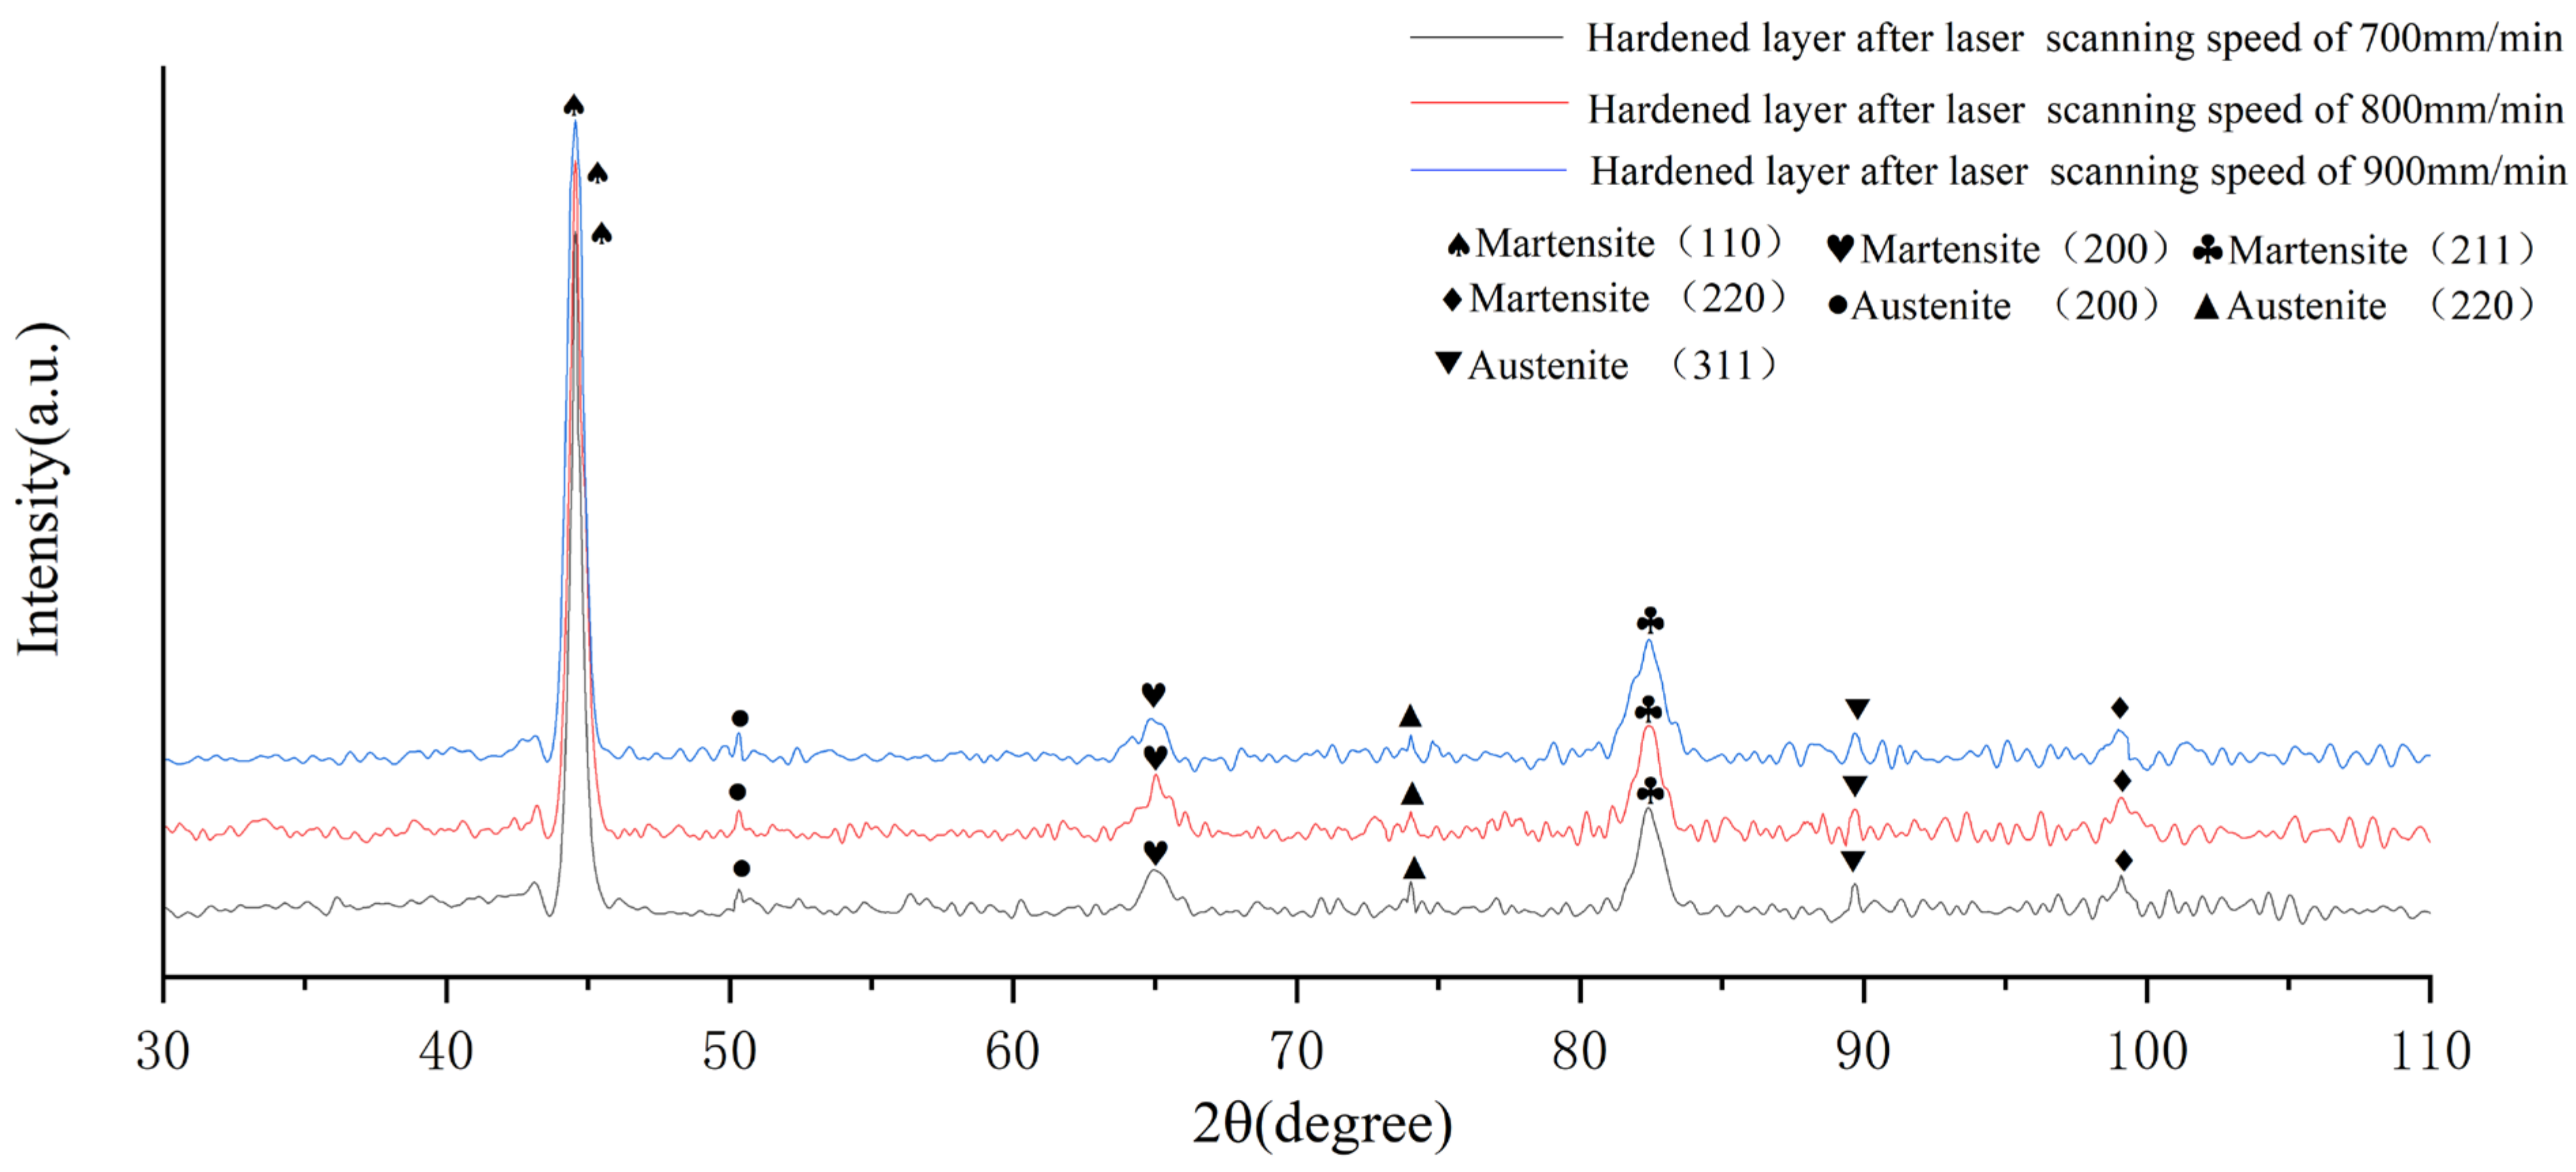
3.3.4. X-ray Diffraction Analysis

Strengthened layers that were laser hardened at a scanning speed of 700 mm/min, 800 mm/min, and 900 mm/min were selected for further inspection by X-ray diffraction (XRD) [25]. The results were presented in Figure 15.
Through XRD inspection, the main structure of the hardened layer included martensite and retained austenite.
The angles of the diffraction peak produced by martensite (110), martensite (200), martensite (211), and martensite (220) crystal plane diffraction were 44.6°, 65.0°, 82.4°, and 99.1°, respectively. The diffraction peak of the martensite (110) crystal plane was strongest.
The retained austenite content of the hardened layer after a scanning speed of 700 mm/min, 800 mm/min, and 900 mm/min was estimated. The results were presented in Figure 16.
As shown in Figure 16, as the laser scanning speed increased, the content of retained austenite will decrease. This is mainly as the scan speed increase will promote the ascent of the Ms point, the stability of austenite will decrease. In the subsequent rapid cooling process, austenite is easier to transform, which reduces the retained austenite content.

4. Tribological Behavior

4.1. Friction Coefficient

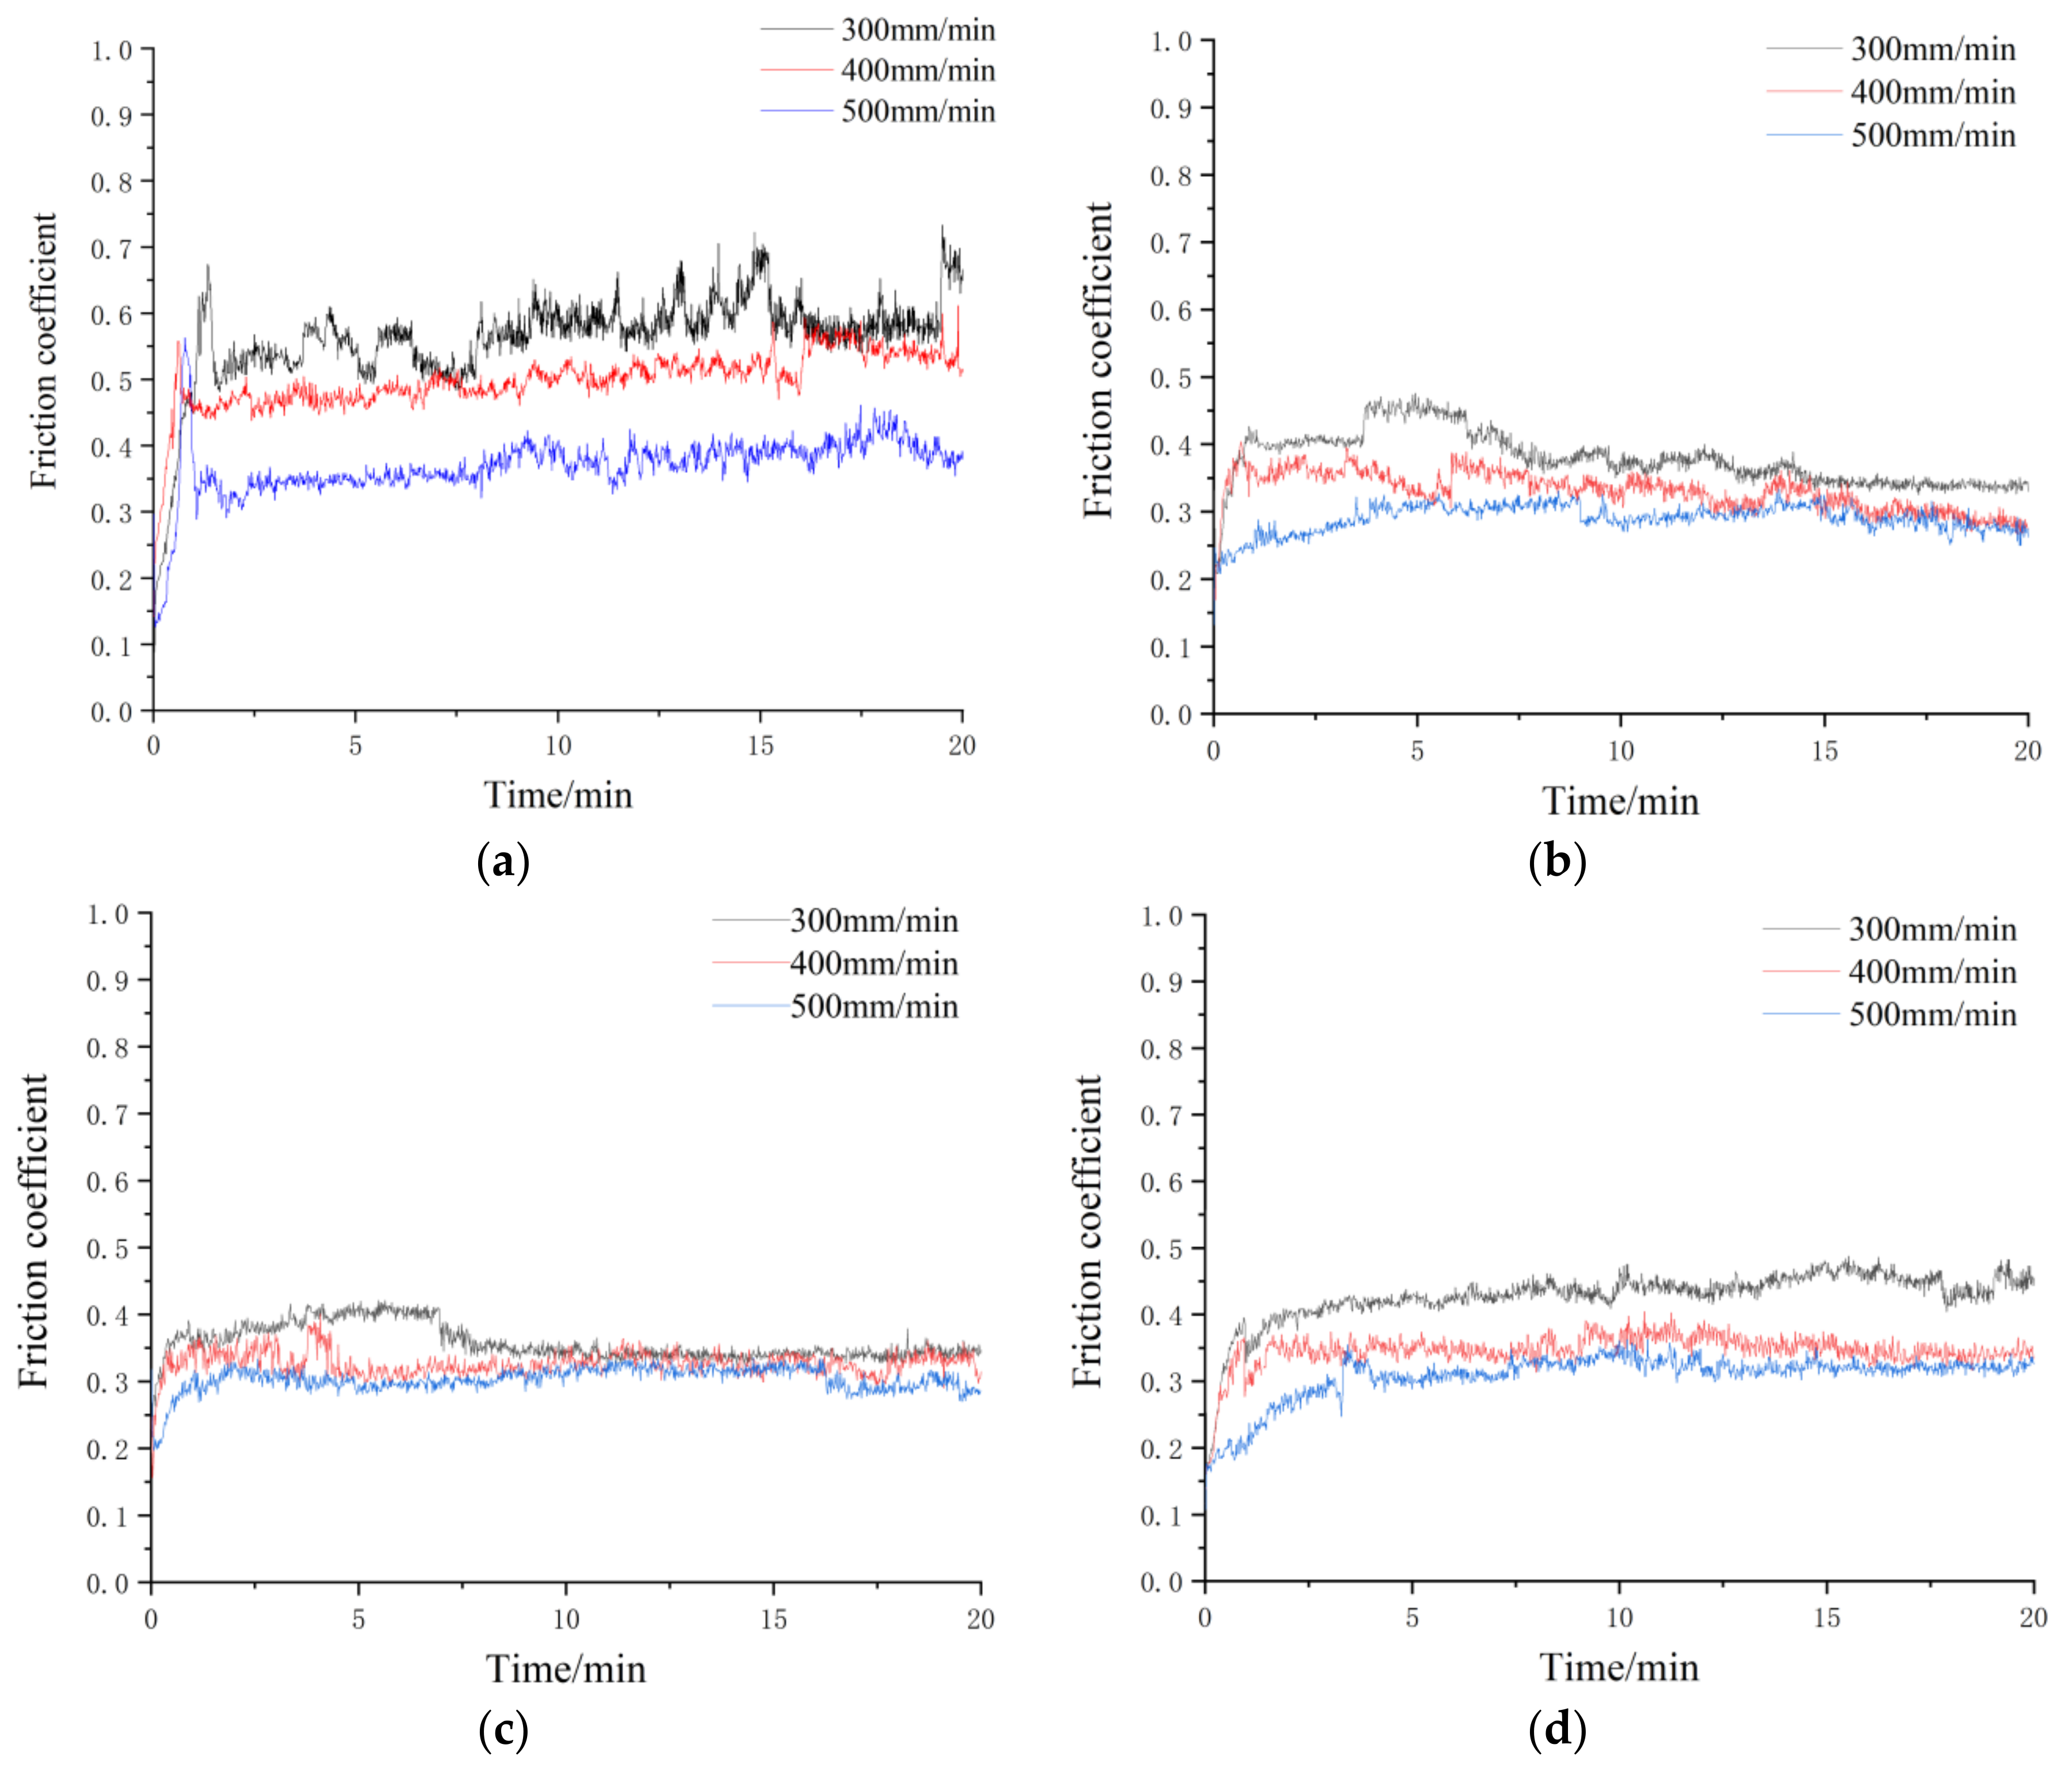
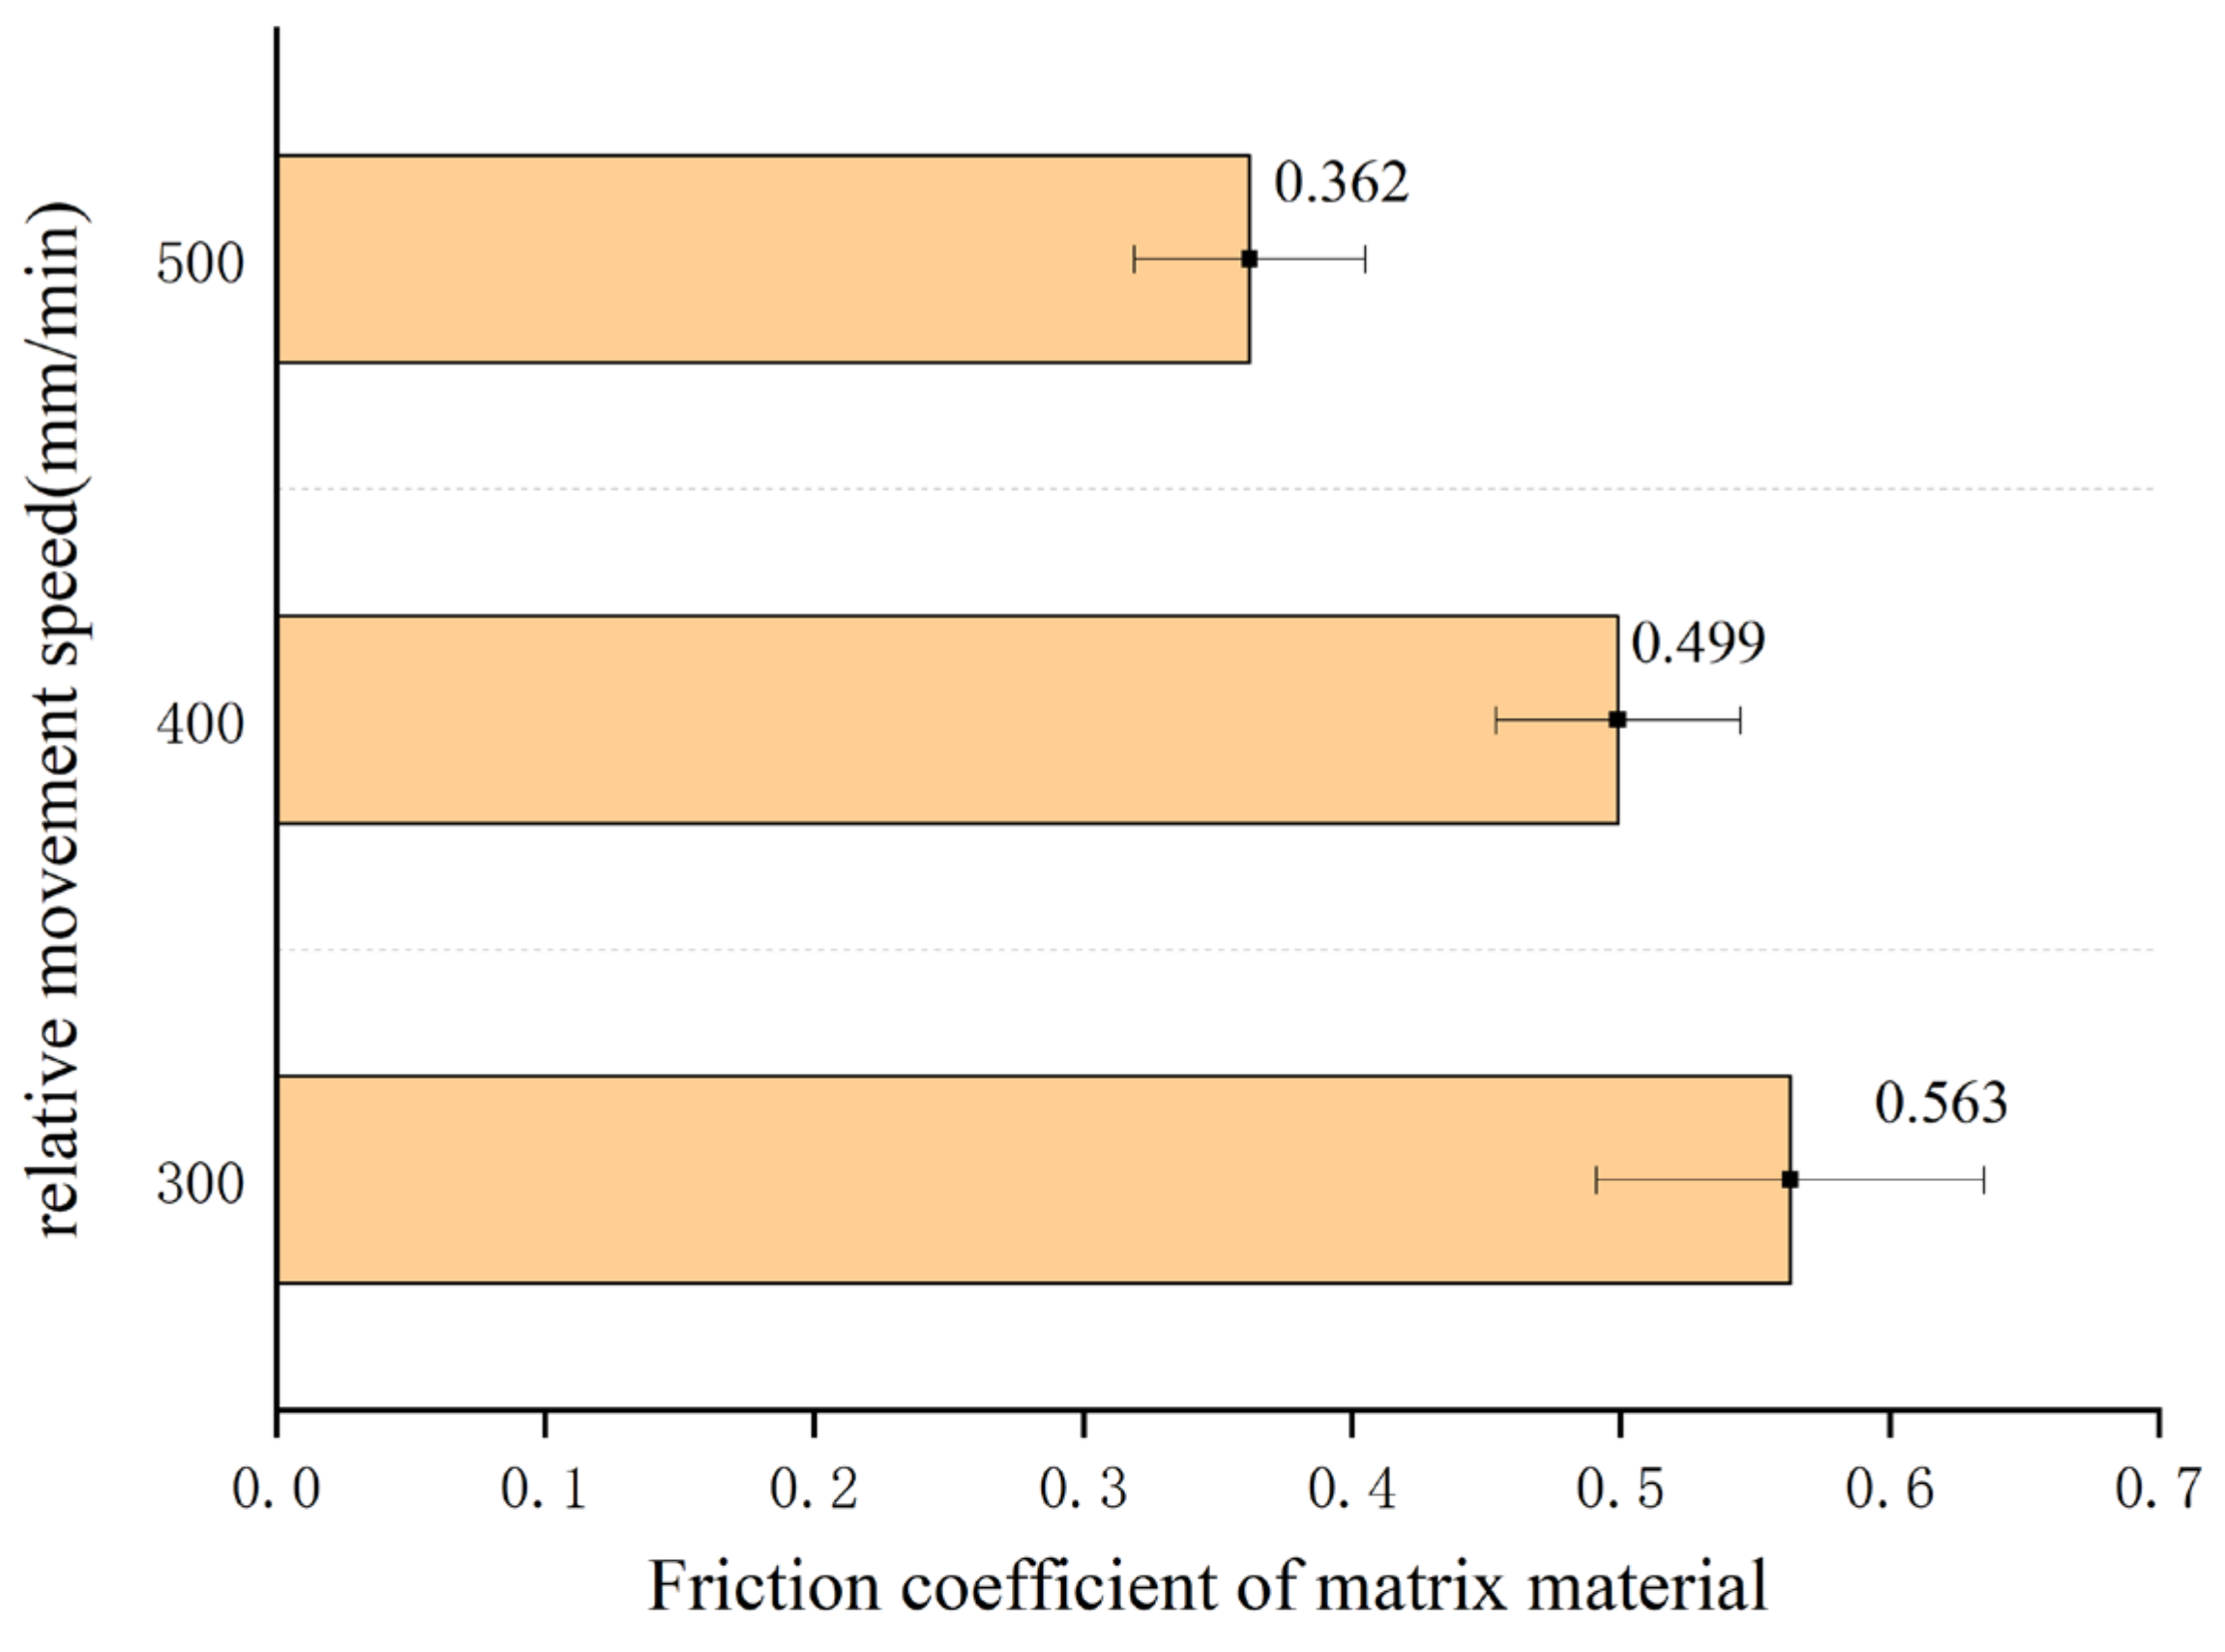
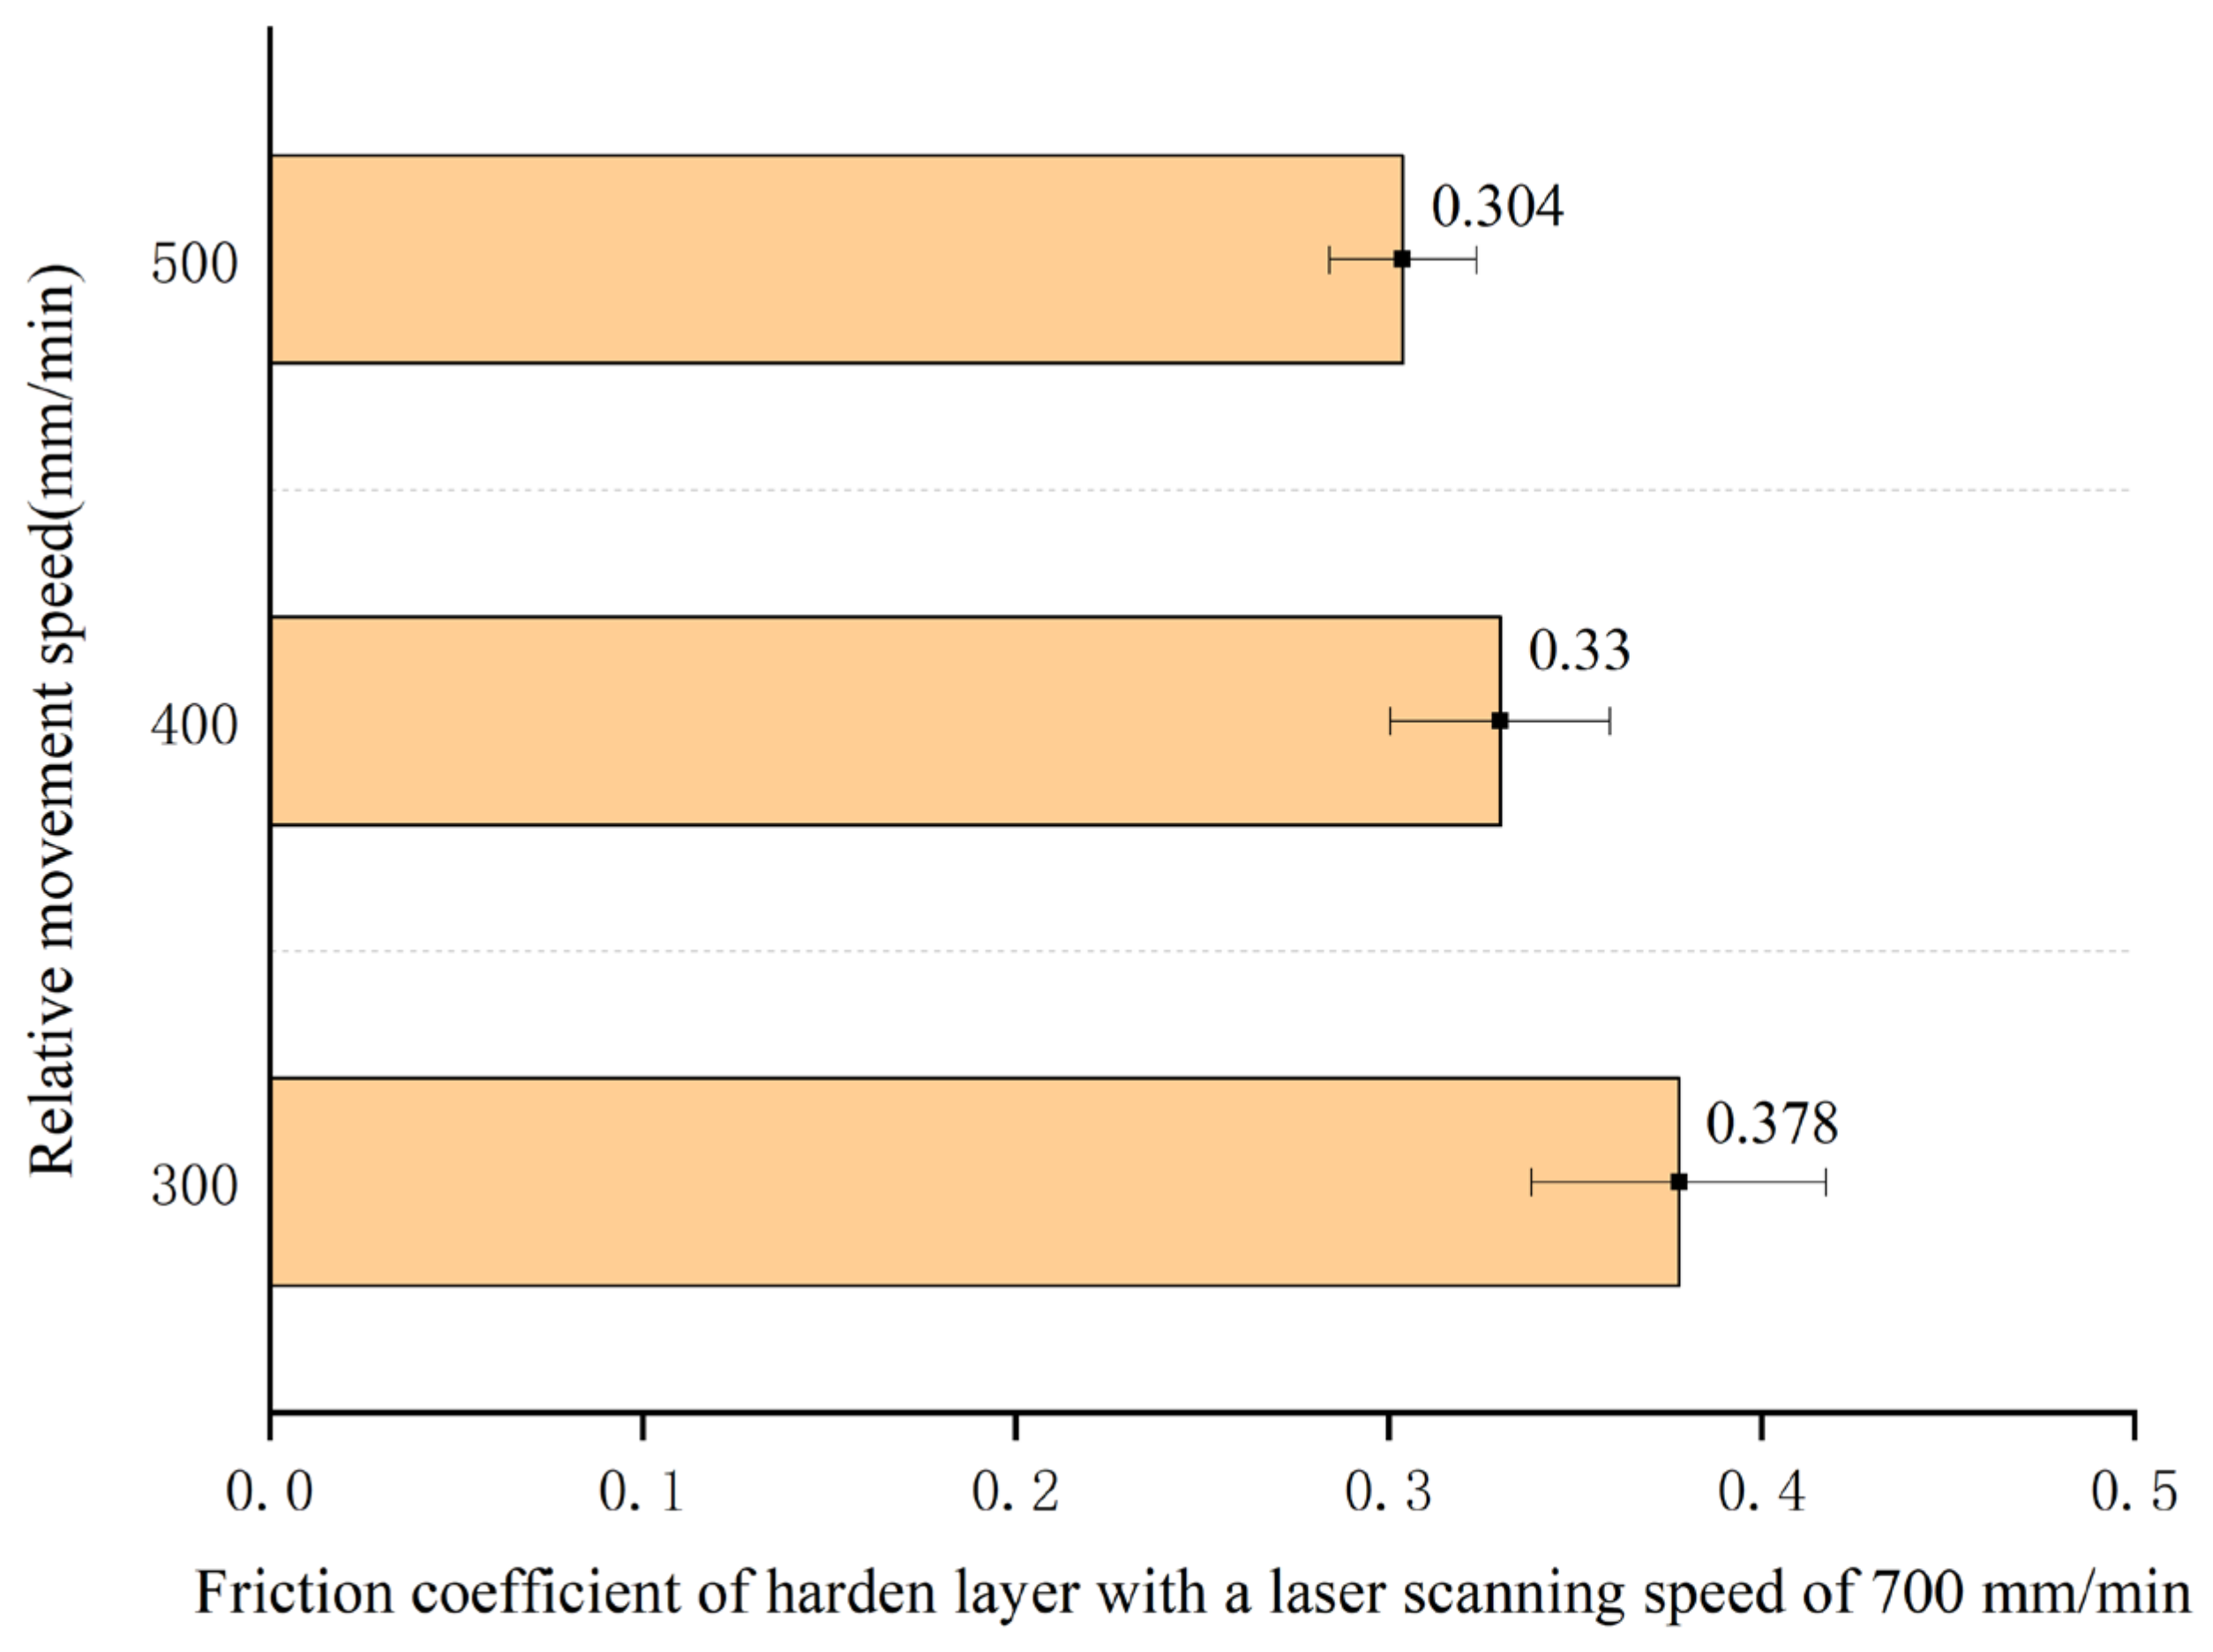
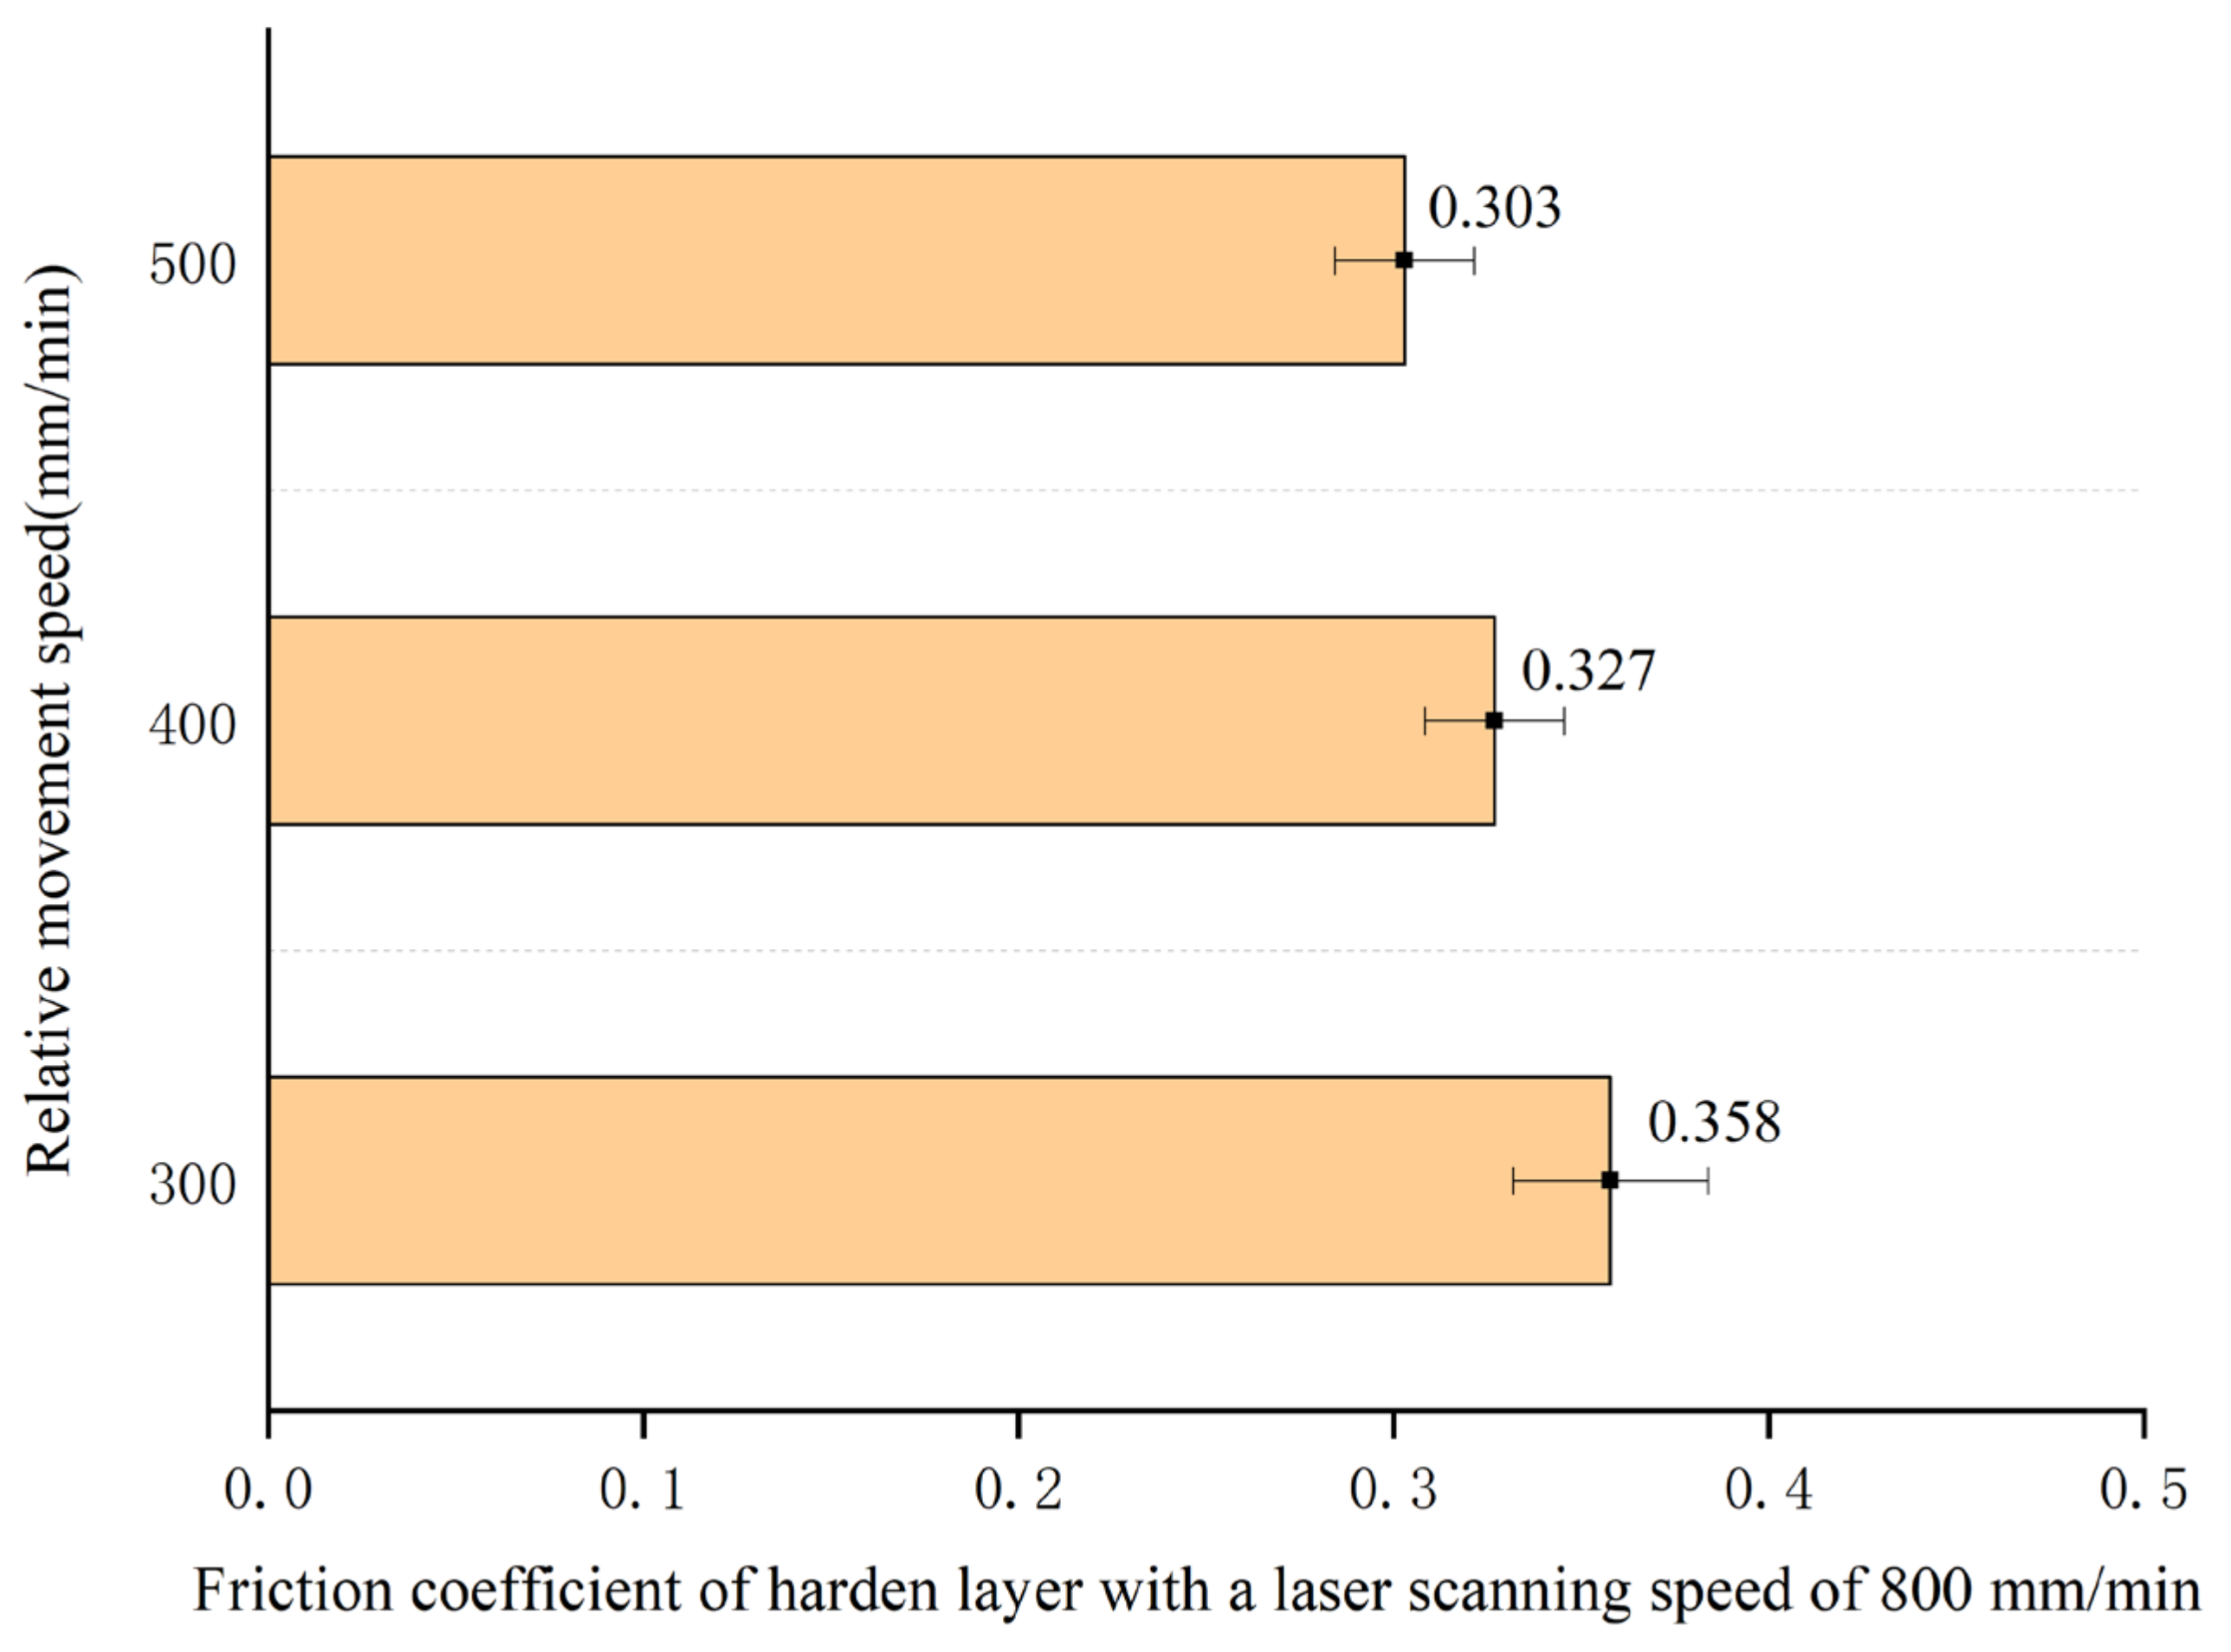
4.1.1. Friction Coefficient at Different Speeds

Figure 17 shows the typical variation of the friction coefficient between the ball and the matrix material and the ball and the hardened layer with relative movement speed.
As shown in Figure 17a, the friction coefficient of the matrix material first increased significantly, then the curve flattened with some fluctuation within a certain range [26]. Obvious furrows appeared in the early stage of wear, leading to a sudden increase in the friction coefficient, followed by alternating adhesion and shearing between the sample and the ball.
As the speed of relative movement between the ball and sample increased, the average friction coefficient and fluctuation in friction coefficient decreases. As sliding progressed, fluctuation in the average friction coefficient tended to stabilize as the friction surface was less prone to sticking, the relative movement was smooth, and the friction force was reduced with faster sliding speeds.
Furthermore, at each relative movement speed, three repeated friction experiments were performed on the matrix material, and the average value and standard deviation of the friction coefficient at different relative movement speeds were obtained, as shown in Figure 18.
As showed in Figure 18, as the relative movement speed increased, the drop in the friction coefficient increased.
Similarly, at each relative movement speed, three repeated friction experiments were performed on the hardened layers with different laser scanning speeds.
Figure 19 shows the average friction coefficient and standard deviation of a hardened layer with a scanning speed of 700 mm/min at the different relatively movement speeds.
As shown in Figure 19, the average friction coefficient and fluctuation of the friction coefficient significantly decreased with increasing relative movement speed after laser hardening, compared with the matrix material. This is as laser hardening led to changes in the structure and increased the hardness of the material. As a result, the difference in friction coefficients at different relative movement speeds decreased, leading to a significant increase in resistance to changes in relative movement speed, mainly due to an obvious reduction in the adhesion of the strengthened material.
Figure 20 and Figure 21 shows the average friction coefficient and standard deviation of hardened layers with a scanning speed of 800 mm/min and 900 mm/min at the different relatively movement speeds, respectively.
Compared with laser scanning speeds of 800 mm/min and 900 mm/min, as the scanning speed decreased, the average friction coefficient and speed fluctuation also decreased, and the resistance to speed fluctuations increased. This is mainly as the surface layer of the material heated up and cooled quickly after laser hardening. The scanning speed was lower, and the surface layer was transformed into martensite with smaller grain size and higher hardness.
From Figure 18, Figure 19, Figure 20 and Figure 21, changes in the friction coefficient before and after hardening can be obtained, as shown in Table 2.
Laser hardening effectively reduced the friction coefficient. The effect was more evident at lower relative movement speeds as the degree of adhesive wear decreased as the relative movement speed increased, therefore, the impact on wear decreased. The friction coefficient of the laser hardened material was smallest after laser hardening at a scanning speed of 800 mm/min.

4.1.2. Friction Coefficient of Hardened Layer under Various Normal Forces

The hardened layer obtained by laser hardening at a scanning speed of 800 mm/min was taken as an example. Typical variation of friction coefficients of the hardened layer under the different normal force values is illustrated in Figure 22.
As the normal force increased, the friction coefficient significantly increased and tended to stabilize. The increase in normal force may cause a sudden change in the friction coefficient, due to possible peeling of large areas.
At each normal force, three repeated friction experiments were performed and friction coefficients under various normal forces were obtained, as shown in Table 3.
In the laser hardened layer, the actual friction contact area increased as the normal force increased, such that the friction coefficient significantly increased, the variance and standard deviation of the speed significantly increased, and volatility also significantly increased.

4.2. Wear Rate Calculation

Wear rate α is the wear quality per minute [27], expressed as
α = Δ m t
where Δm is the change in mass of the sample before and after wear(mg) and t is the wear time in min. Three experiments were performed in each case and the average value was taken as the result. The friction states under various wear conditions are presented in Table 4.

4.3. Analysis of Wear Rate and Wear Morphology

4.3.1. Wear Rate and Wear Morphology before and after Laser Hardening

As shown in Table 4, as the relative movement speed increases, the wear rate of the matrix will significantly increase. After laser hardening, the increase in wear rate decreases significantly as the anti-friction performance is significantly enhanced by the increase in material hardness.
For the hardened layer, the 40CrNiMo steel contained Mo, which acted as a solid lubricant. When relative movement speed was lower, the Mo element and carbon formed spherical carbides of the harder layer, the martensite and carbides formed a high-hardness framework, and retained austenite was the tough filler. As the relative movement speed increased, the friction may induce austenite phase transformation, which reduced the ductile fillers in hardened layer. At the same time, the friction surface temperature increased, and the material strength decreased, resulting in a decrease in the wear resistance of the harder layer.
Therefore, hard particles were easier to cut on the friction surface, increasing the abrasive wear between the ball and the sample. At the same time, the increase in relative movement speed made the impact between the micro peaks intensified, so the wear degree between the ball surface and the samples also increased.
The wear morphology of the matrix at a relative movement speed of 400 mm/min and under a normal force of 20 N is shown in Figure 23. Wear debris adhered to and accumulated on the friction surface, accompanied by pitting, indicating that serious adhesive wear occurred. Moreover, small bumps were present on the wear debris, indicating that the oxidative wear also occurred. Energy Dispersive Spectrometer (EDS) tests were performed for small bumps. The results were presented in Figure 24a,b; the element contents were present in Table 5. It can be seen the diffraction peak of oxygen element is exhibited, which effectively verifies the presence of oxidative wear. Obvious furrows indicate that abrasive wear occurred, and cracks appeared in some locations due to excessive normal force. Many types of wear can be observed on the matrix and the surface quality is poor after wear.
After laser hardening, the wear mechanism changed. As an example, the surface morphology at a force of 20 N and friction speed of 400 mm/min after laser hardening at a relative speed of 700 mm/min is shown in Figure 25. During the ball grinding process, the bottom of the ball became smoother, and the roughness was reduced. The area of contact between the bottom of the ball and the sample was larger; small scratches or furrows appeared, suggesting abrasive wear. The area in contact with the ball sides was more prone to adhesive wear. However, the wear degree was significantly lower than that of the matrix, and the surface wear resistance of the sample was significantly enhanced. In order to efficiently analyze the wear mechanism, the composition of the wear debris was detected by EDS. The EDS result at area A in Figure 25 is shown in Figure 26.
From the EDS result, it can be seen the diffraction peak of oxygen element is exhibited, so oxidative wear also existed.
In contrast, after laser scanning at a speed of 800 mm/min, less adhesive wear occurred in the area in contact with the ball surface at a relative movement speed of 400 mm/min, and less residual debris was seen on the surface due to the higher surface hardness. Furrows appeared where the sample was in contact with the bottom of the ball, as well as small pits due to abrasive wear, as shown in Figure 27. The EDS result at area A in Figure 20 is shown in Figure 28.
From the EDS result, it can be seen the diffraction peak of oxygen element is exhibited, so oxidative wear also existed.

4.3.2. Wear Mechanism of Hardened Layer at Different Relative Friction Speeds

In order to compare the wear mechanism of the hardened layer at different relative movement speeds, the TESCAN Mira3 scanning electron microscope was used to EDS test for other sets of experimental samples. As the electron microscope was different from a Zeiss Sigma300 scanning electron microscope, the picture effects were different.
The surface morphology of hardened layer with a scanning speed of 700 mm/min at a normal force of 20 N and relative movement speed of 300 mm/min, 400 mm/min, and 500 mm/min, respectively were shown in Figure 29. Moreover, the composition of the debris was detected by Energy Dispersive Spectrometer (EDS). Figure 30a–f were the EDS analysis results in Figure 29 marked in A–F, respectively.
From Figure 29a, it can be seen adhesive wear and abrasive wear were obvious at the relative movement speed of 300 mm/min. From Figure 30a,b, the diffraction peak of oxygen element is obviously exhibited, which verified oxidative wear also occurred.
From Figure 29b, it can be seen adhesive wear and abrasive wear were still obvious at the relative movement speed of 400 mm/min. The area in contact with the ball bottom surface mainly underwent abrasive wear. The adhesive wear of the sample area in contact with the ball bottom was less than that of the sample area in contact with the sides of the ball. From Figure 30c,d, the diffraction peak of oxygen element is obviously exhibited, which verified oxidative wear occurred.
From Figure 29c, it can be seen furrows were very obvious, so abrasive wear was the main wear mechanism and adhesive wear has been significantly reduced at the relative movement speed of 500 mm/min. From Figure 30e,f, it can be seen the diffraction peak of oxygen element was not tall, which verified oxidative wear has been significantly reduced.
In summary, when the relative friction speed is lower, abrasive wear, adhesive wear, and oxidative wear all exist. As the speed increases, these forms of wear still exist. Compared with the abrasive wear at lower speed, the degree of abrasive wear at higher speed will increase significantly reduced.

4.3.3. Influence of Normal Force on Wear Rate and Wear Morphology

Table 4 shows a significant increase in wear under force of 50 N and 80 N, compared with 20 N, at a friction speed of 500 mm/min after laser scanning at a speed of 800 mm/min. This is mainly due to the increase in normal force and penetration depth of the material during the friction process, which causes more material loss. The surface morphology under a force 50 N and a friction speed of 500 mm/min after laser hardening at a scanning speed of 800 mm/min is shown in Figure 31.
Under a normal force of 50 N, peeling occurred mainly in the area in contact with the bottom of the ball. The increase in normal force resulted in an increase in the contact area between the ball and the material, which easily leads to a large wear area. Some pits and oxides were noted, indicating abrasive wear and oxidative wear. Wear debris accumulated and peeling occurred in the area in contact with the side of the ball, suggesting adhesive wear and abrasive wear. When the normal force is high, hard particles are more likely to appear between the contact surfaces and cause abrasive wear.
The surface morphology under a force of 80 N and friction speed of 500 mm/min after laser hardening at a scanning speed of 800 mm/min is shown in Figure 32.
Stratification occurred under a normal force of 80 N due to excessive normal force. In the upper layer, the main type of wear was adhesive wear. In the bottom layer, obvious ploughing was observed during the wear process, abrasive wear also significantly increased, and oxidative wear occurred. In the bottom layer, the bottom of the ball was in close contact with the sample due to normal force, and some abrasive particles were easily compressed between the contact surfaces and were not easy to dislodge during sliding friction. In the upper layer, the vertical downward force can be decomposed in two directions: tangential to the contact surface and perpendicular to the contact surface. The tangential force is conducive to adhesive wear.

5. Conclusions

In order to meet the surface requirement of sprag clutch wedge, the structural characteristics of 40CrNiMo steel and its sliding friction properties against Gcr15 steel after broadband laser hardening were investigated. The following main conclusions were obtained.
(1) After laser hardening, surface hardness of 40CrNiMo steel is two-fold higher than the matrix metal and the depth of the hardened layer decreases as the scanning speed increases. In the experiment, the laser power was 2010 kW, the defocus was 192 mm, and the scanning speed was 700–1020 mm/min, which meets the requirements of the wedge material of the sprag clutch. The distance from the position of maximum hardness on the surface of laser hardened samples varies with different scanning speeds.
(2) The hardened material can be divided into three layers: the hardened layer, transition layer, and matrix. The hardened layer presents as a crescent shape, consisting of acicular and lath martensite, retained austenite, and partial carbides. The slower the scanning speed, the more uniform the martensitization in the transition zone, the more obvious the bulge phenomena, and the greater the internal stress. In the hardened layer, the martensite grain size is small, the dislocation density is large, and flaky martensite with ridges can be observed.
(3) The average friction coefficient of the material after laser hardening decreased as the relative movement speed increases, and fluctuation of the friction coefficient also decreased.
(4) Friction coefficient values and fluctuation of the laser hardened material increased with increasing normal force. The wear mechanism of the hardened layer included abrasive wear, adhesive wear, and oxidative wear. An increase in normal force resulted in an increase wear rate and promoted spalling.
(5) In the area near the surface, laser hardening with a laser power of 2010 kW, defocus of 192 mm, and scanning speed of 800 mm/min can best meet the surface wear resistance requirements of the wedge material.

Author Contributions

Conceptualization, J.L. and H.Y.; methodology, J.L.; software, Y.Z.; validation, J.L., H.Y. and S.L.; formal analysis, H.Y.; investigation, J.L.; resources, P.Z.; data curation, J.L.; writing—original draft preparation, J.L., H.Y., Y.Z. and P.Z.; writing—review and editing, S.L.; visualization, Y.Z.; supervision, S.L.; project administration, H.Y.; funding acquisition, H.Y. All authors have read and agreed to the published version of the manuscript.

Funding

This research was funded by the National Natural Science Foundation of China (52075552) and the Natural Science Foundation of Hunan Province, China (2019JJ70081).

Institutional Review Board Statement

Not applicable.

Informed Consent Statement

Not applicable.

Data Availability Statement

Not applicable.

Conflicts of Interest

The authors declare no conflict of interest.

References

  1. Li, J.; Feng, A.; Zhou, J.; Sun, Y.; Chen, H.; Huang, S.; Meng, X. High-temperature wear properties and microstructural characterization of 40CrNiMo structural steel treated by cryogenic laser peening. Vacuum 2018, 157, 320–323. [Google Scholar] [CrossRef]
  2. Liu, J.; Yang, H. Strengthening and application research of carburized and subsequently niobiumized 40CrNiMo steel. In Advanced Materials Research; Trans. Tech. Publications Ltd.: Freienbach, Swizerland, 2014; Volume 1015, pp. 185–188. [Google Scholar]
  3. Lee, J.-H.; Jang, J.-H.; Joo, B.-D.; Son, Y.-M.; Moon, Y.-H. Laser Surface Hardening of AISI H13 Tool Steel. Trans. Nonferr. Met. Soc. China 2009, 19, 917–920. [Google Scholar] [CrossRef]
  4. Wang, H.; Kawahito, Y.; Yoshida, R.; Nakashima, Y.; Shiokawa, K. A model to calculate the laser absorption property of actual surface. Int. J. Heat Mass Transf. 2018, 118, 562–569. [Google Scholar] [CrossRef]
  5. Fakir, R.; Barka, N.; Brousseau, J. Case study of laser hardening process applied to 4340 steel cylindrical specimens using simulation and experimental validation. Case Stud. Therm. Eng. 2018, 11, 15–25. [Google Scholar] [CrossRef]
  6. Mosavi, A.; Salehi, F.; Nádai, L.; Károly, S.; Gorji, N.E. Modeling the temperature distribution during laser hardening process. Results Phys. 2020, 16, 102883. [Google Scholar] [CrossRef]
  7. Kong, D.; Zhang, L.; Song, R.; Fu, G.; Ye, C. Effect of Laser Quenching on Fatigue Properties and Fracture Morphologies of 40CrNiMo High Strength Steel. Chin. J. Lasers 2013, 40, 1103005. [Google Scholar] [CrossRef]
  8. Anusha, E.; Kumar, A.; Shariff, S.M. A novel method of laser surface hardening treatment inducing different thermal processing condition for Thin-sectioned 100Cr6 steel. Opt. Laser Technol. 2020, 125, 106061. [Google Scholar] [CrossRef]
  9. Chen, Y.; Zhao, X.; Liu, P.; Pan, R.; Ren, R. Influences of local laser quenching on wear performance of D1 wheel steel. Wear 2018, 414–415, 243–250. [Google Scholar] [CrossRef]
  10. Wagh, S.V.; Bhatt, D.V.; Menghani, J.V.; Bhavikatti, S.S. Effects of laser hardening process parameters on hardness depth of Ck45 steel using Taguchi’s optimization technique. IOP Conf. Ser. Mater. Sci. Eng. 2020, 810, 12027. [Google Scholar] [CrossRef]
  11. Shariff, S.; Pal, T.; Padmanabham, G.; Joshi, S. Influence of chemical composition and prior microstructure on diode laser hardening of railroad steels. Surf. Coat. Technol. 2013, 228, 14–26. [Google Scholar] [CrossRef]
  12. Idana, F.I.; Akimov, O.; Golovko, L.; Goncharuk, O.; Kostyk, K. The study of the influence of laser hardening conditions on the change in properties of steels. East.-Eur. J. Enterp. Technol. 2016, 2, 69. [Google Scholar] [CrossRef] [Green Version]
  13. Buling, A.; Sändker, H.; Stollenwerk, J.; Krupp, U.; Hamann-Steinmeier, A. Laser surface pretreatment of 100Cr6 bearing steel—Hardening effects and white etching zones. Appl. Surf. Sci. 2016, 378, 564–571. [Google Scholar] [CrossRef]
  14. Ganeev, R. Low-power laser hardening of steels. J. Mater. Process. Technol. 2002, 121, 414–419. [Google Scholar] [CrossRef]
  15. Tani, G.; Fortunato, A.; Ascari, A.; Campana, G. Laser surface hardening of martensitic stainless steel hollow parts. CIRP Ann. 2010, 59, 207–210. [Google Scholar] [CrossRef]
  16. Farshidianfar, M.H.; Khajepouhor, A.; Gerlich, A. Real-time monitoring and prediction of martensite formation and hardening depth during laser heat treatment. Surf. Coat. Technol. 2017, 315, 326–334. [Google Scholar] [CrossRef]
  17. Cozza, R.C. Influence of the normal force, abrasive slurry concentration and abrasive wear modes on the coefficient of friction in ball-cratering wear tests. Tribol. Int. 2014, 70, 52–62. [Google Scholar] [CrossRef]
  18. Gomez, V.A.; Macêdo, M.; Souza, R.; Scandian, C. Effect of abrasive particle size distribution on the wear rate and wear mode in micro-scale abrasive wear tests. Wear 2015, 328–329, 563–568. [Google Scholar] [CrossRef]
  19. Baptista, A.; Silva, F.; Pinto, G.; Porteiro, J.; Míguez, J.; Alexandre, R.; Sousa, V. Influence of the ball surface texture in the dragging of abrasive particles on micro-abrasion wear tests. Wear 2021, 476, 203730. [Google Scholar] [CrossRef]
  20. García-León, R.; Martínez-Trinidad, J.; Zepeda-Bautista, R.; Campos-Silva, I.; Guevara-Morales, A.; Martínez-Londoño, J.; Barbosa-Saldaña, J. Dry sliding wear test on borided AISI 316L stainless steel under ball-on-flat configuration: A statistical analysis. Tribol. Int. 2021, 157, 106885. [Google Scholar] [CrossRef]
  21. Khorram, A.; Jamaloei, A.D.; Jafari, A. Surface transformation hardening of Ti-5Al-2.5Sn alloy by pulsed Nd: YAG laser: An experimental study. Int. J. Adv. Manuf. Technol. 2019, 100, 3085–3099. [Google Scholar] [CrossRef]
  22. Cordero, Z.C.; Knight, B.E.; Schuh, C.A. Six decades of the Hall-Petch effect—A survey of grain-size strengthening studies on pure metals. Int. Mater. Rev. 2016, 61, 495–512. [Google Scholar] [CrossRef]
  23. Hussain, A.; Hamdani, A.H.; Akhter, R.; Aslam, M. Laser Surface Hardening of Groove Edges. J. Phys. Conf. Ser. 2013, 439, 012006. [Google Scholar] [CrossRef] [Green Version]
  24. Nielsen, M.H.; Aloni, S.; de Yoreo, J.J. In situ TEM imaging of CaCO₃ nucleation reveals coexistence of direct and indirect pathways. Science 2014, 345, 1158–1162. [Google Scholar] [CrossRef] [PubMed]
  25. Siow, P.C.; Ghani, J.A.; Rizal, M.; Jaafar, T.R.; Ghazali, M.J.; Che Haron, C.H. Surface characterisation of TiCxN1−x coatings processed by cathodic arc physical vapour deposition: XPS and XRD analysis. Surf. Interface Anal. 2019, 51, 611–617. [Google Scholar] [CrossRef]
  26. Kim, J.W.; Joo, B.S.; Jang, H. The effect of contact area on velocity weakening of the friction coefficient and friction instability: A case study on brake friction materials. Tribol. Int. 2019, 135, 38–45. [Google Scholar] [CrossRef]
  27. Patel, K.; Liu, G.; Shah, S.R.; Özel, T. Effect of Micro-Textured Tool Parameters on Forces, Stresses, Wear Rate and Variable Friction in Titanium Alloy Machining. J. Manuf. Sci. Eng. 2019, 142, 021007. [Google Scholar] [CrossRef]
Figure 1. Laser hardening process. (a) Laser hardening, (b) untreated sample, and (c) a sample after laser hardening.
Coatings 11 01282 g001
Figure 2. Experimental equipment: 1—lift motor, 2—left-right motor, 3—lift translation table, 4—translation table, 5—sensor, 6—fixture, 7—instrument main table, 8—friction assembly, 9—steel ball fixture, 10—sample, 11—sample fixture, 12—lifting knob, and 13—knob.
Coatings 11 01282 g002
Figure 3. The relationship between the laser scanning speed and the surface Vickers hardness of the hardened layer.
Coatings 11 01282 g003
Figure 4. Variation in hardness of 40CrNiMo steel samples with distance from the surface under different scanning speeds.
Coatings 11 01282 g004
Figure 5. Metallographic cross-section of laser hardened layer with a scanning speed of 800 mm/min; (a) crescent shape on left side and (b) thickness at center of hardened area.
Coatings 11 01282 g005
Figure 6. Metallographic cross-section of laser hardened layer with a scanning speed of 800 mm/min; (a) thickness of middle position and (b) crescent shape on right side.
Coatings 11 01282 g006
Figure 7. Morphology of hardened layer; (a) 1000 magnification and (b) area 1 at 2000× magnification.
Coatings 11 01282 g007
Figure 8. Morphology of the transition zone; (a) 500× magnification and (b) area 2 at 2000× magnification.
Coatings 11 01282 g008
Figure 9. Morphology of matrix material; (a) 1000× magnification and (b) area 3 at 2000× magnification.
Coatings 11 01282 g009
Figure 10. Morphology of transition zone at a scanning speed of 700 mm/min; (a) 500× magnification and (b) area 4 at 2000× magnification.
Coatings 11 01282 g010
Figure 11. Representative TEM image of martensite and corresponding diffraction pattern.
Coatings 11 01282 g011
Figure 12. Representative TEM image of austenite and corresponding diffraction pattern.
Coatings 11 01282 g012
Figure 13. Acicular martensite with ridges.
Coatings 11 01282 g013
Figure 14. Flake-like and lath martensite.
Coatings 11 01282 g014
Figure 15. X-ray diffraction plot of hardened layer at a scanning speed of 700 mm/min, 800 mm/min, and 900 mm/min.
Coatings 11 01282 g015
Figure 16. Retained austenite content of the hardened layer after different laser scanning speed.
Coatings 11 01282 g016
Figure 17. Variation of friction coefficient; (a) friction coefficient of the matrix, (b) friction coefficient after laser hardening with a scanning speed of 700 mm/min, (c) friction coefficient after laser hardening with a scanning speed of 800 mm/min, and (d) friction coefficient after laser hardening with a scanning speed of 900 mm/min.
Coatings 11 01282 g017
Figure 18. Friction coefficient of matrix material at different relative movement speed.
Coatings 11 01282 g018
Figure 19. Friction coefficient of hardened layer with a laser scanning speed of 700 mm/min at different movement speed.
Coatings 11 01282 g019
Figure 20. Friction coefficient of hardened layer with a laser scanning speed of 800 mm/min at different movement speed.
Coatings 11 01282 g020
Figure 21. Friction coefficient of hardened layer with a laser scanning speed of 900 mm/min at different movement speed.
Coatings 11 01282 g021
Figure 22. Friction coefficient of laser hardened layer under different relative normal force values.
Coatings 11 01282 g022
Figure 23. Wear morphology of the matrix.
Coatings 11 01282 g023
Figure 24. The EDS analysis results; (a) the EDS analysis results of area A in Figure 23 and (b) the EDS analysis results of the area B in Figure 23.
Coatings 11 01282 g024aCoatings 11 01282 g024b
Figure 25. Wear morphology of hardened layer after laser hardening at a scanning speed of 700 mm/min.
Coatings 11 01282 g025
Figure 26. The EDS analysis results of area A in Figure 25.
Coatings 11 01282 g026
Figure 27. Wear morphology of hardened layer after laser hardening at a scanning speed of 800 mm/min.
Coatings 11 01282 g027
Figure 28. The EDS analysis results of area A in Figure 27.
Coatings 11 01282 g028
Figure 29. The wear surface morphology of hardened layer; (a) the wear surface morphology of hardened layer at movement speed of 300 mm/min, (b) the wear surface morphology of hardened layer at the movement speed of 400 mm/min, and (c) the wear surface morphology of hardened layer at the movement speed of 500 mm/min.
Coatings 11 01282 g029
Figure 30. (af) corresponds to the EDS analysis results of the debris in Figure 29 marked in A–F.
Coatings 11 01282 g030
Figure 31. Wear morphology under a normal force of 50 N.
Coatings 11 01282 g031
Figure 32. Surface morphology under a force of 80 N and friction speed is 500 mm/min after laser hardening at a scanning speed of 800 mm/min. (a) 50× magnification and (b) area 5 at 200× magnification.
Coatings 11 01282 g032
Table 1. Main chemical composition of 40CrNiMo (wt.%).
CSiMnCrMoNiFe
0.360.230.680.770.181.33Balance
Table 2. Average friction coefficients at different relative movement speeds.
Speed
(mm/min)
Friction Coefficient
(Matrix Material)
Friction Coefficient
(Laser Hardening with a Scanning Speed of 700 mm/min)
Friction Coefficient
(Laser Hardening with a Scanning Speed of 800 mm/min)
Friction Coefficient
(Laser Hardening with a Scanning Speed of 900 mm/min)
3000.563 ± 0.0720.378 ± 0.0400.358 ± 0.0260.402 ± 0.039
4000.499 ± 0.0450.330 ± 0.0290.327 ± 0.0190.346 ± 0.036
5000.362 ± 0.0430.304 ± 0.0200.303 ± 0.0180.308 ± 0.035
Table 3. Friction coefficient under different normal force values.
Normal Force (N)Friction CoefficientStandard Deviation
200.3030.019
500.3810.040
800.4370.045
Table 4. Friction states under various wear conditions.
OrganizationForce
(N)
Time
(min)
Movement Speed
(mm/min)
Laser Scanning Speed
(mm/min)
Wear Rate
(10−3 mg/min)
Standard
Deviation
Matrix2020300/2.350.245
Matrix2020400/4.000.421
Matrix2020500/5.850.592
Hardening
layer
20203007001.400.138
Hardening
layer
20204007001.800.181
Hardening
layer
20205007002.000.202
Hardening
layer
20203008001.350.142
Hardening
layer
20204008001.600.182
Hardening
layer
20205008001.950.205
Hardening
layer
50205008004.500.476
Hardening
layer
802050080011.001.213
Table 5. Element content.
Area A in Figure 23 Area B in Figure 23
Elementwt%σElementwt%σ
O20.060.24O26.950.24
Fe74.670.38Fe68.730.31
C2.640.35C2.890.31
Si0.240.05Si0.130.04
Mn0.500.08Mn0.340.07
Cr0.540.06Cr0.410.05
Mo0.230.13Mo0.040.11
Ni1.030.11Ni0.450.09
Al0.090.06Al0.050.05
Publisher’s Note: MDPI stays neutral with regard to jurisdictional claims in published maps and institutional affiliations.

