Abstract
Zr-based nitrides and oxynitrides were deposited by reactive cathodic arc evaporation in monolayer and double-layer structures with the aim of increasing the corrosion protection of 304L stainless steel (SS) in a biomedical aggressive environment. All coatings had a total thickness of 1.2 µm. Compared to the bare substrate, the surface roughness of the coated samples was higher, the presence of microdroplets being revealed by scanning electron micrography (SEM). The X-ray diffraction investigation of the ZrN phases revealed that the peaks shifted towards lower Bragg angles and the lattice constants increased as a result of Si and O2 inclusion in ZrN lattice, and of the ion bombardment characteristic of the cathodic arc method, augmented by the applied bias substrate. SS/ZrSiN/ZrSi(N,O) showed the best corrosion performance in an acidic environment (0.9% NaCl and 6% H2O2; pH = 4), which was ascribed to the blocking effect of the interfaces, which acted as a corrosion barrier for the electrolyte ingress. Moreover, the aforementioned bilayer had the highest amount of Si and O in the composition of the top layer, forming a stable passive layer with beneficial effects on corrosion protection.
1. Introduction
304L stainless steel, abbreviated in the following paper as SS, is extensively used in dentistry [1,2], orthodontics [3,4], and orthopedics [5] due to its low cost, related processability, high corrosion resistance (specific to stainless steel alloys), suitable bio-mechanical performance, and advantageous bio-affinity. However, there are also drawbacks related to its use as a biomaterial, such as poor bio-functional performance [6] and reduced local corrosion resistance if exposed to chloride ion solutions [7,8], various macromolecules comprised of one or more long chains of polypeptides, or even just to amino acids [9,10,11]—all of which are present in human body fluids. Due to this peculiarity, SS releases metal ions in its surroundings when implanted in the body, producing noxious effects on the tissues [12]. It was reported that metallic ions (mainly chromium and nickel) resulting from the in vitro corrosion of SS hinder lymphocyte multiplication, thus leading to the insufficiency of the body immune response. Therefore, techniques for the improvement of corrosion resistance have been developed. One way is coating 304L steel with thin films that have high corrosion resistance, high adhesion, and good biocompatibility.
Ceramic coatings, such as refractory nitrides based on transition metals (e.g., TiN and ZrN) deposited by physical vapor deposition (PVD), have a wide range of applications due to their high hardness, high adhesion, wear-resistance and low friction coefficient, superior corrosion resistance in aggressive environments, superior electric and thermal conductivity, significant chemical and thermal stability at high temperatures, optical properties similar to gold, and complementary metal–oxide–semiconductor compatibility [13,14,15,16,17,18].
The unique properties of TiN and ZrN coatings have led to their widespread use in a noteworthy number of mechanical and tribological applications, such as refractory compounds to be used at high temperatures, biomaterials, decorative materials, optical and plasmonic materials, corrosion-resistant or diffusion barrier coatings, and electrodes used in microelectronics [19,20,21,22].
Transitional metal nitrides can be obtained via various PVD techniques such as reactive magnetron sputtering [23], filtered and unfiltered cathodic arc techniques [13,24,25,26], and ion beam deposition and pulsed laser deposition [27].
Though TiN was the first largely used transition metal nitride coating, the specific properties of ZrN have made it a sustainable alternative. Both nitrides exhibit a rock salt structure (cF8; space group Fm3m) [28]. Their bonding structure comprises a combination of localized Me-to-Me and Me-to-nonmetal (N, O, or C) interactions resembling both covalent and metallic bonding [29]. The octahedral grouping of the Me atoms around a central N promotes Me-to-N bonding. Compared to stoichiometric TiN, ZrN has higher cohesive energy, thermal stability, oxidation resistance, and negative free energy of formation, as well as lower electrical resistivity, thermal conductivity, and thermal expansion coefficient [30,31]. Moreover, ZrN is resistant to the acidic environment of hydrogen peroxide, thus producing a compatible coating useful to protect components that catalyze the decomposition of hydrogen peroxide or corrode when exposed to hydrogen peroxide, unlike TiN [32,33].
Considering the corrosion resistance in different aggressive environments, it was reported that the addition of Si to ZrN provides higher stability in aggressive and corrosive environments, as observed via the electrochemical characterization of Si containing Zr nitrides obtained by either pulsed DC magnetron sputtering [34] or cathodic arc evaporation [35]. Additionally, differences in the corrosion processes of ZrN and ZrSiN coatings obtained by magnetron sputtering were evidenced. ZrN-coated steel showed a localized corrosion through pores, while a ZrSiN coating exhibited uniform corrosion at the coating–substrate interface [34]. An investigation of ZrSiN coatings prepared by a PVD–CVD hybrid process (the cathodic arc source produces Ti ions and Si was provided by bubbles of a tetramethyl-silane liquid precursor) revealed that grain size decreased as the Si content increased, which also led to a hardness increase at a maximum 3 at% Si [35]. A study of a ZrSiN coating intended for biomedical applications demonstrated that this film was superior to a Ti alloy in relation to albumin absorption and could also reasonably limit platelet adhesion, an advantageous property in the quest for the blood compatibility improvement of inorganic materials [36].
In this study, ZrSi-based coatings were selected for the following reasons. Si was chosen to be part of the coatings structure because it is known to lead to grain refinement, superior friction, and improved wear performance [37]. Moreover, the introduction of Si leads to an increased oxidizing resistance in Zr nitrides [38]. However, to improve coatings’ properties, the Si addition should be limited to about 3 at.% [35,39]. The deposition architecture is also important, as the presence of interfaces between layers with different compositions might increase coating hardness if sharp interfaces, e.g., ZrN/AlSiN, are present [40].
Lately, thin transition metal oxynitride films have been studied due to their excellent combination of chemical stability; optical, electrical, and photocatalytic properties; wear and corrosion resistance; and use as plasmonic materials for noble metal replacement. Because the properties of transition metal oxynitrides are related to their oxygen/nitrogen ratio, they can be customized by modifying this ratio [41,42]. Additionally, it was shown that lattice strain, deformation stress, and deformation energy density depend on oxygen pressure [43].
In the present study, we continued our work with biomedical applications and produced ZrSi–nitride and –oxynitride in monolayer and bilayer structures by applying the same substrate bias voltage to enable a comparison between mono and bilayer coatings. The corrosion resistance of the coatings was assessed using an artificial physiological isotonic saline solution that matches body fluids as the main component of the corrosive solution because it does not change the size of the cells [44,45]. Additionally, we chose it because in vitro corrosion studies have used it because metals are more susceptible to localized corrosion by chloride ions [46]. Since it was demonstrated that a certain level of hydrogen peroxide is involved in human metabolism [47], we used an H2O2-augmented saline solution, and the resulting low pH made the corrosion test medium even more aggressive, leading to the significant differentiation of the corrosion protection of the coatings. It is worth noting that the addition of oxygen to a corrosive solution may have a positive or negative effect. Oxidizing agents can lead to the formation of protective oxide film on the surface of some metals [48], thus increasing their corrosion resistance. In other cases, the same agents can speed up the cathodic reactions and increase the corrosion rates [49].
Previously, we reported that the reactive cathodic arc deposition of a ZrSiON coating, with a low oxygen content fabricated at a 200 V negative bias voltage, presented a high long-term protective performance when immersed in artificial saliva for 72 h [50]. In the present study, properties such as coating porosity and protection efficiency, which are of great interest in corrosion evaluation, were investigated. Moreover, roughness measurements, scanning electron micrographs, and elemental compositions after corrosive attack were used to analyze the corrosion behavior of the deposited coatings in the context of their biomedical application.
2. Materials and Methods
2.1. Coating and Specimens
ZrSi-based nitrides and oxynitrides in monolayer and double-layer structures were prepared with the cathodic arc evaporation method (CAE). SS discs (Φ = 20 mm; elemental composition (wt.%: 70.976 Fe, 0.003 C, 1.220 Mn, 0.208 Si, 17.745 Cr, 8.524 Ni, 0.020 P, 0.014 S, 0.160 Co, 0.589 Mo, and 0.539 Cu) were used as substrates, as Cu has a beneficial effect on antibacterial properties [2].
The deposition process was performed using a ZrSi cathode (85 at.% Zr and 15 at.% Si; 99.9% purity, Cathay Advanced Materials Ltd., Guangdong, China). To control the coating uniformity, the samples were placed on a rotating sample holder (15 rot./min.). Prior to deposition, the substrate specimens were cleaned by sandblasting (SiC abrasive paper; grit: 800) and polished (Ra = (50 ± 10) nm).
For contaminant removal, the specimens were sputter-etched in the deposition chamber with Ar ions for 5 min. The residual and working pressure values were 2 × 10⁻³ and 8 × 10⁻² Pa, respectively. The nitrogen mass flow rate was 60 sccm, and that of oxygen was 17 sccm.
It is well-known that specific deposition parameters should be chosen for each deposition technique and geometry [51,52,53]. Considering our previous work on Zr silico-oxynitrides [50], the substrate bias was fixed at −200 V and the temperature was 200 °C. The arc current on the ZrSi cathode was maintained at 100 A for ZrSiN deposition and lowered to 90 A for ZrSi(N,O) deposition. The bilayer coatings were created by switching off the substrate bias and the power on the cathode while the deposition chamber was pumped off, followed by opening the gas vents until the required gas or gas mixture reached the deposition pressure value, and then the deposition process was resumed. All coatings had a total thickness of about 1.2 µm.
Each type of coating was deposited in the same run on five SS discs in order to obtain the necessary number of replicates for characterization.
2.2. Coatings Characterization
The surface roughness and thickness of the deposited specimens were investigated using a Dektak 150 surface profilometer (Bruker, Billerica, MA, USA) with a stylus diameter of 2.5 µm.
The roughness measurements were carried out on two replicates in 5 randomly chosen different areas, and the results were averaged. Each coating’s roughness, before and after the corrosion tests, was determined over a length of 10 mm for 200 s. Ra (arithmetic average), Rq (root-mean square), and Sk (symmetry of the profile about the mean line) roughness parameters were used to evaluate the surface roughness and their influence on corrosion resistance.
A scanning electron microscope (SEM) (Hitachi TM3030 Plus, Tokyo, Japan) coupled to an energy dispersive X-ray spectrometer (EDS) (Bruker, Billerica, MA, USA) was used for the surface morphology and elemental composition investigation. The EDS measurements were done in five different areas of two replicates for each type of coating, with the results representing the arithmetic mean; the standard deviation (SD) was also calculated. To obtain images of surface morphology and elemental composition, mixed images of backscattering and secondary electrons of the surface morphology were acquired for each specimen before and after corrosion tests.
The microdroplets’ size distribution analysis was performed by using Trainable Weka Segmentation learning algorithms implemented in the Fiji software platform (version 1.52p) [54]. The binary pixel segmentation of the SEM images was classified into two major classes as either background or microdroplets, and the process was followed by some iterative step-by-step trainable processes and a thresholding approach.
The phase composition of the samples was investigated by X-ray diffraction (XRD) using a SmartLab diffractometer (Rigaku, Tokyo, Japan) with CuKα radiation (λ = 0.15405 nm). The XRD patterns were obtained in a 2θ range from 20° to 80° at a step size of 0.02°. The grain sizes were calculated from the XRD patterns using Scherrer’s formula. The measurements were carried out on two replicates of each coating for process reproducibility confirmation.
The corrosion resistance of the investigated specimens was measured by Tafel extrapolation using two specimens of each type of coating. The electrochemical cell contained three electrodes. The coated specimens were used as the working electrode (WE), and as reference electrode (RE) it was used a KCl-saturated Ag/AgCl electrode (SCE)). The counter electrode (CE) was a platinum sheet. The electrochemical cell was coupled to VersaStat 3 potentiostat/galvanostat (Princeton Applied Research, Oak Ridge, TN, USA), and the data recording was performed by VersaStudio software (version 2.60.6).
All the electrochemical tests were performed in an acidic physiological saline solution. A solution concentration of 0.9% NaCl was chosen because its sodium concentration was a bit higher than the normal concentration in synovial fluids [55,56,57], and we needed an accelerated corrosion test. Considering that bacteria and microbial species, as well as inflammatory cell secretions, generate an acidic environment [58] such that the pH value can fall to 4 or 3 as a result of surgery or injury irritation [59], the saline solution was augmented by 6% H2O2 in order to obtain a more acidic environment (pH = 4). It is worth noting that an acidic environment is known to accelerate the degradation of Ti and its alloys’ surfaces [60].
Potentiodynamic polarization was used for the assessment of corrosion resistance. All corrosion tests were carried out at normal body temperature (37 ± 1) °C. Before measurements, the open-circuit potential (OCP) was measured for 15 h for a potential-stabilizing immersion period of the working electrode in the corrosive solution. Tafel plots were recorded from −250 to +250 mV vs. EOC, with a scanning rate of 0.167 mV/s for each measurement. For data extrapolation, the logarithmic values of current density were plotted as a function of WE potential (E(V) vs. SCE).
3. Characterization of the Coatings
3.1. Surface Morphology and Elemental Composition of Coated Samples
Figure 1a–d presents the SEM micrographs of the coated specimens. Cathodic arc deposition is a PVD technique in which the arc discharge current forms cathode spots where the current density is very high (more than 1 kA/cm2), which fits the conditions required for a localized phase transformation from a solid cathode material to fully ionized plasma. In these conditions, apart from ions, atoms, and electrons, microdroplets are also generated [51].
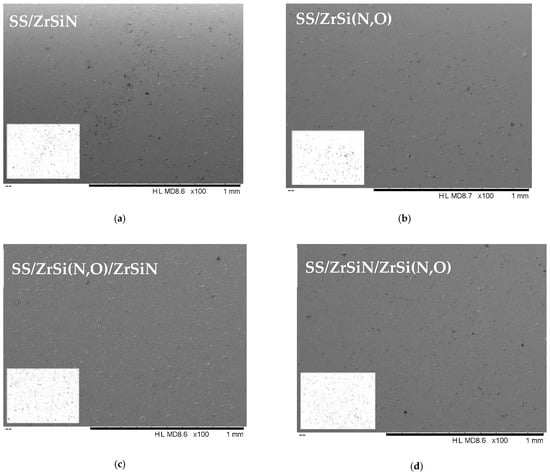
Figure 1.
SEM micrographs (HL MD8.6 ×100, 1 mm) and the corresponding binary images (produced by ImageJ® software) of the investigated coatings: SS/ZrSiN (a), SS/ZrSi(N,O) (b), SS/ZrSi(N,O)/ZrSiN (c), and SS/ZrSiN/ZrSi(N,O) (d).
Microdroplets characteristic of cathodic arc deposition could be identified on the coating surfaces, with their size spanning from about 1 to 10 μm. Macroparticles can act as defects in non-filtered CAE processes and can have impacts on corrosion evaluation applications [61]. It has been stated that macroparticle formation depends on deposition parameters, and their number and size can be decreased by increasing the substrate bias [62]. Thus, a high substrate bias voltage (Us = −200 V) was used in the present study. It was shown that at even higher substrate bias values, there was a tendency for the selective re-sputtering process of light elements by heavy zirconium ions [62].
The size distribution of the microdroplets obtained by using ImageJ software were derived from the corresponding binary images (background–microdroplets) presented as insets in Figure 1a–d, from which the related histograms were derived (Figure 2).
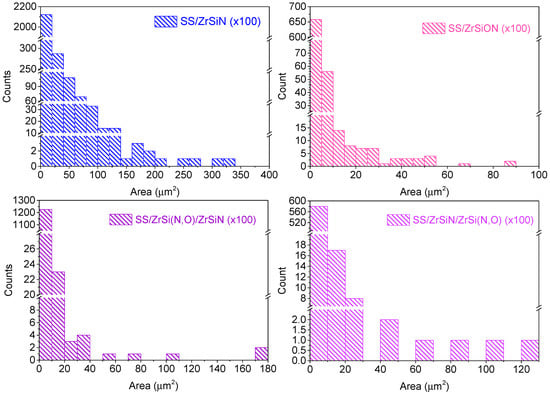
Figure 2.
The size distribution of the microdroplets on the surface of each deposited coating, derived from the binary images using the ImageJ software.
The largest number and size of microdroplets was observed on SS/ZrSiN coatings, while the lowest size of microdroplets was observed on SS/ZrSi(N,O) coatings. The decrease of the number and size of microdroplets on SS/ZrSi(N,O)/ZrSiN coatings compared to SS/ZrSiN was due to the presence of the ZrSi(N,O) bottom layer and the reduced thickness of the ZrSiN top layer in the bilayer. It should be noted that the lowest number of droplets was observed on the SS/ZrSiN/ZrSi(N,O) bilayer. Compared to the SS/ZrSi(N,O) monolayer, the fewer larger droplets observed on the SS/ZrSiN/ZrSi(N,O) bilayer were due to the presence of the bottom ZrSiN layer.
Figure 3 presents the elemental composition of the coatings obtained by EDS analysis. All coatings were stoichiometric, which resulted from the ratios of the metal and nonmetal element concentrations while considering the associated errors. The differences between oxygen and nitrogen concentrations in the bilayers were due to the different absorptions of the specific radiation in the coatings.
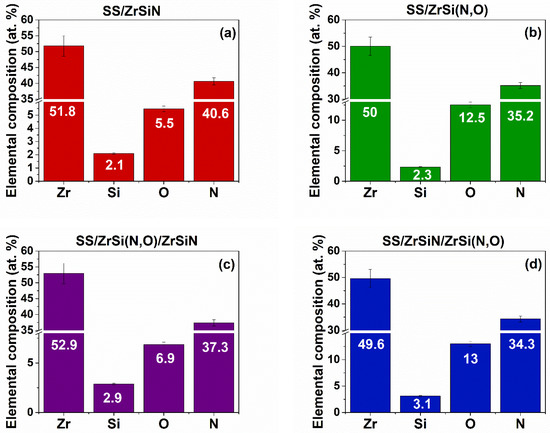
Figure 3.
Elemental composition of the coated specimens: SS/ZrSiN (a), SS/ZrSi(N,O) (b), SS/ZrSi(N,O)/ZrSiN (c), and SS/ZrSiN/ZrSi(N,O) (d).
3.2. Phase Composition and Grain Size
Figure 4 shows the diffractograms of the mono and bilayer ZrSi-based coatings and the uncoated substrate. The ZrSiN coating preserved the cubic cF8 structure ( space group) of ZrN (ICDD file #04-004-2860).
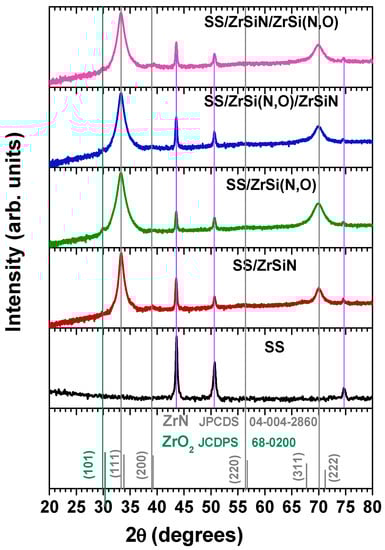
Figure 4.
X-ray diffraction patterns of the investigated specimens.
Due to the higher energy of the plasma particles produced by the arc discharge compared to the ones produced by magnetron sputtering, in transition metal nitride coatings (ZrSiN, in which the Si amount exceeds 2 at.%, included), a SiNx amorphous phase is formed [63] in addition to the obvious formation of cubic ZrN [64].
We observed the shift of the peaks towards lower angles compared to standard ZrN, indicating the increase of the lattice parameter due to Si addition (Table 1). Due to the relatively low deposition temperature and intense ion bombardment, specific to the vacuum arc deposition, the coatings grew in conditions far from the thermodynamic equilibrium, which induced kinetic limitations and resulted in the formation of metastable phases [65,66], of which TiSiN and TiAlN systems are the best documented in the literature [64,67]. The observed increase of the lattice parameter indicates that Si addition promoted the formation of an interstitial solid solution, the “guest” atoms being incorporated in the lattice interstitial sites, as also reported for other Si-doped transition metals nitrides [63,68].

Table 1.
The standard position of the (111) ZrN maximum (ICDD file #04-004-2860) and the equivalent positions of the peaks measured for ZrSiN and ZrSi(N,O) monolayers, their grain sized, and the calculated lattice parameters.
The incorporation of oxygen into the ZrSiN structure was clearly evidenced by a further shift of the ZrSiN peaks towards even smaller diffraction angles due to the lattice expansion needed to accommodate the presence of oxygen in the interstitial sites. Despite the quite low oxygen content in the Zr(N,O) coating, its diffractogram exhibited (in addition to the presence of the cubic structure of ZrSiN previously reported in the literature [69,70]) a low intensity peak ascribed to the (101) maximum of the tetragonal ZrO2 phase (space group P42/nmc), according to ICDD file #68-0200. The same observation was previously reported for ZrON coatings prepared by cathodic arc evaporation [43]. The small peak is also visible on the SS/ZrSiN/ZrSi(N,O) diffractogram, as the top layer was an oxynitride. We attributed the formation of the ZrO2 phase to the different values of the Gibbs free energy of ZrN and ZrO2 (ΔGfZrN = −364.3 kJ/mol; ΔGfZrO2 = −1091.6 kJ/mol), as ZrO2 synthesis is energetically more favorable [71].
The grain size (d) of the ZrSiN coating decreased with oxygen addition of about 30%, indicating a certain refinement, as previously reported for a Zr(N,O) single layer obtained with the same deposition method [43]. The bilayers presented intermediate values (SS/ZrSiN/ZrSi(N,O) (d) = 12.4 nm and SS/ZrSi(N,O)/ZrSiN (d) = 13.2 nm), but the calculated grain size of the bilayers represented the averaged value of each component layer, and the small difference between their calculated values, of about 6%, was ascribed to the X-ray absorption in the upper layer. The bilayer with the ZrSi(N,O) top layer presented a smaller grain size than the bilayer with ZrSiN as a top layer, concurrent with the grain size values of the two monolayers.
The diffractograms show that the films preferred orientation was (111). As is known, the preferred orientation of cubic films is determined by the competition of surface energy and strain energy [72]. The evidenced preferred (111) orientation, with the lowest strain energy, is specific to coatings with cubic structure deposited by cathodic arc evaporation method due to the presence of highly ionized plasma [72,73].
Considering the cubic-dominating structure of all deposited coatings, Table 1 presents the standard position of the (111) ZrN maximum (ICDD file #04-004-2860), along with the equivalent positions of the corresponding peaks measured in ZrSiN and ZrSi(N,O) monolayers, the grain size calculated from (111) maximum using the Debye–Scherrer formula, and the calculated lattice parameters. The bilayers were not considered due to the same reasons presented above for the grain size values.
3.3. Corrosion Tests in H2O2-Augmented Saline Solution
It is known that corrosive media can notably alter the integrity of materials used in many applications. Corrosion resistance represents a property of the material and its environment, and the observed major impact of corrosion attacks on metals and oxides [74], resulting in material degradation, has led to the search for the best material to suit certain environments. One method for improving the corrosion resistance of metals is to use appropriate coatings that may act as efficient corrosion barriers. There are a series of factors influencing the corrosion resistance of coatings obtained by CAE methods, such as chemical characteristics, morphology, and porosity, which depend on deposition parameters [75].
The oxide layers formed on different materials in contact with body fluids (e.g., saline solution) provide corrosion resistance. This tendency to change surface chemistry by creating a more stable oxidized state, also known as materials’ nobility, can be analyzed by measuring the open circuit potential (EOC) variation in time until attaining a stable value. The open circuit potential evolution values recorded for 900 min of immersion in 0.1 M NaCl and 6% H2O2 are presented in Figure 5a and Table 2 for the uncoated and coated substrates. The values define the electrochemical state of the material–corrosive liquid interface at the end of sample immersion in the absence of any polarization.
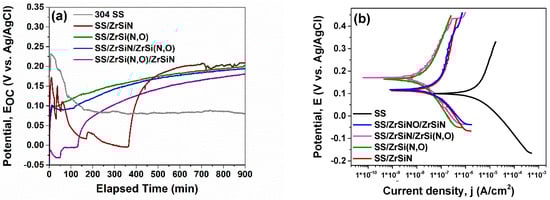
Figure 5.
Open circuit potential evolution in time (a) and Tafel plots of the investigated specimens (b).
Table 2.
Corrosion parameters of the coatings: open circuit potential (EOC), polarization resistance (Rp), corrosion potential (Ecorr), corrosion current density (icorr), porosity (P), and protective efficiency (Pe).
For the SS substrate, a slight decrease of EOC was observed at the beginning of the test, its evolution becoming stable after ~240 min and reaching a value of 80 mV, which was the lowest value of all tested samples. The observed decrease may be associated with instability of the passive layer formed after immersion in the corrosive solution, indicating poor corrosion resistance [50]. The coated specimens exhibited an increasing tendency towards stable values, except for SS/ZrSi(N,O)/ZrSiN, whose recorded curve was more unstable in the first 500 min; this instability was attenuated by the end of the test, but not entirely, and its average value exceeded the corresponding EOC values of the rest of the coatings (see Table 2). Except for the unstable SS/ZrSi(N,O)/ZrSiN bilayer, the most stable passive layers were formed when ZrSi(N,O) films were in direct contact with the electrolyte: on SS/ZrSiN/ZrSi(N,O) and SS/ZrSi(N,O). This feature may be ascribed to their pre-oxidized surface.
The polarization resistance (Rp) id the resistance of a sample to oxidation during the application of an external potential, and it is defined as the slope of the linear region of the ΔE − Δi curve at corrosion potential (Ecorr) under ±10 mV applied potential. It provides an indication of a coating’s surface stability near the potential in open circuit (EOC). Using the cathodic and anodic slopes and the Stern–Geary equation [76], polarization resistance could be calculated:
Compared to the SS substrate, all coated specimens exhibited higher Rp values. The best performance was observed for the SS/ZrSiN/ZrSi(N,O) coating (Rp = 941.083 kΩ), which was even higher than that of SS/ZrSi(N,O) (801.225 kΩ). This can be explained by the blocking effect of the double-layer, which slowed down the electrolyte ingress through the pores, since the ZrSiN/ZrSi(N,O) interface represented an effective corrosion barrier that offered superior corrosion protection. It is known that in a multilayer geometry, the interfaces act as corrosion barriers that also increase adhesion and tribological properties [77,78,79]. As such, the ordering of samples corrosion resistance related to the Rp parameter was: SS/ZrSiN/ZrSi(N,O) > SS/ZrSi(N,O) > SS/ZrSi(N,O)/ZrSiN > SS/ZrSiN > SS.
The corrosion potential (Ecorr) is the zero current electrochemical state of the Tafel scanning interface. The corrosion current density (icorr) indicates the corrosion intensity at Tafel’s scanning corrosion potential (icorr = ianode − icathode). In our study, the corrosion potential and the corrosion current density were estimated from the measured Tafel plots (Figure 5b) and are presented in Table 2.
As expected, the substrate presented the smallest electropositive value for Ecorr (99 mV) and the highest icorr value (3.724 µA/cm2) compared to the coated specimens. The same “high Ecorr − low icorr” correlation was observed for all coatings in the following order: SS/ZrSiN/ZrSi(N,O) > SS/ZrSi(N,O) > SS/ZrSi(N,O)/ZrSiN > SS/ZrSiN > SS. As such, there was a significant difference between the icorr measured for the bare and coated substrates, with the best corrosion resistance (icorr = 0.26 µA/cm2) being exhibited by SS/ZrSiN/ZrSi(N,O) coating.
The coatings’ porosity (P) was calculated using the Elsener’s empirical equation [80]:
This parameter represents the ratio of the area of all pores to the total exposed surface [80], and a low value indicates the existence of fewer pores or defects acting as potential locations for electrolyte ingress, which has a significant influence on long-term corrosion resistance [50].
The outer passive layer of the coatings acts as a barrier against ion transfer, which moderates the electrochemical reactions. The lowest P value (0.004) was exhibited by the SS/ZrSiN/ZrSi(N,O) bilayer, closely followed by the monolayer oxynitride SS/ZrSi(N,O) (p = 0.005)—values significantly lower than the coatings with ZrSiN layer facing the corrosive solution. The obtained values of porosity P were well-correlated to the values of resistance polarization Rp, such as the highest Rp value corresponds to the lowest P value.
The coatings’ protective efficiency (Pe) was determined considering the ion corrosion density values of the substrate (icorr_substrate) and coating (icorr_coating) [81]:
The highest value of the protection efficiency parameter (Pe = 99.3%) was also observed for the SS/ZrSiN/ZrSi(N,O) coatings, closely followed by the SS/ZrSi(N,O) monolayer (Pe = 99.2%), thus proving that the mixture of oxide and nitride phases observed in the oxynitride acted as protective layer that further enhanced the blocking effect of the interface and, therefore, the corrosion resistance barrier properties [65].
Because we used the same experimental conditions for corrosion tests for all investigated samples, a compressive assessment of the corrosion behavior, considering the EOC, Rp, Ecorr, icorr, P, and Pe parameters, could be obtained using the Kendall rank correlation [82]. Even if no Kendall coefficients were considered, one could observe that the uncoated substrate presented the lowest corrosion resistance. Considering the primary corrosion parameters that have major influence on the corrosion behavior of materials (Rp, Ecorr, and icorr), Table 3 indicate the rank of the coatings: SS/ZrSiN/ZrSi(N,O) > SS/ZrSi(N,O) > SS/ZrSi(N,O)/ZrSiN > SS/ZrSiN. This statement excludes the P and Pe parameters, as they were derived from the primary parameters (Equations (2) and (3)).
Table 3.
Ranks attributed to the coated samples according to 4 corrosion parameters.
Table 3 presents the results for each coating labeled in the following way: for each corrosion parameter, the best results are ordered from 1 to 4, with rank 1 representing the best behavior and rank 4 representing the worst behavior. In the last column of Table 3, the sum of the ranks (Σranks) for each sample are presented; the highest corrosion performance corresponds to the lowest Σranks value.
3.4. Surface Morphology and Elemental Composition after Corrosion Tests
Figure 6 presents the SEM micrographs and corresponding elemental distributions. Several corrosion products, distributed on the entire surface, were observed on the SS surface (Figure 6a). According to the elemental composition of the samples after the corrosive attack, presented in Figure 6, an important amount of oxygen was identified. Presumably, Fe, Cr, and Ni oxides were formed on the surface as a result of electrolyte immersion, concurrent with the high roughness resulting from the corrosion process.
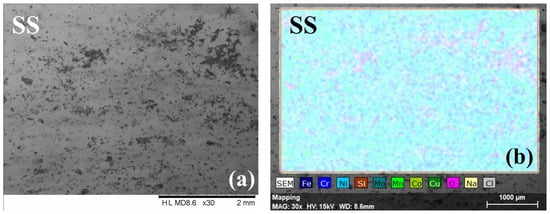
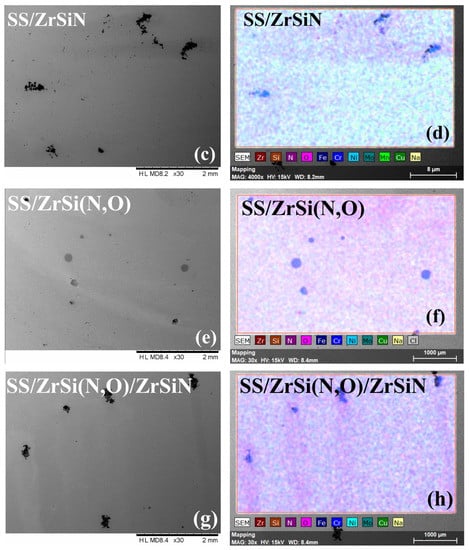
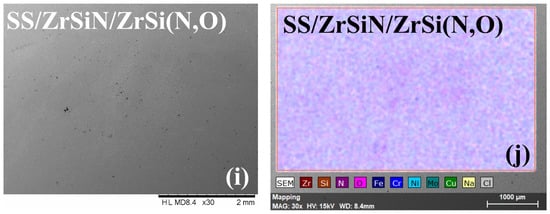
Figure 6.
SEM micrographs and element distribution of all investigated specimens after the corrosion test. SEM images: SS (a), SS/ZrSiN (c), SS/ZrSi(N,O) (e), SS/ZrSi(N,O)/ZrSiN (g), and SS/ZrSiN/ZrSi(N,O) (i). EDS images: SS (b), SS/ZrSiN (d), SS/ZrSi(N,O) (f), SS/ZrSi(N,O)/ZrSiN (h), and SS/ZrSiN/ZrSi(N,O) (j).
On the other hand, the corroded coatings exhibited relatively low amounts of Fe originating from the substrate (0.6–1.2 at.%) (Figure 7), indicating the substrate’s limited exposure to electrolyte and, therefore, the superior corrosion resistance of the coatings. The SEM micrographs indicate that only the SS/ZrSiN and SS/ZrSi(N,O)/ZrSiN coatings had corrosion products on the surface, with their substrate also affected, as indicated by the elemental distribution mapping (Figure 6f,j). Even though most of their surfaces were undamaged, these coatings were not considered to be effective corrosion barriers. These coatings had higher porosity than the other coatings, and this behavior was ascribed to their high porosity (PSS/ZrSiN = 0.015 and PSS/ZrSi(N,O)/ZrSiN = 0.012), which permitted the migration of electrolytes through the pores and thus created areas of intensive corrosion. The microdroplets formed in the initial stage of the deposition may have been responsible for this type of corrosion mechanism. More shallow pits were observed on the surface of SS/ZiSi(N,O), indicating that this coating was also affected by the corrosion process; however, the corrosion measurements showed a relatively high protective efficiency (Pe = 99.2%). Only SS/ZrSiN/ZrSi(N,O) exhibited a defect-free surface, concurrent with its superior corrosion parameters (Table 2). The results were in good agreement with data on the size distribution of microdroplets on the coatings surfaces, indicating that their presence, number, and dimension had significant influence on the corrosion behavior of the investigated coatings.
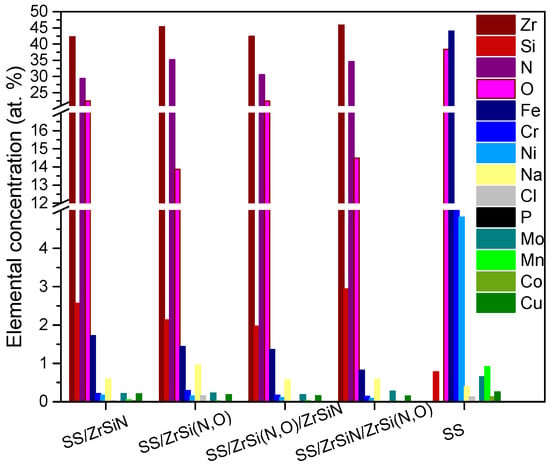
Figure 7.
The elemental composition of the investigated specimens after the corrosion tests.
3.5. Coating Roughness
Figure 8 presents the values of the roughness parameters (Ra—arithmetic average deviation from the mean line; Rq—root mean square average of the profile heights over the evaluation length; and Sk—skewness) measured before and after the corrosion resistance tests. The coated surfaces presented similar values (higher than the one of the bare substrate) before the corrosion measurements. This peculiarity could be explained by the microdroplets that were visible on the surface (Figure 1).
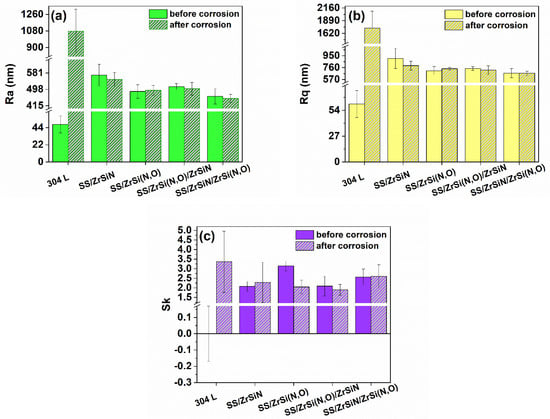
Figure 8.
Roughness parameters of the investigated specimens before and after corrosion measurements: Ra (a), Rq (b), and Sk (c).
Even if the bare, uncorroded substrates presented smooth surfaces (Ra: ~48 nm; Rq: ~60 nm), the corrosive attack produced very rough surfaces with significantly higher values of Ra and Rq by factors of around 22 and 29, respectively. On the contrary, after the corrosion tests, the roughening of the coatings was less severe. After the corrosion measurements, all coatings presented similar values of Ra and Rq, indicating that their surfaces were almost undamaged after the corrosive attack in comparison to the bare substrate.
Considering the skewness value, it is known that a positive value of a surface subjected to a corrosive attack confers better corrosion resistance [83]. When comparing the Sk values of the samples before the corrosion test, one could see that the bare substrate with a null averaged value of Sk before the corrosion test was most prone to corrosive attack, and the samples with the oxynitride top layers presented the best corrosion resistance. After the corrosive attack, all samples presented positive Sk values. Due to the significant remains of corrosion and oxidation products on the SS surface (Figure 7), the measured profile presented the highest positive Sk value (3.36 ± 1.6); this indicated the formation of an oxide layer on its surface as a result of surface passivation, thus increasing its corrosion resistance.
Except for the uncoated substrate, all measured changes in the roughness parameters after the corrosion test were minimal and statistically non-significant, meaning that only few and shallow pits were created by the corrosive attack on the coated surfaces [84].
Considering the values and the associated errors, except for the ZrSiN monolayer, all the other coatings exhibited low values of Ra and Rq and high values of Sk before and after the corrosion test.
4. Conclusions
ZrSi-based nitrides and oxynitrides as monolayer and bilayer structures were prepared via reactive cathodic arc evaporation. The ZrSiN monolayer presented a structure consisting of a mixture of a cubic structure specific to ZrN and amorphous SiNx phases. The structure of the ZrSi(N,O) coating indicated the coexistence of cubic and tetragonal structures specific to ZrSiN and ZrO2, respectively. The grain size and lattice parameter values calculated for the monolayers indicated that Si and O addition promoted the formation of an interstitial solid solution in which the new atoms were incorporated into the lattice interstitial sites.
Even if the roughness values of the as-deposited coatings were higher than that of the bare substrate, after the corrosive attack in an H2O2-augmented saline solution, the SS substrate was the most depreciated and the coatings mostly retained their initial roughness values. The skewness roughness parameter showed positive values after corrosion for all the investigated systems, indicating the presence of many shallow pits on the corroded substrate; however, the coatings exhibited less affected surfaces, as observed in the SEM micrographs. Corrosion products accumulated on the substrate surface, leading to a significant difference of roughness values before and after the corrosion attack.
The corrosion resistance ordering of the coatings using the Kendall rank correlation indicated the following ranking: SS/ZrSiN/ZrSi(N,O) > SS/ZrSi(N,O) > SS/ZrSi(N,O)/ZrSiN > SS/ZrSiN > SS. The coatings’ superior corrosion resistance against the corrosive solution with an oxynitride layer was ascribed to the presence of the mixture of nitride and oxides in the oxynitrides. The SS/ZrSiN/ZrSi(N,O) bilayer exhibited the highest resistance polarization Rp, the smallest ion current density icorr, the lowest porosity P, and the highest protection efficiency Pe, closely followed by the single oxynitride layer. The superior corrosion resistance of SS/ZrSiN/ZrSi(N,O) was ascribed to its defect-free surface and the blocking effect of the interfaces acting as a corrosion barrier to the electrolyte ingress. All coated specimens improved the corrosion resistance of the SS substrate, and the SS/ZrSiN/ZrSi(N,O) coating obtained via the reactive cathodic arc evaporation method represents an efficient solution for the protection of metallic parts intended to be used as biomaterials.
Author Contributions
Conceptualization, V.B.; coating deposition, M.D. and A.E.K.; characterization, M.D., A.C.P. and A.V.; data analysis, A.V., V.B., E.S.M.M. and L.F.P.; resources, V.B.; original draft, M.D.; ImageJ microdroplet analysis, I.P.; writing—review and editing, V.B. and L.F.P. All authors reviewed and approved the work. All authors have read and agreed to the published version of the manuscript.
Funding
This work was supported by a grant of the Romanian National Authority for Scientific Research and Innovation CCCDI-UEFISCDI, project COFUND-ERANET EURONANOMED 3-NANO-VERTEBRA, within PNCDI III (no. 91/2019), and by the Core Program 18N/2019.
Institutional Review Board Statement
Not applicable.
Informed Consent Statement
Not applicable.
Data Availability Statement
Not applicable.
Acknowledgments
A.V. thanks Tomsk Polytechnic University within the framework of the Tomsk Polytechnic University-Competitiveness Enhancement Program grant.
Conflicts of Interest
The authors declare no conflict of interest. The founding sponsors had no role in the design of the research; in the collection, analyses, or interpretation of data; in the writing of the manuscript; or in the decision to publish the results.
References
- Blackwood, D.J.; Pereira, B.P. No corrosion of 304 stainless steel implant after 40 years of service. J. Mater. Sci. Mater. Med. 2004, 15, 755–758. [Google Scholar] [CrossRef]
- Chen, K.K.; Chao, C.Y.; Chen, J.H.; Wu, J.H.; Chang, Y.H.; Du, J.K. Effect of low copper addition to as-forged 304 stainless steel for dental applications. Metals 2021, 11, 43. [Google Scholar] [CrossRef]
- Verstrynge, A.; Van Humbeeck, J.; Willems, G. In-vitro evaluation of the material characteristics of stainless steel and beta-titanium orthodontic wires. Am. J. Orthod. Dentofac. Orthop. 2006, 130, 460–470. [Google Scholar] [CrossRef]
- Oh, K.T.; Choo, S.U.; Kim, K.M.; Kim, K.N. A stainless steel bracket for orthodontic application. Eur. J. Orthod. 2005, 27, 237–244. [Google Scholar] [CrossRef]
- Disegi, J.A.; Eschbach, L. Stainless steel in bone surgery. Injury 2000, 31, D2–D6. [Google Scholar] [CrossRef]
- Zitter, H.; Plenk, H. The electrochemical behavior of metallic implant materials as an indicator of their biocompatibility. J. Biomed. Mater. Res. 1987, 21, 881–896. [Google Scholar] [CrossRef]
- Nishimura, R.; Maeda, Y. Stress corrosion cracking of sensitized type 316 austenitic stainless steel in hydrochloric acid solution-effect of sensitizing time. Corros. Sci. 2003, 45, 1847–1862. [Google Scholar] [CrossRef]
- Tang, Y.C.; Katsuma, S.; Fujimoto, S.; Hiromoto, S. Electrochemical study of type 304 and 316L stainless steels in simulated body fluids and cell cultures. Acta Biomater. 2006, 2, 709–715. [Google Scholar] [CrossRef]
- Klein, C.L.; Nieder, P.; Wagner, M.; Köhler, H.; Bittinger, F.; Kirkpatrick, C.J.; Lewis, J.C. The role of metal corrosion in inflammatory processes: Induction of adhesion molecules by heavy metal ions. J. Mater. Sci. Mater. Med. 1994, 5, 798–807. [Google Scholar] [CrossRef]
- Barbosa, M.A. Corrosion of metallic implants. In Handbook of Biomaterial Properties; Black, J., Hastings, G., Eds.; Chapman & Hall: London, UK, 1998; pp. 420–463. ISBN 978-1-4615-5801-9. [Google Scholar]
- Anderson, J.M. Soft tissue response. In Handbook of Biomaterial Properties; Black, J., Hastings, G., Eds.; Chapman and Hall: London, UK, 1998; pp. 490–499. ISBN 978-1-4615-5801-9. [Google Scholar]
- Ren, Y.; Yang, K.; Zhang, B. In vitro study of platelet adhesion on medical nickel-free stainless steel surface. Mater. Lett. 2005, 59, 1785–1789. [Google Scholar] [CrossRef]
- Niu, E.W.; Li, L.; Lv, G.H.; Chen, H.; Feng, W.R.; Fan, S.H.; Yang, S.Z.; Yang, X.Z. Influence of substrate bias on the structure and properties of ZrN films deposited by cathodic vacuum arc. Mater. Sci. Eng. A 2007, 460–461, 135–139. [Google Scholar] [CrossRef]
- Lalisse, A.; Tessier, G.; Plain, J.; Baffou, G. Plasmonic efficiencies of nanoparticles made of metal nitrides (TiN, ZrN) compared with gold. Sci. Rep. 2016, 6, 38647. [Google Scholar] [CrossRef]
- Liang, J.W.; Li, K.H.; Kang, C.H.; Braic, L.; Kiss, A.E.; Zoita, N.C.; Ng, T.K.; Ooi, B.S. Characterization of epitaxial titanium nitride mediated single-crystal nickel oxide grown on MgO-(100) and Si-(100). AIP Adv. 2020, 10, 065318. [Google Scholar] [CrossRef]
- Diroll, B.T.; Saha, S.; Shalaev, V.M.; Boltasseva, A.; Schaller, R.D. Broadband ultrafast dynamics of refractory metals: TiN and ZrN. Adv. Opt. Mater. 2020, 8, 2000652. [Google Scholar] [CrossRef]
- Li, K.-H.; Alfaraj, N.; Kang, C.H.; Braic, L.; Zoita, N.C.; Kiss, A.E.; Ng, T.K.; Ooi, B. Deep-ultraviolet beta-Ga2O3 photodetectors grown on MgO substrates with a TiN template. In 2019 IEEE Photonics Conference (IPC); IEEE: San Antonio, TX, USA, 2019. [Google Scholar]
- Briggs, J.A.; Naik, G.V.; Zhao, Y.; Petach, T.A.; Sahasrabuddhe, K.; Goldhaber-Gordon, D.; Melosh, N.A.; Dionne, J.A. Temperature-dependent optical properties of titanium nitride. Appl. Phys. Lett. 2017, 110, 101901. [Google Scholar] [CrossRef]
- Deng, J.; Liu, J.; Ding, Z.; Niu, M. Unlubricated friction and wear behaviors of ZrN coatings against hardened steel. Mater. Des. 2008, 29, 1828–1834. [Google Scholar] [CrossRef]
- Alfaraj, N.; Li, K.; Alawein, M.; Kang, C.H.; Braic, L.; Zoita, N.C.; Kiss, A.E.; Ng, T.K.; Ooi, B.S. Heteroepitaxial β-Ga2O3 on Conductive Ceramic Templates: Toward Ultrahigh Gain Deep-Ultraviolet Photodetection. Adv. Mater. Technol. 2021, 6, 210014. [Google Scholar] [CrossRef]
- Birtoiu, I.A.; Rizea, C.; Togoe, D.; Munteanu, R.M.; Micsa, C.; Rusu, M.I.; Tautan, M.; Braic, L.; Scoicaru, L.O.; Parau, A.; et al. Diagnosing clean margins through Raman spectroscopy in human and animal mammary tumour surgery: A short review. Interface Focus 2016, 6, 20160067. [Google Scholar] [CrossRef]
- Zhang, S.; Zhu, W. TiN coating of tool steels: A review. J. Mater. Process. Technol. 1993, 39, 165–177. [Google Scholar] [CrossRef]
- Tominaga, K.; Adachi, H.; Wasa, K. Functional thin films. In Handbook of Sputter Deposition Technology; Wasa, K., Ed.; William Andrew, Elsevier Inc.: Amsterdam, The Netherlands, 2012; pp. 361–520. ISBN ISBN 978-1-4377-3483-6. [Google Scholar]
- Arias, D.F.; Arango, Y.C.; Devia, A. Study of TiN and ZrN thin films grown by cathodic arc technique. Appl. Surf. Sci. 2006, 253, 1683–1690. [Google Scholar] [CrossRef]
- Arias, D.; Devia, A.; Velez, J. Study of TiN/ZrN/TiN/ZrN multilayers coatings grown by cathodic arc technique. Surf. Coat. Technol. 2010, 204, 2999–3003. [Google Scholar] [CrossRef]
- Zhang, J.J.; Wang, M.X.; Yang, J.; Liu, Q.X.; Li, D.J. Enhancing mechanical and tribological performance of multilayered CrN/ZrN coatings. Surf. Coat. Technol. 2007, 201, 5186–5189. [Google Scholar] [CrossRef]
- Ul-Hamid, A. The effect of deposition conditions on the properties of Zr-carbide, Zr-nitride and Zr-carbonitride coatings—A review. Mater. Adv. 2020, 1, 988–1011. [Google Scholar] [CrossRef]
- Sirajuddeen, M.M.S.; Banu, I.B.S. FP-LAPW investigation of electronic, magnetic, elastic and thermal properties of Fe-doped zirconium nitride. AIP Adv. 2014, 4, 057121. [Google Scholar] [CrossRef]
- Vogelzang, E.; Sjollema, J.; Boer, H.J.; De Hosson, J.T.M. Optical Absorption in TiNxOy Compounds. J. Appl. Phys. 1987, 61, 4606–4611. [Google Scholar] [CrossRef][Green Version]
- Haglund, J.; Grimvall, G.; Jarlborg, T.; Fernandez Guillermet, A. Band structure and cohesive properties of 3d-transition-metal carbides and nitrides with the NaCl-type structure. Phys. Rev. B 1991, 43, 65–118. [Google Scholar] [CrossRef]
- Fernandez Guillermet, A.; Haglund, J.; Grimvall, G. Cohesive properties of 4d-transition-metal carbides and nitrides in the NaCl-type structure. Phys. Rev. B 1992, 45, 11557–11567. [Google Scholar] [CrossRef]
- Yousefiani, A. Coating for Components Requiring Hydrogen Peroxde Compatibility. U.S. Patent 7,824,783 B2, 15 June 2010. [Google Scholar]
- Tanokura, Y. Japan Patent Removing Solution for Titanium Nitride Coating Film. JPH07278848A, 24 October 1995. [Google Scholar]
- Perreira Ferreira, C.; Reis de Castro, M.d.M.; Tentardini, E.; Lins, V.F.C.; Alves Saliba, P. Silicon influence on corrosion resistance of magnetron sputtered ZrN and ZrSiN thin films. Surf. Eng. 2018, 36, 1–8. [Google Scholar] [CrossRef]
- Winkelmann, A.; Cairney, J.M.; Hoffman, M.J.; Martin, P.J.; Bendavid, A. Zr–Si–N films fabricated using hybrid cathodic arc evaporation and chemical vapour deposition: Structure vs. properties. Surf. Coat. Technol. 2006, 200, 2554–2557. [Google Scholar] [CrossRef]
- Cui, X.; Jin, G.; Hao, J.; Li, J.; Guo, T. The influences of Si content on biocompatibility and corrosion resistance of Zr-Si-N films. Surf. Coat. Technol. 2013, 228, S524–S528. [Google Scholar] [CrossRef]
- Vepřek, S. The search for novel, superhard materials. J. Vac. Sci. Technol. A Vac. Surf. Film. 1999, 17, 2401–2420. [Google Scholar] [CrossRef]
- Chen, Y.I.; Chang, S.C.; Chang, L.C. Oxidation resistance and mechanical properties of Zr–Si–N coatings with cyclic gradient concentration. Surf. Coat. Technol. 2017, 320, 168–173. [Google Scholar] [CrossRef]
- Vanegas, H.S.; Alfonso, J.E.; Olaya, J.J. Effect of Si content on functional behavior of nanostructured coatings of Zr-Si-N. Mater. Res. Express 2019, 6, 115076. [Google Scholar] [CrossRef]
- Kim, S.K.; Van Le, V. Cathodic arc plasma deposition of nano-multilayered ZrN/AlSiN thin films. Surf. Coat. Technol. 2011, 206, 1507–1510. [Google Scholar] [CrossRef]
- Subramanian, B.; Muraleedharan, C.V.; Ananthakumar, R.; Jayachandran, M. A comparative study of titanium nitride (TiN), titanium oxy nitride (TiON) and titanium aluminum nitride (TiAlN), as surface coatings for bio implants. Surf. Coat. Technol. 2011, 205, 5014–5020. [Google Scholar] [CrossRef]
- Jung, M.J.; Nam, K.H.; Chung, Y.M.; Boo, J.H.; Han, J.G. The physiochemical properties of TiOxNy films with controlled oxygen partial pressure. Surf. Coat. Technol. 2003, 171, 71–74. [Google Scholar] [CrossRef]
- Kuprin, A.S.; Gilewicz, A.; Kuznetsova, T.A.; Lapitskaya, V.A.; Tolmachova, G.N.; Warcholinski, B.; Aizikovich, S.M.; Sadyrin, E.V. Structure and properties of ZrON coatings synthesized by cathodic arc evaporation. Materials 2021, 14, 1483. [Google Scholar] [CrossRef]
- Manivasagam, G.; Dhinasekaran, D.; Rajamanickam, A. Biomedical Implants: Corrosion and its Prevention—A Review. Recent Pat. Corros. Sci. 2010, 2, 40–54. [Google Scholar] [CrossRef]
- Kamachi Mudali, U.; Sridhar, T.M.; Baldev, R.A.J. Corrosion of bio implants. Sadhana Acad. Proc. Eng. Sci. 2003, 28, 601–637. [Google Scholar] [CrossRef]
- Park, J. Biomaterials Science and Engineering, 1st ed.; Springer Science+Business Media New York: New York, NY, USA, 1984. [Google Scholar]
- Halliwell, B.; Clement, M.V.; Long, L.H. Hydrogen peroxide in the human body. FEBS Lett. 2000, 486, 10–13. [Google Scholar] [CrossRef]
- Cubillos, G.I.; Bethencourt, M.; Olaya, J.J.; Alfonso, J.E.; Marco, J.F. The influence of deposition temperature on microstructure and corrosion resistance of ZrOxNy/ZrO2 coatings deposited using RF sputtering. Appl. Surf. Sci. 2014, 309, 181–187. [Google Scholar] [CrossRef]
- Craig, B.D.; Anderson, D.S. (Eds.) Handbook of Corrosion Data, 2nd ed.; ASM International Materials: Novelty, OH, USA, 1995; ISBN 978-0-87170-518-1. [Google Scholar]
- Dinu, M.; Hauffman, T.; Cordioli, C.; Vladescu, A.; Braic, M.; Hubin, A.; Cotrut, C.M.C.M. Protective performance of Zr and Cr based silico-oxynitrides used for dental applications by means of potentiodynamic polarization and odd random phase multisine electrochemical impedance spectroscopy. Corros. Sci. 2017, 115, 118–128. [Google Scholar] [CrossRef]
- Anders, A. (Ed.) Cathodic Arcs-From Fractal Spots to Energetic Condensation; Springer: New York, NY, USA, 2008; ISBN 978-0-387-79107-4. [Google Scholar]
- Braic, L.; Zoita, N.C. Influence of the deposition time and temperature on the texture of InN thin films grown by RF-magnetron sputtering. Optoelectron. Adv. Mater. Rapid Commun. 2010, 4, 2013–2017. [Google Scholar]
- Dinu, M.; Braic, L.; Padmanabhan, S.C.; Morris, M.A.; Titorencu, I.; Pruna, V.; Parau, A.; Romanchikova, N.; Petrik, L.F.; Vladescu, A. Characterization of electron beam deposited Nb2O5 coatings for biomedical applications. J. Mech. Behav. Biomed. Mater. 2020, 103, 103582. [Google Scholar] [CrossRef]
- Schindelin, J.; Arganda-Carrera, I.; Frise, E.; Verena, K.; Mark, L.; Tobias, P.; Stephan, P.; Curtis, R.; Stephan, S.; Benjamin, S.; et al. Fiji—An Open platform for biological image analysis. Nat. Methods 2009, 9, 676–682. [Google Scholar] [CrossRef]
- Bortel, E.L.; Charbonnier, B.; Heuberger, R. Development of a synthetic synovial fluid for tribological testing. Lubricants 2015, 3, 664–686. [Google Scholar] [CrossRef]
- Romańczuk, E.; Oksiuta, Z. Comparison of corrosion resistance in physiological saline solution of two austenitic stainless steels—316LV and REX734. Acta Mech. Autom. 2017, 11, 91–95. [Google Scholar] [CrossRef]
- Manam, N.S.; Harun, W.S.W.; Shri, D.N.A.; Ghani, S.A.C.; Kurniawan, T.; Ismail, M.H.; Ibrahim, M.H.I. Study of corrosion in biocompatible metals for implants: A review. J. Alloys Compd. 2017, 701, 698–715. [Google Scholar] [CrossRef]
- Dini, C.; Costa, R.C.; Sukotjo, C.; Takoudis, C.G.; Mathew, M.T.; Barão, V.A.R. Progression of bio-tribocorrosion in implant dentistry. Front. Mech. Eng. 2020, 6, 1–14. [Google Scholar] [CrossRef]
- Sumita, M.; Hanawa, T.; Ohnishi, I.; Yoneyama, T. Failure processes in biometallic materials. Compr. Struct. Integr. 2003, 9, 131–167. [Google Scholar] [CrossRef]
- Souza, M.E.P.; Lima, L.; Lima, C.R.P.; Zavaglia, C.A.C.; Freire, C.M.A. Effects of pH on the electrochemical behaviour of titanium alloys for implant applications. J. Mater. Sci. Mater. Med. 2009, 20, 549–552. [Google Scholar] [CrossRef]
- Lewis, D.B.; Creasey, S.J.; Wüstefeld, C.; Ehiasarian, A.P.; Hovsepian, P.E. The role of the growth defects on the corrosion resistance of CrN/NbN superlattice coatings deposited at low temperatures. Thin Solid Film. 2006, 503, 143–148. [Google Scholar] [CrossRef]
- Warcholinski, B.; Kuznetsova, T.A.; Gilewicz, A.; Zubar, T.I.; Lapitskaya, V.A.; Chizhik, S.A.; Komarov, A.I.; Komarova, V.I.; Kuprin, A.S.; Ovcharenko, V.D.; et al. Structural and mechanical properties of zr-si-n coatings deposited by arc evaporation at different substrate bias voltages. J. Mater. Eng. Perform. 2018, 27, 3940–3950. [Google Scholar] [CrossRef]
- Choi, H.; Jang, J.; Zhang, T.; Kim, J.-H.; Park, I.-W.; Kim, K.H. Effect of Si addition on the microstructure, mechanical properties and tribological properties of Zr-Si-N nanocomposite coatings deposited by a hybrid coating system. Surf. Coat. Technol. 2014, 259, 707–713. [Google Scholar] [CrossRef]
- Flink, A.; Larsson, T.; Sjölén, J.; Karlsson, L.; Hultman, L. Influence of Si on the microstructure of arc evaporated (Ti,Si)N thin films; evidence for cubic solid solutions and their thermal stability. Surf. Coat. Technol. 2005, 200, 1535–1542. [Google Scholar] [CrossRef]
- Flores, M.; Huerta, L.; Escamilla, R.; Andrade, E.; Muhl, S. Effect of substrate bias voltage on corrosion of TiN/Ti multilayers deposited by magnetron sputtering. Appl. Surf. Sci. 2007, 253, 7192–7196. [Google Scholar] [CrossRef]
- Hultman, L.; Bareño, J.; Flink, A.; Söderberg, H.; Larsson, K.; Petrova, V.; Odén, M.; Greene, J.E.; Petrov, I. Interface structure in superhard TiN-SiN nanolaminates and nanocomposites: Film growth experiments and ab initio calculations. Phys. Rev. B Condens. Matter Mater. Phys. 2007, 75, 155437. [Google Scholar] [CrossRef]
- Petrov, I.; Barna, P.B.; Hultman, L.; Greene, J.E. Microstructural evolution during film growth. J. Vac. Sci. Technol. A Vac. Surf. Film. 2003, 21, S117–S128. [Google Scholar] [CrossRef]
- Lin, J.; Wang, B.; Ou, Y.; Sproul, W.D.; Dahan, I.; Moore, J. Structure and properties of CrSiN nanocomposite coatings deposited by hybrid modulated pulsed power and pulsed dc magnetron sputtering. Surf. Coat. Technol. 2013, 216, 251–258. [Google Scholar] [CrossRef]
- Saladukhin, I.A.; Abadias, G.; Uglov, V.V.; Zlotski, S.V.; Michel, A.; Janse van Vuuren, A. Thermal stability and oxidation resistance of ZrSiN nanocomposite and ZrN/SiNx multilayered coatings: A comparative study. Surf. Coat. Technol. 2017, 332, 428–439. [Google Scholar] [CrossRef]
- Yalamanchili, K.; Forsén, R.; Jiménez-Piqué, E.; Johansson Jöesaar, M.P.; Roa, J.J.; Ghafoor, N.; Odén, M. Structure, deformation and fracture of arc evaporated Zr-Si-N hard films. Surf. Coat. Technol. 2014, 258, 1100–1107. [Google Scholar] [CrossRef]
- Chen, Y.M.; Liao, B.; Wu, X.Y.; Zhang, H.X.; Zhang, X. Synthesis and characterization of zirconium oxynitride coatings deposited by filtered cathodic vacuum arc technology. Surf. Coat. Technol. 2013, 228, S210–S213. [Google Scholar] [CrossRef]
- Oh, U.C.; Je, J.H. Effects of strain energy on the preferred orientation of TiN thin films. J. Appl. Phys. 1993, 74, 1692–1696. [Google Scholar] [CrossRef]
- Pelleg, J.; Zevin, L.Z.; Lungo, S.; Croitoru, N. Reactive-sputter-deposited TiN films on glass substrates. Thin Solid Film. 1991, 197, 117–128. [Google Scholar] [CrossRef]
- Sudha, P.N.; Sangeetha, K.; Jisha Kumari, A.V.; Vanisri, N.; Rani, K. Corrosion of ceramic materials. In Fundamental Biomaterials: Ceramics; Sabu, T., Preetha, B., Sreekala Meyyarappallil, S., Eds.; Woodhead Publishing: Duxford, UK, 2018; pp. 223–250. ISBN 9780081022047. [Google Scholar]
- Adesina, A.Y.; Gasem, Z.M.; Madhan Kumar, A. Corrosion resistance behavior of single-layer cathodic arc PVD nitride-base coatings in 1M HCl and 3.5 pct NaCl solutions. Metall. Mater. Trans. B Process Metall. Mater. Process. Sci. 2017, 48, 1321–1332. [Google Scholar] [CrossRef]
- Stern, M.; Geary, L. Electrochemical Polarization I. A theoretical analysis of the shape of polarization curves. J. Electrochem. Soc. 1957, 104, 56–63. [Google Scholar] [CrossRef]
- Li, D.J.; Liu, F.; Wang, M.X.; Zhang, J.J.; Liu, Q.X. Structural and mechanical properties of multilayered gradient CrN/ZrN coatings. Thin Solid Films 2006, 506–507, 202–206. [Google Scholar] [CrossRef]
- Braic, M.; Braic, V.; Balaceanu, M.; Zoita, C.N.N.; Kiss, A.; Vladescu, A.; Popescu, A.; Ripeanu, R. Structure and properties of Zr/ZrCN coatings deposited by cathodic arc method. Mater. Chem. Phys. 2011, 126, 818–825. [Google Scholar] [CrossRef]
- Balaceanu, M.; Braic, M.; Braic, V.; Pavelescu, G. Properties of arc plasma deposited TiCN/ZrCN superlattice coatings. Surf. Coat. Technol. 2005, 200, 1084–1087. [Google Scholar] [CrossRef]
- Elsener, B.; Rota, A.; Böhni, H. Impedance study on the corrosion of PVD and CVD titanium nitride coatings. Mater. Sci. Forum 1991, 44–45, 29–38. [Google Scholar] [CrossRef]
- Rajkumar, R.; Vedhi, C. A study of corrosion protection efficiency of silica nanoparticles acrylic coated on mild steel electrode. Vacuum 2019, 161, 1–4. [Google Scholar] [CrossRef]
- Kendall, M.G. Rank Correlation Methods, 2nd ed.; Charles Griffin & Co.: London, UK, 1955. [Google Scholar]
- Evgeny, B.; Hughes, T.; Eskin, D. Effect of surface roughness on corrosion behaviour of low carbon steel in inhibited 4 M hydrochloric acid under laminar and turbulent flow conditions. Corros. Sci. 2016, 103, 196–205. [Google Scholar] [CrossRef]
- Reid, S.A.; Eden, D.A. Assessment of Corrosion. U.S. Patent No. 6,264,824 B1, 24 July 2001. [Google Scholar]
Publisher’s Note: MDPI stays neutral with regard to jurisdictional claims in published maps and institutional affiliations. |
© 2021 by the authors. Licensee MDPI, Basel, Switzerland. This article is an open access article distributed under the terms and conditions of the Creative Commons Attribution (CC BY) license (https://creativecommons.org/licenses/by/4.0/).