Abstract
This work deals with the treatment of wood surfaces by diffuse coplanar surface barrier discharge (DCSBD) generated at atmospheric pressure. The effect of the distance of the sample from the electrode surface and the composition of the working gas in the chamber was studied. Norway spruce (Picea abies) wood, both unmodified and thermally modified, was chosen as the investigated material. The change in the surface free energy (SFE) of the wood surface was investigated by contact angles measurements. Chemical and structural changes were studied using infrared spectroscopy, X-ray photoelectron spectroscopy (XPS), and scanning electron microscopy (SEM). Activation at a 0.15 mm gap from the electrode led in all cases to an increase in the SFE. The largest change in SFE components was recorded for wood thermally modified to 200 °C. At a 1 mm gap from the electrode increase of SFE occurred only when oxygen (O2) and argon (Ar) were used as working gas. Treatment in air and nitrogen (N2) resulted in an anomalous reduction of SFE. With the growing temperature of thermal modification, this hydrophobization effect became less pronounced. The results point out the importance of precise position control during the DCSBD mediated plasma treatment. A slight reduction of SFE on thermally modified spruce was achieved also by short term ultra-violet (UV) light exposure, generated by DCSBD.
1. Introduction
Wood is a well-known industrial material, and its surface properties have a huge impact on durability, quality, and product aesthetics. If the wood has been properly processed and treated, it will last for a very long time, which can be demonstrated on historic buildings, utility and artistic objects, musical instruments, and other wood products. By modifying wood surfaces, it is possible to achieve even better properties, streamline its use, or find new possibilities for its application in various areas of human activity [1].
Plasma treatment can change the surface properties of the wood and have a positive effect e.g., when applying varnishes and adhesives. This could not only affect the amount of the used paint or adhesives but also obtain a higher strength of the glued joints in stressed places.
Diffuse coplanar surface barrier discharge (DCSBD) enables homogeneous surface treatment of various flat surface materials such as wood [2,3], polymers [4], or glass [5]. Concerning the treatment of lignocellulose materials, it was observed that the effect of DCSBD treatment depends on the distance between the treated wood surface and the DCSBD electrode [6,7].
Understanding the reasons behind this effect could help us determine appropriate conditions for plasma treatment and maximize the desired effect, which may find its use in the construction industry, the production of furniture, musical instruments, decorative objects, etc.
In this research a spruce wood was chosen for treatment, owing to its large abundance in Central Europe, mainly due to the recent bark beetle calamity. Nowadays, the spruce wood is frequently thermally modified, usually in the range of 160 °C to 220 °C at low oxygen environment, to improve its dimensional stability against the moisture content and biological resistance against decay [8]. The heat treatment results in the loss of hemicelluloses mainly, which causes the growth in the relative abundance of hydrophobic lignin. This is considered to be the main reason behind the obtained reduced hygroscopicity (ability to absorb and retain water moisture) of wood. At the same time, however, the low surface wettability of thermally modified wood (TMW) complicates its further processing when applying water-based varnishes and adhesives or wood preservatives. For instance, in [9] authors observed a considerable, almost 1/3 reduction in adhesion strength of alkyd-reinforced acrylate paint with TMW spruce, already after a mild treatment (<200 °C).
TMW exhibits higher content of hydrophobic lignin, which is known to be quite sensitive to plasma treatment [10]. Thus, properly applied plasma treatment can be used to revert the obtained hydrophobic surface characteristics of heat-modified spruce as well as other wood species, such as beech, pine core, and other woods with higher lignin content.
In this research, spruce with different heat pre-treatment (160, 180, and 200 °C) was studied. The effect of DCSBD plasma treatment was evaluated by measuring the changes in wood surface free energy (SFE), chemical composition, and micro-morphology. An important parameter that affects the plasma treatment of wood is the composition of plasma treatment working gas. For this sake, the most common industrial gases such as air, nitrogen (N2), oxygen (O2), and argon (Ar) were investigated. Finally, factors such as substrate heating and ultra-violet (UV) radiation on the resulting hydrophilicity of the material were studied.
2. Materials and Methods
2.1. Samples and Wood Thermal Modification
The spruce samples were cut into regular cuboids. Because wood is a biological material that is exposed to varying different conditions during its growth, the resulting material is inhomogeneous. It has different surface and internal properties in different places. Only smooth parts of the samples without visible defects were used for the measurement. The samples were stored at room temperature in a closed container that maintained a constant 35–37% humidity without direct sun contact. The moisture content of the samples was measured to be less than 3%. The density of spruce and spruce heat-treated at 160, 180 and 200 °C was measured to be 480, 440, 410 and 400 kg/m3, respectively. The size of samples varied depending on the analytical technique that was used. Usually, at least 3 samples for each parameter were measured. The Katres s.r.o pilot plant laboratory chamber was used to perform thermal modification of the wood, which thermally treats the wood in the water vapor environment. The process has three basic phases: high-temperature drying, thermal modification, and final cooling. First, the temperature in the chamber, due to hot steam, rises rapidly to 100 °C. It then increases further, but more slowly, to 130 °C. During this, the humidity in the wood drops to a close to zero value. After drying, thermal modification follows. In our case, it took place for three hours at temperatures of 160, 180 or 200 °C. Steam is used during drying and heat treatment as protection against ignition. Finally, the chamber is cooled to a temperature of about 90 °C. At this stage, wetting is important for the final properties of the wood to be usable, it should have a moisture content above 4% [11].
2.2. Plasma Treatment
DCSBD was used for plasma treatment (Figure 1). The electrode system consisted of 32 parallel silver electrodes, which were 1.5 mm wide, 220 mm long, and had gaps of 1 mm between them As the dielectric, 96% alumina ceramics were used (Figure 2). For the plasma activation in a certain gaseous atmosphere, a DCSBD in a closed vessel with holes for the gas outlet, and an inlet with a controlled current flow was used. Then the specific gas for 5 min at a flow rate of 2 L/min was filled, so that the chamber was flushed many times with the given gas and the presence of atmospheric gases was minimal. The sinusoidal voltage was in the amplitude of 10 kV at a frequency of 15 kHz. The generator output power was 400 W for all gases except Ar, where it was 250 W. The efficiency of the whole system is approximately 90%. The distance from the sample to the electrode was controlled with the glass plates (0.15 and 1 mm) positioned on the electrode.
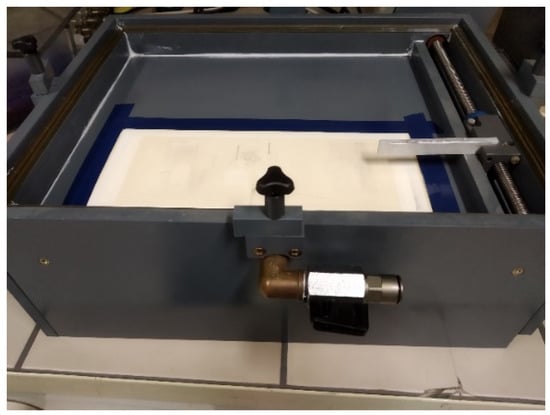
Figure 1.
Photo of the DCSBD plasma reactor.
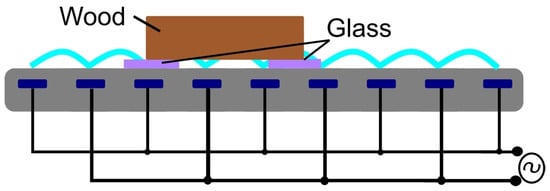
Figure 2.
Schematic setup of the DCSBD electrode.
2.3. Surface Characterization
The indirect determination of SFE and its polar and dispersive components was done using the Owens-Wendt regression method described previously in more detail [12]. Four liquids were used in this study: distilled water (γD = 21.9 mJ/mm2, γP = 51.0 mJ/mm2), ethylene glycol (γD = 29.0 mJ/mm2, γP = 19.0 mJ/mm2), diiodomethane (γD = 50.8 mJ/mm2, γP = 0 mJ/mm2) and glycerol (γD = 28.3 mJ/mm2, γP = 36.9 mJ/mm2) [13]. Surface Energy Evaluation System (Advex Instruments, Brno-Komín, Czech Republic) was used to measure contact angles (CA) directly from the camera images. For each testing liquid, the contact angle of 15 droplets (1 µL) was measured and the average values were used for the Owens-Wendt regression. The contact angles were determined at the time when the wetting rate becomes constant (dθ/dt = const) [14]. The obtained data were analyzed by Analysis ToolPak of MS Excel 2016 software (Microsoft Corp., Redmond, WA, USA). The normality of the data distribution was verified by its descriptive statistics tool. The significance of differences among the results was tested using the Student’s t-test, with the significance level of rejecting the null hypothesis being equal to 0.05. The surface morphology of the examined spruce was studied with a scanning electron microscope (SEM) MIRA3 from TESCAN (Brno, Czech Republic). Samples were cut into small pieces of about 15 × 10 × 5 mm3. Before SEM imaging, the samples were coated with a 10-nm Au–Pd composite layer. The sample surface was electrically connected with the sample holder to reduce surface charge accumulation. All measurements were taken using a secondary electron detector with an accelerating voltage of 7 kV to ensure minimal damage to the surface. The focus was mainly on the internal structures of wood, its tissues, vascular bundles, and especially on places where the effect of plasma etching was evident.
X-ray photoelectron spectroscopy (XPS) measurements were carried out on an ESCALAB 250Xi (Thermo Fisher Scientific, East Grinstead, UK). An X-ray beam with a power of 200 W (650 µm2 spot size) was used. The survey spectra were acquired with a pass energy of 50 eV and a resolution of 1 eV. High-resolution scans were acquired with a pass energy of 20 eV and a resolution of 0.1 eV. To compensate for the charges on the surface, an electron flood gun was used. Spectra were referenced to the hydrocarbon type C1s component set at a binding energy of 284.8 eV. Spectra calibration, processing, and fitting routines were done using Avantage software.
Attenuated total reflectance (ATR) infrared spectra were measured with Bruker Vertex 80 V spectrometer (Optik Instruments s.r.o., Brno, Czech Republic) utilizing a diamond crystal for ATR. All measurements were taken in an evacuated regime at a maximum pressure of 5 hPa. The spectra were acquired in a range of 4000–800 cm−1 with a resolution of 4 cm−1. It was confirmed that the absorption of the band in the region 1031–1053 cm−1 did not change as a result of plasma treatment, and each spectrum was normalized to the intensity at 1024 cm−1. At least, four samples of each parameter with a minimum of 3 points on each sample were measured. The results presented are the average of the obtained data.
2.4. Thermal Camera
For temperature measurement, a non-contact method using a thermal camera was taken. This method relies on electromagnetic radiation from objects. For the accuracy of measurement, it is essential to choose the value of emissivity correctly. During the recording we used e = 0.86 (mentioned e.g., in [15]). Emissivity in the range e = 0.82–0.89 is reported in the sources (e.g., [16,17]).
3. Results
3.1. Thermally Modified Wood
Spruce wood samples which were modified with three different temperatures before the plasma treatment—160, 180, and 200 °C are hereafter referred to as T160, T180, T200, respectively. Wood that has not been thermally modified is referred to as a reference—Ref. The thermal modification of timber caused a decrease in SFE. From the initial value of 66 mJ/mm2, it decreased to 62, 65, and 58 mJ/mm2 for T160, T180, and T200, respectively. The reference sample has the highest SFE as shown in Figure 3, i.e., wood thermal modification increases the wood surface hydrophobicity. The reason behind this is the intended disruption of cellulose, hemicellulose, and to a lesser extent of lignin, which is more stable. The hydroxyl groups present in hemicelluloses are strongly involved in wetting the wood by forming hydrogen bonds with water molecules. Their decomposition gives rise to observed hydrophobicity growth [18].
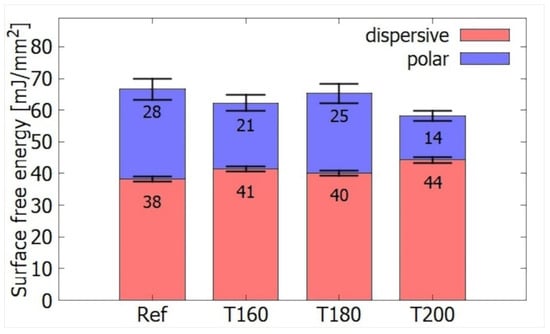
Figure 3.
Comparison of the surface energy of different TMW without plasma treatment.
The loss of these hydrogen bonds will also affect the ratio of surface energy components. The dispersion component increases from 38 mJ/mm2 for the reference wood to 44 mJ/mm2 for the T200. The polar component decreases from 28 to 14 mJ/mm2. There are boundaries between T180 and T200 where the hydrophilic behavior is significantly weakened. This is in agreement with an increase in the proportion of lignin in the wood. According to the article [10], there is a small difference between woods heated for 2 h at 150 and 180 °C—28%, compared to 31% for 200 °C.
3.2. Distance from the Electrode
Plasma treatment at the power of 400 W was done for two different distances between the wood and electrode of 0.15 mm and 1 mm. DCSBD plasma is most intense at the height interval of 0.1–0.3 mm from the electrode. When the sample is exposed to DCSBD plasma at this distance range, the contact angles of the water is expected to drop most significantly, as the SFE grows. In our case, however, when treating the reference spruce samples at 0.15 mm, there was no statistically significant change in SFE (Figure 4). The reason is that untreated spruce wood has already relatively high SFE. The resulting low contact angle (especially for water) interferes with the measurement accuracy. As a matter of fact, a value of 70 mJ/mm2 could represent an upper limit of reliably measurable SFE, and thus any improvement above this level (e.g., by plasma treatment) is undetectable. For thermally treated samples (Figure 4), where the initial SFE was lower, treatment at 0.15 mm resulted in a statistically significant increase of SFE, chiefly due to the growth of its polar component.
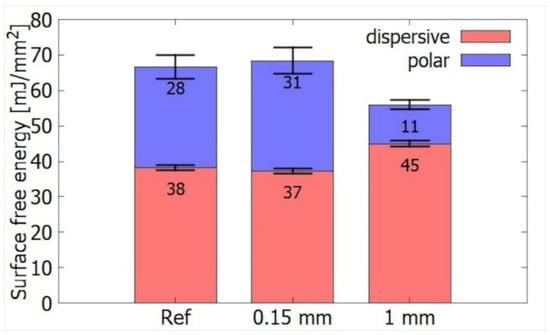
Figure 4.
Comparison of surface energies of thermally unmodified wood at different distances from the electrode in the air atmosphere.
The picture changed for the gap of 1 mm. At this position, the opposite effect occurred—the SFE dropped from 66 mJ/mm2 to 56 mJ/mm2, on account of polar from 28 to 11 mJ/mm2, although dispersive component manifested a slight increase from 38 to 45 mJ/mm2 (Figure 4). In article [7], the authors also reported such anomalous increase in hydrophobicity for the distance of 0.93 mm, where plasma began to quench.
The hydrophobization effect of 1mm distance treatment was observed also for thermally modified samples (Figure 5). The most significant SFE increase occurred for T200 at a distance of 0.15 mm, which is consistent with the results from [19]. This is related to the lower initial SFE of wood T200. After plasma treatment, the total energy was comparable to other samples with different heat treatments. The total values of the SFE of all thermally modified and reference wood for the distance of 0.15 mm from the electrode were in the range of 37–38 mJ/mm2 for dispersive and 27 to 31 mJ/mm2 for polar components. For a distance of 1 mm, the dispersion components were in the range of 45–46 mJ/mm2 and the polar components were in the range of 9–11 mJ/mm2.
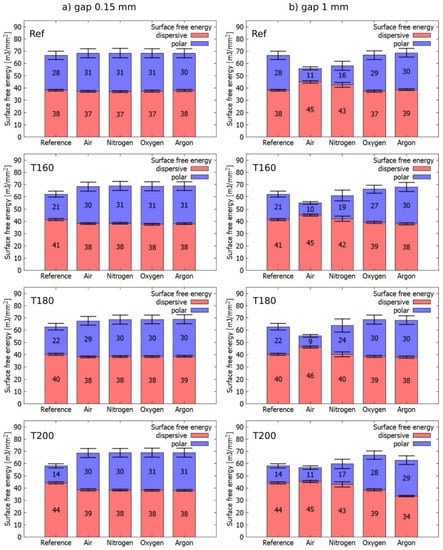
Figure 5.
Comparison of surface free energies for different gases during plasma activation of wood. (a) in case of 0.15 mm gap and (b) in case of 1 mm gap from the electrode.
3.3. Influence of Gas Composition on Processing
As a working gas, gases commonly used in industry, i.e., N2, O2, Ar, and air were studied. The wood treatment took place in each atmosphere at two different distances of the material from the electrode (0.15 and 1 mm). At the distance of 0.15 mm from the electrode, the SFE increases slightly in all atmospheres. In particular, the dispersion component slightly decreases, and the polar component increases. This can be explained by oxidation on the surface either directly during plasma activation or after extraction into atmospheric air, where the interaction of activated wood with O2 can take place. So, it could be concluded that while keeping the gap between the sample and the plasma in the range of 0.1–0.3 mm the working gas does not influence significantly the plasma treatment effect. In practice, however, it is hard to keep such a high precision during wood processing.
On the contrary, in the case of a 1 mm distance, the working gas played an important role. Air and N2 treatment displayed a more hydrophobic wood surface. With this respect, air gas showed a more pronounced effect. For both gases, the dispersion component increased, and the polar component decreased. Interestingly enough, 1 mm distance treatment in pure O2 had no hydrophobization effect. This points out the important role of NOx chemistry in the effect. An ample amount of nitric oxide compounds (NO, NO2, N2O5) and nitric acid in the presence of H2O is formed within the DCSBD and can strongly interact with the surface. These compounds oxidize the surface, thus rather causing an increase in SFE [20,21]. At the moment, it is an unresolved question to what extent one can manipulate the resulting SFE by altering the N2 to O2 ratio. This question was partially addressed in [22], where authors tested different atmospheres for DBD ATMOS plasma activation and monitored the change in wetting. They got an increase in the contact angle for 1:2 and 3:1 ratios N2:O2 and a decrease for the case 1:1. However, they did not explain this behavior but only stated that “the combination of structural change (induced by UV radiation, the impact of metastable particles, or both) and chemical change due to surface oxidation are responsible for the observed surface modification of wood samples [22].
In the case of O2 and Ar, the total SFE increased, comparable to the case where the wood was treated at a distance of 0.15 mm from the electrode. The increase of the polar component was slightly larger (max. 4 mJ/mm2, but mostly up to 1 mJ/mm2) and in most cases, the decrease of the dispersion component was slightly smaller (max. 5 mJ/mm2 for T200 Ar, but most up to 1 mJ/mm2). The behavior of T200 wood was most different from other wood samples.
The polar component in the N2 atmosphere after treatment at 1 mm distance increased with a temperature of thermal modification, but for T200 fell again close to the reference wood (Ref 1 mm) value.
3.4. Comparison of Wood and Polymer
To verify that the increase in water contact angle at 1 mm is specific to wood chemical composition, the contact angle of water for the polymer treated was measured. Specifically, polymethyl methacrylate (PMMA) commonly known as plexiglass was used. After plasma treatment, the hydrophilicity of the plexiglass increased, see Figure 6. For PMMA, the water contact angle was reduced for both cases. Keeping a 0.15 mm gap, the water contact angle decreased more markedly than for a 1 mm gap. Wood, on the other hand, acquired more hydrophilic properties only for 0.15 mm, and, at a distance of 1 mm, it was hydrophobized. Therefore, it is a matter of wood material and its specific morphological and chemical composition. For some polymers, plasma treatment can also increase the hydrophobicity of the surface due to etching, the formation of nanostructures and can achieve even superhydrophobic behavior [23]. However, in Section 3.7.2 Wood etching it will be shown that the increase in hydrophobicity in the wood was not caused by emerging nanostructures, as in these cases.
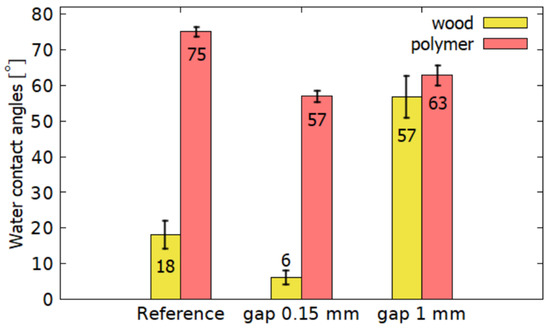
Figure 6.
Comparison of water contact angles between polymer and wood.
3.5. Fourier Transform Infrared Spectroscopy
FTIR spectra for T200 and both distances treatment are shown in Figure 7. There was no observable change in the absorbance band of the bonds of water and OH groups (3550–3150 cm−1). The absorbance in the CHx band (2947 cm−1) decreased after plasma treatment. This decrease is due to chemical reactions on the sample surface [2]. In the area of C=O conjugate bonds (1655 cm−1) there was a significant increase in absorbance for samples treated at 0.15 mm compared to the reference sample. These bonds are affected by plasma oxidation [24]. In [24] for spruce, both regions corresponding to C=O increased, of which the unconjugated band was more significant. In the case of a 1 mm gap, this peak decreased. Unconjugated bonds (1727 cm−1) increased after plasma treatment in both cases.
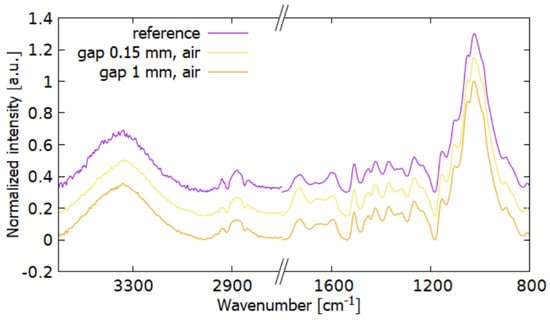
Figure 7.
FTIR spectra of wood T200 to compare the change in chemical composition at different distances from the electrode. The treatment was done in the air.
The 1596 cm−1 peak decreased for 0.15 mm that supports the theory that in the active plasma region CHx components undergo degradation. At the same time after plasma treatment at a 1 mm distance, this peak decreased less. For plasma-treated samples, absorbance increases in the syringyl and guaiacyl regions (aromatic groups from lignin) and OH groups from cellulose (1313–1336 cm−1).
Figure 8 compares measurements in N2 and air. The samples behave very similarly. For T180, the band of unconjugated C=O after the plasma treatment in the air hardly changes. At a distance of 1 mm they are almost identical, except for a large increase in C=O (1727, 1655 cm−1) and an increase in vibrations of 1264, 1219 cm−1 also bound to C=O bonds. These differences are also evident in the treatment at a distance of 0.15 mm from the electrode, especially in the vicinity of the areas 1727 and 1655 cm−1. Greater oxidation occurred in the N2 atmosphere.
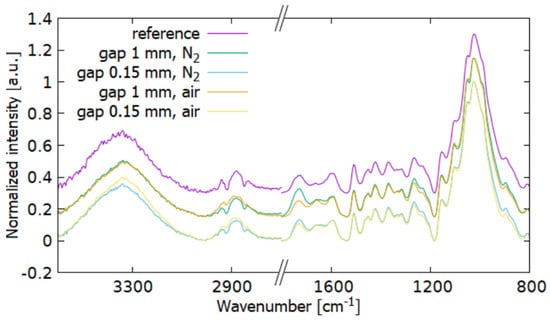
Figure 8.
FTIR spectra comparison of the T180 wood after plasma treatment under N2 and air atmosphere.
3.6. X-ray Photoelectron Spectroscopy
Due to the complex irregular surface topography, the random distribution of the wood components, and their random size, the errors of some measurements are significant.
Some samples contained a small percentage of N2 (up to 1.5%) in addition to O2 and carbon. After plasma treatment in a N2 atmosphere, they reached a maximum of 2% at 1 mm distance from the electrode and 9% at 0.15 mm distance. This increase did not occur in the air. The oxygen and carbon atomic percentages and O/C ratio obtained from XPS spectra for various gases and distances from the electrode are presented in Table 1.

Table 1.
Oxygen and carbon atomic percentage and O/C ratio obtained from XPS spectra for various gases and distances from the electrode. Data are in [%], except for O/C, which is dimensionless.
Component C1 corresponds to bonds C–C and C–H, component C2 is attributed to bonds C–O, component C3 can correspond to either the group O–C–O or the bond C=O and component C4 corresponds to the groups O=C–O. The main contribution to peak C1 comes from lignin and extracts, in peaks C2 and C3 it comes from functional groups in lignin and polysaccharide. The C4 peak is attributed to hemicellulose [19].
It is not surprising that after plasma treatment of a sample, the oxidation on its surface increased when it was directly in contact with the plasma. There was also a decrease in the Cl peak due to the decomposition of the extracts. This decrease was more pronounced in the air than in the N2 atmosphere. There was no measurable change in Ar. An increase in C3 and C4 peaks was also observed. A graphical representation of component changes can be seen in Figure 9a,b, where the drop of the C1 component and the increase of the C3, C4 components are clearly shown. It is known that an increase in the polar part of SFE occurs due to oxidation [19].
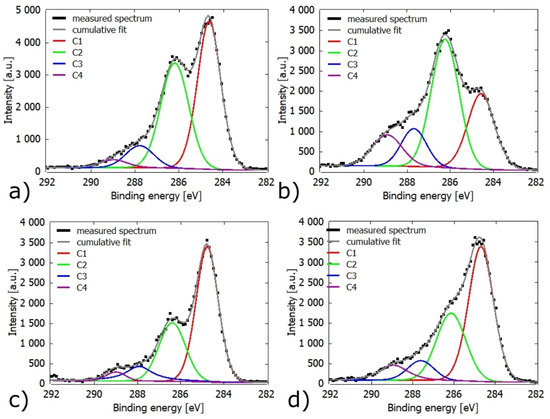
Figure 9.
The XPS spectrum deconvolution of Cls band: (a) untreated Ref sample, (b) Ref sample plasma treated in the air at 0.15 mm gap (c) Ref sample plasma treated in the air at 1 mm gap, (d) T200 plasma treated at 1 mm gap.
In the case of a 1 mm gap under a N2 and air atmosphere, the obtained O/C and heights of Cl peaks values were similar to the reference sample. A decrease in the O/C ratio on TMW was recorded. This corresponds to the increase in SFE measured by the SeeSystem. Figure 9c,d show examples of XPS spectra of reference and T200 samples with the corresponding individual components. It is seen that even after plasma treatment, a similar ratio of peaks between the reference and heat-treated wood was obtained.
For a 1 mm gap, the increase in O/C was greater for O2, thanks to the easiest oxidation. There was also an obvious decrease in the Cl component, from 48% to 17% for the reference wood and from 46% to 29% for T200.
At a 0.15 mm gap from the electrode for Ar, N2, and air atmospheres a significant increase in O2 values was recorded. At a 1 mm gap, lower O/C values for TMW after plasma treatment were obtained compared to the reference ones, though they were within the error bars.
3.7. Other Influences
3.7.1. Wood Heating
The samples are heated during the plasma treatment. The resulting temperature was determined using a thermal camera. The error of measurement was 2 °C.
Detection photos were taken right after removal from the DCSBD on the side that was placed into the plasma region. It was noticed that the wood did not heat up evenly, that is because the wood is not perfectly smooth. After 10 s, the maximum temperature of 52.2 °C was reached for the 0.15 mm gap. At a greater distance from the plasma—1 mm—it was only 40.8 °C.
The measurement of the temperature in the case of O2 and Ar atmosphere was affected by the procedure of getting the samples out of the reactor. It is assumed that the maximal temperature values were similar to the values obtained in the case of air treatment.
To separate the influence of the temperature, the untreated sample was heated to 60 °C by a hot air gun and measured with SeeSystem and SEM. The result did not show observable changes in surface properties. The SFE changed by a maximum of 2.5% of the total value. In Table 2 the highest achieved a temperature of activated wood under different conditions could be seen.

Table 2.
The maximum measured temperature of the wood sample surface.
3.7.2. Wood Etching
The structural changes of the sample surface after the plasma treatment were monitored using SEM. No significant changes in the structures were observed after the thermal nor plasma modification (Figure 10 and Figure 11).
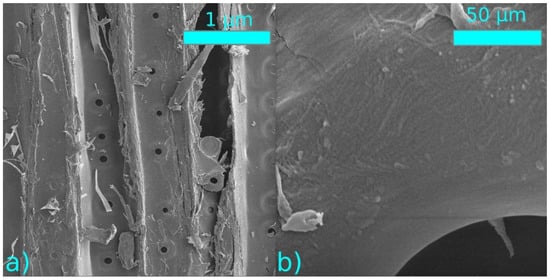
Figure 10.
SEM images of plasma-treated samples at a distance of 0.15 mm from the electrode (a) 1000× magnification, (b) 50,000× magnification.
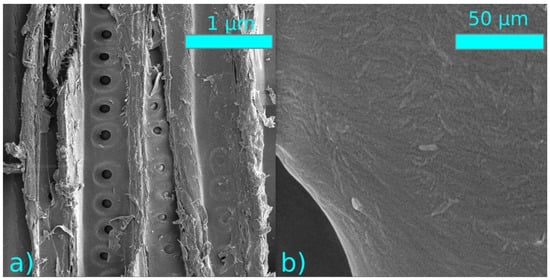
Figure 11.
SEM images of plasma treated samples at a distance of 1 mm from the electrode (a) 1000× magnification, (b) 50,000× magnification.
Previously it has been reported [25], that DCSBD treatment can etch a wood surface. Though the time needed for such a modification is in order of minutes. In [3], researchers laid wood directly on the DCSBD and did not observe the formation of nanostructures even after 60 s.
3.7.3. Influence of UV Radiation
To evaluate the sole effect of UV radiation emitted by plasma discharge a quartz glass was placed between the plasma and the wood. This allowed transmission of UV radiation, but at the same time preventing the passage of ions, electrons, radicals, and other molecules from the plasma, such as ozone or nitrogen oxides. The sample was positioned 1 mm above the electrode, and the air was used as the working gas.
Figure 12a,b show the resulting total SFEs and their corresponding disperse (dis.) and polar (pol.) components. Both plasma and UV treatment resulted in a statistically significant reduction of SFE. In both cases, the reduction could be attributed to the lowering of SFE’s polar component, which was more pronounced for plasma treatment. The sensitivity of thermally modified spruce to UV exposure contradicts our former observation in [26], where thermally modified European beech (Fagus sylvatica) did not exhibit any statistically significant response. The reason for this remains unclear yet. One explanation can be higher initial SFE of spruce (58 vs. 49 mJ/mm2 for T200), which may allow the effect to manifest itself. Another explanation may lay in the different chemical composition of coniferous spruce and deciduous beech.

Figure 12.
Comparison of surface energies of reference samples, plasma treated at 1 mm gap and treated by plasma generated UV. (a) Total SFE, (b) division into SFE components.
To better understand this discrepancy, further thorough testing with different wood species and UV intensity would be needed. This is beyond the scope of this article and can be considered for further studies. UV radiation has been reported to damage lignin and cellulose crystallinity upon prolonged exposure [27]. However, during the presented experiments, the UV expose of samples was for a short time. The effect of UV radiation on color was studied in articles [28,29] and FTIR tests were performed. They observed darkening of the wood in the reference samples and lightening of the heat modified samples.
4. Discussion
Thermal modification of wood should raise the relative content of hydrophobic lignin. The results of SFE measurements and the O/C ratio of TMW (Figure 3, Table 1) confirmed this expectation. A large jump of 4.6 mJ/mm2 in SFE occurred between T180 and T200. The O/C ratio for TMW gave significantly higher values for T160, while there was only a slight decrease between T180 and T200. However, the measurement on sample T160 is suspicious due to the lower proportion of the Cl component compared to other plasma untreated samples. Deviation from other measurements may be due to sample inhomogeneity. According to [19,30], one would expect thermal modification to reduce the O/C ratio. From the XPS measurements, it was observed that the components C2, C3, C4 did not change significantly (except for T160 wood). The Cl component slightly decreased compared to the reference wood, although an increase due to its association with lignin was expected. However, within the measurement accuracy, values remain the same as do the O/C ratios of Ref, T180, T200.
Only for the T200 sample the FTIR measurements (Figure 7) of showed an unambiguous increase in the absorbance regions of the aromatic skeletal bonds in lignin and the C=O bonds (1596, 1655, 1727 cm−1).
The SFE of the samples treated at a 0.15 mm gap from the electrode showed some increase for all types of the atmosphere (Figure 5a). In general, the starting SFE difference of TMW made at different temperatures was lost after the 0.15mm plasma treatment. XPS data showed a large increase in the O/C ratio and an increase in components C2, C3, and C4 at the expense of C1. This suggests a higher presence of polar functional groups on the surface. These results, together with the increase in C=O bonds from FTIR measurements (Figure 7 and Figure 8) signify surface oxidation. The XPS data indicate greater oxidation of pristine spruce for air and N2 and lower for Ar. Plasma treatment of TMW in Ar and N2 showed similar O/C ratio, as well as values of SFE. This may be due to a different process of increasing SFE. FTIR shows a larger increase in C=O under N2 compared to air (Figure 8). The surface energies obtained from laid liquid droplets are in accordance with these FTIR measurements, i.e., higher in a N2 atmosphere than in air.
Zanini et al. studied chemical changes in wood after treatment with Ar RF plasma [31]. An increase in the concentration of phenoxy radicals was observed. The formation of radicals occurs first on lignin, which becomes significantly modified. The resulting radicals can then react with other monomers to form C–C or C–O bonds. However, the RF plasma used in [31] has a distinct set of discharge operation conditions to DCSBD, thus one should expect that both types of plasma would act differently on wood chemical bonds.
For a 1 mm gap, the surface energy strongly depended on the used working gas (Figure 5b). DCSBD plasma in air forms reactive intermediates such as O2*, O2, O3, O, O+, O3+, e−, OH, N, CO2, N2* [6], but only long-lived neutrals and UV is capable to reach the sample surface positioned at 1mm distance. For air, this would be ozone or nitrogen oxides. Considering the frequency range 15–50 kHz AC, 15 kHz is the most suitable for generating O3 and NO [32].
Samples treated in the air at a 1 mm gap showed a reduction in the polar component of the SFE. Changes in values obtained from XPS showed no statistical difference. FTIR measurements showed a small increase in the proportion of unconjugated C=O bonds and a decrease in aromatic skeletal bonds in lignin.
It has been shown that treatment at the 1 mm gap increases the wettability of the cellulose slightly and therefore cannot cause an increase in the hydrophobicity of the wood surface [26]. Not only chemical interaction and UV radiation could cause the change of morphology but the closing of micropores could also be a reason [33]. Partial closure of surface pores has been observed during ionic irradiation of wood [34]. In our conditions, at a 1 mm gap and a treatment time of 10 s, ion radiation should not be significant [22]. The morphology of the wood surface using SEM was mapped. It was found that 10 s is too short a time to etch or otherwise affect the wood morphology. Some morphological changes occur only after a longer treatment period.
The effect of hydrophobization after plasma treatment was not observed on PMMA material after treatment under the same conditions. The effect is therefore associated with the wood material itself, and its chemical changes.
Isolation of the temperature effect has shown that it had no influence on SFE or morphology. Again, the treatment time and temperature were too short to cause any changes.
By isolating the effect of UV radiation, it was found out that it contributed to an increase in the dispersion and a decrease in the polar part with an overall decrease in SFE (Figure 12). By comparing spruce with beech wood, it can be stated that the effect of UV irradiation differs depending on wood type.
For a 1 mm distance treatment, the results in N2 and air are very similar. Lack of O2 during treatment may contribute to a slightly lower increase in hydrophobicity. But part of the water vapor desorbed from the sample could provide O2 molecules needed for the formation of nitrogen oxides and nitric acid. It should be stated, however, that the effects of secondary nitrogen oxides reactions that may take place after samples removed from the chamber could not be eliminated.
Article by Bihani et al. states that wood-meal (in the presence of O2) binds gaseous molecules NO and NO2 relatively quickly [35]. According to the research, reactions with NO and NO2 did not cause a decrease in SFE [35,36]. Wood-meal was modified with nitrogen oxides for de-lignification. In wool or delignified materials, nitrogen dioxide is converted to nitric acid in the presence of O2. These reactions should not be significantly affected by lignin, nitric acid can then strongly oxidize wood [36]. This should increase the polar component of SFE.
When treating the T200 sample at 1 mm in air, the decrease of the polar part was negligible. After plasma treatment in N2, O2, and Ar, the polar part raised (Figure 5b). A possible explanation is that thermal modification at 200 °C had actually achieved a hydrophobicity threshold/maximum for spruce wood. The source for further chemical reactions resulting in SFE decline is depleted for the T200 sample. Taking into account, that thermal treatment results in the decomposition of hemicelluloses mainly, the following hypothesis may be drawn: the hydrophobization effects it due to chemical reactions of long-lived plasma generated particles and hemicellulose on the wood surface. The same conclusion was derived for thermally modified European beech (Fagus sylvatica) in [26].
From the previous experiments, it is known that the plasma treatment of the cellulose increases its hydrophilicity. In a paper by Talviste et al. [26], it was reported that plasma treatment by DCSBD at 1 mm gap has the same tendency as the reference sample on the cellulose paper water uptake. It was concluded that the cellulose itself contributes to the increased hydrophilicity.
O2 treatment at 1mm caused SFE to increase by increasing its polar component. This is due to the strong oxidizing effects of ozone [21,37]. The selectivity of ozone in reactions with lignin and carbohydrates is strongly dependent on the pH of the environment. When activated by plasma, acidic components such as formic acid (HCOOH) and acetic acid (CH3COOH) are formed, which select the reactions of ozone with lignin [38]. Ozone reacts mainly with unbound bonds, carbonyl, ether, and hydroxyl groups. DCSBD plasma under an O2 atmosphere forms up to 2000 ppm O3 [39]. The O/C ratio also indicates strong oxidation. With respect to the hydrophobization effect, the ozone would definitely contribute to hemicellulose degradation. However, this effect could be completely overshadowed by the formation of novel polar groups on the surface.
5. Conclusions
The wood of Norway spruce (Picea abies) was activated using DCSBD plasma, including heat-treated samples. Activation proceeded in atmospheric air and frequent working gases used in industry: N2, O2, Ar, all at atmospheric pressure. Two activation distances were considered: in the plasma zone and above it. Activation at a 0.15 mm gap from the electrode led in all cases to an increase in the SFE. That means the starting SFE difference of TMW made at different temperatures was lost.
At a distance of 1 mm from the electrode increase of SFE occurred only when O2 and Ar were used as working gas. However, it was observed that after treatment in air and N2 the values of SFE decrease due to polar part reduction. This effect is of importance in the case of industrial plasma application where it is hard to keep the working distance while treating timber. Understanding the reasons behind this effect could help us determine appropriate conditions for plasma treatment and maximize the desired effect.
Wood material was compared to PMMA, which does not show a similar effect. It is therefore a material matter of wood and its morphological and chemical composition. After the SEM analyses, it could be stated that no morphological changes take place during short plasma treatment. It was shown that heating of wood during the plasma treatment did not influence the SFE, either.
The hydrophobization effects that were shown are explained by the chemical reactions of long-lived plasma generated particles and hemicellulose on the wood surface.
A slight reduction of SFE on thermally modified spruce was achieved also by short term UV light exposure, generated by DCSBD at a 1 mm distance. From the comparison of spruce with beech wood, it could be stated that the effect of UV irradiation differs depending on wood type. To fully understand the effect of UV on wood, further thorough testing on multiple types of wood could be recommended and UV effects such as short exposure time, intensity, etc. to be assessed.
Author Contributions
Conceptualization, O.G., and J.R.; formal analysis, Z.K.; investigation, Z.K.; writing—original draft preparation, Z.K., and O.G.; writing—review and editing, O.G. and J.R.; supervision, O.G. All authors have read and agreed to the published version of the manuscript.
Funding
This research was funded by the Ministry of Education, Youth, and Sports of the Czech Republic, grant number LM2018097.
Institutional Review Board Statement
Not applicable.
Informed Consent Statement
Not applicable
Data Availability Statement
Data available in a publicly accessible repository. The data presented in this study are openly available in [repository name e.g., FigShare] at [doi], reference number [reference number].
Acknowledgments
We would like to thank the Department of Wood Science at the Mendel University in Brno for providing the thermally treated wood samples.
Conflicts of Interest
The authors declare no conflict of interest.
References
- Dejmal, A. Sušení a Modifikace Dřeva (Učební Texty) [Wood drying and modification (Textbook)]; Mendel University in Brno: Brno, Czech Republic, 2017. [Google Scholar]
- Odrášková, M.; Ráhel’, J.; Zahoranová, A.; Tiňo, R.; Černák, M. Plasma activation of wood surface by diffuse coplanar surface barrier discharge. Plasma Chem. Plasma Process. 2008, 28, 203–211. [Google Scholar] [CrossRef]
- Gerullis, S.; Kretzschmar, B.S.; Pfuch, A.; Beier, O.; Beyer, M.; Grünler, B. Influence of atmospheric pressure plasma jet and diffuse coplanar surface barrier discharge treatments on wood surface properties: A comparative study. Plasma Process. Polym. 2018. [Google Scholar] [CrossRef]
- Kormunda, M.; Homola, T.; Matousek, J.; Kovacik, D.; Cernak, M.; Pavlik, J. Surface analysis of poly(ethylene naphthalate) (PEN) films treated at atmospheric pressure using diffuse coplanar surface barrier discharge in air and in nitrogen. Polym. Degrad. Stab. 2012, 97, 547–553. [Google Scholar] [CrossRef]
- Homola, T.; Matoušek, J.; Kormunda, M.; Wu, L.Y.L.; Černák, M. Plasma treatment of glass surfaces using diffuse coplanar surface barrier discharge in ambient air. Plasma Chem. Plasma Process. 2013, 33, 881–894. [Google Scholar] [CrossRef]
- Jablonsky, M.; Smatko, L.; Botkova, M.; Tino, R.; Sima, J. Modification of wood wettability (European beech) by diffuse coplanar surface barrier discharge plasma. Surfaces 2016, 50, 41–48. [Google Scholar]
- Tino, R.; Smatko, L. Modifying wood surfaces with atmospheric diffuse coplanar surface barrier discharge plasma. Wood Fiber Sci. 2014, 46, 459–464. [Google Scholar]
- van Blokland, J.; Olsson, A.; Oscarsson, J.; Daniel, G.; Adamopoulos, S. Crack formation, strain distribution and fracture surfaces around knots in thermally modified timber loaded in static bending. Wood Sci. Technol. 2020, 54, 1001–1028. [Google Scholar] [CrossRef]
- Altgen, M.; Militz, H. Thermally modified Scots pine and Norway spruce wood as substrate for coating systems. J. Coat. Technol. Res. 2017, 14, 531–541. [Google Scholar] [CrossRef]
- Yildiz, S.; Gezer, E.D.; Yildiz, U.C. Mechanical and chemical behavior of spruce wood modified by heat. Build. Environ. 2006, 41, 1762–1766. [Google Scholar] [CrossRef]
- Horníček, S. Vliv Tepelné Modifikace na Vybrané Vlastnosti Dřeva Plantážově Pěstovaného Topolu [The Effect of Thermal Modification on Selected Properties of Plantation Grown Poplar Wood]; Mendel University in Brno: Brno, Czech Republic, 2016. [Google Scholar]
- Ninness, B. Estimation of I// Noise. IEEE Trans. Inf. Theory 1998, 44, 32–46. [Google Scholar] [CrossRef]
- Gindl, M.; Sinn, G.; Gindl, W.; Reiter, A.; Tschegg, S. A comparison of different methods to calculate the surface free energy of wood using contact angle measurements. Colloids Surf. 2001, 181, 279–287. [Google Scholar] [CrossRef]
- Nussbaum, R.M. Natural surface inactivation of Scots pine and Norway spruce evaluated by contact angle measurements. Holz Roh Werkst. 1999, 57, 419–424. [Google Scholar] [CrossRef]
- Infrared Emissivity Table|ThermoWorks online. Available online: https://www.thermoworks.com/emissivity-table (accessed on 27 December 2020).
- Mikron Instrument Company Inc. Table of Emissivity of Various Surfases. Introduction; Mikron Instrument Company Inc.: Flurlingen, Switzerland, 2002. [Google Scholar]
- Wilson, J.S. Sensor Technology Handbook; Elsevier: Oxford, UK, 2005; ISBN 9780750677295. [Google Scholar]
- Gérardin, P.; Petrič, M.; Petrissans, M.; Lambert, J.; Ehrhrardt, J.J. Evolution of wood surface free energy after heat treatment. Polym. Degrad. Stab. 2007, 92, 653–657. [Google Scholar] [CrossRef]
- Altgen, D.; Avramidis, G.; Viöl, W.; Mai, C. The effect of air plasma treatment at atmospheric pressure on thermally modified wood surfaces. Wood Sci. Technol. 2016, 50, 1227–1241. [Google Scholar] [CrossRef]
- Tangsathitkulchai, C.; Ngernyen, Y.; Tangsathitkulchai, M. Surface modification and adsorption of eucalyptus wood-based activated carbons: Effects of oxidation treatment, carbon porous structure and activation method. Korean J. Chem. Eng. 2009, 26, 1341–1352. [Google Scholar] [CrossRef]
- Kang, G.; Ni, Y.; van Heiningen, A.R.P.; Zhang, Y. Influence of lignins on the degradation of cellulose during ozone treatment. J. Wood Chem. Technol. 1995, 15, 413–430. [Google Scholar] [CrossRef]
- Busnel, F.; Blanchard, V.; Prégent, J.; Stafford, L.; Riedl, B.; Blanchet, P.; Sarkissian, A. Modification of sugar maple (Acer saccharum) and black spruce (Picea mariana) wood surfaces in a dielectric barrier discharge (DBD) at atmospheric pressure. J. Adhes. Sci. Technol. 2010, 24, 1401–1413. [Google Scholar] [CrossRef]
- Dimitrakellis, P.; Gogolides, E. Hydrophobic and superhydrophobic surfaces fabricated using atmospheric pressure cold plasma technology: A review. Adv. Colloid Interface Sci. 2018, 254, 1–21. [Google Scholar] [CrossRef]
- Lux, C.; Szalay, Z.; Beikircher, W.; Kovacik, D.; Pulker, H.K. Investigation of the plasma effects on wood after activation by diffuse coplanar surface barrier discharge. Eur. J. Wood Wood Prod. 2013, 71, 539–549. [Google Scholar] [CrossRef]
- Galmiz, O.; Talviste, R.; Panáček, R.; Kováčik, D. Cold atmospheric pressure plasma facilitated nano-structuring of thermally modified wood. Wood Sci. Technol. 2019. [Google Scholar] [CrossRef]
- Talviste, R.; Galmiz, O.; Stupavská, M.; Ráhel’, J. Effect of DCSBD plasma treatment distance on surface characteristics of wood and thermally modified wood. Wood Sci. Technol. 2020, 54, 651–665. [Google Scholar] [CrossRef]
- Patachia, S.; Croitoru, C.; Friedrich, C. Effect of UV exposure on the surface chemistry of wood veneers treated with ionic liquids. Appl. Surf. Sci. 2012, 258, 6723–6729. [Google Scholar] [CrossRef]
- Timar, M.C.; Varodi, A.M.; Gurău, L. Comparative study of photodegradation of six wood species after short-time UV exposure. Wood Sci. Technol. 2016, 50, 135–163. [Google Scholar] [CrossRef]
- Srinivas, K.; Pandey, K.K. Photodegradation of thermally modified wood. J. Photochem. Photobiol. B Biol. 2012, 117, 140–145. [Google Scholar] [CrossRef]
- Nguila Inari, G.; Petrissans, M.; Lambert, J.; Ehrhardt, J.J.; Gérardin, P. XPS characterization of wood chemical composition after heat-treatment. Surf. Interface Anal. 2006, 38, 1336–1342. [Google Scholar] [CrossRef]
- Zanini, S.; Riccardi, C.; Canevali, C.; Orlandi, M.; Zoia, L.; Tolppa, E.L. Modifications of lignocellulosic fibers by Ar plasma treatments in comparison with biological treatments. Surf. Coat. Technol. 2005, 200, 556–560. [Google Scholar] [CrossRef]
- Čech, J.; Brablec, A.; Černák, M.; Puač, N.; Selaković, N.; Petrović, Z.L. Mass spectrometry of diffuse coplanar surface barrier discharge: Influence of discharge frequency and oxygen content in N2/O2 mixture. Eur. Phys. J. D 2017, 71. [Google Scholar] [CrossRef]
- Gardner, D.J.; Frazier, C.E.; Christiansen, A.W. Characteristics of the Wood Adhesion Bonding Mechanism Using Hydroxymethyl Resorcinol. In Proceedings of the Wood Adhesives; Forest Products Society: San Diego, CA, USA, 2005; pp. 93–97. [Google Scholar]
- Ramos, H.J.; Monasterial, J.L.C.; Blantocas, G.Q. Effect of low energy ion beam irradiation on wettability of narra (Pterocarpus indicus) wood chips. In Proceedings of the Nuclear Instruments and Methods in Physics Research, Section B: Beam Interactions with Materials and Atoms; Elsevier: Pacific Grove, CA, USA, 2006; Volume 242, pp. 41–44. [Google Scholar]
- Bihani, B.; Samuelson, O. Consumption of nitrogen oxides during pretreatment of wood with nitrogen dioxide and oxygen. Wood Sci. Technol. 1984, 18, 295–306. [Google Scholar] [CrossRef]
- Subramanian, R.V.; Balaba, W.M.; Somasekharan, K.N. Surface Modification of Wood Using Nitric Acid. J. Adhes. 1982, 14, 295–304. [Google Scholar] [CrossRef]
- Mbachu, R.A.D.; Manley, R.S.J. Degradation of lignin by ozone—1. The kinetics of lignin degradation of ozone. J. Polym. Sci. Polym. Chem. Ed. 1981, 19, 2053–2063. [Google Scholar] [CrossRef]
- Kureková, G. Wood Surface Treatment by DCSBD Plasma; Slovak Technical University in Bratislava: Bratislava, Slovakia, 2011. [Google Scholar]
- Šimek, M.; Pekárek, S.; Prukner, V. Influence of power modulation on ozone production using an AC surface dielectric barrier discharge in oxygen. Plasma Chem. Plasma Process. 2010, 30, 607–617. [Google Scholar] [CrossRef]
Publisher’s Note: MDPI stays neutral with regard to jurisdictional claims in published maps and institutional affiliations. |
© 2021 by the authors. Licensee MDPI, Basel, Switzerland. This article is an open access article distributed under the terms and conditions of the Creative Commons Attribution (CC BY) license (http://creativecommons.org/licenses/by/4.0/).