Article

Machine Learning Based Prediction of Nanoscale Ice Adhesion on Rough Surfaces

Department of Structural Engineering, Norwegian University of Science and Technology (NTNU), 7491 Trondheim, Norway
*
Authors to whom correspondence should be addressed.
Coatings 2021, 11(1), 33; https://doi.org/10.3390/coatings11010033
Submission received: 11 December 2020 / Revised: 25 December 2020 / Accepted: 27 December 2020 / Published: 31 December 2020
(This article belongs to the Special Issue Low Ice Adhesion Coatings)

Abstract

:
It is widely recognized that surface roughness plays an important role in ice adhesion strength, although the correlation between the two is far from understood. In this paper, two approaches, molecular dynamics (MD) simulations and machine learning (ML), were utilized to study the nanoscale intrinsic ice adhesion strength on rough surfaces. A systematic algorithm for making random rough surfaces was developed and the surfaces were tested for their ice adhesion strength, with varying interatomic potentials. Using MD simulations, the intrinsic ice adhesion strength was found to be significantly lower on rougher surfaces, which was attributed to the lubricating effect of a thin quasi-liquid layer. An increase in the substrate–ice interatomic potential increased the thickness of the quasi-liquid layer on rough surfaces. Two different ML algorithms, regression and classification, were trained using the results from the MD simulations, with support vector machines (SVM) emerging as the best for classifying. The ML approach showed an encouraging prediction accuracy, and for the first time shed light on using ML for anti-icing surface design. The findings provide a better understanding of the role of nanoscale roughness in intrinsic ice adhesion and suggest that ML can be a powerful tool in finding materials with a low ice adhesion strength.

1. Introduction

Ice formation on various surfaces is known to represent a danger and can cause severe damage [1]. In particular, the aviation industry has seen multiple disasters which can be traced to unwanted ice accretion on the body of the plane [2,3]. Icing also causes a significant decrease in efficiency and regular complete halts of wind turbines, and in the rapid expansion of wind farms a means to reduce or altogether remove ice is a much-desired technology [4,5,6,7,8,9]. Traditional anti-icing technologies all come with challenges. For example, active heating is energy-consuming [10], mechanical de-icing is labor-intensive and can damage the surface [7], and chemical treatments are potentially environmentally hazardous [11]. There is a strong desire to find materials that display a passive anti-ice property, naturally repelling surface ice.
Analogous to hydrophobicity, as a term relating to materials with a non-wetting surface property, icephobicity relates to surfaces showing anti-icing behavior. Icephobicity traditionally encompasses three different aspects which can work independently or in tandem to reduce the presence of ice on a material [11,12]. First, the surface can repel supercooled water and, as such, prevent ice formation [13]. Second, the surface can prevent adjacent liquid water from nucleating and hence delay ice formation [14,15,16,17]. Third, icephobicity can be defined as surfaces showing a low ice adhesion, reducing the necessary force to detach the ice from the surface [18,19,20]. This last strategy for reducing the ice adhesion strength, is the main focus of this work.
Ice adhesion strength is defined as the maximum force (F) per unit surface area (A) needed to remove ice. Research today is mainly focused on finding materials with a super-low ice adhesion. Super-low ice adhesion has previously been defined as the automatic de-icing stress by a gravity of 1 cubic meter of ice (<10 kPa) [21]. The macroscopic assumption of ice adhesion in experiments is not necessarily valid at the nanoscale. Macroscopic ice adhesion strength assumes that the force applied to the ice is evenly distributed across the ice–surface interface, but it is well known that even seemingly flat surfaces exhibit a roughness at the micro- or nanoscale [22], resulting in a different load distribution and direction relative to the surface [1]. As experiments mainly focus on macroscopic apparent ice adhesion, atomistic modeling and simulations concentrate on intrinsic ice adhesion at the length scale of nanometer range [23,24,25]. Understanding nanoscale ice adhesion is not only essential for deciphering macroscopic adhesion behavior but also critical for achieving multiscale ice adhesion prediction in material surface design and optimization. At the current stage, there is a lack of understanding of how the nanoscale roughness—as a nanoscale crack initiator for de-icing [21]—of a substrate affects the adhesion strength of the ice attached to it. The literature shows little agreement, ranging from conclusions that a rough surface will increase the adhesion [6,11,26,27,28,29,30,31] to the conclusion that it decreases adhesion [1,9,32,33], or no clear effect at all [34]. Many also find a dependence without a known relationship [8,30,35,36]. Recently, the effect of rough surfaces on confining the interfacial non-frozen water has also been discussed [9,37,38,39].
The Gibbs–Thomson equation represents a thermodynamic rationale for why water cannot nucleate into ice in confined spaces [40,41,42]. It was shown that nucleation in water trapped in a cylindrical pore at a temperature of 250 K can only happen if the radius of the pore is large enough and reaches roughly the order of magnitude of 10 nm [9,43]. A stable ice nucleus needs to be bigger than this size in order to overcome the energy barrier associated with solidification. Although a rough surface may not consist of an array of pores, the roughness can still form a series of confined spaces such that the water can in its equilibrium position remain liquid, given that the roughness is in the nanoscale. The existence of a liquid layer between the material surface and the ice has been shown to cause a reduction in the ice adhesion strength, as the liquid behaves as a lubricant [8,9,27,32,33]. This layer, often termed the quasi-liquid layer, is a key factor in how a material can be made intrinsically icephobic without having to replenish chemicals [9].
The most appropriate tool, atomistic modeling and molecular dynamics (MD) simulations, has been utilized to gain further understanding of the nanoscale ice adhesion and detachment mechanisms [23,24,25]. Phenomena such as the quasi-liquid layer, the lubricating effects, and the role of surface topography can therefore be studied in detail, and the ice adhesion strength can thus be predicted [23,24,25,44,45]. Such predictions are white-box models, in that the approach applies carefully stated laws of physics and mathematical time integration in order to reach a conclusive prediction. Although MD simulation is a strong tool, it does have a set of limitations—simulations can only cover short timescales (approximate <100 ns), in small scales, and apply Newtonian physics, meaning that neither long-term nor large-scale phenomena can be detected. In accessing ice adhesion strength, a particular limitation of MD simulations is the high loading rate used in mechanical testing, which is generally many orders of magnitude higher than the loading rates performed experimentally. This leads the adhesion strength predictions to be much higher than the experimental values due to the high loading rate [23,46]. Thus, MD simulations for ice adhesion provide qualitative results rather than the absolute magnitudes, meaning that a relatively low adhesion observed in MD simulation should correspond to a low adhesion outside simulations too.
Machine learning (ML), on the other hand, represents a black-box model. While MD simulations give us opportunities to directly examine the physical properties of a surface for understanding ice predictions, ML models will merely give a statistical prediction by studying, given enough data, and find trends and patterns [47,48]. For ice adhesion, ML can be a powerful tool, as there is not one single physical factor determining the adhesion strength but a complex parameter set of a surface and its interactions with ice. As such, ML can create a model which allows the prediction of adhesion strength without having to perform simulations or lab experiments.
Given the huge diversity of surface roughness landscapes at the nanoscale, there has currently been no reported attempt to solve the relationship between nanoscale surface roughness and intrinsic ice adhesion. This work takes the advantage of atomistic modeling and MD simulations to examine the intrinsic ice adhesion strength and, for the first time, steer ML to predict ice adhesion by utilizing the atomistic modeling data. The procedure and results of this study thus can be used for speeding up anti-icing surface research and can potentially be further developed to encompass larger surfaces and different ice types or freezing conditions [49].

2. Methods

The modeling and simulation procedures for intrinsic ice adhesion are first outlined here, followed by the details of ML and prediction.

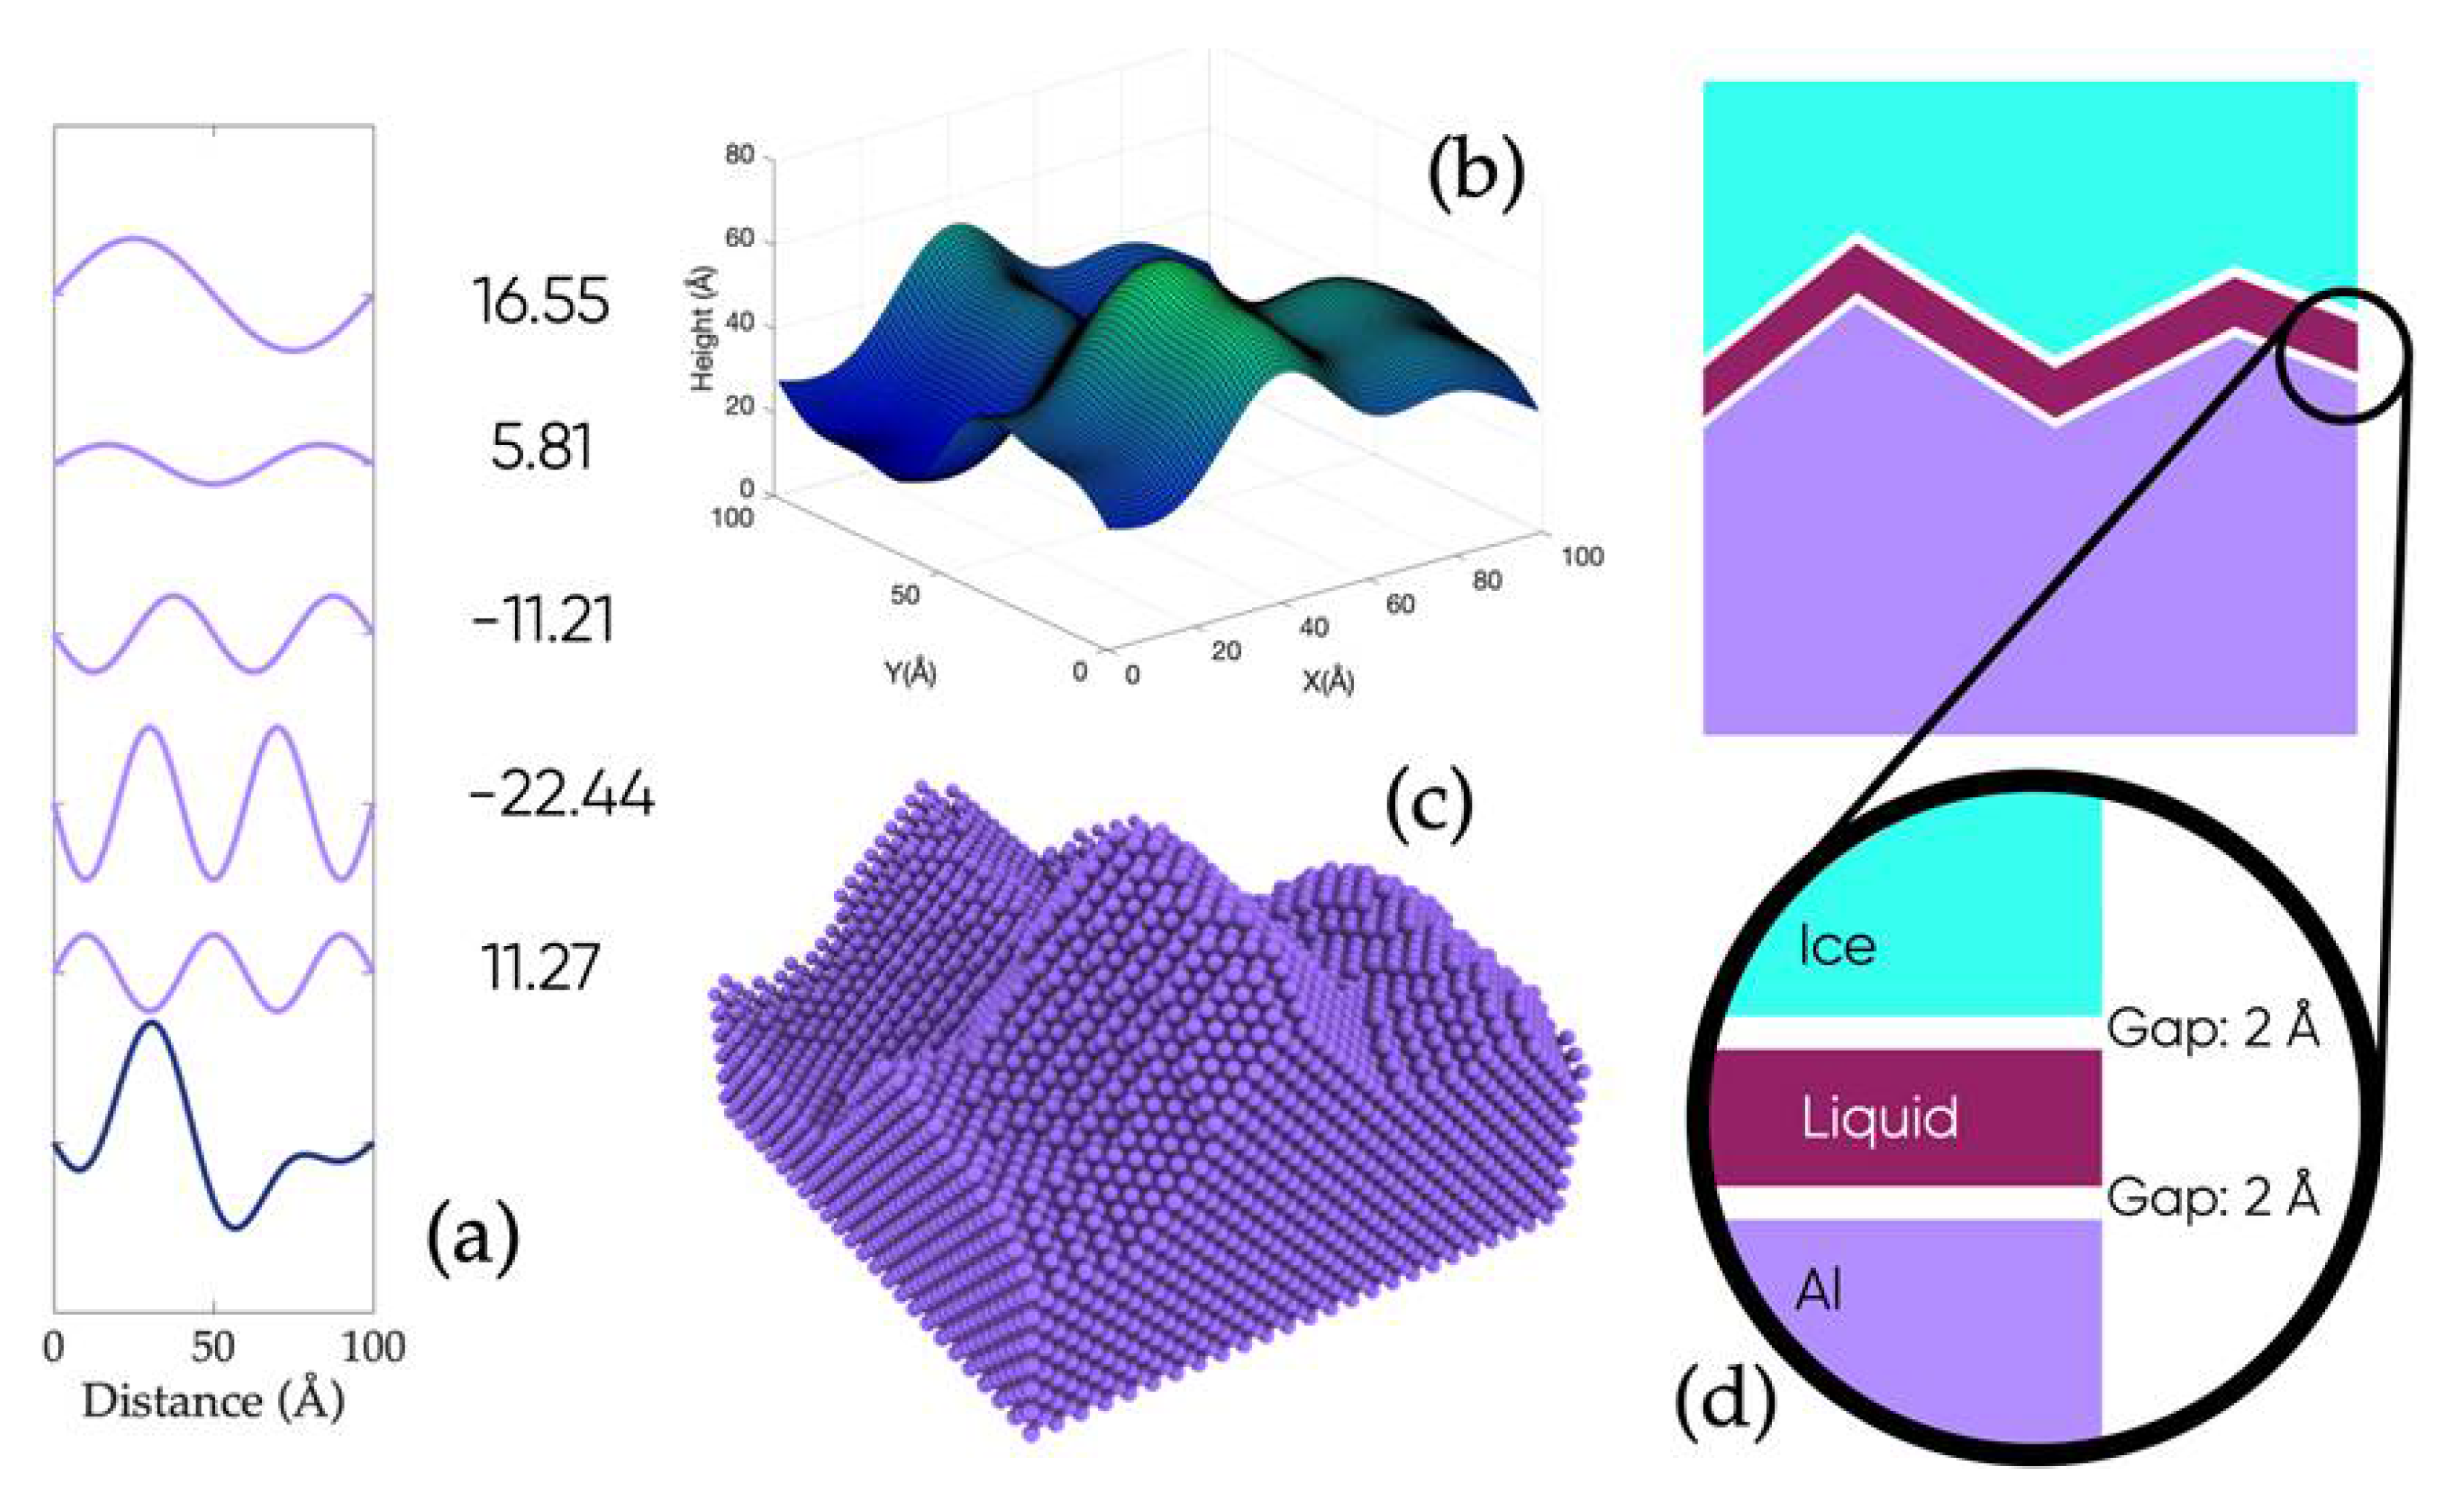
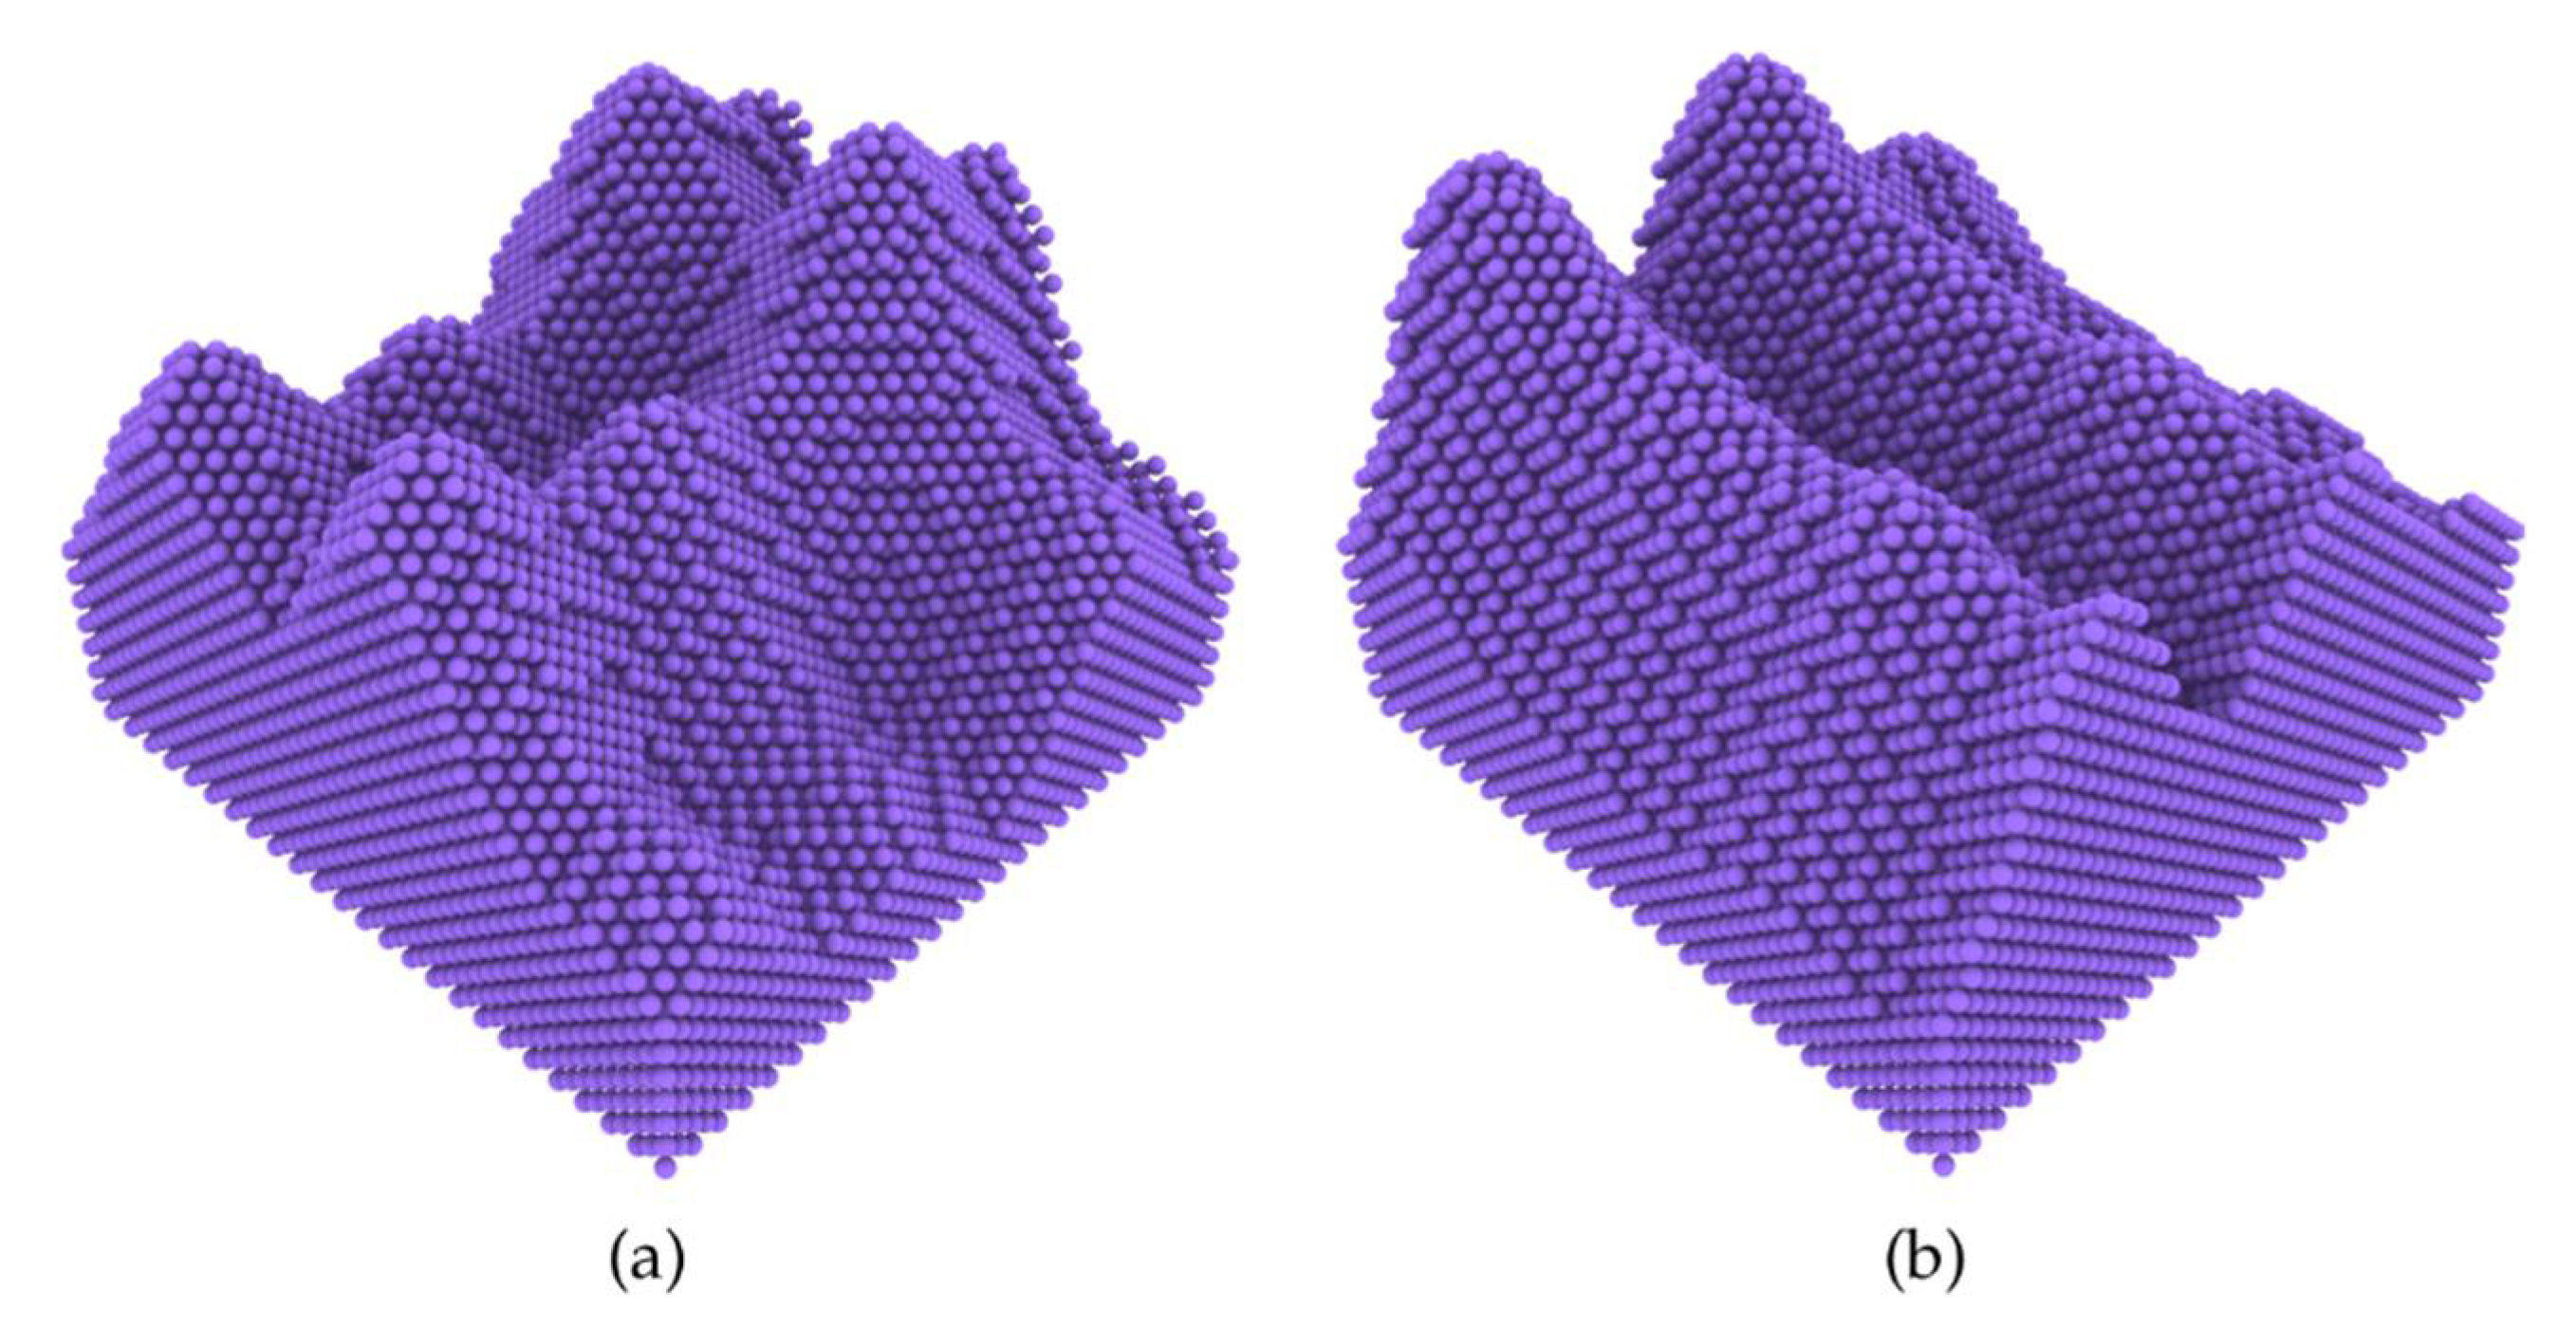
2.1. Large-Scale Atomistic Modeling and MD Simulation of Nanoscale Ice Adhesion

The main aim of the modeling and simulation is to provide a sufficiently large amount of ice adhesion data for successive ML training. Ice can exist in many different phases, but this study will only focus on one phase, hexagonal ice (Ih), due to its ubiquity in the biosphere. In order to generate a large dataset with limited computational resources, we chose the well-calibrated coarse-grained water model mW for both liquid water and solid ice [9,26,27,38,50]. This implies that the 3-atom water molecule is considered to be one single particle with the purpose of increasing the computational efficiency while maintaining all the important thermodynamic properties associated with water, such as the angle-dependent hydrogen bonding between the particles. Molinero and Moore estimate that the mW course graining is 180 times more computationally efficient compared to SPCE [51], a different but widely used all-atom water model. The inter-particle interactions in the mW water model are described by the many-body Stillinger–Weber (SW) potential [52]. The substrate that the ice is adhered to is made from aluminum with an Embedded Atom Model (EAM) interatomic potential for the sake of convenience [53].The interaction between the water/ice and the substrate is treated by the Lennard–Jones (LJ) potential, V L J = 4 ϵ [ ( σ / r ) 12 ( σ / r ) 6 ] , following former studies [9,50], where epsilon (ϵ) is the energy depth of the LJ potential, σ is the LJ radius of the atoms, and r is the pairwise distances between the atoms. For finding different strengths of attraction between the substrate and the water/ice, the energy depth of the LJ potential (epsilon) varies in the range of 0.05~0.2 eV. The higher the epsilon value, the stronger the attraction between the ice and the substrate. It should be noted that by treating the water–substrate interaction with LJ potential, details such as the adhering orientation of water molecules due to hydrogen bonding or other surface polarity are not preserved.
All the substrates have the same surface area on the xy-coordinate plane of 10 × 10 nm2 in the simulation box with an associated roughness. In order to randomly generate rough surfaces, an algorithm was put together taking inspiration from the Fourier series. The Matlab code for the algorithm is provided in the Supplementary Materials. As shown briefly in Figure 1, 5 sine waves with randomly generated amplitudes were added so as to produce a random periodic wave. The algorithm put in place generated 10 random amplitudes—5 for a planar sine wave in the x direction and 5 for the wave in the y direction. The result is a plane which is periodic in both the x and y direction and which can be uniquely described by those 10 parameters. The algorithm is made such that the plane will be 100 × 100 Å2 in x,y and will have a span in z direction that can vary from 10 to 80 Å. As shown in Figure 1b,c, the rough surfaces were carved by the random planes, with the thickness (the z height) ensuring at least a 10 Å base of aluminum atoms and maximally 80 Å. In order to facilitate comparison, an atomistic flat surface was also created. All the substrates are treated as rigid body in this study for the sake of simplicity. The effects of substrate structural deviation or wear in ice adhesion will be subject to future study.
Once the rough surface has been formed, the ice is placed on top, such that the entire system (substrate + ice) forms a 100 × 100 × 100 Å3 cube. The 80 Å max height of the substrate therefore guarantees at least a 20 Å height of ice, which is assumed to be sufficient to maintain the ice crystal structure. Between the ice and substrate is a layer of amorphous water with the purpose of catalyzing the crystallization process. A common practice in literature to prepare ice on a substrate is to place supercooled liquid water with a solid ice seed and let the seed nucleate to equilibrium [11,39,50]. For the sake of modeling efficiency, the amorphous water layer was put in place before the whole system was equilibrated for 5 ns at 250 K. The dynamic evolution of the amorphous water layer in longer equilibration is provided in the Supplementary Materials (Supplementary Figure S1). The simulation systems were set in an NVT ensemble with the Nosé–Hoover coupling method to maintain the simulation temperature [54,55]. A time step of 5 fs was used. Between the amorphous water and the substrate, a small vacuum layer of 2 Å—i.e., sufficiently smaller than the cutoff—was placed to avoid an initial atomic overlapping of water and the substrate.
All the MD simulations were performed using the simulation package LAMMPS [56]. A total of 800 different systems were equilibrated with three different epsilon values each (0.05, 0.1, and 0.2 eV). Thus, in total 2400 systems (800 surfaces and 3 epsilon values) were equilibrated and prepared for probing the ice adhesion strength. The equilibrated systems were then subjected to testing for tensile ice adhesion—namely, by pulling the ice in the z direction. A stationary harmonic spring with a force constant of 5 eV/Å was applied to the center of mass of the top 10 Å layer of ice, while the substrate moved in the z direction away from the ice with a speed of 2 nm/ns. The restraining force therefore increases until the ice detaches from the surface. The ice adhesion strength is taken to be the maximum measured force (Fmax) by the spring at the moment of ice–substrate detachment, divided by the apparent contact area (Aapparent = 100 nm2). It worth noting here that the Fmax depends on the moving speed of substrate, as ice adhesion testing results in one representative rough surface, as shown in Figure S2 in the Supplementary Materials. In order to compare all the ice adhesion strengths on different rough surfaces, all the substrates were moved at the same speed of 2 nm/ns in all the simulations. Ten independent runs were performed for ice adhesion in each system (in total, 24,000 ice adhesion testing simulations). The ice adhesion strength for a given system is taken to be the average of these 10 runs. It should be noted that both the tensile strength and shearing at the atomistic level are relevant to macroscopic ice adhesion. The atomic separation of ice from its substrate, feature tensile separation, is an important event in de-icing experiments. Such a process is captured in the simulations. More simulation resources are required for the accumulation of more ice adhesion data, such as shearing, for improving the accuracy of ML in intrinsic ice adhesion.

2.2. ML on Nanoscale Ice Adhesion on Rough Surfaces

There are two main ways in which ML can predict ice adhesion: regression and classification [57]. A regression will let the user give data about the substrate and in return receive a quantitative prediction of the adhesion strength. This is useful, as it lets the user bypass the timely simulation, but will inherently cause a bias towards the mean, and thus could be particularly bad at predicting extreme cases, such as very strong adhesion or very weak adhesion. A classification will rather let the user give data about the substrate and in return the algorithm will attempt to place the substrate in one of N predefined classes based on the adhesion. Although this does not quantitatively predict the ice adhesion strength, the model can be used to tell if substrates are likely to show a particularly strong or weak adhesion. Thus, both classification and regression are useful tools in their own ways.
All the ML experiments on the nanoscale ice adhesion strength data were carried out using the Statistics and Machine Learning Toolbox in MATLAB [58]. For regression, a Support Vector Machine (SVM) with a ten-fold cross validation was applied [59]. The SVM received thirteen input parameters—namely, the 10 amplitudes of the planar sine wave functions in creating the substrate, plus three additional parameters: the height difference on the substrate, the maximum curvature, and the minimum curvature. These latter three parameters do not hold any more information compared to the first ten, but are direct consequences of the substrate roughness and can help the learning machine. Six different SVM kernels were applied to predict the tensile ice adhesion strength—namely, Linear, Quadratic, Cubic, Fine Gaussian, Medium Gaussian, and Coarse Gaussian, as details in Table 1. For the classification, the ice adhesion data were divided into tertiles (three equally big sets) based on the ice adhesion strength. The rationale behind this is that, as the roughness is randomly generated, the ice adhesion strengths are taken from a normal distribution. Consequently, there are a lot more datasets with an average performance (the center of the normal distribution) and an underrepresentation of surfaces with high and low adhesion strengths. The point of the classification is to find the substrates that are more likely to show a high or low adhesion strength. Dividing the data into three classes—high, low, and average adhesion—should be a good option, because it maintains a good representation of the data while still keeping a relatively high amount of training data. This data pre-classification into tertiles is an initial random guess with a prediction accuracy of 33.33% intrinsically, which will serve as a benchmark for the classification performance.

3. Results and Discussion

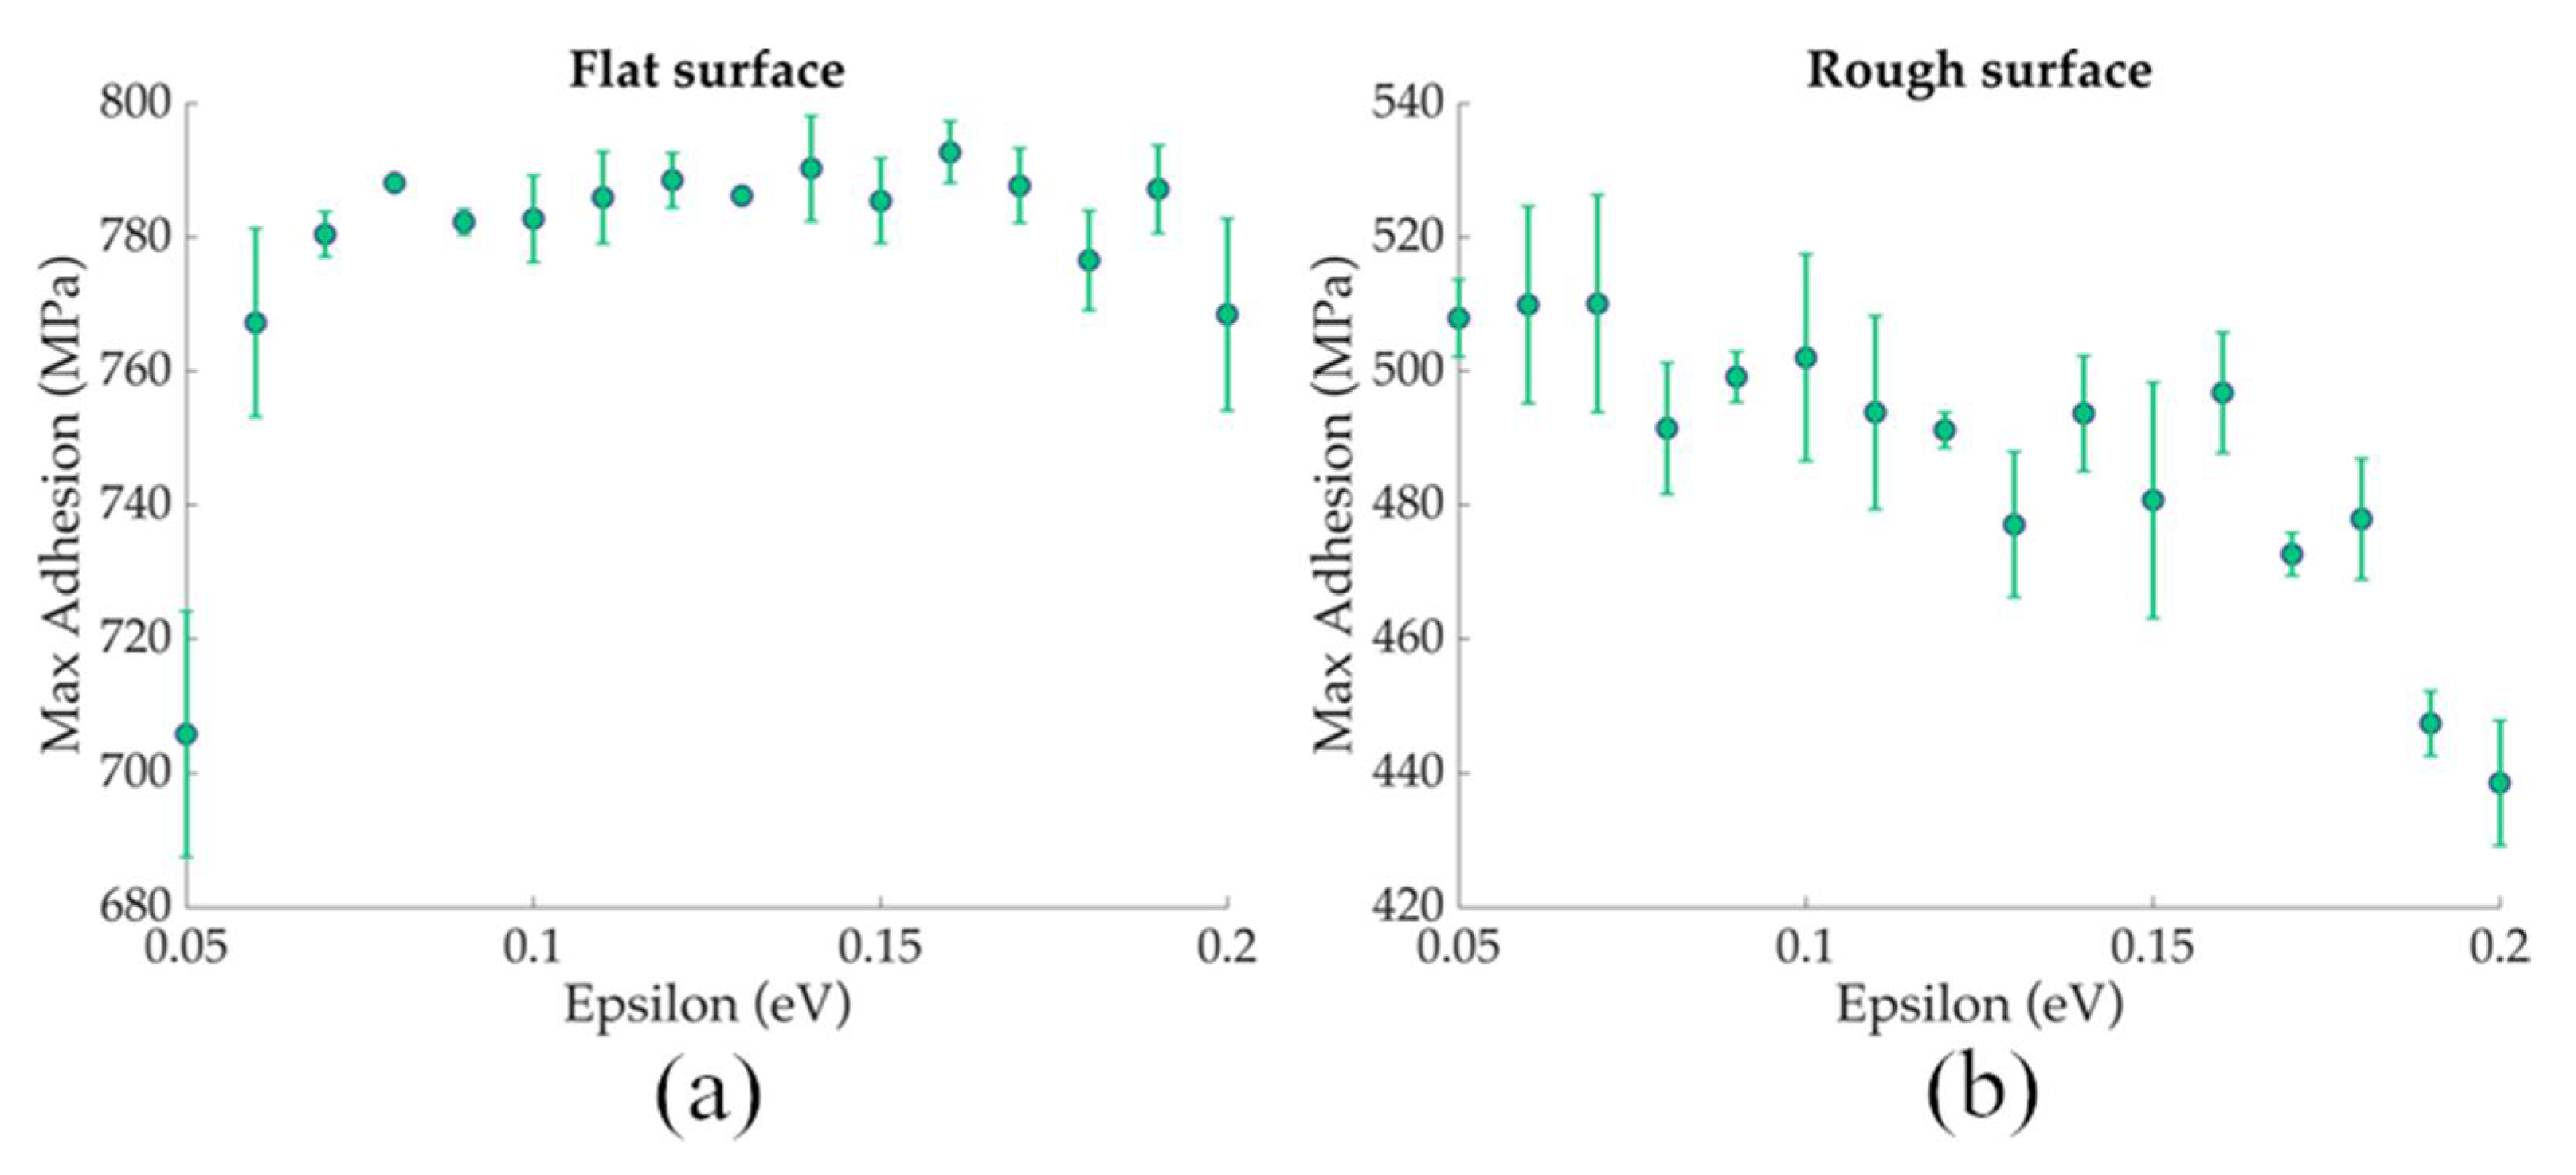
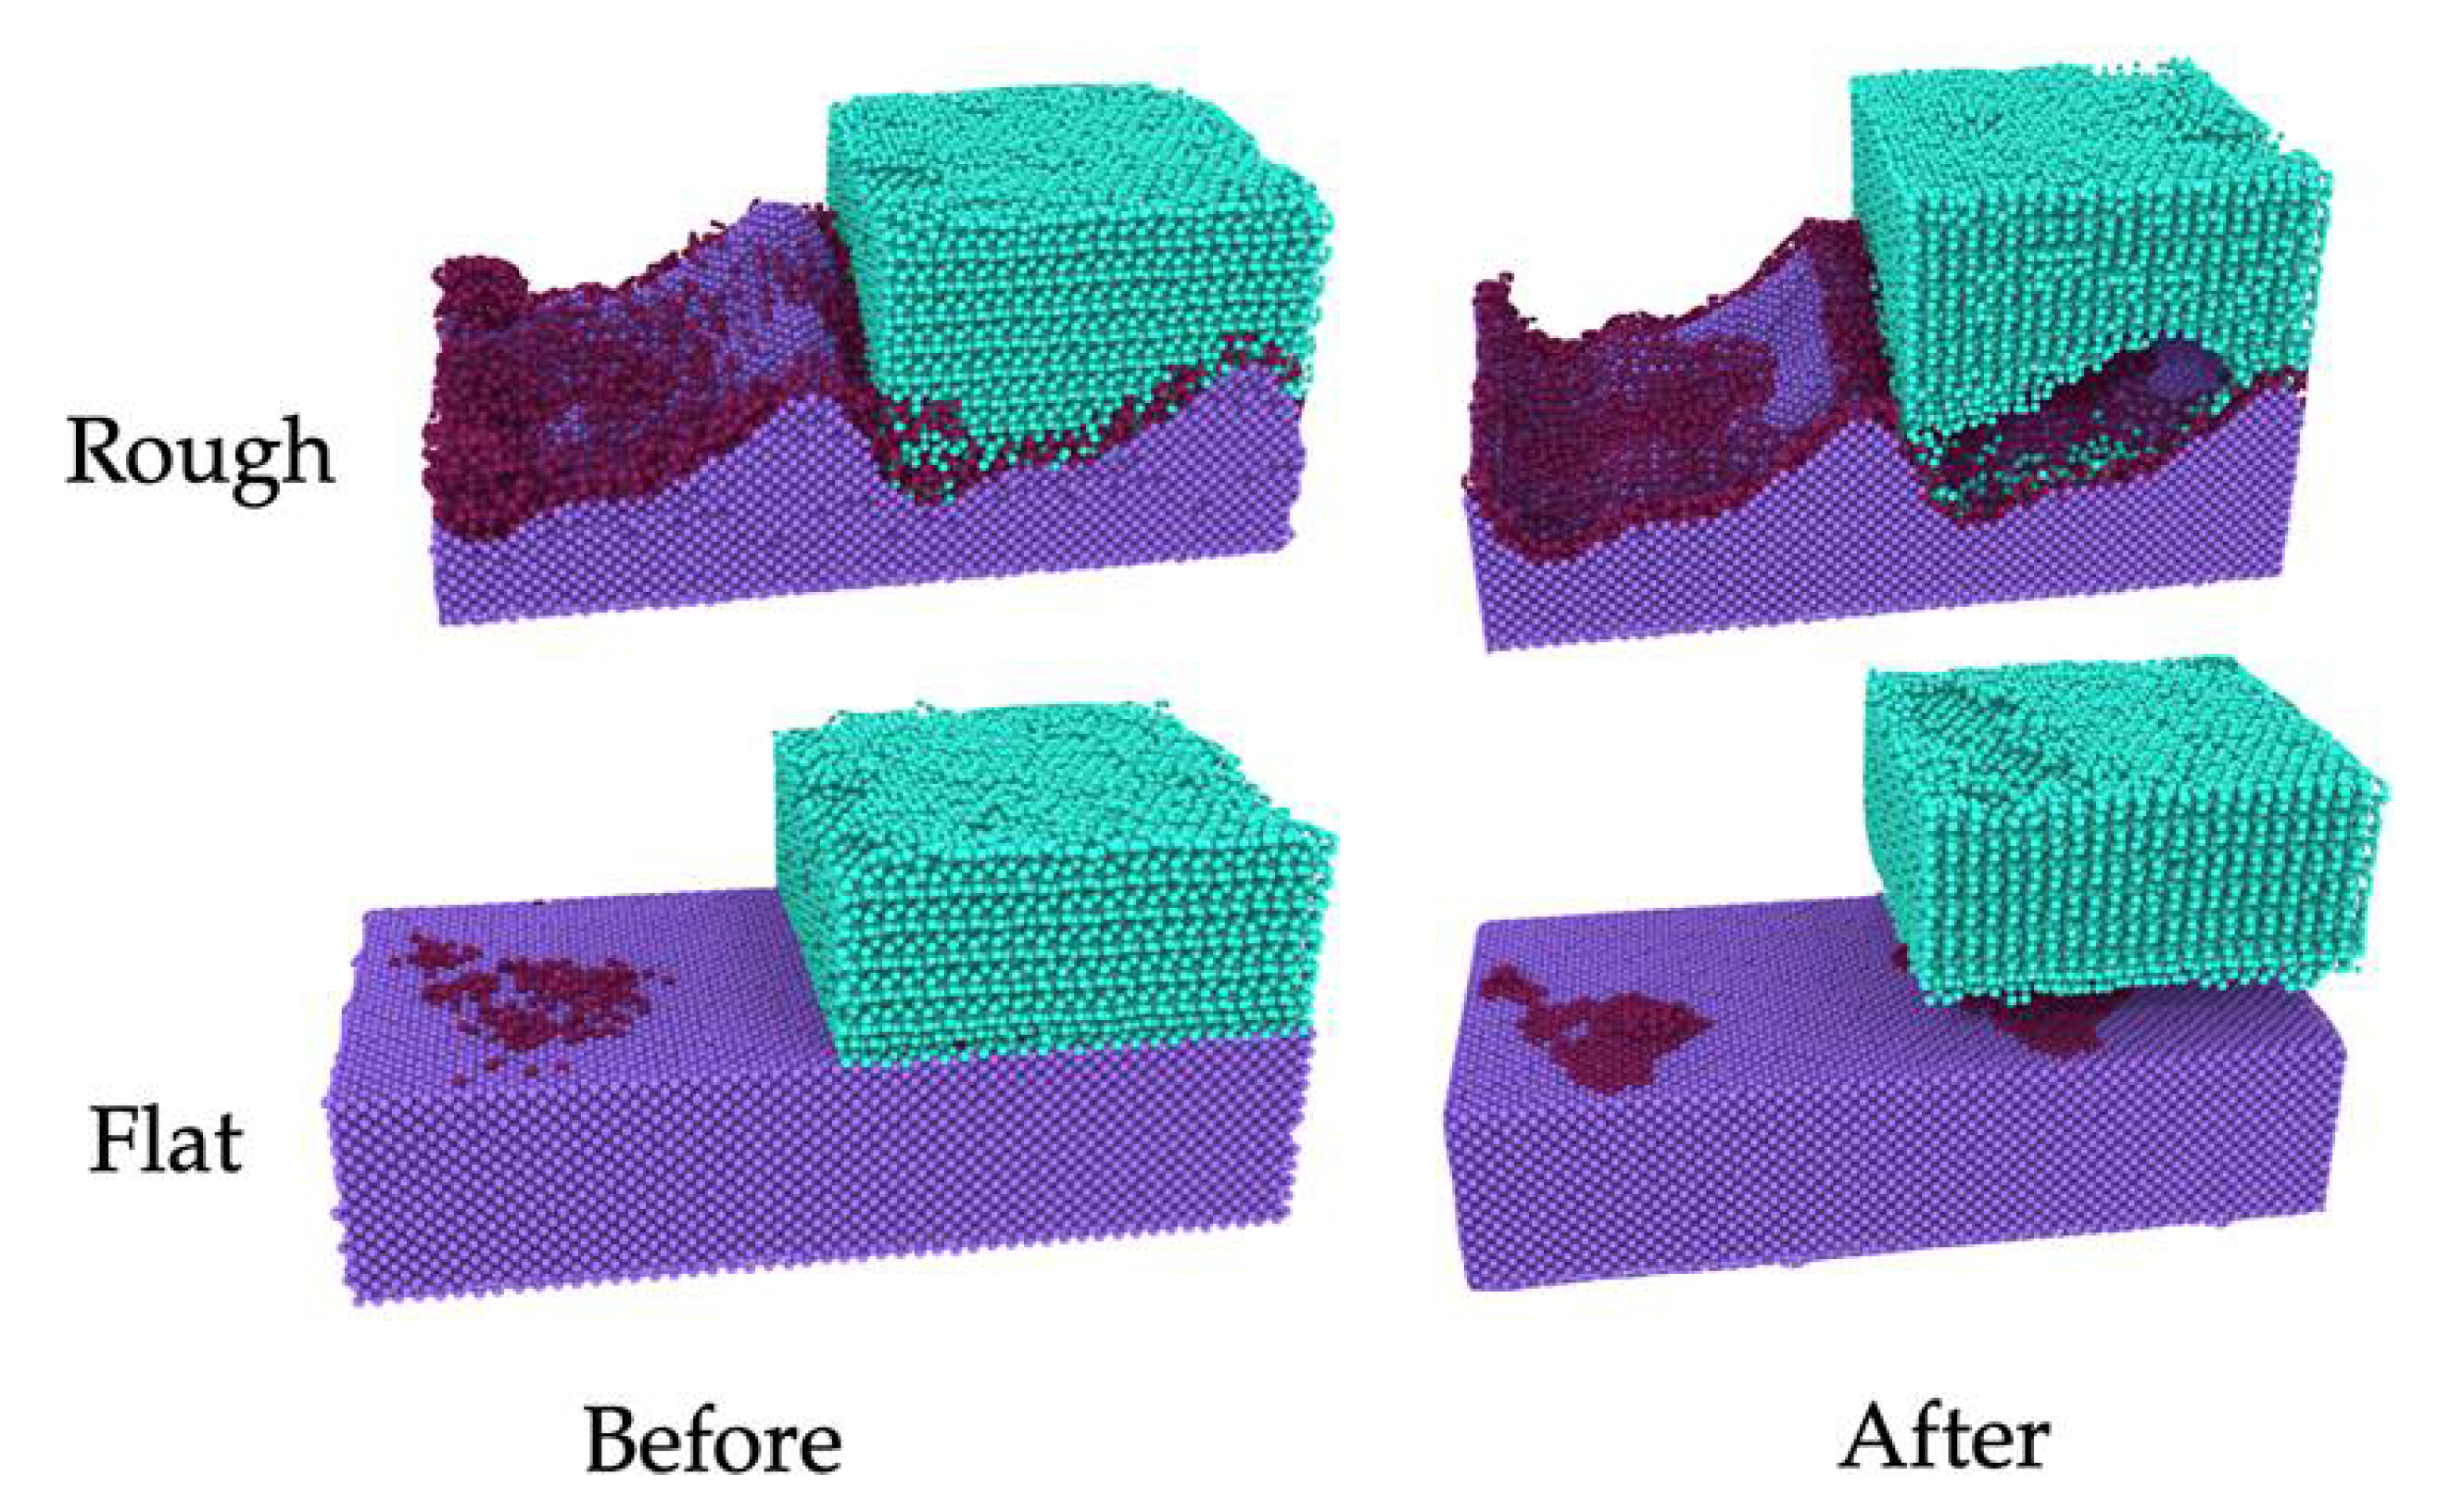
3.1. Nanoscale Ice Adhesion on Rough Surfaces

Nanoscale surface roughness affects the ice/water structure adjacent to the substrate [9,60] and thus strongly affects the local ice adhesion strength. In order to elucidate the effect of nanoscale roughness on the ice adhesion, one extra flat and one representative rough substrate directly contacting ice without an amorphous interfacial water layer were prepared using various values of epsilon ranging from 0.05 to 0.2 eV. As shown in Figure 2, the nanoscale ice adhesion strengths monitored on the flat substrate were higher than those on the rough surfaces at different epsilon values. Interestingly, the ice adhesion strength on the flat surface increased with the epsilon value up to stable range (Figure 2a). In contrast, the ice adhesion strength on the rough surface decreased with increasing epsilon (Figure 2b). At the high epsilon value of 0.2 eV, the ice adhesion strength on the rough surface was almost 50% lower than that on the flat surface.
In order to understand the differences in ice adhesion strength between flat and rough surfaces, the atomistic structure of the ice–substrate interfacial region in equilibrium was further dissected and compared. As examples of substrates with the same epsilon value of 0.05 eV, shown in Figure 3, the interfacial regions are dramatically different between the two substrates. Specifically, there were many more amorphous water molecules at the ice–substrate interface after the equilibration simulation on the rough surface. The nanoscale roughness served as concave pores, restricting the stable ice structure, which agreed with former results showing that a nanoscale confinement space (also roughness) melted ice structures [9]. The high amount of interfacial amorphous water on the rough surface can act as a lubricant, facilitating the easy sliding of the ice along the uphill slopes of the surface under tension stress. The effect of the interfacial amorphous water is thus reminiscent of the so-called interfacial slippage effect for the mobility of ice [44,61]. Surprisingly, the amount of amorphous water increases with the ice–substrate LJ potential energy depth epsilon, as observed on the rough surface systems and verified by the long equilibration time shown in Figure S1. Individual water molecules close to the ice–substrate interface can join into an ordered hydrogen bonding network or remain in an amorphous structure, depending on the interplay between their interaction strength with the substrate and the hydrogen bonding energy with other water molecules. A strong attraction between water molecules and the substrate can result in high stress to destabilize the ordered hydrogen bonding among the ice molecules close to the interface. The higher the epsilon value, the more obvious the lubrication effect by the amorphous water layer, which resulted in a decrease in the ice adhesion strength with an increase in the epsilon value on rough surfaces. Such a phenomenon was not observed on the flat surface. Thus, the lubrication effect of the amorphous water layer was an important disrupting factor for reducing the ice adhesion strength, while a higher epsilon value enhanced the effect by increasing the amorphous layer thickness, resulting in significantly lower ice adhesion compared to the results obtained on the flat surface.
The nanoscale surface roughness also altered the rupture mode of ice adhesion [24] and subsequently changed the ice adhesion strength. Compared to ice on the flat surface with perfect contact, the ice adhered on the rough surfaces had an uneven distribution of local interfacial structures owing to the corners and curvature of the roughness landscape [60]. The heterogenous local structure of the ice adhesion interface led to an uneven load distribution when the ice was under external tensile stress, resulting in high degree of stress concentration and fracture singularity points [23]. The surface roughness also altered the surface de-icing process—namely ice was detached in a sudden concurrent manner from the flat surfaces but was sequentially slipped/glided uphill along the steep parts on the rough surface. The sequential rupture mode of de-icing on the rough surfaces is effective in reducing atomistic ice adhesion strength, as was observed in former studies [24].
The above results therefore present a rather counterintuitive conclusion: in order to make enable low intrinsic ice adhesion, the pairwise attraction between the surface and ice should be high, and the surface should be rough. It is important to note that all the surfaces in this study are at the nanoscale (10 × 10 nm2) and the ice adhesion of focus is intrinsic adhesion (Figure 1), which is different from the so-called macroscopic mechanical locking that enhances ice adhesion in experiments [8,63]. For a higher roughness scale in experiments, other strategies for the generation of lubrication are needed [44].
The complex parameters (10 sine wave functions) of each rough surface are difficult for direct visualizing the ice adhesion strength on each surface. For illustrating the trend of ice adhesion strength on the surfaces, the random roughness of the surfaces was summarized by two key quantities—namely, the total height difference (highest point on the surface minus the lowest point) and the highest curvature (the most negative second derivative of the landscape) across each surface. As the ice adhesion strength on each surface was plotted against these two quantities shown in Figure 4, there were clear correlations between the ice adhesion strength and the surface roughness. The higher the surface curvature and height difference, the lower the ice adhesion strength on the rough surfaces. However, the large variation in the data indicates that other parameters also contribute to the ice adhesion strength and still need to be explored by ML.

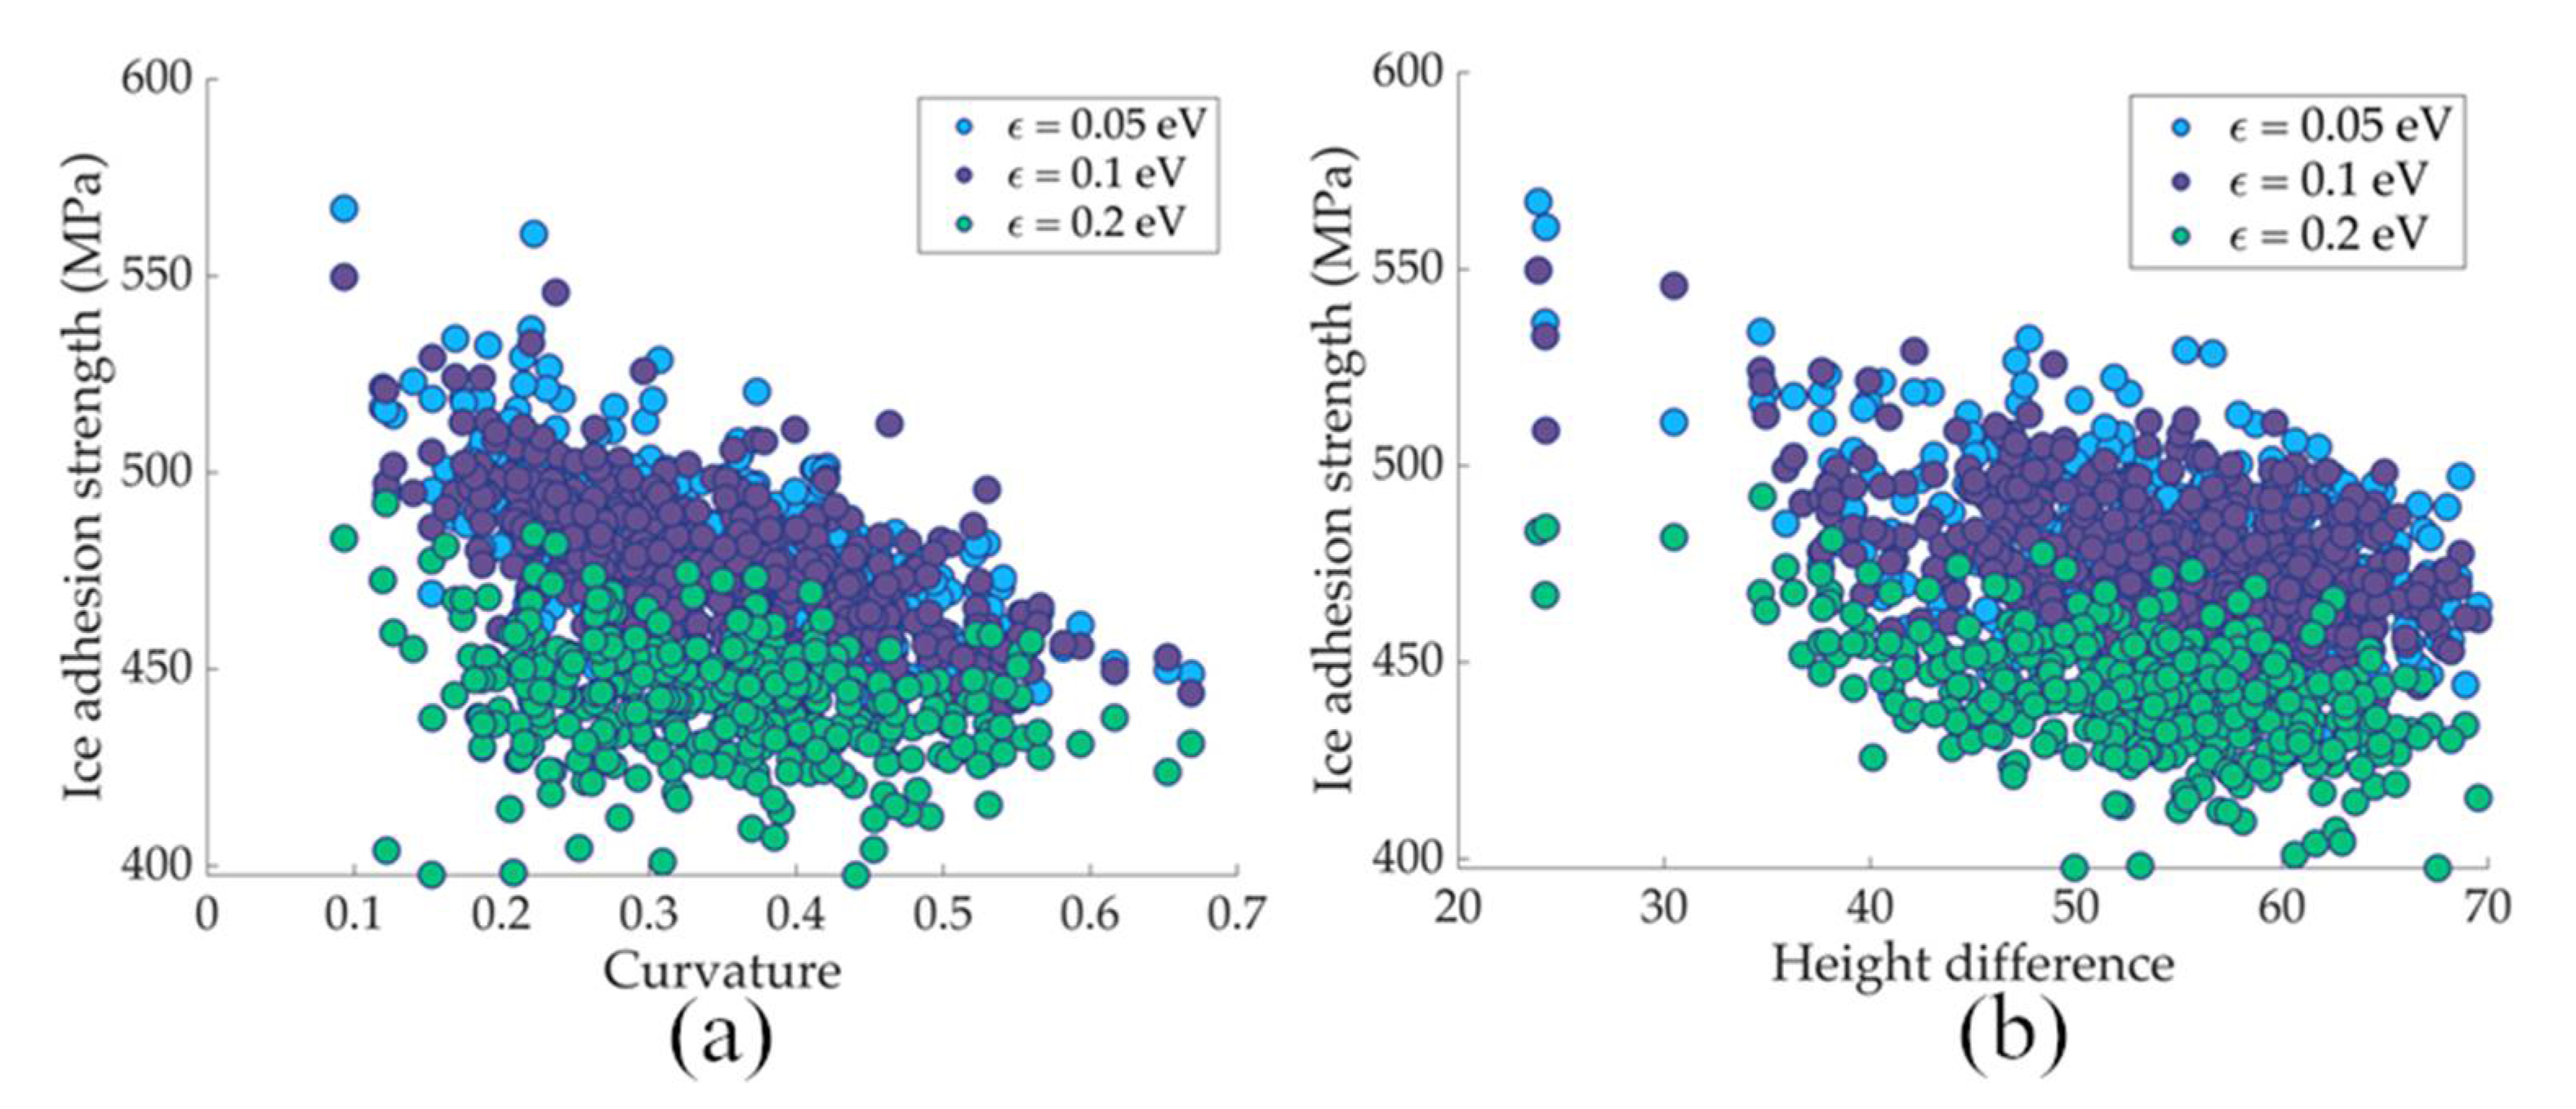
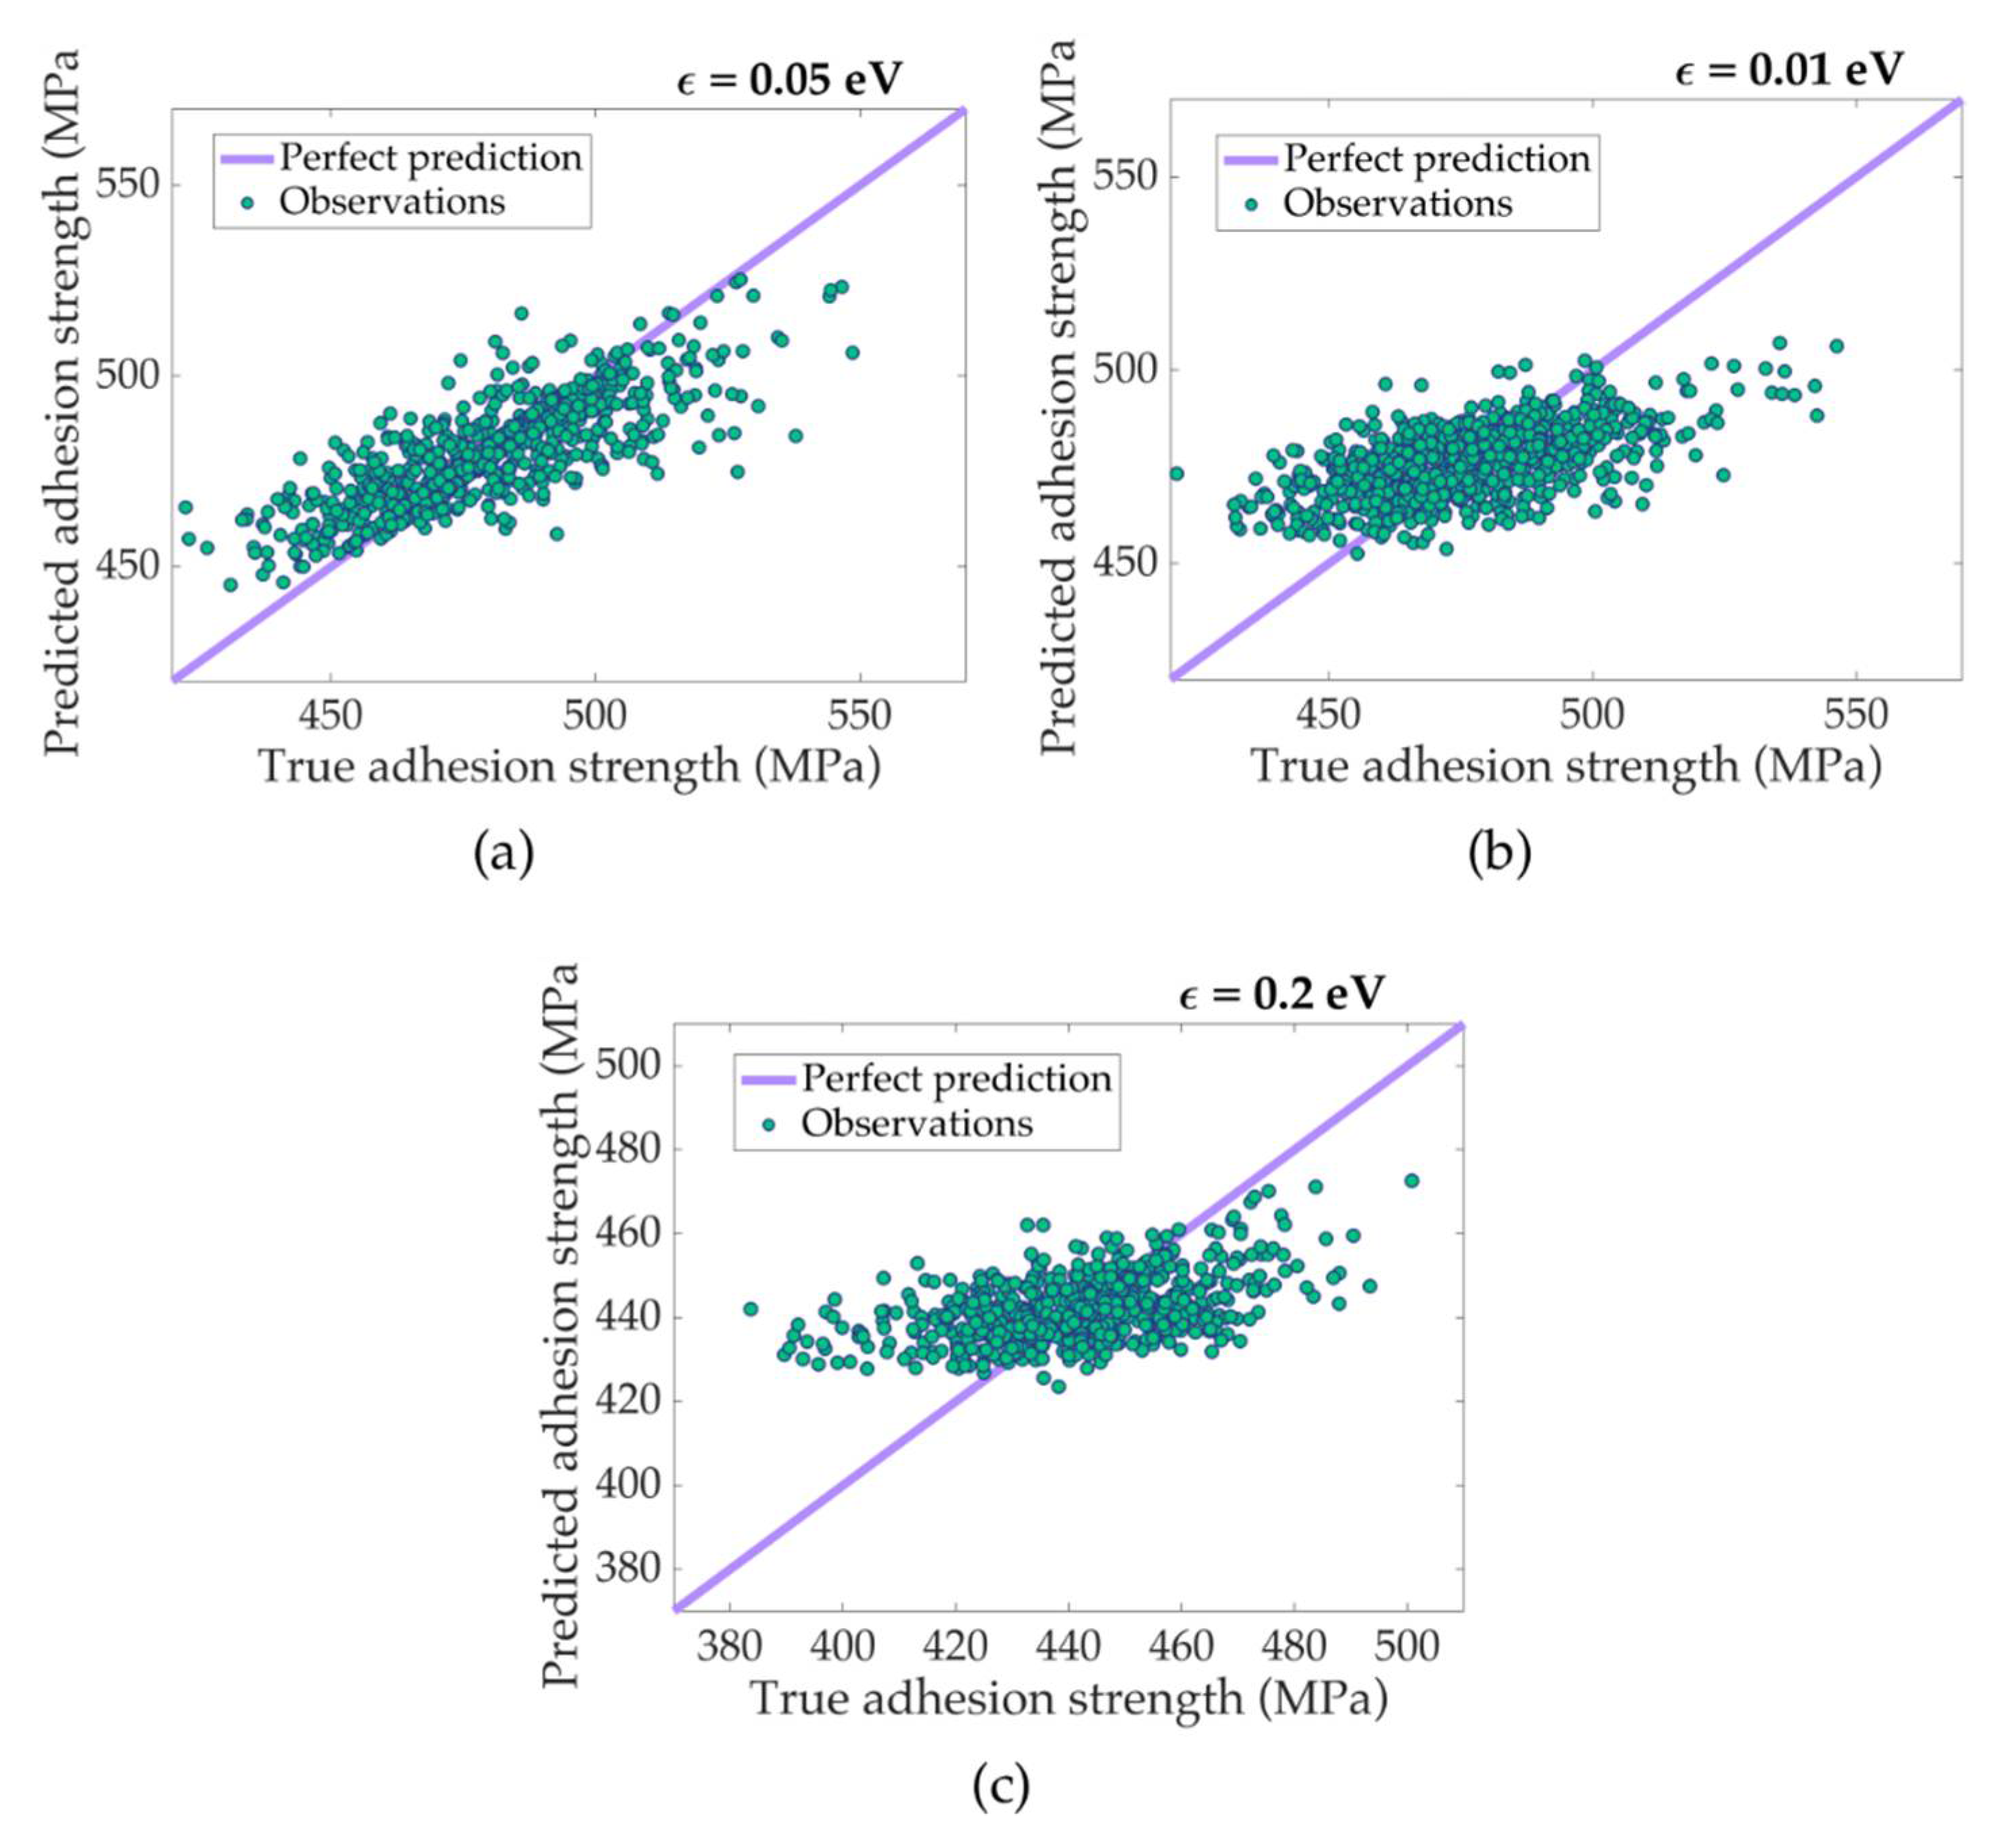
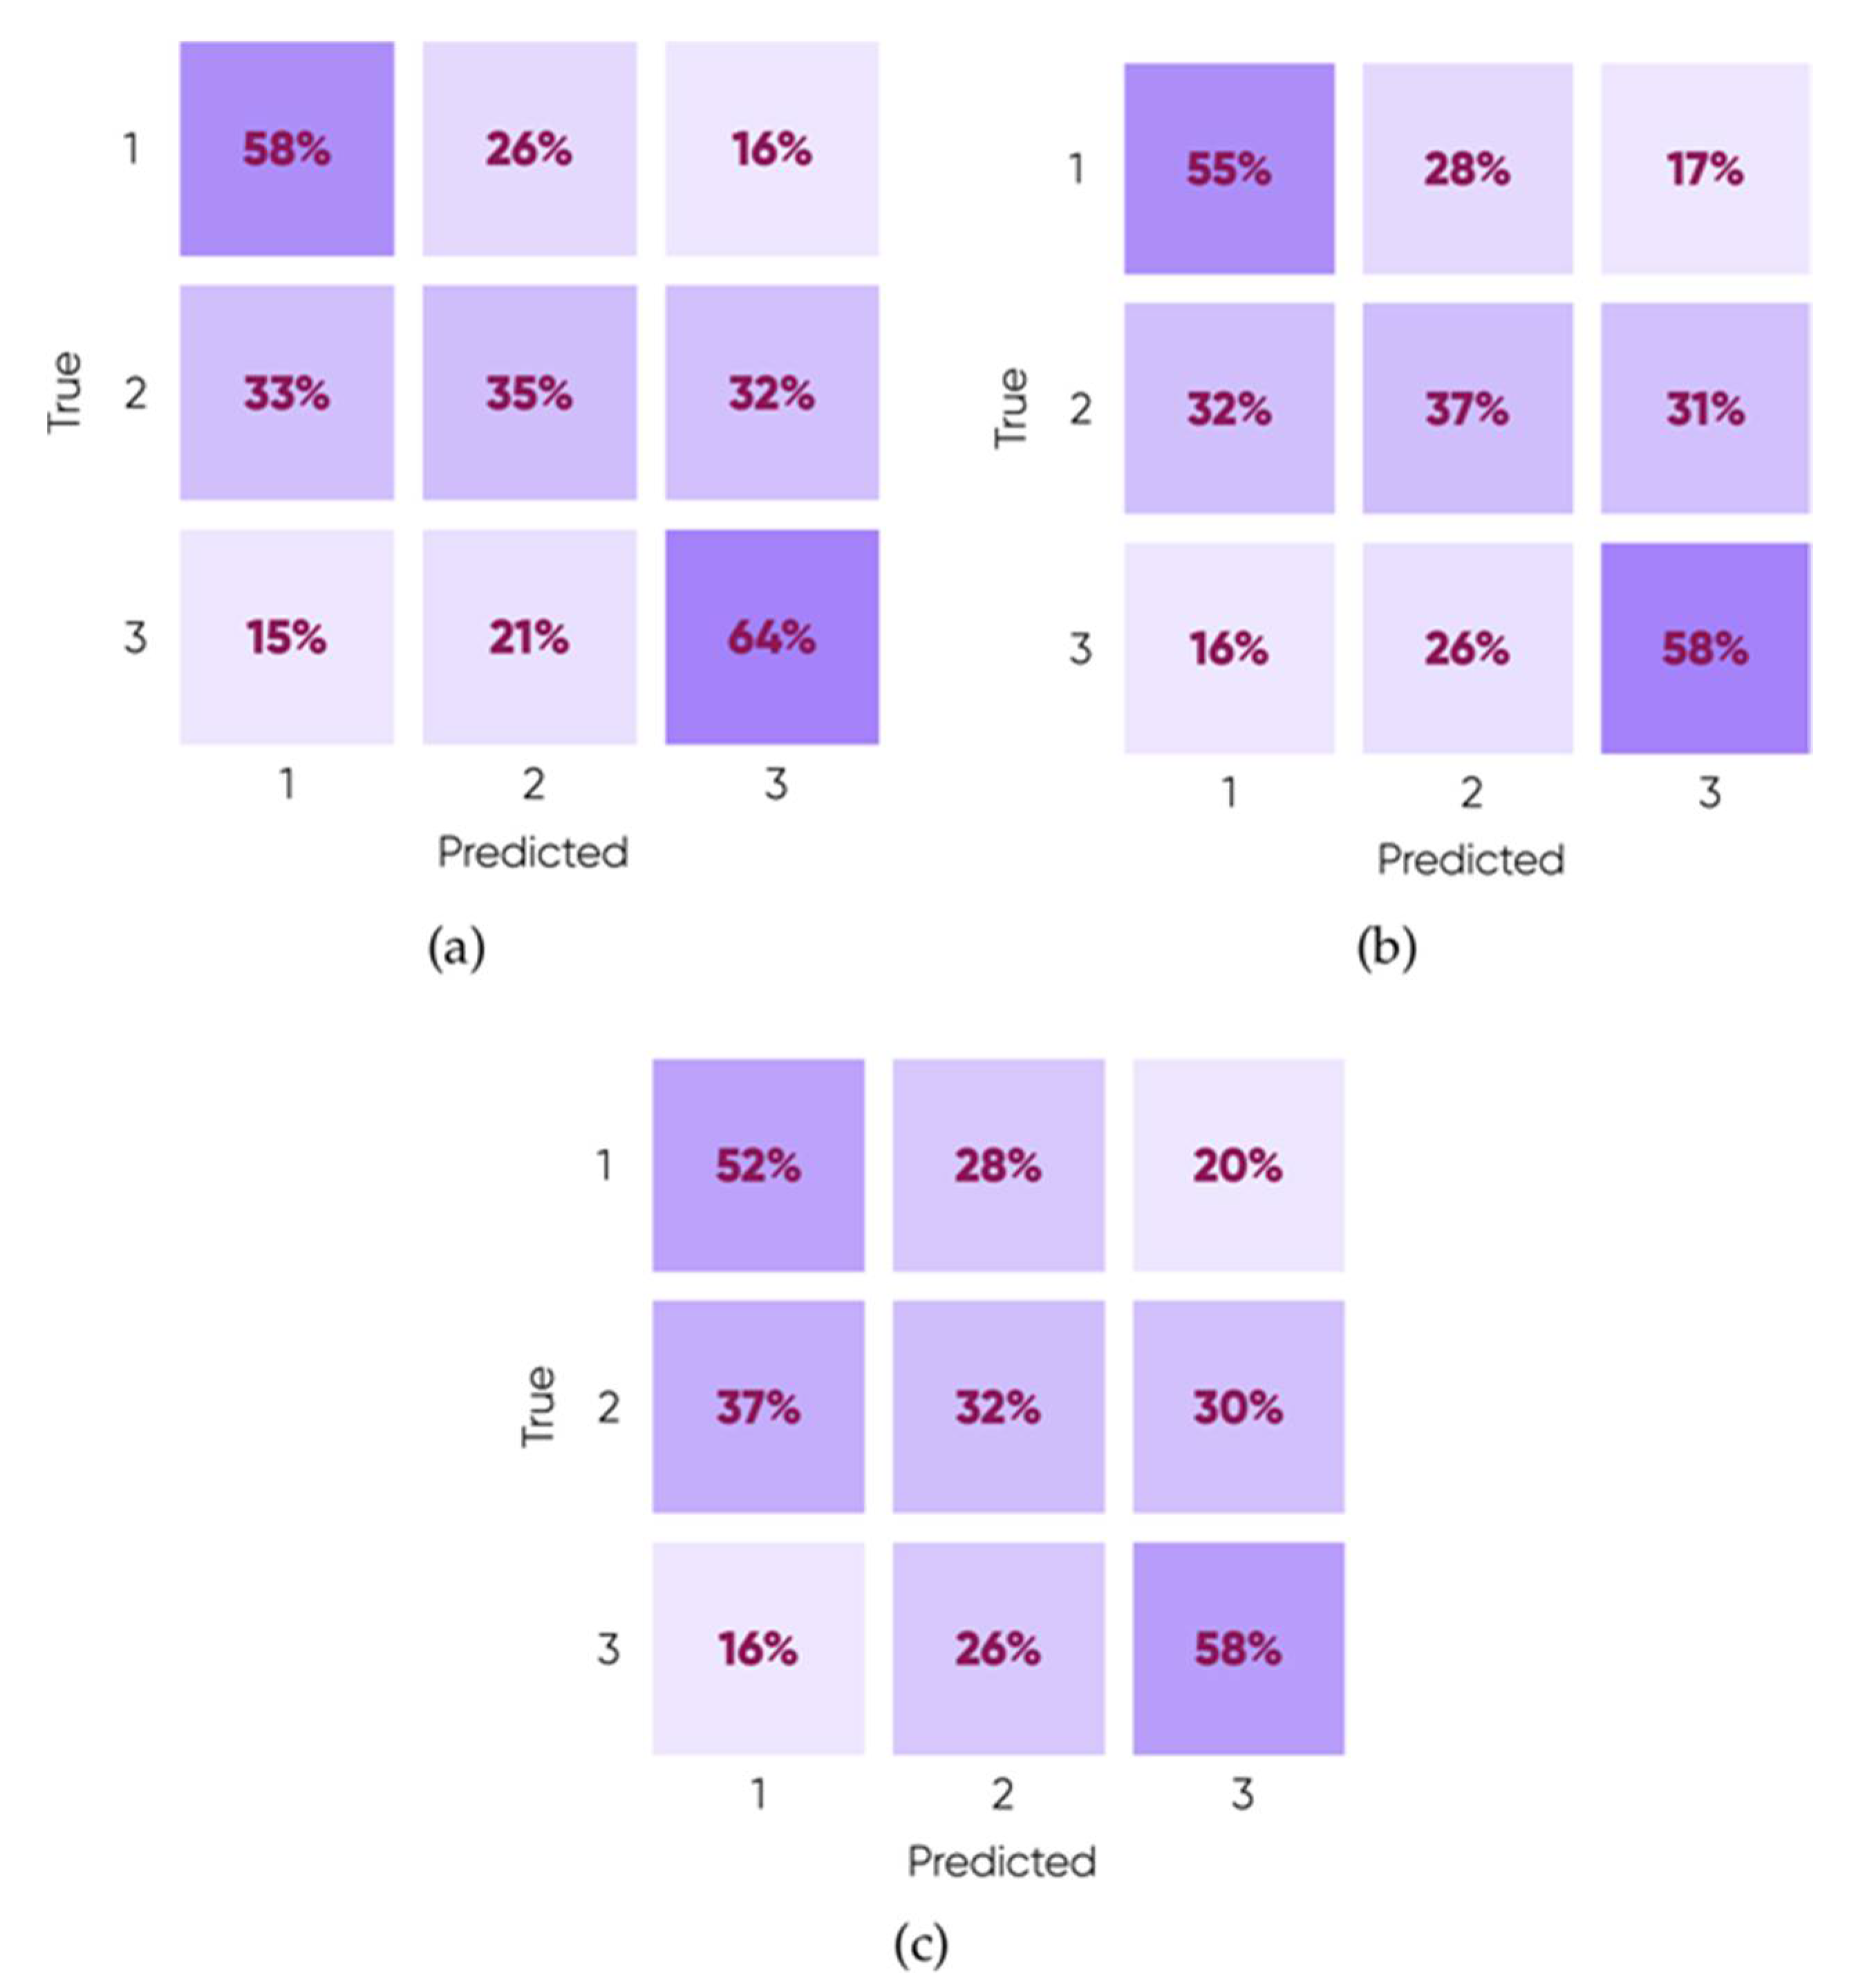
3.2. ML Prediction of Nanoscale Ice Adhesion

As can be seen in Figure 4, there are visible differences in ice adhesion strengths between surfaces with different values of epsilon, and as such the SVM was trained individually for the three epsilon values. The SVMs were then used to predict and classify the tensile ice adhesion strength on rough surfaces.
There were large deviations in the ice adhesion strength values observed on surfaces with the three epsilon values. In order to evaluate the performance of the SVM regression, the root mean square error (RMSE) [64] and the R2 (or R-squared) [65] values of the predictions are presented in Table 1. Generally, the SVM did show mild but better predictions than purely treating the ice adhesion as random numbers in a normal distribution (SVM with Fine Gaussian kernel) around the mean value, judging by the RMSE values. Taking surfaces with an epsilon value of 0.05 eV for example, the best performing SVM (with Medium Gaussian) had an RMSE of 16.86 MPa, which featured an improvement from Fine Gaussian (RMSE of 20.81 MPa). The same improvement was also observed in the ice adhesion data from surfaces with the other two epsilon values. Thus, the SVM indeed had a positive prediction power despite the large space of the 13 input parameters. The R2 values also support such a conclusion. While the Fine Gaussian kernel yielded an R2 value of 0 (or close to 0), other kernels had higher values (Table 1).
For illustrating the performance of the SVM, the ice adhesion results for surfaces with three epsilon values were compared with the ML prediction purely based on the roughness parameters. As shown in Figure 5, the prediction of ice adhesion strength on surfaces with the three epsilon values (purple line in Figure 5) agreed with the mean values observed for ice adhesion strength obtained in the MD simulations (green circles in Figure 5). Because there are more data close to the mean values observed in the MD simulations, it is easy for ML to accurately predict the average ice adhesion (also meaning the “average” performing surface). However, there are substantial prediction errors in the data away from the average, especially on the extremities of the observed data, given that these are represented by fewer data points and are thus of a lower accuracy. Interestingly, the SVM predicted better results on surfaces with an epsilon value of 0.05 eV than the other two counterpart surfaces. Although the ice adhesion strength values obtained in the MD simulations were similar in magnitude on surfaces with epsilon of 0.05 and 0.1 eV (Figure 4), prediction on surfaces with epsilon of 0.01 eV showed significantly higher error. The predictions on surfaces with epsilon of 0.2 eV were the worst. Considering the atomistic structure of the ice-substrate interface (Figure 2 and Figure 3), the performance of the SVM could have been affected by the quasi-liquid layer of the interfacial water in the simulation systems. Because the SVM only used the 13 surface roughness parameters and did not consider the confounding factor of the quasi-liquid water on the surfaces, the prediction is thus missing the interfacial lubricating effect discussed above. As surfaces with epsilon value of 0.2 eV produce the thickest quasi-liquid layer, it is reasonable that the resulting prediction were the worst of the three. Although the predictions are far from perfect, the SVM did have the power of giving positive results, especially on rough surface with an epsilon value of 0.05 eV (meaning low surface energy). Furthermore, there is reasonable chance that the performance increases with the amount of training data.
The SVM with Medium Gaussian Kernel performed best on predicting ice adhesion on surfaces with an epsilon value of 0.05 eV (Table 1). In order to gain insight into the prediction, a separate dataset of 5000 surfaces was generated using the same algorithm as given in the methods section. The SVM was asked to predict the ice adhesion strength on these new surfaces without carrying out any MD simulations. As shown in Figure 6, the SVM identified the surfaces with the highest and the lowest ice adhesion, respectively, by ML prediction without performing MD simulations. The predicted lowest surface had an ice adhesion strength of 409 MPa, with a very distinct roughness only in one dimension (Figure 6b), while the highest surface had an ice adhesion strength of 568 MPa, with both roughness on two dimensions (Figure 6a). It should be noted that more training data and verification by MD simulations are needed in the next step of this study.
Because of the high deviations in the ice adhesion strength data and the resulting high errors in ML prediction, it is thus also meaningful to use ML to qualitatively classify rough substrates with a high or weak ice adhesion. As given in the methods section, the data from MD simulations were randomly discretized into three tiers, or tertiles, based on the ice adhesion strength. Class 1 means the data were part of the 1/3 of data showing the lowest ice adhesion strength, while Class 3 means it is the other 1/3 of data showing the highest adhesion, and 2 then means it is in the middle. The reason for the data grouping is that there are too many data points close to the mean value (Figure 4 and Figure 5). It is challenging for the SVM to only be trained by the data close to the mean value for the prediction of high or low ice adhesion surfaces. By dividing the training data into the three groups, the SVM was therefore trained to look for the features characterizing the more extreme cases (high or low ice adhesion). It should be noted that the initial data discretization means that an accuracy of at least 33.3% is to be expected, as a random guess would give this accuracy.
The SVM showed positive results in classifying surfaces by their ice adhesion strength. As given in Table 2, the SVM with all the six kernels gave a classification accuracy higher than just random guessing (33%). It is further interesting to see that the SVM was again more accurate on classifying rough surfaces with epsilon value of 0.05 eV. The interfacial quasi-liquid water layer again could have affected the classification results.
The classification power of the SVM can be illustrated by a color-coded confusion matrix, as shown in Figure 7. The intensity of the color in the confusion matrix increases with the prediction accuracy. Taking the classification of surfaces with an epsilon value of 0.05 eV for example (Figure 7a), if a surface has a high ice adhesion strength (class 3) the SVM has a 64% certainty of correctly identifying it. The certainty is double the chance of random guessing, which is highly desirable. For surfaces with an epsilon value of 0.1 and 0.2 eV, the SVM gave a certainty of 58% for identifying high ice adhesion surfaces, both of which were also better than random guessing. The SVM also had a high classification certainty on surfaces with a low ice adhesion strength (class 1), showing promising prediction results. For surfaces with an average performance (class 2), the SVM did not show a prediction strength better than a random guess. Thus, the SVM is specialized for predicting obvious good or bad icephobic surfaces. Its prediction performance is expected to further improve with more training data in the future steps of this work.
The results from both the regression and classification indicated that there were substantial potentials of machine learning applied in the anti-icing materials research field. If not for the actual prediction of the adhesion strength, then as a preliminary test to assess the performance of a substrate before being rigorously tested in a simulation environment or indeed a lab environment, the ML prediction of intrinsic ice adhesion should have a great impact on anti-icing surface research. With the accumulation of more data and examples of ML, the prediction accuracy can be further improved and could serve as the initial step of forming a multiscale prediction framework for ice adhesion on different surfaces.
It is worth noting that the random rough surfaces created by 10 sine wave functions in this study were far from the real diversity in the roughness of any anti-icing surfaces in the experiments. Nevertheless, the approach here—namely, combining atomistic modeling, MD simulations, and ML—sheds light on the rational prediction of intrinsic ice adhesion. With the correct nanoscale roughness parameters, the ML used in this work should be able to suggest low or high ice adhesion surfaces, such as those given in Figure 6, or classify the surfaces into groups with good or bad performances (Figure 7). There are also many well-defined rough surfaces in nanomaterials nowadays, especially on different nano-devices. The atomistic approach of this study is also appropriate for investigating the ice adhesion on such surfaces. Specially, nanoscale roughness or confinement could allow the existence of another ice form. The adhesion of different ice forms can be another factor to consider in the relevant future studies. The purpose of the ML in this study still served in a limited scope of a first attempt for surface icephobicity prediction only. Further efforts are needed for a better ML-based prediction of ice adhesion on rough surfaces.

4. Conclusions

A systematic study of nanoscale ice adhesion was performed with the purpose of clarifying how the roughness of a surface determines the resulting adhesion. Using MD simulation, a flat surface was compared to a rough surface and it was found that an increase in the pairwise attraction between the surface and the ice yields a higher ice adhesion strength for a flat surface, whilst for a rough surface the adhesion decreases due to an increase in the quasi-liquid water layer. The large-scale MD simulation results were subjected to ML for quantitatively and qualitatively analyzing the surface roughness effects on ice adhesion and, for the first time, probing the possibility of predicting the surface ice adhesion with ML. The SVM, by regression and classification, showed favorable and encouraging prediction results, which can innovate subsequent steps in related icephobic surface design studies. Designing better anti-icing surfaces is crucially important to many aspects of society, which is filled with unanswered yet important questions today. This work has suggested answers to many of these, especially relating to the nanoscale roughness, the quasi-liquid layer, and to what extent a computer can learn about icephobicity. The scope of atomistic modeling and ML is at the nanoscale for intrinsic ice adhesion, which is an essential part of the multiscale ice adhesion prediction strategy. Due to the limitation in the length of atomistic modeling, important surface properties such as contamination, voids, and defects are not considered in this study, which should be included in the nest step of this work. Despite the many remaining questions, this work provides a roadmap for training computers to predict icephobic materials.

Supplementary Materials

The following are available online at https://www.mdpi.com/2079-6412/11/1/33/s1: Figure S1: percentage of water molecules in an ice structure on a representative rough surface with different interaction strengths in an equilibration simulation; Figure S2: ice adhesion strength monitored on a representative rough surface with different moving speeds of the surface (loading rate), Matlab code for generating random surfaces.

Author Contributions

Conceptualization, S.X., S.R. and Z.Z.; methodology, S.X. and S.R.; software, S.R. and S.X.; validation, S.R., S.X. and Z.Z.; formal analysis, S.R. and S.X.; data curation, S.R.; writing—original draft preparation, S.R., S.X., J.H. and Z.Z.; writing—review and editing, S.R., S.X., J.H. and Z.Z.; visualization, S.R.; supervision, S.X. and Z.Z. All authors have read and agreed to the published version of the manuscript.

Funding

This research was funded by The Research Council of Norway, grant number 250990 (Towards Design of Super-Low Ice Adhesion Surfaces, SLICE) and 255507 (Durable Arctic Icephobic Materials, AIM).

Institutional Review Board Statement

Not applicable.

Informed Consent Statement

Not applicable.

Data Availability Statement

Not applicable.

Acknowledgments

The Research Council of Norway is acknowledged for the support of this study. The computational resources were provided by the Norwegian Metacenter for Computational Science (NOTUR NN9110 and NN9391K).

Conflicts of Interest

The authors declare no conflict of interest. The funders had no role in the design of the study; in the collection, analysis, or interpretation of data; in the writing of the manuscript; or in the decision to publish the results.

References

  1. Bao, L.; Huang, Z.; Priezjev, N.V.; Chen, S.; Luo, K.; Hu, H. A significant reduction of ice adhesion on nanostructured surfaces that consist of an array of single-walled carbon nanotubes: A molecular dynamics simulation study. Appl. Surf. Sci. 2018, 437, 202–208. [Google Scholar] [CrossRef]
  2. Grizen, M.; Maitra, T.; Bradley, J.P.; Tiwari, M.K. Nanotextured Aluminum-Based Surfaces with Icephobic Properties. Heat Transf. Eng. 2020, 41, 1663–1672. [Google Scholar] [CrossRef]
  3. Green, S. A Study of U.S. Inflight Icing Accidents and Incidents, 1978 to 2002. In Proceedings of the 44th AIAA Aerospace Sciences Meeting and Exhibit; American Institute of Aeronautics and Astronautics (AIAA), Reno, NV, USA, 9–12 January 2006. [Google Scholar]
  4. Hochart, C.; Fortin, G.; Perron, J.; Ilinca, A. Wind turbine performance under icing conditions. Wind. Energy 2008, 11, 319–333. [Google Scholar] [CrossRef]
  5. Jiménez, A.A.; Márquez, F.P.G.; Moraleda, V.B.; Muñoz, C.Q.G. Linear and nonlinear features and machine learning for wind turbine blade ice detection and diagnosis. Renew. Energy 2019, 132, 1034–1048. [Google Scholar] [CrossRef] [Green Version]
  6. Shen, Y.; Wu, X.; Tao, J.; Zhu, C.; Lai, Y.; Chen, Z. Icephobic materials: Fundamentals, performance evaluation, and applications. Prog. Mater. Sci. 2019, 103, 509–557. [Google Scholar] [CrossRef]
  7. Wang, Y.; Xu, Y.; Su, F. Damage accumulation model of ice detach behavior in ultrasonic de-icing technology. Renew. Energy 2020, 153, 1396–1405. [Google Scholar] [CrossRef]
  8. Meuler, A.J.; Smith, J.D.; Varanasi, K.K.; Mabry, J.M.; McKinley, G.H.; Cohen, R.E. Relationships between Water Wettability and Ice Adhesion. ACS Appl. Mater. Interfaces 2010, 2, 3100–3110. [Google Scholar] [CrossRef]
  9. Zhao, T.Y.; Jones, P.R.; Patankar, N.A. Thermodynamics of sustaining liquid water within rough icephobic surfaces to achieve ultra-low ice adhesion. Sci. Rep. 2019, 9, 258. [Google Scholar] [CrossRef]
  10. Laforte, J.; Allaire, M.; Laflamme, J. State-of-the-art on power line de-icing. Atmos. Res. 1998, 46, 143–158. [Google Scholar] [CrossRef]
  11. Sojoudi, H.; Wang, M.; Boscher, N.; McKinley, G.H.; Gleason, K.K. Durable and scalable icephobic surfaces: Similarities and distinctions from superhydrophobic surfaces. Soft Matter 2016, 12, 1938–1963. [Google Scholar] [CrossRef] [Green Version]
  12. Zhuo, Y.; Xiao, S.; Amirfazli, A.; He, J.; Zhang, Z. Polysiloxane as icephobic materials—The past, present and the future. Chem. Eng. J. 2020, 127088. [Google Scholar] [CrossRef]
  13. Wang, Y.; Xue, J.; Wang, Q.; Chen, Q.; Ding, J. Verification of Icephobic/Anti-icing Properties of a Superhydrophobic Surface. ACS Appl. Mater. Interfaces 2013, 5, 3370–3381. [Google Scholar] [CrossRef] [PubMed]
  14. Wang, H.; He, G.; Tian, Q. Effects of nano-fluorocarbon coating on icing. Appl. Surf. Sci. 2012, 258, 7219–7224. [Google Scholar] [CrossRef]
  15. Liao, R.; Zuo, Z.; Guo, C.; Yuan, Y.; Zhuang, A. Fabrication of superhydrophobic surface on aluminum by continuous chemical etching and its anti-icing property. Appl. Surf. Sci. 2014, 317, 701–709. [Google Scholar] [CrossRef]
  16. Mishchenko, L.; Hatton, B.; Bahadur, V.; Taylor, J.A.; Krupenkin, T.; Aizenberg, J. Design of Ice-free Nanostructured Surfaces Based on Repulsion of Impacting Water Droplets. ACS Nano 2010, 4, 7699–7707. [Google Scholar] [CrossRef]
  17. Li, T.; Ibáñez-Ibáñez, P.F.; Håkonsen, V.; Wu, J.; Xu, K.; Zhuo, Y.; Luo, S.; He, J.; Zhang, Z. Self-Deicing Electrolyte Hydrogel Surfaces with Pa-level Ice Adhesion and Durable Antifreezing/Antifrost Per-formance. ACS Appl. Mater. Interfaces 2020, 12, 35572–35578. [Google Scholar] [CrossRef]
  18. Zhu, L.; Xue, J.; Wang, Y.; Chen, Q.; Ding, J.; Wang, Q. Ice-phobic Coatings Based on Silicon-Oil-Infused Polydimethylsiloxane. ACS Appl. Mater. Interfaces 2013, 5, 4053–4062. [Google Scholar] [CrossRef]
  19. Sojoudi, H.; McKinley, G.H.; Gleason, K.K. Linker-free grafting of fluorinated polymeric cross-linked network bilayers for durable reduction of ice adhesion. Mater. Horizons 2014, 2, 91–99. [Google Scholar] [CrossRef] [Green Version]
  20. Susoff, M.; Siegmann, K.; Pfaffenroth, C.; Hirayama, M. Evaluation of icephobic coatings—Screening of different coatings and influence of roughness. Appl. Surf. Sci. 2013, 282, 870–879. [Google Scholar] [CrossRef] [Green Version]
  21. He, Z.; Xiao, S.; Gao, H.; He, J.; Zhang, Z. Multiscale crack initiator promoted super-low ice adhesion surfaces. Soft Matter 2017, 13, 6562–6568. [Google Scholar] [CrossRef]
  22. Shen, Q.; Qiu, J.; Liu, G.; Lv, K.; Zhang, Y. Rough surface simulation and electrical contact transient performance. In Proceedings of the 2016 Prognostics and System Health Management Conference (PHM-Chengdu), Chengdu, China, 19–21 October 2016; Institute of Electrical and Electronics Engineers (IEEE): Piscataway Township, NJ, USA, 2016; pp. 1–6. [Google Scholar]
  23. Xiao, S.; He, J.; Zhang, Z. Nanoscale deicing by molecular dynamics simulation. Nanoscale 2016, 8, 14625–14632. [Google Scholar] [CrossRef] [PubMed]
  24. Xiao, S.; Skallerud, B.H.; Wang, F.; Zhang, Z.; He, J. Enabling sequential rupture for lowering atomistic ice adhesion. Nanoscale 2019, 11, 16262–16269. [Google Scholar] [CrossRef] [PubMed]
  25. Xiao, S.; He, J.; Zhang, Z. Modeling nanoscale ice adhesion. Acta Mech. Solida Sin. 2017, 30, 224–226. [Google Scholar] [CrossRef]
  26. Singh, J.K.; Müller-Plathe, F. On the characterization of crystallization and ice adhesion on smooth and rough surfaces using molecular dynamics. Appl. Phys. Lett. 2014, 104, 21603. [Google Scholar] [CrossRef] [Green Version]
  27. Metya, A.K.; Singh, J.K. Ice adhesion mechanism on lubricant-impregnated surfaces using molecular dynamics simula-tions. Mol. Simul. 2019, 45, 394–402. [Google Scholar] [CrossRef]
  28. Bharathidasan, T.; Kumar, S.V.; Bobji, M.; Chakradhar, R.; Basu, B.J. Effect of wettability and surface roughness on ice-adhesion strength of hydrophilic, hydrophobic and superhydrophobic surfaces. Appl. Surf. Sci. 2014, 314, 241–250. [Google Scholar] [CrossRef]
  29. Saito, H.; Takai, K.; Yamauchi, G. Water- and ice-repellent coatings. Surf. Coat Int. 1997, 80, 168–171. [Google Scholar] [CrossRef]
  30. Rahman, M.A.; Jacobi, A.M. Condensation, frost formation, and frost melt-water retention characteristics on micro-grooved brass surfaces under natural convection. Heat Transf. Eng. 2013, 34, 1147–1155. [Google Scholar] [CrossRef]
  31. Ghalmi, Z.; Menini, R.; Farzaneh, M. Theoritical studies and quantification of ice adhesion mechanisms. In Proceedings of the 13th International Workshop on Atmospheric Icing of Structures, IWAIS, Andermatt, Switzerland, 8–11 September 2009. [Google Scholar]
  32. Chen, D.; Gelenter, M.D.; Hong, M.; Cohen, R.E.; McKinley, G.H. Icephobic Surfaces Induced by Interfacial Nonfrozen Water. ACS Appl. Mater. Interfaces 2017, 9, 4202–4214. [Google Scholar] [CrossRef]
  33. Eberle, P.; Tiwari, M.K.; Maitra, T.; Poulikakos, D. Rational nanostructuring of surfaces for extraordinary icephobicity. Nanoscale 2014, 6, 4874–4881. [Google Scholar] [CrossRef]
  34. He, Z.; Vågenes, E.T.; Delabahan, C.; He, J.; Zhang, Z. Room Temperature Characteristics of Polymer-Based Low Ice Adhesion Surfaces. Sci. Rep. 2017, 7, srep42181. [Google Scholar] [CrossRef] [PubMed] [Green Version]
  35. Cao, L.; Jones, A.K.; Sikka, V.K.; Wu, J.; Gao, D. Anti-Icing Superhydrophobic Coatings. Langmuir 2009, 25, 12444–12448. [Google Scholar] [CrossRef] [PubMed]
  36. Kulinich, S.A.; Farzaneh, M. On ice-releasing properties of rough hydrophobic coatings. Cold Reg. Sci. Technol. 2011, 65, 60–64. [Google Scholar] [CrossRef]
  37. Coasne, B.; Galarneau, A.; Pellenq, R.J.M.; Di Renzo, F. Adsorption, intrusion and freezing in porous silica: The view from the nanoscale. Chem. Soc. Rev. 2013, 42, 4141–4171. [Google Scholar] [CrossRef] [PubMed]
  38. Moore, E.B.; De La Llave, E.; Welke, K.; Scherlis, D.A.; Molinero, V. Freezing, melting and structure of ice in a hydrophilic nanopore. Phys. Chem. Chem. Phys. 2010, 12, 4124–4134. [Google Scholar] [CrossRef] [PubMed]
  39. Weng, L.; Stott, S.L.; Toner, M. Molecular dynamics at the interface between ice and poly (vinyl alcohol) and ice recrys-tallization inhibition. Langmuir 2017, 34, 5116–5123. [Google Scholar] [CrossRef]
  40. Alba-Simionesco, C.; Coasne, B.; Dosseh, G.; Dudziak, G.; Gubbins, K.E.; Radhakrishnan, R.; Sliwinska-Bartkowiak, M. Effects of confinement on freezing and melting. J. Phys. Condens. Matter 2006, 18, R15–R68. [Google Scholar] [CrossRef]
  41. Hiemenz, P.C.; Hiemenz, P.C. Principles of Colloid and Surface Chemistry; M. Dekker: New York, NY, USA, 1986; Volume 188. [Google Scholar]
  42. Callister, W.D.; Rethwisch, D.G. Materials Science and Engineering: An Introduction, 8th ed.; John Wiley and Sons: New York, NY, USA, 2010. [Google Scholar]
  43. Webber, J.B.W. Studies of nano-structured liquids in confined geometries and at surfaces. Prog. Nucl. Magn. Reson. Spectrosc. 2010, 56, 78–93. [Google Scholar] [CrossRef] [Green Version]
  44. Wang, F.; Xiao, S.; Zhuo, Y.; Ding, W.; He, J.; Zhang, Z. Liquid layer generators for excellent icephobicity at extremely low temperatures. Mater. Horizons 2019, 6, 2063–2072. [Google Scholar] [CrossRef] [Green Version]
  45. Zhuo, Y.; Xiao, S.; Håkonsen, V.; Li, T.; Wang, F.; He, J.; Zhang, Z. Ultrafast self-healing and highly transparent coating with mechanically durable icephobicity. Appl. Mater. Today 2020, 19, 100542. [Google Scholar] [CrossRef]
  46. Bell, I.G. Models for the specific adhesion of cells to cells. Science 1978, 200, 618–627. [Google Scholar] [CrossRef] [PubMed]
  47. Zednik, C. Solving the Black Box Problem: A Normative Framework for Explainable Artificial Intelligence. Philos. Technol. 2019, 1–24. [Google Scholar] [CrossRef] [Green Version]
  48. Samuel, A.L. Some Studies in Machine Learning Using the Game of Checkers. II—Recent Progress. IBM J. Res. Dev. 1967, 11, 601–617. [Google Scholar] [CrossRef]
  49. Rønneberg, S.; Laforte, C.; Volat, C.; He, J.; Zhang, Z. The effect of ice type on ice adhesion. AIP Adv. 2019, 9, 055304. [Google Scholar] [CrossRef] [Green Version]
  50. Solveyra, E.G.; De La Llave, E.; Scherlis, D.A.; Molinero, V. Melting and Crystallization of Ice in Partially Filled Nanopores. J. Phys. Chem. B 2011, 115, 14196–14204. [Google Scholar] [CrossRef] [PubMed] [Green Version]
  51. Molinero, V.; Moore, E.B. Water Modeled as an Intermediate Element between Carbon and Silicon†. J. Phys. Chem. B 2009, 113, 4008–4016. [Google Scholar] [CrossRef] [Green Version]
  52. Stillinger, F.H.; Weber, T.A. Computer simulation of local order in condensed phases of silicon. Phys. Rev. B 1985, 31, 5262–5271. [Google Scholar] [CrossRef] [Green Version]
  53. Daw, M.S.; Baskes, M.I. Embedded-atom method: Derivation and application to impurities, surfaces, and other defects in metals. Phys. Rev. B 1984, 29, 6443–6453. [Google Scholar] [CrossRef] [Green Version]
  54. Nosé, S. A unified formulation of the constant temperature molecular dynamics methods. J. Chem. Phys. 1984, 81, 511. [Google Scholar] [CrossRef] [Green Version]
  55. Hoover, W.G. Canonical dynamics: Equilibrium phase-space distributions. Phys. Rev. A 1985, 31, 1695–1697. [Google Scholar] [CrossRef] [Green Version]
  56. Plimpton, S. Fast Parallel Algorithms for Short-Range Molecular Dynamics. J. Comput. Phys. 1995, 117, 1–19. [Google Scholar] [CrossRef] [Green Version]
  57. Harrington, P. Machine Learning in Action; Manning Publications Co.: New York, NY, USA, 2012. [Google Scholar]
  58. Matlab, V. 7.10. 0 (R2010a); The MathWorks Inc.: Natick, MA, USA, 2010.
  59. Friedman, J.; Hastie, T.; Tibshirani, R. The Elements of Statistical Learning; Springer Series in Statistics: New York, NY, USA, 2001; Volume 1. [Google Scholar]
  60. Fitzner, M.; Sosso, G.C.; Cox, S.J.; Michaelides, A. The many faces of heterogeneous ice nucleation: Interplay between surface morphology and hydrophobi-city. J. Am. Chem. Soc. 2015, 137, 13658–13669. [Google Scholar] [CrossRef] [PubMed] [Green Version]
  61. Urata, C.; Dunderdale, G.J.; England, M.W.; Hozumi, A. Self-lubricating organogels (SLUGs) with exceptional syneresis-induced anti-sticking properties against vis-cous emulsions and ices. J. Mater. Chem. A 2015, 3, 12626–12630. [Google Scholar] [CrossRef]
  62. Stukowski, A. Visualization and analysis of atomistic simulation data with OVITO—The Open Visualization Tool. Model. Simul. Mater. Sci. Eng. 2009, 18, 015012. [Google Scholar] [CrossRef]
  63. Varanasi, K.K.; Deng, T.; Smith, J.D.; Hsu, M.; Bhate, N. Frost formation and ice adhesion on superhydrophobic surfaces. Appl. Phys. Lett. 2010, 97, 234102. [Google Scholar] [CrossRef]
  64. Chai, T.; Draxler, R. Root mean square error (RMSE) or mean absolute error (MAE)?—Arguments against avoiding RMSE in the literature. Geosci. Model. Dev. 2014, 7, 1247–1250. [Google Scholar] [CrossRef] [Green Version]
  65. Itaoka, K. Regression and interpretation low R-Squares. In Proceedings of the Presentation at Social Research Network 3rd Meeting, Tokyo, Japan, 12–13 April 2012. [Google Scholar]
Figure 1. Atomistic systems of ice adhesion on rough surfaces. (a) Five sine waves (light purple) with randomly generated amplitudes are added to make a periodic wave (dark blue). (b) A random planar wave surface generated by adding sine waves in both x and y directions. (c) Rough surface carved by using the periodic planar wave surface in (b), with local thickness in the range of 10 to 80 Å. (d) Schematic illustration of the atomistic structures of ice adhesion on a rough surface. There is an initial liquid water layer between the ice and the substrate, which can transform into ice or remain amorphous after equilibration simulations depending on the surface.
Coatings 11 00033 g001
Figure 2. Ice adhesion strength on flat (a) and rough (b) surfaces with different epsilon values. The error bars show the standard deviation of three independent simulations.
Coatings 11 00033 g002
Figure 3. Interfacial quasi-liquid water on flat and rough surfaces before and after ice detachment. Each of the four snapshots are a two-times copy of the periodic simulation box where the left copy has the ice removed for visualisation purposes. The water molecules in the quasi-liquid layer are colored in dark red, while the ice is coloured cyan. All the snapshots are taken from surfaces with an epsilon value of 0.05 eV. All the figures, including detemining water and ice molecules, were made by the visualization software Ovito [62].
Coatings 11 00033 g003
Figure 4. Ice adhesion strength on rough surfaces with varied epsilon values obtained by MD simulations. The same ice adhesion data were plotted against surface curvature (a) and height difference (b). All the ice adhesion strengths were obtained using a pulling rate of 2 m/s. Each datapoint is an average of 10 independent simulations.
Coatings 11 00033 g004
Figure 5. Comparison of the ice adhesion strength on rough surfaces obtained by MD simulations and by SVM prediction. The results for surfaces with epsilon values ( ϵ ) of 0.05, 0.1, and 0.2 eV are shown in (ac), respectively. The ice adhesion strength obtained by the MD simulation is given as solid green circle (observations), while the prediction strength of the SVM is given in light purple solid lines (perfect prediction). A perfect prediction would have all the green data points on the purple line.
Coatings 11 00033 g005
Figure 6. Rough surfaces with the highest (a) and lowest (b) ice adhesion predicted by the regression SVM. Both the surfaces have an epsilon value of 0.05 eV. The rough surface in (a) was predicted to have an ice adhesion strength of 568 MPa, while the surface in (b) has a lower value of 409 MPa.
Coatings 11 00033 g006
Figure 7. Confusion matrix showing the classification power of the SVM in identifying the three categories of rough ice adhesion surfaces with epsilon values of 0.05 (a), 0.1 (b), and 0.2 eV(c). The three classes of surfaces, 1, 2, and 3, refer to low, medium, and high ice adhesion strengths. The classification accuracy of each class is given in the figure, with a high intensity of the color also representing a high accuracy. The “Ture” classes shown in the confusion matrix are randomly discretized from the MD simulation results.
Coatings 11 00033 g007
Table 1. Prediction performance of the SVM with various kernels on rough surfaces with different epsilon values. The RMSE values have units of MPa. The smaller RMSE, the higher the prediction accuracy. The R2 values are dimensionless. The higher the R2, the better the prediction.
Tensile Pulling-Regression
ϵ = 0.05 eV ϵ = 0.1 eV ϵ = 0.2 eV
Observations752752634
LinearRMSE: 17.08RMSE: 16.29RMSE: 16.43
R2: 0.33R2: 0.29R2: 0.20
QuadraticRMSE: 17.06RMSE: 16.29RMSE: 16.73
R2: 0.33R2: 0.29R2: 0.17
CubicRMSE: 17.35RMSE: 17.00RMSE: 17.16
R2: 0.31R2: 0.23R2: 0.12
Fine GaussianRMSE: 20.81RMSE: 19.32RMSE: 18.28
R2: 0.01R2: 0R2: 0
Medium GaussianRMSE: 16.86RMSE: 16.72RMSE: 16.64
R2: 0.35R2: 0.25R2: 0.18
Coarse GaussianRMSE: 17.01RMSE: 16.22RMSE: 16.37
R2: 0.34R2: 0.30R2: 0.20
Table 2. Classification performance of the SVM with various kernels. All the classifications have an accuracy higher than a probability of 33.3%.
Tensile Pulling-Classifications
ϵ = 0.05 eV ϵ = 0.1 eV ϵ = 0.2 eV
Observations752752634
Linear52.2%48.0%44.3%
Quadratic49.7%46.1%43.7%
Cubic45.0%41.9%40.1%
Fine Gaussian45.2%39.0%34.9%
Medium Gaussian50.1%49.7%45.0%
Coarse Gaussian51.1%49.1%43.4%
Publisher’s Note: MDPI stays neutral with regard to jurisdictional claims in published maps and institutional affiliations.

