Abstract
The poor mechanical stability of hydrophobic and superhydrophobic surfaces and coatings severely hinder their commercial and industrial applicability. In addition to being expensive and time-consuming to manufacture, the ability of these coatings to maintain their non-wetting properties after mechanical abrasion and wear is currently not well-understood. In this work, the influence of increasing abrasive loads on the roughness, wettability, and corrosion inhibition properties of a commercial superhydrophobic coating was studied. It was shown that the wetting and corrosion properties of the superhydrophobic coating was affected by the abrasive load. Increasing abrasive loads were applied using a tribometer and the electrochemical response was studied using open circuit potential, potentiodynamic polarization, and electrochemical impedance spectroscopy. The wetting and roughness behavior of the coating before and after the application of the abrasive load was characterized using contact angle, contact angle hysteresis, and optical profilometry. The protective properties of the superhydrophobic coating was observed to deteriorate as the abrasive load increased. Similarly, after a specific abrasive load, the coating transitioned from the Cassie-Baxter state of wetting into that of the Wenzel state.
1. Introduction
Surfaces exhibiting hydrophobic and superhydrophobic behavior have recently gained significant traction in various applications like self-cleaning [1,2], anti-icing [3,4,5,6], oil-water separation [7,8,9], and corrosion-resistant surfaces [10,11,12]. Superhydrophobic surfaces can be found in nature among many plants and animals with well-known examples including the lotus plant, which has the ability to self-clean its surfaces, and the water strider, which has the ability to walk on water [13,14]. Cassie-Baxter and Wenzel were the first researchers to publish models in order to try to explain the phenomena of hydrophobic and superhydrophobic surfaces [15,16]. These surfaces are typically characterized by their contact angles with water, where a hydrophobic surface has a contact angle greater than 90°, and a superhydrophobic surface has a contact angle greater than 150° [17]. Nosonovsky et al. [18] described the importance of combining a low surface energy material and surface roughness to achieve superhydrophobicity. High water repellency and contact angles are observed when air is trapped between adjacent surface features with a small real area of contact between the substrate and wetting medium [19,20]. Researchers have observed these naturally occurring surfaces to create coatings that can be used to inhibit corrosion, reduce drag, and to create self-cleaning surfaces [21]. When a hierarchical surface roughness is present, a range of wetting states can be distinguished that range from the Cassie-Baxter or lotus state, where water droplets form high contact angles that easily roll off the surface, to the Wenzel state, where water droplets fully penetrate the surface [18]. Between these two extreme wetting states, there exists the rose petal state, described as pinned superhydrophobicity, where water droplets do not roll off the surface, but still exhibit contact angles in the superhydrophobic region. In the rose petal state, the water droplet penetrates the micro-scale roughness, but not the nano-scale roughness, giving rise to the pinned wetting state [18,22].
There have been several approaches to replicate the superhydrophobic properties of naturally occurring surfaces, including the use of encapsulating species and the formation of hierarchical layers [23,24,25,26,27,28,29]. However, many of these methods are industrially unviable due to the many steps involved, the chemical and mechanical stability of the modification technique, and their cost [30]. Whether using a coating or a hierarchical structure to create the hydrophobic or superhydrophobic surface, the surface tends to be delicate and easily damaged, causing the surface or coating to rapidly lose its hydrophobic or superhydrophobic properties upon repeated use [31]. If a synthetic superhydrophobic surface is touched with bare skin, the area could be contaminated with natural oils and salts present on the skin, causing a dramatic change in the surface energy and resulting in the loss of superhydrophobicity. Similarly, the application of a force on a coated or treated surface can damage the surface, causing deterioration of the superhydrophobic property [31]. As such, it is necessary to study and characterize how superhydrophobic surfaces behave under varying abrasive loads as well as how this affects their corrosion and wetting performance.
Thus far, there have been several studies and coating techniques that have been developed to create a superhydrophobic surface stable against mechanical, chemical, and environmental conditions [32,33,34,35,36,37,38,39]. The mechanical stability and robustness of these coatings are determined by their ability to resist wear from abrasion while still maintaining non-wetting properties. There are two methods that can be taken in creating mechanically stable hydrophobic and superhydrophobic surfaces: (i) Retaining non-wettability as long as possible by limiting material removal and (ii) Developing surfaces or materials that retain their non-wettability as it is worn away [40]. Recently, Sataeva et al. [41] used laser processing followed by chemical deposition of fluorooxysilane to create superhydrophobic surfaces on aluminum-magnesium alloys. The abrasive durability of the coating was evaluated using oscillating sand, which closely simulated the conditions encountered in aviation. The results from this study demonstrated that the surfaces were able to maintain high contact angles regardless of abrasion time. However, the roll-off angle increased with increasing abrasion time, indicating a loss of self-cleaning ability. Wang et al. [42] developed robust superhydrophobic steel surfaces using antiformin solution using a three-step process that included chemical immersion, ultrasonic treatment, and surface modification. The prepared surfaces were then subjected to abrasive wear, and the results showed that the surfaces maintained contact angles in the superhydrophobic region after undergoing abrasion for 2.24 m. She et al. [43] prepared a superhydrophobic surface on magnesium by electrodepositing nickel and subsequent surface modification using steric acid. The resulting surface showed a maximum abrasion distance of 0.70 m under a 1.2 kPa pressure before losing its superhydrophobic property, however, the sliding angle dramatically increased from 1.2° ± 0.9° before abrasion to 52.7° ± 1.4° after abrasion. Wang et al. [5] made a superhydrophobic steel surface by combining hydrogen peroxide and acid to obtain hierarchical structures, followed by a surface treatment. The prepared surface was able to endure up to 16 kPa pressure for 1.10 m while still maintaining a contact angle of 152° and a sliding angle of 8°. Xiang et al. [39] created superhydrophobic surfaces using nickel electrodeposition followed by myristic acid treatment. The samples were subjected to abrasion using a 500 g weight on 1400 grit sandpaper at a constant speed of 1 cm/s for 100 cycles. After abrasion, all samples showed contact angles that were higher than 160°, however, the resulting roll-off angles were not reported. Though these studies are valuable in the laboratory setting, the process to prepare the surfaces are still time and cost intensive. As such, it is necessary to study and understand the mechanical and electrochemical stability of commercially available superhydrophobic coatings that have been subjected to abrasive loads to better characterize the industrial and commercial viability.
In this study, a commercial superhydrophobic coating was manually applied to a steel substrate. The coated samples were subjected to increasing abrasive loads with a tribometer and the resulting surface was evaluated based on its wetting and corrosion behavior. The surfaces were characterized before and after the abrasive load using optical profilometry and contact angle methods. Open circuit potential, potentiodynamic polarization, and electrochemical impedance spectroscopy were all employed to understand the corrosion mechanisms that were taking place. This work demonstrates the influence of abrasive loads on the wetting and corrosion performance of superhydrophobic coatings.
2. Materials and Methods
2.1. Materials and Sample Preparation
Low carbon steel blocks (50 mm × 50 mm × 6 mm) were used for the experiments and had the following composition (wt.%): Fe, 98.88%, C, 0.13%, Mn, 0.30%, P, 0.04%, Si, 0.15%, and S, 0.50%. The blocks were initially polished on 120 grit silicon carbide paper to remove milling and manufacturing marks and to ensure a uniform surface, followed by ultrasonic cleaning in water and ethanol, and finally dried in air. Once polished, all samples were stored in a desiccator to prevent any reactions due to the atmosphere. The electrolyte used in each test was made with 3.5 wt.% sodium chloride of ≥99% purity (Sigma-Aldrich, St. Louis, MO, USA) and deionized water.
All polished samples were spray-coated with NeverWet (Rust-Oleum, Vernon Hills, IL, USA) to create the superhydrophobic surfaces. NeverWet is a commercially available, two-step surface modification technique. The silicon-based formulation, when applied to a surface, results in a hierarchical structure with micro- and nano-structures, allowing air to be trapped in both or one of the micro- or nano-structures. The samples were hand-sprayed with a base coat and left to dry for 30 min. Following this, four top coatings were applied, with each layer being allowed to dry for 2 min and were left to dry overnight for 12 h before testing. Five samples with the following naming convention is used in this study: BS for the bare steel sample, SS for the undamaged superhydrophobic coating, 5, 10, and 15 N, for the samples abraded using a load of 5, 10, and 15 N, respectively. Each testing condition was repeated three times on each sample to ensure repeatability.
2.2. Surface Properties
The surface roughness was measured after polishing, application of the superhydrophobic coating, and after each abrasive load using a non-contact 3D optical profilometer (Rtec Instruments, San Jose, CA, USA). The profilometer was a Mirau interferometer with a resolving power of 0.92 µm and a 3.04 µm depth of focus at 10× magnification. To ensure the reliability and uniformity of the samples, roughness values were measured at three random locations on each specimen.
2.3. Contact Angles
The contact angle (CA) and contact angle hysteresis (CAH) was measured after the application of the coating as well as after abrasion in ambient conditions using a contact angle goniometer (ramé-hart, Succasunna, NJ, USA). CA and CAH measurements were obtained using 10 µL droplets of distilled water placed at three different locations on each surface to ensure the reliability and uniformity of the results.
2.4. Abrasion
The coated surfaces were abraded using an Rtec Multifunction Tribometer 5000 (Rtec Instruments, San Jose, CA, USA) at room temperature (25 °C) under ambient conditions in a ball-on-plate configuration. Each sample was abraded with loads of 5, 10, and 15 N for a sliding distance of 25 mm spaced 1.25 mm apart at 1 mm s−1 sliding velocity for a total area coverage of 25 mm2. This area of coverage was chosen due to the diameter of the opening in the electrochemical cell. Figure 1 shows the abrasion pattern used in this study. The ball used as counter material was a 6.5 mm diameter 52100 alloy steel with the following composition (wt.%): Fe, 96.5–97.32%, Cr, 1.30–1.60%, C, 0.980–1.10%, Mn, 0.250–0.450%, Si, 0.150–0.300%, S, ≤0.025%, and P, ≤0.025%.
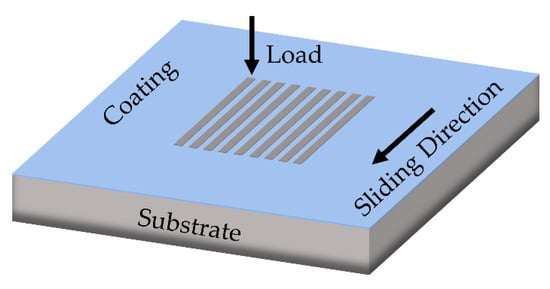
Figure 1.
Scheme of abrasion pattern.
2.5. Electrochemical Experiments
Open circuit potential (OCP), potentiodynamic polarization (PDP), and electrochemical impedance spectroscopy (EIS) data was obtained using a Gamry Reference 3000 potentiostat (Gamry Instruments, Warminster, PA, USA). All tests were performed at an ambient temperature of 25 °C and normal humidity conditions in 3.5 wt.% NaCl solution in a conventional three-electrode electrochemical cell. The electrochemical cell consisted of a working electrode (the sample), a high surface area graphite counter electrode, and a saturated calomel electrode (SCE) as a reference with a potential of +0.241 V vs. standard hydrogen electrode (SHE). The sample was exposed to the solution through an opening with a diameter of 1.905 cm and an area of 2.85 cm2, respectively. Before each test, the sample was allowed about 20 min to reach steady-state conditions to ensure the properties did not change during the test. PDP testing was carried out using a scanning rate of 0.167 V s−1 from −0.5 to 0.5 V above and below the equilibrium potential. EIS experiments were performed at frequencies ranging from 105 to 10−1 Hz at OCP with a 10 mV amplitude of perturbation. The Tafel extrapolation technique was used to determine the corrosion potential (Ecor) and corrosion current density (icor) from the polarization curves of each sample.
3. Results
3.1. Surface Roughness and Profiles
Surface morphology is an important parameter affecting the wettability of superhydrophobic coatings; therefore, the samples were characterized by optical profilometry after polishing, coating application, and after abrasive wear. The average surface roughness (Ra) of each sample was measured at three random locations. On the abraded samples, the Ra was measured on the abraded sections to determine the changes on the surface due to the influence of the abrasive load. Figure 2a–d show the morphologies of the coated sample and the 5, 10, and 15 N samples, respectively, and Table 1 shows the Ra of each sample. The Ra of the uncoated sample was 56.73 ± 8.49 nm. After application of the coating and before being subjected to an abrasive load, the coated sample had an Ra of 764.57 ± 33.18 nm. When the coated sample was subjected to an abrasive load of 5 N, the Ra decreased slightly to 727.33 ± 10.22 nm. However, with the abrasive load of 10 and 15 N the Ra decreased to 633.67 ± 22.76 nm and 543.93 ± 19.61 nm, respectively. These results demonstrate that increasing the abrasive load results in the decrease of surface roughness due to the disruption of the hierarchical surface structures.
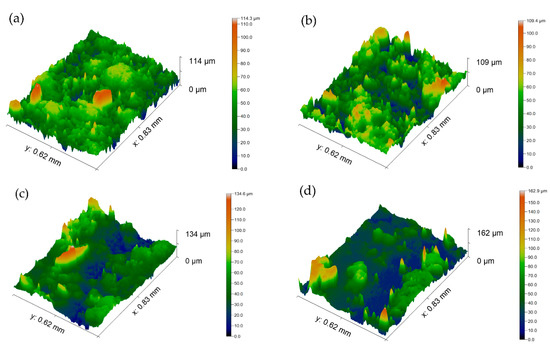
Figure 2.
Optical profiles of (a) coated sample and coated sample with abrasive load of (b) 5 N, (c) 10 N, and (d) 15 N.

Table 1.
Average surface roughness (Ra) of the uncoated, coated, and coated and abraded samples.
3.2. Contact Angle Measurements
Figure 3a–e show the water contact angles of the samples. Table 2 summarizes the CA and CAH values for each of the samples. The polished bare sample without a coating (Figure 3a) had the lowest contact angle of 66.15° ± 2.87° with water. Upon application of the superhydrophobic coating (Figure 3b), the contact angle increased to 158.95° ± 0.54° with water. After abrading the samples with loads of 5, 10, and 15 N, the contact angles were observed to be 155.48° ± 2.13°, 150.49° ± 2.09°, and 146.11° ± 2.70°, respectively. The CAH of the uncoated sample was measured to be 18.48° ± 1.59°. With the superhydrophobic coating, the CAH reduced to 5.00° ± 0.25°. When the samples were abraded, however, the CAH was measured with the sample in two orientations, namely with the grooves perpendicular to the viewing camera and with the grooves parallel to the viewing camera. After being abraded with the 5, 10, and 15 N loads, the CAH successively increased to 6.23° ± 2.64°, 7.22° ± 2.35°, and 13.72° ± 5.36°, respectively, when viewed in the parallel orientation. When viewed in the perpendicular orientation, the CAH was 6.75° ± 0.41°, 7.34° ± 2.44°, and 12.75° ± 3.34° for the 5, 10, and 15 N samples, respectively. It was noticed after abrasion with the 15 N load that the droplet rolled from one abraded groove to the next in the perpendicular orientation of the grooves with respect to the viewing camera. This made it difficult to measure the exact point at which the droplet rolled completely off the surface. This showed that after abrasion with the 15 N load, the sample transitioned from the Cassie-Baxter state of wetting into that of the Wenzel state, causing penetration of the electrolyte into the micro-pores on the surface. The surface exhibited high CA at the strips of coating remaining between the abraded sections, but the abraded sections showed high adhesion of the droplet. This is also evidenced by the reduction in Ra of the sample abraded with 15 N as compared to the Ra of the unabraded sample [44,45]. The samples abraded with 5 and 10 N loads retained high CA and low CAH values, demonstrating the lotus effect (CA ≥ 150° and CAH ≤ 10°). During abrasion, grooves are formed on the coating surface (shown in Figure 2d), causing water to sink into these grooves and to become pinned to the surface. This causes a wetting transition from the Cassie-Baxter state into the Wenzel state. A similar behavior was observed by Aslanidou et al. [46], where droplets of oil was seen to sink into the grooves of the superhydrophobic coating that were formed during the coating process. Murakami et al. [47], using optical microscopy, observed that the wetting transition of water on pillared surfaces was dependent on both the diameter of the pillars and width of the grooves, as well as the height of the pillars. The effects of this wetting transition on the protective abilities and corrosion inhibition of the coating will be discussed in Section 3.3.
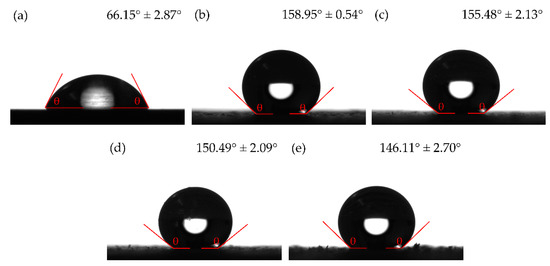
Figure 3.
Contact angle images of (a) uncoated, (b) coated, and coated sample with abrasive load of (c) 5 N, (d) 10 N, and (e) 15 N.

Table 2.
Measured contact angle (CA) and contact angle hysteresis (CAH) for BS (bare steel sample), SS (undamaged superhydrophobic coating), 5, 10, and 15 N samples.
3.3. Electrochemical Studies
3.3.1. Open Circuit Potential
When a metal surface is exposed to an electrolyte, a mixed electrochemical or corrosion potential develops (Eoc). This is typically determined by the anodic reaction(s), cathodic reaction(s), and the electrolyte resistance in the electrochemical system. Since electrochemical systems can change with time due to the buildup of corrosion products or the breakdown of surface films, the OCP can vary with time. Generally, the OCP lies between the hydrogen reduction potential and the oxygen evolution potential in aqueous systems [22].
Figure 4 shows the OCP of the undamaged and damaged coatings as a function of time, and Table 3 shows the average OCP during the final 200 s of the test. As expected, the highest equilibrium potential was measured in the undamaged coating at −0.183 V. This is attributed to the highly protective nature of the coating as well as the pockets of air present on the surface, preventing the penetration of electrolyte to the substrate. Once the coating was abraded with the lowest tested load of 5 N, the Eoc decreased to −0.465 V. This was due to the reduction in thickness of the coating as well as the plowing of the coating. The samples abraded with the 10 and 15 N loads showed OCP values of −0.536 and −0.596 V, respectively. This indicates that the protective ability of the coating progressively decreased as the surface was abraded with higher loads. It can be noted that as the load increases, the corrosion potential gets closer to that of the uncoated sample. Furthermore, as the coating transitions from the Cassie-Baxter state of wetting into that of the Wenzel state, electrolyte penetrates the hierarchical surface structure and into either the micro- or nano-structure.
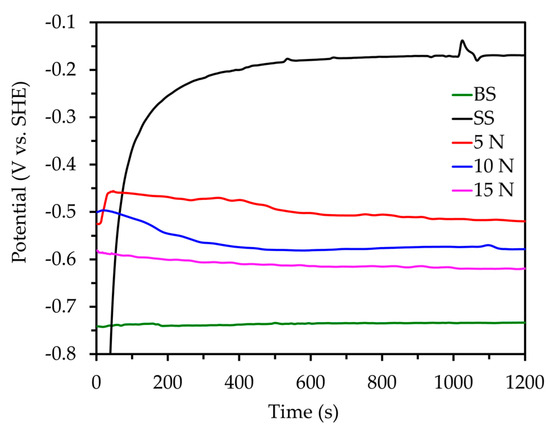
Figure 4.
OCP of the bare, coated, and coated samples at increasing abrasive loads.

Table 3.
Average open circuit potential (OCP) of the bare, coated, and coated samples at increasing abrasive loads during final 200 s.
3.3.2. Potentiodynamic Polarization
Potentiodynamic polarization (PDP) tests were carried out to understand the corrosion behavior of the superhydrophobic coating. Shown in Figure 5 are the polarization curves for BS, SS, 5, 10, and 15 N samples. Properties such as icor, Ecor, and polarization resistance (Rp) can be determined from polarization curves. Rp can be determined by using the Stern-Geary relationship [48], given by Equation (1):
where βa and βc are anodic and cathodic Tafel slopes, respectively. βa and βc, along with icor, were determined directly from the integrated software available with the potentiostat.
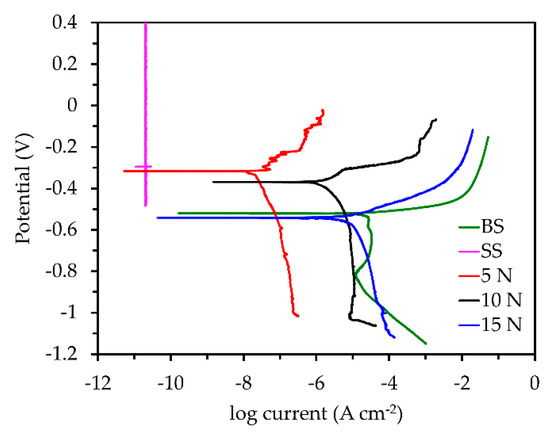
Figure 5.
Tafel curves of the bare, coated, and coated samples at varying abrasive loads.
The corrosion inhibition efficiency (η) of the samples was estimated using Equation (2):
where i is the current density of either the bare or the coated sample. This was used to determine how effective the coating was at protecting the surface at each abrasive load.
Table 4 shows the calculated Ecor, icor, βa, βc, Rp, and η values from the PDP curves. The 5, 10, and 15 N samples had Ecor values of −0.317, −0.369, and −0.541 V, respectively. The bare sample had an Ecor of −0.521 V. The Ecor values of the bare and 15 N samples were expected to almost be the same due to how close together their polarization curves were. However, due to the natural drift from equilibrium that happens in electrochemical systems, there was a difference of about −0.020 V, which can be a negligible amount. The SS sample had the smallest icor simply based on observation of the curve as compared to the others. Both the anodic and cathodic sides of this curve are nearly vertical, indicating total passivation or protection of the surface. As expected, the bare sample had the highest icor of all samples with a value of 1.274 × 10⁻⁵ A cm−2. However, after the application of the superhydrophobic coating and an abrasive load of 5 N, icor decreased by three orders of magnitude to 1.964 × 10⁻⁸ A cm−2. This was due to the protective nature of the superhydrophobic coating, preventing the penetration of the aqueous solution to the substrate. Additionally, the presence of pockets of air on the surface helped prevent the penetration of electrolyte to the substrate, reducing the number of corrosion reactions taking place. Increasing the abrasive load from 5 to 10 N resulted in an increase of the icor by two orders of magnitude to 1.140 × 10⁻⁶ A cm−2. As the load is increased, the high surface roughness of the coating is progressively damaged, leading to a change in the wetting properties of the coating. Additionally, the pockets of air present on the surface also decreased as the surface was abraded with increasing loads. As the load is increased from 10 to 15 N, icor increased to 4.632 × 10⁻⁶ A cm−2. At this point, the polarization curve of the 15 N sample almost overlaps the bare sample, indicating similar corrosion behavior. From the optical images in Figure 6d, abrasion of the coating at increased loads causes plowing of the coating, thereby exposing the substrate.

Table 4.
Corrosion potential (Ecor), Tafel slopes (βa and βc), corrosion current density (icor), polarization resistance (Rp), and corrosion inhibition efficiency (η).
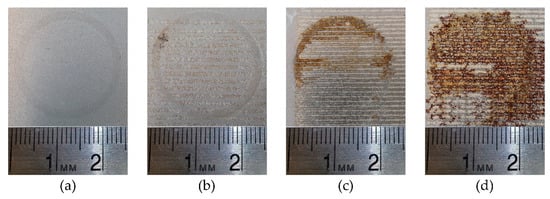
Figure 6.
Progression of coating performance as a function of abrasive load with (a) undamaged coating, and coating at loads of (b) 5 N, (c) 10 N, and (d) 15 N.
Rp determined from the plots can give insight into how effective the coatings are at preventing the transfer of electrons between the anodic and cathodic sites. The lowest Rp was measured in the bare sample, with a value of 1.004 × 10³ Ω cm2. This is due to the relative ease with which electrons can move between the anodic and cathodic sites on the substrate. The application of the superhydrophobic coating increased Rp by three orders of magnitude to 2.578 × 10⁶ Ω cm2 in the sample abraded at 5 N. This high resistance indicates that it is difficult for electrons to move between anodic and cathodic sites on the substrate, thereby inhibiting corrosion. With the 10 and 15 N loads, a decrease of two and three orders of magnitude, respectively, to values of 3.668 × 10⁴ and 6.671 × 10³ Ω cm2, respectively, was observed. At the load of 15 N, the Rp is within the same order of magnitude as the bare sample, indicating a similar behavior for the surface to be polarized.
If the bare sample is considered to have a η of 0, the coated sample at the 5 N load showed almost complete corrosion inhibition at a value of 99.846%. At the load of 10 N, η decreased to 91.052%, and similarly, the 15 N load showed a decrease of η to 63.642%. Though the polarization curves of the bare sample and the 15 N load are nearly overlapping, the coated sample still showed to be better at inhibiting corrosion as compared to the bare sample.
Figure 6a–d show the progression of coating performance as the abrasive load is increased. Figure 6a shows the coating in the undamaged condition and it can be seen that no corrosion reactions have taken place. This further confirms the nearly vertical anodic and cathodic regions of the SS curve in Figure 5. Figure 6b shows the corroded area of the sample that had been abraded at 5 N. Corrosion can be seen in the abraded regions of the surface given by the minor dark spots. Increasing the load to 10 and 15 N, shown in Figure 6c,d, respectively, the damage due to corrosion is far more evident as compared to the undamaged and 5 N samples.
3.3.3. Electrochemical Impedance Spectroscopy
EIS is a valuable tool that can be utilized to determine the impedance response between the electrode and electrolyte interface over a wide frequency range to characterize its corrosion performance. Various elements such as resistive response from the electrolyte resistance of the solution, the resistance of the surface film, and the charge transfer resistance of both anodic and cathodic reactions can be observed from EIS data in various frequency regions [49]. When a metal is protected by a polymer coating, the impedance modulus (|Z|) obtained at the low-frequency limit of 10−1 Hz is usually attributed to the protective ability of the coating. Thus, a higher |Z| or resistance implies better protective ability of the coating and a lower |Z| or resistance suggests worse barrier properties. The overall response of the coating can be determined by observing the entire chosen frequency range.
Figure 7a,b show the magnitude and phase diagrams of the bare, coated, and coated samples with varying abrasive loads. Table 5 shows the |Z| values of each sample at the low-frequency limit of 10−1 Hz. As expected, the uncoated sample demonstrated the lowest |Z| of 6.317 Ω cm2, showing a high susceptibility to corrosion. The phase angle plot (Figure 7b) of the uncoated sample shows one time constant around 102–103 Hz, demonstrating the initiation and propagation of corrosion reactions on the surface of the sample. With the superhydrophobic coating, however, the |Z| at the low-frequency limit increased by ten orders of magnitude to a value of 1.582 × 10¹⁰ Ω cm2, showing high insulating and protective properties. The undamaged nature of the coating as well as the pockets of air present at the coating and electrolyte interface gives rise to the high impedance. In addition, the phase angle of the coated sample is nearly 90°, indicating its almost purely capacitive behavior. Upon abrading the coated sample with a 5 N load, the low-frequency |Z| decreased by one order of magnitude to a value of 1.421 × 10⁹ Ω cm2. As the coating contact angle reduced at increasing loads, the number of air pockets present on the surface also decreased. The phase angle decreased to around 60° at the low-frequency limit for the sample abraded with 5 N. This shows that at higher frequencies, the coating behaves almost purely as a capacitor, however, it becomes more resistive as the frequency decreases, showing the potential for the initiation of corrosion reactions. Increasing the abrasive load from 5 to 10 N reduces the low-frequency |Z| by six orders of magnitude to 1332 Ω cm2. This indicates that the barrier properties of the superhydrophobic coating have severely degraded. However, the polymer coating as well as the pockets of air remaining at the coating and electrolyte interface still protects the substrate as compared to the bare sample. From the phase plot, it can be observed that the 10 N load has two time constants present. One time constant is observed between 101–103 Hz and another between 10−1–10 Hz. The high-frequency time constant is attributed to the protective nature of the polymer coating and the low-frequency time constant is attributed to the corrosion reactions taking place at the substrate. Similarly, the phase angle is also near 0° for the entirety of the frequency range, indicating that the coating is no longer capacitive and is purely resistive, showing its high susceptibility to corrode. This same trend is observed when the load is increased from 10 to 15 N, where the low-frequency |Z| further decreases by two orders of magnitude to 42.34 Ω cm2. As in the 10 N sample, two time constants can also be observed in the 15 N sample, with one observed between 102–104 Hz and another between 10−1–10 Hz. At this point, the protective properties of the superhydrophobic coating are nearly negligible and the surface behaves almost like the bare sample. The coating has transitioned from the Cassie-Baxter state to the Wenzel state and this causes wetting of the hierarchical structure though the CA remains high.
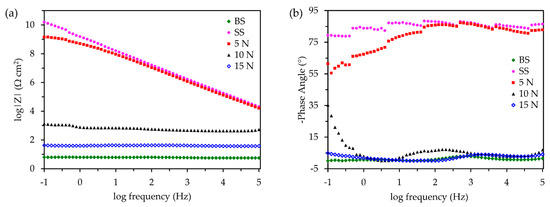
Figure 7.
(a) Magnitude vs. frequency and (b) phase angle vs. frequency of uncoated, coated, and coated at abrasive loads of 5, 10, and 15 N.

Table 5.
Impedance modulus (|Z|) at low-frequency limit of 10−1 Hz.
4. Conclusions
In this study, a commercial superhydrophobic coating has been evaluated based on its surface, wetting, and corrosion properties after the application of varying abrasive loads. This study showed that an abrasive load has a direct impact on the surface roughness and hierarchical structure of a superhydrophobic coating, and this affected the wetting and corrosion inhibition properties of the coating. The surface roughness of the coating decreased with increasing abrasive loads, though it still maintained superhydrophobicity. After application of a specific load, the coated sample transitioned from the Cassie-Baxter state of wetting into that of the Wenzel state. The coated surface showed high contact angles and roll-off angles at loads below 15 N, however, at the 15 N load, the hierarchical structure on the superhydrophobic surface was damaged, causing wetting of the micro-scale roughness. The corrosion current density increased and the resistance to polarization decreased with increasing abrasive loads due to the increased wettability of the surface. Plowing of the coating allowed the electrolyte to penetrate the coating and to the substrate, initiating corrosion reactions. From this study, the mechanical and electrochemical stability of a commercially available superhydrophobic coating after application of varying abrasive loads has been established to better understand and characterize its industrial and commercial viability.
Author Contributions
Conceptualization, P.L.M. and R.R.; methodology, A.M. and R.R.; validation, A.M. and R.R.; formal analysis, A.M. and R.R.; investigation, A.M.; resources, P.L.M.; data curation, A.M.; writing—original draft preparation, A.M.; writing—review and editing, A.M., R.R., and P.L.M.; visualization, A.M.; supervision, P.L.M. and R.R.; funding acquisition, P.L.M. All authors have read and agreed to the published version of the manuscript.
Funding
The authors gratefully acknowledge the start-up funds provided as financial support by the Department of Mechanical Engineering at the University of Nevada, Reno.
Conflicts of Interest
The authors declare no conflict of interest.
References
- Xu, Q.F.; Liu, Y.; Lin, F.-J.; Mondal, B.; Lyons, A.M. Superhydrophobic TiO2–polymer nanocomposite surface with UV-induced reversible wettability and self-cleaning properties. ACS Appl. Mater. Interfaces 2013, 5, 8915–8924. [Google Scholar] [CrossRef]
- Liu, Y.; Chen, J.; Guo, D.; Cao, M.; Jiang, L. Floatable, self-cleaning, and carbon-black-based superhydrophobic gauze for the solar evaporation enhancement at the air–water interface. ACS Appl. Mater. Interfaces 2015, 7, 13645–13652. [Google Scholar] [CrossRef] [PubMed]
- Tang, Y.; Zhang, Q.; Zhan, X.; Chen, F. Superhydrophobic and anti-icing properties at overcooled temperature of a fluorinated hybrid surface prepared via a sol–gel process. Soft Matter 2015, 11, 4540–4550. [Google Scholar] [CrossRef] [PubMed]
- Shen, Y.; Tao, H.; Chen, S.; Zhu, L.; Wang, T.; Tao, J. Icephobic/anti-icing potential of superhydrophobic Ti6Al4V surfaces with hierarchical textures. Rsc Adv. 2015, 5, 1666–1672. [Google Scholar] [CrossRef]
- Wang, N.; Xiong, D.; Deng, Y.; Shi, Y.; Wang, K. Mechanically robust superhydrophobic steel surface with anti-icing, UV-durability, and corrosion resistance properties. ACS Appl. Mater. Interfaces 2015, 7, 6260–6272. [Google Scholar] [CrossRef]
- Ramachandran, R.; Kozhukhova, M.; Sobolev, K.; Nosonovsky, M. Anti-icing superhydrophobic surfaces: Controlling entropic molecular interactions to design novel icephobic concrete. Entropy 2016, 18, 132. [Google Scholar] [CrossRef]
- Yu, Y.; Chen, H.; Liu, Y.; Craig, V.S.J.; Wang, C.; Li, L.H.; Chen, Y. Superhydrophobic and superoleophilic porous boron nitride nanosheet/polyvinylidene fluoride composite material for oil-polluted water cleanup. Adv. Mater. Interfaces 2015, 2, 1400267. [Google Scholar] [CrossRef]
- Liang, W.; Guo, Z. Stable superhydrophobic and superoleophilic soft porous materials for oil/water separation. RSC Adv. 2013, 3, 16469–16474. [Google Scholar] [CrossRef]
- Kong, L.-H.; Chen, X.-H.; Yu, L.-G.; Wu, Z.-S.; Zhang, P.-Y. Superhydrophobic cuprous oxide nanostructures on phosphor-copper meshes and their oil–water separation and oil spill cleanup. ACS Appl. Mater. Interfaces 2015, 7, 2616–2625. [Google Scholar] [CrossRef]
- Zang, D.; Zhu, R.; Zhang, W.; Yu, X.; Lin, L.; Guo, X.; Liu, M.; Jiang, L. Corrosion-resistant superhydrophobic coatings on Mg alloy surfaces inspired by Lotus seedpod. Adv. Funct. Mater. 2017, 27, 1605446. [Google Scholar] [CrossRef]
- Salehi, M.; Mozammel, M.; Emarati, S.M. Superhydrophobic and corrosion resistant properties of electrodeposited Ni-TiO2/TMPSi nanocomposite coating. Colloids Surf. A Physicochem. Eng. Asp. 2019, 573, 196–204. [Google Scholar] [CrossRef]
- Maharana, H.S.; Katiyar, P.K.; Mondal, K. Structure dependent super-hydrophobic and corrosion resistant behavior of electrodeposited Ni-MoSe2-MWCNT coating. Appl. Surf. Sci. 2019, 478, 26–37. [Google Scholar] [CrossRef]
- Barthlott, W.; Neinhuis, C. Purity of the sacred lotus, or escape from contamination in biological surfaces. Planta 1997, 202, 1–8. [Google Scholar] [CrossRef]
- Gao, X.; Jiang, L. Biophysics: Water-repellent legs of water striders. Nature 2004, 432, 36. [Google Scholar] [CrossRef] [PubMed]
- Wenzel, R.N. Resistance of solid surfaces to wetting by water. Ind. Eng. Chem. 1936, 28, 988–994. [Google Scholar] [CrossRef]
- Cassie, A.B.D.; Baxter, S. Wettability of porous surfaces. Trans. Faraday Soc. 1944, 40, 546–551. [Google Scholar] [CrossRef]
- Manoj, A.; Ramachandran, R.; Menezes, P.L. Self-healing and superhydrophobic coatings for corrosion inhibition and protection. Int. J. Adv. Manuf. Technol. 2020, 106, 2119–2131. [Google Scholar] [CrossRef]
- Nosonovsky, M.; Bhushan, B. Green Tribology: Biomimetics, Energy Conservation and Sustainability; Springer: Berlin, Germany, 2012; ISBN 3642236804. [Google Scholar]
- Gao, L.; McCarthy, T.J. The “lotus effect” explained: Two reasons why two length scales of topography are important. Langmuir 2006, 22, 2966–2967. [Google Scholar] [CrossRef]
- Koch, K.; Bhushan, B.; Barthlott, W. Diversity of structure, morphology and wetting of plant surfaces. Soft Matter 2008, 4, 1943–1963. [Google Scholar] [CrossRef]
- Li, X.-M.; Reinhoudt, D.; Crego-Calama, M. What do we need for a superhydrophobic surface? A review on the recent progress in the preparation of superhydrophobic surfaces. Chem. Soc. Rev. 2007, 36, 1350–1368. [Google Scholar] [CrossRef]
- Ejenstam, L.; Ovaskainen, L.; Rodriguez-Meizoso, I.; Wågberg, L.; Pan, J.; Swerin, A.; Claesson, P.M. The effect of superhydrophobic wetting state on corrosion protection–The AKD example. J. Colloid Interface Sci. 2013, 412, 56–64. [Google Scholar] [CrossRef] [PubMed]
- Wang, Q.; Li, J.; Zhang, C.; Qu, X.; Liu, J.; Yang, Z. Regenerative superhydrophobic coating from microcapsules. J. Mater. Chem. 2010, 20, 3211–3215. [Google Scholar] [CrossRef]
- Lai, Y.; Lin, C.; Huang, J.; Zhuang, H.; Sun, L.; Nguyen, T. Markedly controllable adhesion of superhydrophobic spongelike nanostructure TiO2 films. Langmuir 2008, 24, 3867–3873. [Google Scholar] [CrossRef] [PubMed]
- Thieme, M.; Frenzel, R.; Schmidt, S.; Simon, F.; Hennig, A.; Worch, H.; Lunkwitz, K.; Scharnweber, D. Generation of ultrahydrophobic properties of aluminium–a first step to self-cleaning transparently coated metal surfaces. Adv. Eng. Mater. 2001, 3, 691–695. [Google Scholar]
- Badre, C.; Pauporte, T.; Turmine, M.; Lincot, D. Tailoring the wetting behavior of zinc oxide films by using alkylsilane self-assembled monolayers. Superlattices Microstruct. 2007, 42, 99–102. [Google Scholar] [CrossRef]
- Bok, H.-M.; Kim, S.; Yoo, S.-H.; Kim, S.K.; Park, S. Synthesis of perpendicular nanorod arrays with hierarchical architecture and water slipping superhydrophobic properties. Langmuir 2008, 24, 4168–4173. [Google Scholar] [CrossRef] [PubMed]
- Cao, L.; Price, T.P.; Weiss, M.; Gao, D. Super water-and oil-repellent surfaces on intrinsically hydrophilic and oleophilic porous silicon films. Langmuir 2008, 24, 1640–1643. [Google Scholar] [CrossRef] [PubMed]
- Cui, Z.; Wang, Q.; Xiao, Y.; Su, C.; Chen, Q. The stability of superhydrophobic surfaces tested by high speed current scouring. Appl. Surf. Sci. 2008, 254, 2911–2916. [Google Scholar] [CrossRef]
- Yao, X.; Song, Y.; Jiang, L. Applications of bio-inspired special wettable surfaces. Adv. Mater. 2011, 23, 719–734. [Google Scholar]
- Xu, Q.F.; Mondal, B.; Lyons, A.M. Fabricating superhydrophobic polymer surfaces with excellent abrasion resistance by a simple lamination templating method. ACS Appl. Mater. Interfaces 2011, 3, 3508–3514. [Google Scholar] [CrossRef] [PubMed]
- Wang, P.; Chen, M.; Han, H.; Fan, X.; Liu, Q.; Wang, J. Transparent and abrasion-resistant superhydrophobic coating with robust self-cleaning function in either air or oil. J. Mater. Chem. A 2016, 4, 7869–7874. [Google Scholar] [CrossRef]
- Helmer, D.; Keller, N.; Kotz, F.; Stolz, F.; Greiner, C.; Nargang, T.M.; Sachsenheimer, K.; Rapp, B.E. Transparent, abrasion-insensitive superhydrophobic coatings for real-world applications. Sci. Rep. 2017, 7, 15078. [Google Scholar] [CrossRef] [PubMed]
- Bai, X.; Xue, C.-H.; Jia, S.-T. Surfaces with sustainable superhydrophobicity upon mechanical abrasion. ACS Appl. Mater. Interfaces 2016, 8, 28171–28179. [Google Scholar] [CrossRef]
- Wang, H.; Zhu, Y.; Hu, Z.; Zhang, X.; Wu, S.; Wang, R.; Zhu, Y. A novel electrodeposition route for fabrication of the superhydrophobic surface with unique self-cleaning, mechanical abrasion and corrosion resistance properties. Chem. Eng. J. 2016, 303, 37–47. [Google Scholar] [CrossRef]
- Li, D.-W.; Wang, H.-Y.; Liu, Y.; Wei, D.-S.; Zhao, Z.-X. Large-scale fabrication of durable and robust super-hydrophobic spray coatings with excellent repairable and anti-corrosion performance. Chem. Eng. J. 2019, 367, 169–179. [Google Scholar] [CrossRef]
- Liu, Y.; Fu, K.; Liu, J.; Tian, Y.; Zhang, H.; Wang, R.; Zhang, B.; Zhang, H.; Zhou, F.; Zhang, Q. Design and preparation of a multi-fluorination organic superhydrophobic coating with high mechanical robustness and icing delay ability. Appl. Surf. Sci. 2019, 497, 143663. [Google Scholar] [CrossRef]
- Emelyanenko, A.M.; Shagieva, F.M.; Domantovsky, A.G.; Boinovich, L.B. Nanosecond laser micro-and nanotexturing for the design of a superhydrophobic coating robust against long-term contact with water, cavitation, and abrasion. Appl. Surf. Sci. 2015, 332, 513–517. [Google Scholar] [CrossRef]
- Xiang, T.; Chen, D.; Lv, Z.; Yang, Z.; Yang, L.; Li, C. Robust superhydrophobic coating with superior corrosion resistance. J. Alloy. Compd. 2019, 798, 320–325. [Google Scholar] [CrossRef]
- Bayer, I.S. On the durability and wear resistance of transparent superhydrophobic coatings. Coatings 2017, 7, 12. [Google Scholar] [CrossRef]
- Sataeva, N.E.; Boinovich, L.B.; Emelyanenko, K.A.; Domantovsky, A.G.; Emelyanenko, A.M. Laser-assisted processing of aluminum alloy for the fabrication of superhydrophobic coatings withstanding multiple degradation factors. Surf. Coat. Technol. 2020, 125993. [Google Scholar] [CrossRef]
- Wang, P.; Yao, T.; Sun, B.; Ci, T.; Fan, X.; Han, H. Fabrication of mechanically robust superhydrophobic steel surface with corrosion resistance property. RSC Adv. 2017, 7, 39699–39703. [Google Scholar] [CrossRef]
- She, Z.; Li, Q.; Wang, Z.; Li, L.; Chen, F.; Zhou, J. Researching the fabrication of anticorrosion superhydrophobic surface on magnesium alloy and its mechanical stability and durability. Chem. Eng. J. 2013, 228, 415–424. [Google Scholar] [CrossRef]
- Wenzel, R.N. Surface roughness and contact angle. J. Phys. Chem. 1949, 53, 1466–1467. [Google Scholar]
- Busscher, H.J.; Van Pelt, A.W.J.; De Boer, P.; De Jong, H.P.; Arends, J. The effect of surface roughening of polymers on measured contact angles of liquids. Colloids Surf. 1984, 9, 319–331. [Google Scholar] [CrossRef]
- Aslanidou, D.; Karapanagiotis, I.; Panayiotou, C. Tuning the wetting properties of siloxane-nanoparticle coatings to induce superhydrophobicity and superoleophobicity for stone protection. Mater. Des. 2016, 108, 736–744. [Google Scholar] [CrossRef]
- Murakami, D.; Jinnai, H.; Takahara, A. Wetting transition from the Cassie–Baxter state to the Wenzel state on textured polymer surfaces. Langmuir 2014, 30, 2061–2067. [Google Scholar] [CrossRef]
- Stern, M.; Geary, A.L. Electrochemical polarization I. A theoretical analysis of the shape of polarization curves. J. Electrochem. Soc. 1957, 104, 56–63. [Google Scholar] [CrossRef]
- Amirudin, A.; Thieny, D. Application of electrochemical impedance spectroscopy to study the degradation of polymer-coated metals. Prog. Org. Coat. 1995, 26, 1–28. [Google Scholar] [CrossRef]
© 2020 by the authors. Licensee MDPI, Basel, Switzerland. This article is an open access article distributed under the terms and conditions of the Creative Commons Attribution (CC BY) license (http://creativecommons.org/licenses/by/4.0/).