Abstract
(1) Background: The aim of the paper is to determine how selected staining liquids affect color stability and reflectance of six composite and compomer dental materials. (2) Methods: Six dental materials were chosen for this study: G-aenial (GC), Filtek Z550 (3M), Herculite XRV Ultra (Kerr), Compoglass (Ivoclar Vivadent), Dyract Extra (Dentsply), and Dyract Flow (Dentsply). Ten staining liquids were used (distilled water, tea, tea with sugar, coffee, coffee with sugar, Coca-Cola®, orange and currant juices, soy sauce, and wine). Staining was carried out at 37 °C. The measurements of the color difference (ΔE) and the color parameters were carried out on a Konica Minolta CM5 spetrocolorimeter at different staining times (1, 2, 4, 8, 24, 48, 72, and 168 h). The resulting color change of the dental materials upon staining is presented as plots of ΔE, diffuse-reflection spectra, and Maxwell’s triangle. (3) Results: Significant changes in lightness (ΔL) along with changes in the total color were observed for most materials. Color change was more pronounced in compomers than in composites. (4) Conclusions: Most materials change their color from light cream to light-brown and reddish after exposure to selected staining liquids.
1. Introduction
Smile is one of the first interactions between humans and constitutes an important factor for any future relation. Cosmetic dentistry is an essential part of dental services provided nowadays for patients of all ages. Changes in teeth structure, including their color, shape, and restorations (in particular, composite resin) are among the most popular procedures provided by dentists. However, all dental materials are exposed to organic pigments present in foods and drinks, which may cause their irreversible discoloration upon prolonged contact due to formation of a coated, colored layer. In order to discuss these changes, one has to take a closer look at the methodology of color assessment.
The Commission Internationale de l’Eclairage (CIE) L*a*b* (Lab) system is one of the most accurate systems for color discrimination used in Europe. At the same time, the NBS system (National Bureau of Standards) is widely used in the USA with a number of norms that modified and unified the CIE Lab system. One of the first studies of color of dental materials was published by Yamamoto in the 1980s [1,2]. In the CIE Lab system, color is described by the three orthogonal color coordinates: L*, a*, and b*. Here, the L* axis is normal to the a* and b* axes, giving information on the lightness, with the value of 0 corresponding to black, and 100 to white. At the same time, the values on the a* axis, which is normal to the b* axis, may be either positive or negative. The positive values of a* indicate red color contribution, and the negative values indicate green color contribution. Similarly, the values of the b* coordinate may be either positive and negative, with positive values indicating yellow color contribution, and negative values indicating blue color contribution.
The values of the color difference noticeable to an observer depend on the observer: (i) ΔE < 2.0—imperceptible differences or differences noticeable by an experienced observer; (ii) 2.1 < ΔE < 3.5: slightly perceptible differences; (iii) 3.6 < ΔE < 5.0: clearly perceptible differences; (iv) ΔE > 5: pronounced color differences [3]. The threshold of color difference perception by an average, although trained, observer equals ΔE = √3 ≈ 1.7 in the space of the L*, a*, b* coordinates as defined by the CIE Lab system. Generally, the change in each of these coordinates by one unit corresponds to the threshold in the color difference perception. However, the threshold of the color difference precision is variously defined in literature as ΔE between 1 and 2 by Knispel and Tung, ΔE = 3.7 by Haselton, and ΔE = 1.5 by Kolbeck [4,5,6,7]. For dental applications, it has been concluded that ΔE = 2.0 is the maximum value of color difference acceptable for practical applications of the materials; however, several authors define this value as ΔE = 3.3 [5,8,9,10] or even ΔE = 3.5 or 3.7 [6,11,12,13]. It should be noted that the CIE Lab system may be used for describing foods, natural resources, pharmaceuticals, and dental materials. The study of color stability of dental materials includes several aspects, including: (i) the best material color match to the patient teeth [9,14,15] and (ii) the influence of foods and drinks (coffee, tea, red wine, and juices) on the color [6,7,12,13,16].
The aim of the study was to investigate the properties of six selected dental materials, chosen from the groups of composite and compomer materials, to obtain information on how selected staining liquids affect the color stability and reflectance of these materials. We hypothesized that there are differences between the staining potential of selected liquids on selected dental materials (hypothesis No. 1). Furthermore, we wanted to determine whether there is any difference in color change between selected composites and compomers. The null hypothesis was that there are no differences between the materials and that staining liquids do not affect color stability and reflectance of the dental materials chosen for the study.
2. Materials and Methods
Six dental materials were chosen for this study. Composite materials included: G-aenial (GC) (S1), Filtek™ Z550 (3M) (S2), and Herculite XRV Ultra (Kerr) (S3); and compomers: Compoglass (Ivoclar Vivadent) (S4), Dyract® Extra (Dentsply) (S5), and Dyract® Flow (Dentsply) (S6).
G-aenial (GC) (S1) is a light-cured radiopaque hybrid composite restorative with a combination of two types of pre-polymerized resin fillers. They are produced by polymerizing a resin matrix in which micro-fillers were incorporated, and then milling the polymerized resin into particles averaging 16 to 17 μ in size. The matrix consists of a mixture of urethane dimethacrylate (UDMA) and dimethacrylate co-monomers. G-aenial is bis-GMA free.
Filtek™ Z550 (3M) (S2) is a nano hybrid, visible-light activated, radiopaque, restorative composite. The filler is a combination of surface modified zirconia/silica and 20 nm surface modified silica particles. The inorganic filler loading is 81.8% by weight (67.8% by volume), with the particle size of 20 nm for the silica and approximately 0.1–10 microns for the zirconia/silica. Filtek Z550 Nano Hybrid Universal Restorative contains BIS-GMA, UDMA, BISEMA, PEGDMA, and TEGDMA resins.
Herculite XRV Ultra (Kerr) (S3) is a nanohybrid composite material with an average filler particle size of 0.7 microns.
Compoglass (Ivoclar Vivadent) (S4) is a light-curing, radiopaque compomer-based restorative material. The monomer matrix is composed of dimethacrylates. The particle size is between 0.2 and 3.0 μm.
Dyract Extra (Dentsply) (S5) is a universal light-cured compomer-based restorative material.
Dyract Flow (Dentsply) (S6) is a semi-fluid, light-cured compomer with acidic monomers important in the polymerization. The materials that were chosen for the study included composite resin and compomer-based materials that are widely used for aesthetic restoration of dental hard tissues [17]. The study was designed in such way in order to include materials that may be suitable for restoration in aesthetic zones in all clinical scenarios, including not only the need for perfect color match (which is the property of composite resin materials), but also the location of the defect (e.g., subgingival cavities that constitute an indication for compomers), and the strength of the planned restoration [18,19].
Ten staining liquids were used, including distilled water, black tea, black tea with sugar, black coffee, black coffee with sugar, Coca-Cola®, orange and currant juices, soy sauce, and wine. The staining was carried out at 37 °C, simulating the conditions in the human oral cavity. The measurements of color difference (ΔE) and the color parameters, including Δa, Δb, and ΔL, were carried out using a Konica Minolta CM5 spetrocolorimeter at different staining times (1, 2, 4, 8, 24, 48, 72, and 168 h). The resulting color change of the dental materials upon staining is presented as plots of ΔE, diffuse-reflection spectra and Maxwell’s triangle.
The tests of the dental materials S1–S6 were performed using the following liquids:
- Distilled water at pH = 6.9 for control.
- Tea: One bag of black tea (Lipton Tea) was added to 300 mL of distilled boiled water. After 5 min of infusion time, the liquid was filtered. The second solution was prepared in the same way with 10 g of sugar added. The pH was 4.8 and 4.7 for plain tea and tea with sugar, respectively.
- Coffee: 3.6 g of coffee (NescafeTM) were added to 300 mL of distilled and boiled water and infused for 10 min; the liquid obtained was filtered through a paper filter. The second solution was prepared in the same way with 10 g of sugar added. The pH of coffee was 4.9, independently of the presence of sugar.
- Commercially available bottled Coca-Cola® (a registered trademark) (pH = 2.6), orange juice (Cappy, pH = 4.0), currant juice (Cappy, pH = 2.9), soy sauce (pH = 4.3), and red wine (Carlo Rossi, pH = 3.2) were all used without additional preparation.
Dental material specimens were placed in glass vials containing the staining liquids with their polished face up. The dish-shaped samples were made using a specially prepared transparent plastic mold. All samples were prepared in licensed dental laboratories strictly following the procedure and technological requirements. The surfaces of all samples were polished with fine-grain sand-paper PAP 201-1000. The diameter of the dish-shaped samples was 7 mm and they were 2 mm thick. The vials were stored at 37 °C. The color changes (ΔE) for all liquids and materials used were recorded after 1, 2, 4, 8, 24, 48, 72, and 168 h of staining. After each staining interval, the samples were washed by immersing them five times in distilled water, dried with a paper towel, and subjected to color determination on the two main surfaces, and the color measurements of all samples were performed. After the measurements, all samples were returned to the staining vials, with the procedure repeated after each subsequent time interval.
Color and spectral reflectance at the baseline and after staining were measured on the CIE Lab color scale using the Konica Minolta CM-5 spectrocolorimeter (Tokyo, Japan). The CM-5 is a universal spectrophotometer used for measuring the color of solids (granulates, discs, pastes, and powders, including dental materials) and liquids (oils, beer). The measurements may be done in the reflectance mode, both on solid samples and on powders/pastes in Petri dishes, using different cell paths, and the aperture size of 3 to 30 mm. The results are reported as spectral values, spectral graphs, colorimetric values, color-difference values, color-difference graphs, pass/fail judgment, pseudo-color, and color assessment. The spectral range is between 360 and 740 nm, with a pulsed xenon lamp used as an excitation source.
The following scale was used to classify the resulting color difference values (ΔE): the difference below 2.0 units in the CIE color space was classified as unnoticeable, between 2.1 and 3.5 units as slightly perceptible, between 3.6 and 5.0 units as clearly perceptible, and 5.1 units or over as pronounced.
3. Results
A summary of ΔE values at the end of the experiment is presented in Figure 1. ΔL values throughout the whole immersion process in all liquids for all materials are provided in Figure 2, Figure 3, Figure 4, Figure 5, Figure 6, Figure 7, Figure 8, Figure 9, Figure 10 and Figure 11, and they show an overall trend for each staining liquid.
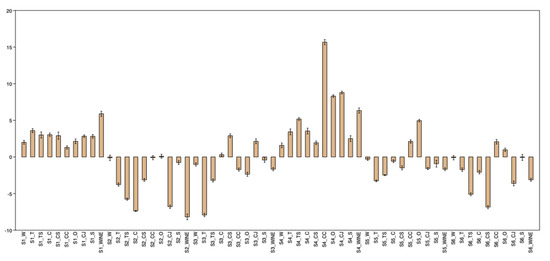
Figure 1.
ΔE values at the end of the experiment for all staining liquids. Suffixes denote the liquid (W—water, T—tea, TS—tea with sugar, C—coffee, CS—coffee with sugar, CC—Coca-Cola®, O—orange juice, CJ–currant juice, S–soy sauce, WINE–wine).
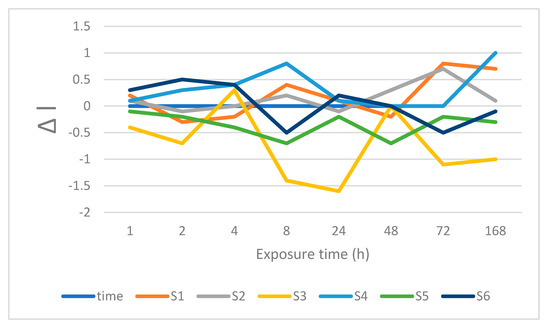
Figure 2.
Changes is lightness after immersion in water.
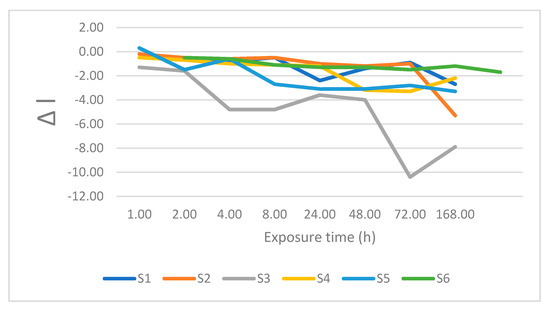
Figure 3.
Changes is lightness after immersion in tea.
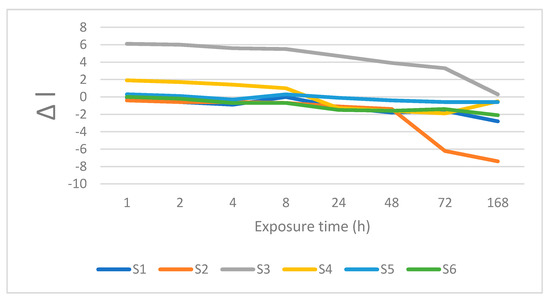
Figure 4.
Changes is lightness after immersion in coffee.
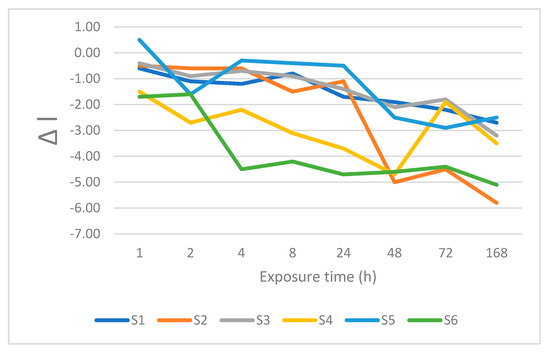
Figure 5.
Changes is lightness after immersion in sweetened tea.
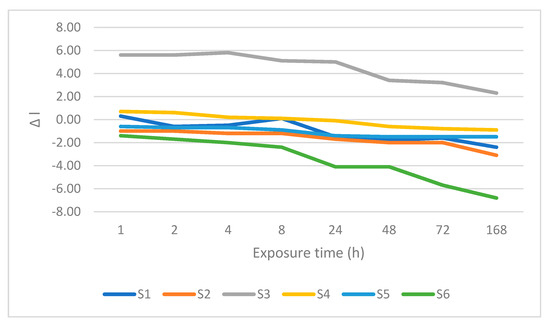
Figure 6.
Changes is lightness after immersion in sweetened coffee.
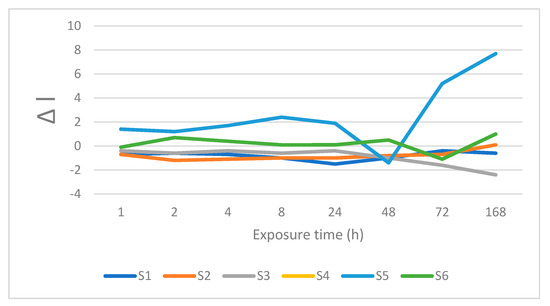
Figure 7.
Changes is lightness after immersion in orange juice.
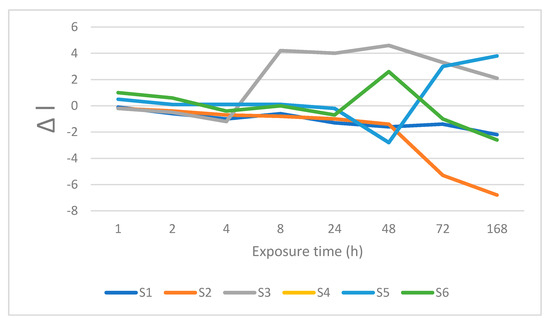
Figure 8.
Changes is lightness after immersion in currant juice.
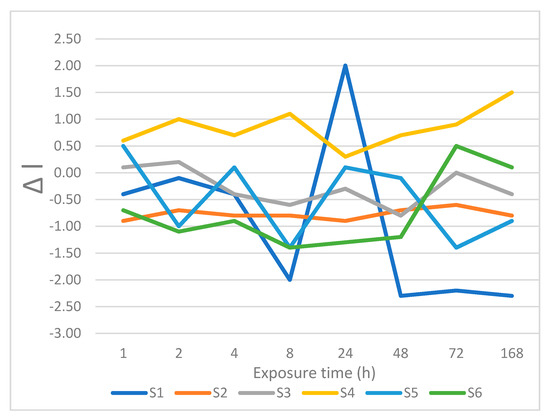
Figure 9.
Changes is lightness after immersion in soy sauce.
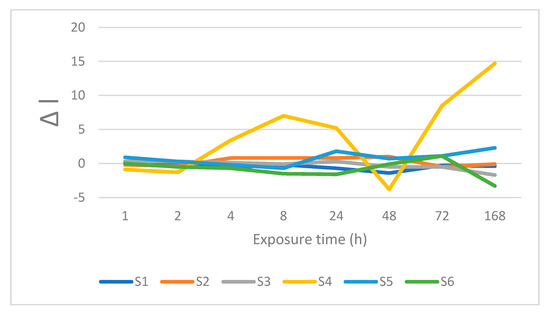
Figure 10.
Changes is lightness after immersion in Coca-Cola®.
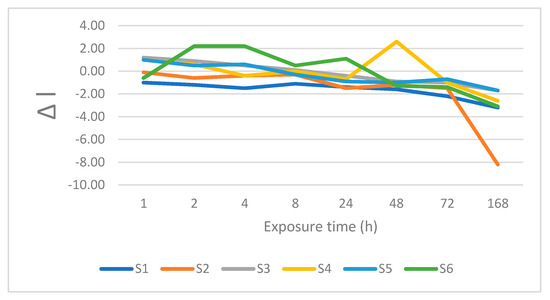
Figure 11.
Changes is lightness after immersion in wine.
Statistical analysis was performed with the use of Kruskal–Wallis ANOVA, with significance level set at 0.05. In order to determine statistical significance, ΔE values were compared for all staining liquids and all materials. The results are presented in Table 1, Table 2, Table 3, Table 4, Table 5, Table 6, Table 7, Table 8, Table 9 and Table 10 below. A narrative description of the most important findings is presented in Section 3.1, Section 3.2, Section 3.3, Section 3.4, Section 3.5 and Section 3.6.

Table 1.
Differences in ΔE after 168 h immersion in water.
Table 2.
Differences in ΔE after 168 h immersion in tea.
Table 3.
Differences in ΔE after 168 h immersion in water.
Table 4.
Differences in ΔE after 168 h immersion in coffee.
Table 5.
Differences in ΔE after 168 h immersion in coffee with sugar.
Table 6.
Differences in ΔE after 168 h immersion in Coca-Cola®.
Table 7.
Differences in ΔE after 168 h immersion in orange juice.
Table 8.
Differences in ΔE after 168 h immersion in currant juice.
Table 9.
Differences in ΔE after 168 h immersion in soy sauce.
Table 10.
Differences in ΔE after 168 h immersion in soy sauce.
3.1. Material S1
For Material S1, clearly perceptible differences with ΔE between 3.6 and 5.0 were recorded for tea, and tea with sugar. Imperceptible differences (ΔE < 2) were noted after immersion in water and Coca-Cola®. Slightly perceptible differences with ΔE between 2.1 and 3.5 were recorded for coffee, coffee with sugar, soy sauce, orange juice, and currant juice.
The majority of the staining liquids produced positive changes in Δa after 168 h of immersion, with the highest values observed tea, tea with sugar, and wine (Δa = 1.0). Low negative values of Δa were recorded after immersion in soy sauce, orange juice, and currant juice. The color difference Δb was positive for all staining liquids, with the highest value obtained for wine (Δb = 4.9). For most liquids, Δb increased monotonously, with the highest value achieved after 168 h.
The lightness value was universally lower after 168 h, with ΔL always negative, with the exception of distilled water. Concluding, after 168 h immersion of S1 in most of the staining liquids, the contributions of red and yellow became more pronounced than those of green and blue, respectively. The lightness decreased after immersion in almost every staining liquid.
3.2. Material S2
Pronounced differences with the ΔE > 5.1 were recorded for tea, tea with sugar, coffee, currant juice, and wine. The highest value of ΔE was recorded in tea with sugar as the staining liquid (ΔE = 16.1). At the same time, water, Coca-Cola®, orange juice, and soy sauce produced imperceptible color change, with ΔE below 2.
The highest negative Δa value was obtained after 168 h immersion into tea with sugar (Δa = −3.3). A significant negative value (Δa = −1.0) was obtained in currant juice. Rather small negative Δa values were obtained for orange juice and soy sauce. At the same time, the highest positive Δa values were recorded for coffee (Δa = 1.9) and wine (Δa = 1.1). Rather small positive values after 168 h immersion of S2 we obtained for water, tea, coffee with sugar, and Coca-Cola®. The Δb values were always positive, with the highest obtained for tea, tea with sugar, coffee, and wine, and the lowest for water, coffee with sugar, Coca-Cola®, orange juice, and currant juice. Soy sauce produced negative intermediate values of Δb (−0.9 after 4 h), with the final value Δb = 0 after 168 h.
A reduction in lightness (negative ΔL) was recorded for every staining liquid, with the exception of water (ΔL = 1.1 after 168 h) and orange juice. The most significant changes in lightness were recorded for tea, tea with sugar, coffee, coffee with sugar, currant juice, and wine. For most of the staining liquids, the lightness was changing monotonously in time. This material became greener in tea with sugar, currant juice, orange juice, and soy sauce, while coffee, wine, water, tea, coffee with sugar, and Coca-Cola® made it redder. Additionally, tea, tea with sugar, coffee and wine made it yellower. This material became darker in every staining liquid.
3.3. Material S3
This composite material produced distinct discoloration after 168h immersion in each of the staining liquids. The largest ΔE value was recorded for tea and coffee, ΔE = 14.7 and 8.9, respectively. Interestingly, added sugar reduced ΔE (5.1 for tea with sugar and 6.2 for coffee with sugar). A relatively large ΔE value was recorded for wine (ΔE = 8.2 after 168 h). The lowest values of ΔE were obtained in water and in Coca-Cola®—2.0 and 3.0, respectively. Water was the only liquid that produced ΔE below 2 with imperceptible differences after 168 h. Three staining liquids, including orange juice, currant juice, and soy sauce, produced ΔE between 3.6 and 5.0, with clearly perceptible differences.
Most staining liquids produced positive values of Δa after 168 h immersion, including the highest value for tea. Small negative Δa values were obtained for four staining liquids, including coffee with sugar, currant juice, soy sauce, and wine. Generally, red color contributed more than green color for this material. The Δb values after 168 h were always positive, independently on the staining liquid. The most significant changes were recorded for tea (11.3), coffee (8.9), wine (7.9), and coffee with sugar (5.5). Generally, contribution of yellow color increased at the cost of the blue color (negative values of Δb).
The largest change in lightness (ΔL) was obtained for tea. Generally, most staining liquids produced negative ΔL values. Low positive ΔL values were obtained for coffee (0.3), coffee with sugar (2.9), and currant juice (2.1).
3.4. Material S4
Tea with sugar, Coca-Cola®, orange juice, currant juice, and wine caused pronounced color differences (ΔE > 5.1) after 168 h. Pronounced color differences already appear for tea with sugar after 1 h immersion, remaining almost unchanged at later times. Higher ΔE values were obtained for Coca-Cola®. In the beginning, the color changes were imperceptible (ΔE = 1.2 after 1 h and 1.6 after 2 h); however, they increased to 5.3 after 4 h. The values recorded at later times all correspond to pronounced color differences. Orange juice produced monotonous growth of ΔE, starting from 2.4 (4 h) to 8.3 (168 h). Moreover, the initial changes (1 and 2 h) were relatively low, 1.5 and 1.8, respectively. The ΔE parameter was increasing for wine, with pronounced color differences after 168 h, ΔE = 6.3. At the same time, distilled water, coffee with sugar, and soy sauce produced only imperceptible or slightly perceptible color differences. In addition, coffee and tea caused slightly perceptible color differences throughout the entire staining period.
The staining liquids form two distinct groups, when it comes to Δa. The first group (distilled water, tea, tea with sugar, soy sauce, Coca-Cola®, currant juice, and wine) produced positive Δa values, whereas coffee, coffee with sugar, and orange juice produced negative Δa, values. Moreover, the positive values were typically higher than negative—for example, after 168 h immersion, Δa = 3.8 (currant juice) and Δa = −0.5 (coffee with sugar). Positive changes for Δb were recorded for distilled water, tea, tea with sugar, coffee, soy sauce, and coffee with sugar after 168 h immersion. At the same time, negative Δb values were recorded for Coca-Cola®, orange juice, currant juice, and wine.
Distilled water, soy sauce, Coca-Cola®, orange juice, and currant juice caused positive ΔL values, with negative values recorded for tea, tea with sugar, coffee, coffee with sugar, and wine. Note that monotonous decrease in lightness was recorded for tea and tea with sugar during the entire experiment. Added sugar in tea and coffee caused a small reduction in lightness.
3.5. Material S5
Water was the only liquid that did not cause perceptible color changes, with the strongest changes recorded for wine. Wine did not cause any perceptible changes up to 8 h (ΔE < 2), with the changes becoming slightly perceptible at 24 h (ΔE = 2.3) and pronounced starting from 48 h (ΔE > 5.1). Slightly perceptible color differences by the end of the experiment were recorded for coffee, Coca-Cola®, and soy sauce. Clearly perceptible color differences were recorded for tea, tea with sugar, coffee with sugar, orange juice, and currant juice. Interestingly, coffee with sugar and orange juice produced ΔE > 2 right from the beginning of the experiment. Additionally, currant juice caused clearly perceptible differences already at 4 h, which remained almost unchanged until the end of the measurements.
The values of Δa were positive by the end of the experiment, with the exception of wine, staying rather small—for example, 0.6 in currant juice and distilled water. At the same time, we recorded Δa = −4.1 for wine. Wine enhanced the green color contribution, whereas all the other staining liquids enhanced the red color contribution. With the exception of the distilled water (Δb = −0.3 after 168 h immersion), the values by the end of the experiment are positive with the highest Δb = 17.9 for wine. Therefore, every staining liquid enhanced the contribution of the yellow color.
Most of the staining liquids caused negative ΔL values, including distilled water, tea, tea with sugar, coffee, coffee with sugar, currant juice, soy sauce, and wine, with positive values recorded only for Coca-Cola® and orange juice.
3.6. Material S6
Pronounced color differences by the end of the experiment (ΔE > 5.1) were recorded for tea with sugar, coffee with sugar, currant juice, and soy sauce. Coffee with sugar produced only imperceptible differences of color from 1 to 4 h with ΔE < 2. The value at 8 h corresponds to slightly perceptible color difference with ΔE = 2.4. Clearly perceptible color differences for coffee with sugar were recorded after 24 h, with ΔE = 4.7. Pronounced color differences were obtained between 48 and 168 h (ΔE = 10.0 in 168 h). Some staining liquids caused smaller color changes after 168 h, including coffee, orange juice, and wine, with ΔE between 3.6 and 5.0, corresponding to clearly perceptible color differences. Slightly perceptible color differences after 168 h were recorded for tea and Coca-Cola®. Only distilled water by the end of the experiment caused imperceptible color differences.
Four of the staining liquids, including tea, Coca-Cola®, currant juice, and wine produced positive values of Δa, corresponding to an increased contribution of red color. The values of Δa by the end of the experiment vary between staining liquids—for example, 3.0 for currant juice but only 0.2 for tea. Two of the staining liquids caused no changes by the end of the experiment (distilled water and coffee with sugar, ΔE = 0). However, green color contribution increased for tea with sugar, coffee, orange juice, and soy sauce, with the highest value for soy sauce, Δa = −3.2 and the lowest for coffee and tea with sugar (−0.5). The contribution of yellow and blue colors is expressed by the value of Δb. Positive Δb values correspond to increased yellow color contribution, while negative values correspond to increased blue color contribution. Positive values of Δb were recorded for tea, tea with sugar, coffee, coffee with sugar, orange juice, and soy sauce. The highest value of Δb by the end of the experiment was 10.7 (soy sauce) and the lowest 2.3 (tea). The negative values of Δb were less pronounced, varying from −0.8 for wine to −0.2 for distilled water.
Negative lightness changes were recorded for most staining liquids by the end of the experiment, except for Coca-Cola®, orange juice, and soy sauce that produced positive ΔL values.
3.7. Discussion
The measurements were performed on three dental composites (S1: G-aenial (GC), S2: Filtek™ Z550 (GC), and S3: Herculite XRV Ultra) and three dental compomers (S4: Compoglass (Invoclar Vivadent), S5: Dyract® Extra (Dentsply), and S6: Dyract® Flow (Dentsply)) before and after immersion into staining liquids, including distilled water, tea, tea with sugar, coffee, coffee with sugar, Coca-Cola®, orange juice, currant juice, soy sauce, and wine. The selection of products included commercially available liquids, most of which were used in other studies [12,20] We measured color differences, as characterized by ΔE, using a Konica Minolta CM-5 spectrocolorimeter after 1, 2, 4, 8, 24, 48, 72, and 168 h of immersion. Additionally, we measured the color parameters, including Δa, Δb, and ΔL for all of the examined dental materials and staining liquids. The color changes varied in function of the dental material and staining liquid. Most of the dental materials suffered significant changes in lightness (ΔL) along with changes in the total color, with the samples generally becoming darker. Moreover, the samples generally became more yellow due to changes in the Δa color parameter.
Discoloration of dental restorative materials constitutes a significant challenge in modern dentistry whose aim is to recreate dental morphology in a repeatable and stable manner [21]. Unfortunately, we found that most of the dental materials changed their color from light cream to yellowish or light-brown after exposure to selected staining liquids. Therefore, the null hypothesis was rejected.
In our study, among composites, the weakest total color change was recorded for S1. Generally, only wine after 168 h caused pronounced color difference, with slight or clearly perceptible color differences for the majority of the staining liquids. This is similar to the observation made by Falkensammer et al. who also observed that red wine possesses mostly pronounced discoloration potential [22]. Composites S2 and S3 had a lower resistance in terms of the total color change. Both these composites suffered pronounced color change after 168 h for five staining liquids, including wine, coffee, and tea. Imperceptible color differences were recorded for four immersion liquids (material S2) and only in distilled water (material S3) by the end of the experiment, while other staining liquids caused clearly or slightly perceptible color differences. This can be attributed both to intrinsic colorants present in foods, but also to the internal structure of the material and to its surface properties. When it comes to the composition of the materials, both the size of particles and the type of the resin may influence it, as it is generally accepted that higher water sorption results in higher discoloration rate [23] Nanofiller composites absorb the dyes easier than microhybrids. Research studies show that acidic drinks, e.g., Coca-Cola®, increase surface roughness, which causes the specimens to absorb extrinsic substances to a higher extent [24]. One cannot omit the issue of surface polishing and preparation, which, when performed correctly, may also affect the discoloration rate [25,26,27]. Additionally, pH within the oral cavity and the food may influence the whole discoloration process; it is generally accepted that the lower the pH value, the quicker the process [28]. This may be a factor that limits the change in color of glass-ionomers and compomers, as the release of ions may increase salivary pH values [29]. Some researchers also suggest that some molecules—e.g., alcohol in wine—may penetrate the resin matrix, which will further accelerate the whole process [30].
For compomers, the change in color was more pronounced than for the composites, especially by the end of the experiment. Material S5 suffered slight or clearly perceptible color changes for most of the staining liquids, while wine caused pronounced color change in two different colors. At the same time, materials S4 and S6 suffered pronounced color change for five and four staining liquids, respectively, including currant juice and tea with sugar. Interestingly, imperceptible color differences were recorded in two staining liquids for S4 and only one staining liquid for S5 and S6. However, these materials are mainly indicated for particular cases, e.g., when caries control is required at the highest level possible [31].
The majority of the tested dental materials, composites and compomers included, became redder upon staining. The contribution of red was larger than that of the green color. This was the case for various staining liquids, including tea, tea with sugar, wine, coffee, currant juice, and Coca-Cola®. Note that the negative values of Δa associated to increased green color contribution are rather low for any combination of staining liquid and dental material. Furthermore, most of the materials became more yellow upon staining. Positive values of Δb were usually larger than any negative values. This implies larger yellow color contributions as opposed to blue color, upon immersion into wine, tea, tea with sugar, coffee, coffee with sugar, soy sauce, and orange juice. However, it seems that not only extrinsic factors may be associated with it, but also the concentration of photoinitiators (e.g., tertiary amines) or their degradation may contribute to it significantly, which has been proven by Schneider et al. [32].
Nevertheless, in clinical conditions, the issue of color will be also influenced by a variety of patient-related factors, such as inappropriate dietary habits, addictions (smoking, vaping), and poor oral hygiene [12,33]. At this point, it may be worth remembering that even certain mouth rinses may cause the material to deteriorate due to color change. That is why the issue and research into dental material color stability is a multifaceted issue that requires further studies in order to allow dental clinicians to provide the best dental care, even to the most demanding patients.
4. Conclusions
In our in vitro studies the samples of examined materials did not undergo any hygienic procedures, and also were not influenced by any diet type or amount of food. However, the limitations described above do not render our results invalid. The methodology we used employs exposure times commonly accepted for the investigation of chemical and physical properties of dental materials—their strength, chemical stability, and, i.e., color change. It seems reasonable to continue investigations aimed at recognizing mechanisms of loss of color stability of dental materials, especially composites and compomers, as they are the most widely used materials in daily dental practice. The direction of other research studies should include both professional oral hygiene procedures, as well as the influence of salivary components, such as, e.g., enzymes. As it has been shown that several of them may influence color stability of composite resin-based dental restorative materials, it could be worth to take a closer look at their influence in the in vitro environment first and the clinical environment later. As the environment of the oral cavity exhibits significant differences not only among individual patients but also over time, other trials are recommended.
The outcomes of all research studies may become beneficial both for the clinicians, and the patients. Thanks to them, it may be much easier for dental professionals to choose the most appropriate material for each clinical situation. Color stability may be highly beneficial for patients, as restoration discoloration constitutes a reason for restoration replacement, as it may suggest in a misleading way that the caries process remains active in the patient. That is why materials whose color remains the same over time may prevent the patient from an unnecessary loss of tooth structure over time, and, therefore, to retain their own teeth for as long as possible. All these factors have significant importance in the contemporary patient-centered management strategies of dental caries and trauma.
Author Contributions
Conceptualization, M.S.; data curation, M.G., K.G., and M.S.; formal analysis, M.G., K.G., W.E., E.P., and M.S.; funding acquisition, M.S.; investigation, M.G. and K.G.; methodology, M.G., K.G., B.C., and M.S.; project administration, M.G., K.G., B.C., E.P., and M.S.; software, W.E. and M.S.; supervision, B.C. and M.S.; validation, M.S.; visualization, M.G., K.G., W.E., B.C., E.P., and M.S.; writing—original draft, M.G., K.G., and W.E.; writing—review and editing, W.E., B.C., E.P., and M.S. All authors have read and agreed to the published version of the manuscript.
Funding
This research received no external funding.
Acknowledgments
The authors would like to thank Igor Khmelinskii (Universidade do Algarve, Campus de Gambelas, Faro, Portugal), Mateusz Gierszewski (Faculty of Chemistry, Adam Mickiewicz University, Poznań, Poland), Joanna Maćkowiak, and Martyna Szeląg for their support and help with the technical aspects of the study.
Conflicts of Interest
The authors declare no conflict of interest. The funders had no role in the design of the study; in the collection, analyses, or interpretation of data; in the writing of the manuscript, or in the decision to publish the results.
References
- Yamamoto, M. Value conversion system—A new procedure for modification of ceramic color under special conditions of color brightness (1). Quintessenz Zahntech. 1991, 17, 929–962. [Google Scholar] [PubMed]
- Yamamoto, M. Value conversion system—A new procedure for modification of ceramic color under special conditions of color brightness (2). Quintessenz Zahntech. 1991, 17, 1067–1087. [Google Scholar] [PubMed]
- Stokman, H.M.G.; Gevers, T.; Koenderink, J.J. Color measurement by imaging spectrometry. Comput. Vis. Image Underst. 2000, 79, 236–249. [Google Scholar] [CrossRef]
- Knispel, G. Factors affecting the process of color matching restorative materials to natural teeth. Quintessence Int. 1991, 22, 525–531. [Google Scholar] [PubMed]
- Tung, F.F.; Goldstein, G.R.; Jang, S.; Hittelman, E. The repeatability of an intraoral dental colorimeter. J. Prosthet. Dent. 2002, 88, 585–590. [Google Scholar] [CrossRef] [PubMed]
- Haselton, D.R.; Diaz-Arnold, A.M.; Dawson, D.V. Color stability of provisional crown and fixed partial denture resins. J. Prosthet. Dent. 2005, 93, 70–75. [Google Scholar] [CrossRef]
- Kolbeck, C.; Rosentritt, M.; Lang, R.; Handel, G. Discoloration of facing and restorative composites by UV-irradiation and staining food. Dent. Mater. 2006, 22, 63–68. [Google Scholar] [CrossRef]
- Janda, R.; Roulet, J.; Latta, M.; Steffin, G.; Rüttermann, S. Color stability of resin-based filling materials after aging when cured with plasma or halogen light. Eur. J. Oral Sci. 2005, 113, 251–257. [Google Scholar] [CrossRef]
- Guan, Y.H.; Lath, D.L.; Lilley, T.H.; Willmot, D.R.; Marlow, I.; Brook, A.H. The measurement of tooth whiteness by image analysis and spectrophotometry: A comparison. J. Oral Rehabil. 2005, 32, 7–15. [Google Scholar] [CrossRef]
- Ikeda, T.; Sidhu, S.K.; Omata, Y.; Fujita, M.; Sano, H. Colour and translucency of opaque-shades and body-shades of resin composites. Eur. J. Oral Sci. 2005, 113, 170–173. [Google Scholar] [CrossRef]
- Reich, S.; Hornberger, H. The effect of multicolored machinable ceramics on the esthetics of all-ceramic crowns. J. Prosthet. Dent. 2002, 88, 44–49. [Google Scholar] [CrossRef] [PubMed]
- Ertas, E.; Gueler, A.U.; Yuecel, A.C.; Koepruelue, H.; Gueler, E. Color stability of resin composites after immersion in different drinks. Dent. Mater. J. 2006, 25, 371–376. [Google Scholar] [CrossRef] [PubMed]
- Guler, A.U.; Yilmaz, F.; Kulunk, T.; Guler, E.; Kurt, S. Effects of different drinks on stainability of resin composite provisional restorative materials. J. Prosthet. Dent. 2005, 94, 118–124. [Google Scholar] [CrossRef]
- Ertan, A.A.; Şahin, E. Colour stability of low fusing porcelains: An in vitro study. J. Oral Rehabil. 2005, 32, 358–361. [Google Scholar] [CrossRef] [PubMed]
- Cal, E.; Güneri, P.; Kose, T. Comparison of digital and spectrophotometric measurements of colour shade guides. J. Oral Rehabil. 2006, 33, 221–228. [Google Scholar] [CrossRef]
- Villalta, P.; Lu, H.; Okte, Z.; Garcia-Godoy, F.; Powers, J.M. Effects of staining and bleaching on color change of dental composite resins. J. Prosthet. Dent. 2006, 95, 137–142. [Google Scholar] [CrossRef]
- Paolone, G.; Orsini, G.; Manauta, J.; Devoto, W.; Putignano, A. Composite shade guides and color matching. Int. J. Esthet. Dent. 2014, 9, 164–182. [Google Scholar]
- Akbulut, M.B.; Uyar Arpaci, P.; Unverdi Eldeniz, A. Effects of novel root repair materials on attachment and morphological behaviour of periodontal ligament fibroblasts: Scanning electron microscopy observation. Microsc. Res. Tech. 2016, 79, 1214–1221. [Google Scholar] [CrossRef]
- Yoon, M.; Kim, J.-S.; Yoo, S.-H. Changes of compressive strength and microhardness of composite resin, giomer and compomer after thermocycling treatment. J. Korean Acad. Pediatr. Dent. 2010, 37, 438–444. [Google Scholar]
- Ayad, N.M. Susceptibility of restorative materials to staining by common beverages: An in vitro study. Eur. J. Esthet. Dent. 2007, 2, 236–247. [Google Scholar]
- Poggio, C.; Ceci, M.; Beltrami, R.; Mirando, M.; Wassim, J.; Colombo, M. Color stability of esthetic restorative materials: A spectrophotometric analysis. Acta Biomater. Odontol. Scand. 2016, 2, 95–101. [Google Scholar] [CrossRef] [PubMed]
- Falkensammer, F.; Arnetzl, G.V.; Wildburger, A.; Freudenthaler, J. Color stability of different composite resin materials. J. Prosthet. Dent. 2013, 109, 378–383. [Google Scholar] [CrossRef]
- Barutcigil, Ç.; Yıldız, M. Intrinsic and extrinsic discoloration of dimethacrylate and silorane based composites. J. Dent. 2012, 40, e57–e63. [Google Scholar] [CrossRef] [PubMed]
- Kumari, R.V.; Nagaraj, H.; Siddaraju, K.; Poluri, R.K. Evaluation of the effect of surface polishing, oral beverages and food colorants on color stability and surface roughness of nanocomposite resins. J. Int. Oral Health 2015, 7, 63–70. [Google Scholar] [PubMed]
- Bagheri, R.; Burrow, M.F.; Tyas, M. Influence of food-simulating solutions and surface finish on susceptibility to staining of aesthetic restorative materials. J. Dent. 2005, 33, 389–398. [Google Scholar] [CrossRef] [PubMed]
- Ren, Y.-F.; Feng, L.; Serban, D.; Malmstrom, H.S. Effects of common beverage colorants on color stability of dental composite resins: The utility of a thermocycling stain challenge model in vitro. J. Dent. 2012, 40, e48–e56. [Google Scholar] [CrossRef]
- Alandia-Roman, C.C.; Cruvinel, D.R.; Sousa, A.B.S.; Pires-de-Souza, F.C.P.; Panzeri, H. Effect of cigarette smoke on color stability and surface roughness of dental composites. J. Dent. 2013, 41, e73–e79. [Google Scholar] [CrossRef]
- Azer, S.S.; Hague, A.L.; Johnston, W.M. Effect of pH on tooth discoloration from food colorant in vitro. J. Dent. 2010, 38, e106–e109. [Google Scholar] [CrossRef]
- Nicholson, J.W.; Aggarwal, A.; Czarnecka, B.; Limanowska-Shaw, H. The rate of change of pH of lactic acid exposed to glass-ionomer dental cements. Biomaterials 2000, 21, 1989–1993. [Google Scholar] [CrossRef]
- Catelan, A.; Briso, A.L.F.; Sundfeld, R.H.; Goiato, M.C.; dos Santos, P.H. Color stability of sealed composite resin restorative materials after ultraviolet artificial aging and immersion in staining solutions. J. Prosthet. Dent. 2011, 105, 236–241. [Google Scholar] [CrossRef]
- Barutcigil, Ç.; Harorli, O.T.; Yildiz, M.; Özcan, E.; Arslan, H.; Bayindir, F. The color differences of direct esthetic restorative materials after setting and compared with a shade guide. J. Am. Dent. Assoc. 2011, 142, 658–665. [Google Scholar] [CrossRef] [PubMed]
- Schneider, L.F.J.; Pfeifer, C.S.C.; Consani, S.; Prahl, S.A.; Ferracane, J.L. Influence of photoinitiator type on the rate of polymerization, degree of conversion, hardness and yellowing of dental resin composites. Dent. Mater. 2008, 24, 1169–1177. [Google Scholar] [CrossRef] [PubMed]
- Gawriołek, M.; Sikorska, E.; Ferreira, L.F.V.; Costa, A.I.; Khmelinskii, I.; Krawczyk, A.; Sikorski, M.; Koczorowski, P.R. Color and luminescence stability of selected dental materials in vitro. J. Prosthodont. Implant. Esthet. Reconstr. Dent. 2012, 21, 112–122. [Google Scholar] [CrossRef] [PubMed]
© 2020 by the authors. Licensee MDPI, Basel, Switzerland. This article is an open access article distributed under the terms and conditions of the Creative Commons Attribution (CC BY) license (http://creativecommons.org/licenses/by/4.0/).