1. Introduction
Aluminium 2024 alloy is popular in automotive and aircraft applications due to its good density-to-strength ratio [
1]. The good mechanical properties are achieved by precipitation hardening during heat treatment processes [
2,
3,
4]. Aluminium alloys of the Al–Cu–Mg system tend to have very complicated microstructures [
5]. On the microscopic level, there are intermetallic particles formed during solidification. In 2024 alloys, their formation is mostly connected with the presence of Fe and Si alloying additions. These chemical elements have poor solubility in the alpha solution of the alloy; therefore, they tend to form complicated phase constituents, such as Al
4Cu
2Mg
8Si
7 and AlCuFeMnSi [
6,
7]. Another kind of particles are precipitates of strengthening phases, forming during solution treatment and aging, known as S—Al
2CuMg and θ—Al
2Cu. They can have very different sizes, from nanometers up to a couple of microns [
8,
9,
10].
There is a relatively small number of studies dealing with nanoindentation measurements of intermetallic particles in aluminium alloys. Radutoiu et al. published results of the hardness and elastic moduli of both intermetallic and S particles after different heat treatments and found particles of Al(Cu,Mn,Fe,Si) to be considerably harder [
11].
To date, several studies have investigated the hardness of 2024 alloy with numerical analysis. For example, Moy et al. used a method of inversed analysis for predicting the mechanical properties of an alloy by combining finite element simulation with experimental results [
12]. A similar approach was adopted by Kang et al. to develop a numerical method for determining properties from only one indentation curve, thus using only a single measurement [
13].
Intermetallic particles containing Fe and Si tend to have irregular shapes. Therefore, the depth of the particle under the examined surface is unknown and impossible to determine before the measurement. Despite nanoindentation being the most accurate technique for determining local properties in heterogeneous materials, it still has its limitations. The result is, in reality, an approximation of the properties from a whole indentation area that might consist of several different contributing components. The main challenge faced by many researchers is evaluating the real properties of the bulk material that creates the inhomogeneity, such as a precipitate.
It is generally agreed that the accuracy of the nanoindentation measurement of a film is strongly dependent on the penetration-depth-to-film-thickness ratio. Buckle’s law describes that the penetration depth should be no greater than 1/10 of the examined film thickness [
14].
Cleymand et al. proved experimentally that Buckle’s law is not sufficient for measurements of Young’s modulus [
15]. According to their findings, the maximum depth of an indentation should be equal to or less than 1% of the film thickness. This can be unattainable for the size of precipitates and intermetallics in hardened aluminium alloys. Kralik and Nemecek compared different nanoindentation methods for measuring the local properties of a heterogeneous aluminium alloy and came to the conclusion that the Berkovich indenter gives more locally precise results since it affects a much smaller portion of the material than, for example, a round tip [
16].
Lipa et al. performed a study of the mechanical properties of SiOC microspheres with nanoindentation and compared the results to those of a finite element simulation [
17]. Numerical simulations might provide a useful tool for determining the influence of a particle’s shape and size on the accuracy of hardness and elastic modulus measurements. They allow testing several different geometries at the same time and the quick adjustment of parameters.
2. Materials and Methods
The chemical composition of the examined 2024 alloy is given in
Table 1. It was estimated by using x-ray spectroscopy on a Siemens SRS 303 machine (Siemens AG, Munich, Germany). The samples were cut from the Ø20 mm rod into 10 mm slices and then subjected to solution treatment at 500 °C for 4 h, before being aged at 180 °C for 10 h in an open-air furnace. When not examined, they were stored in the freezer at −18 °C to avoid further natural aging. Before nanoindentation, samples were prepared according to the standard procedure for metallographic observations; they were firstly polished with SiC papers up to 2400 grade and, for finishing, polished with 0.03 μm colloidal silica. The intermetallic phases are hard to observe with optical microscopy; therefore, they required observations with electron microscopy.
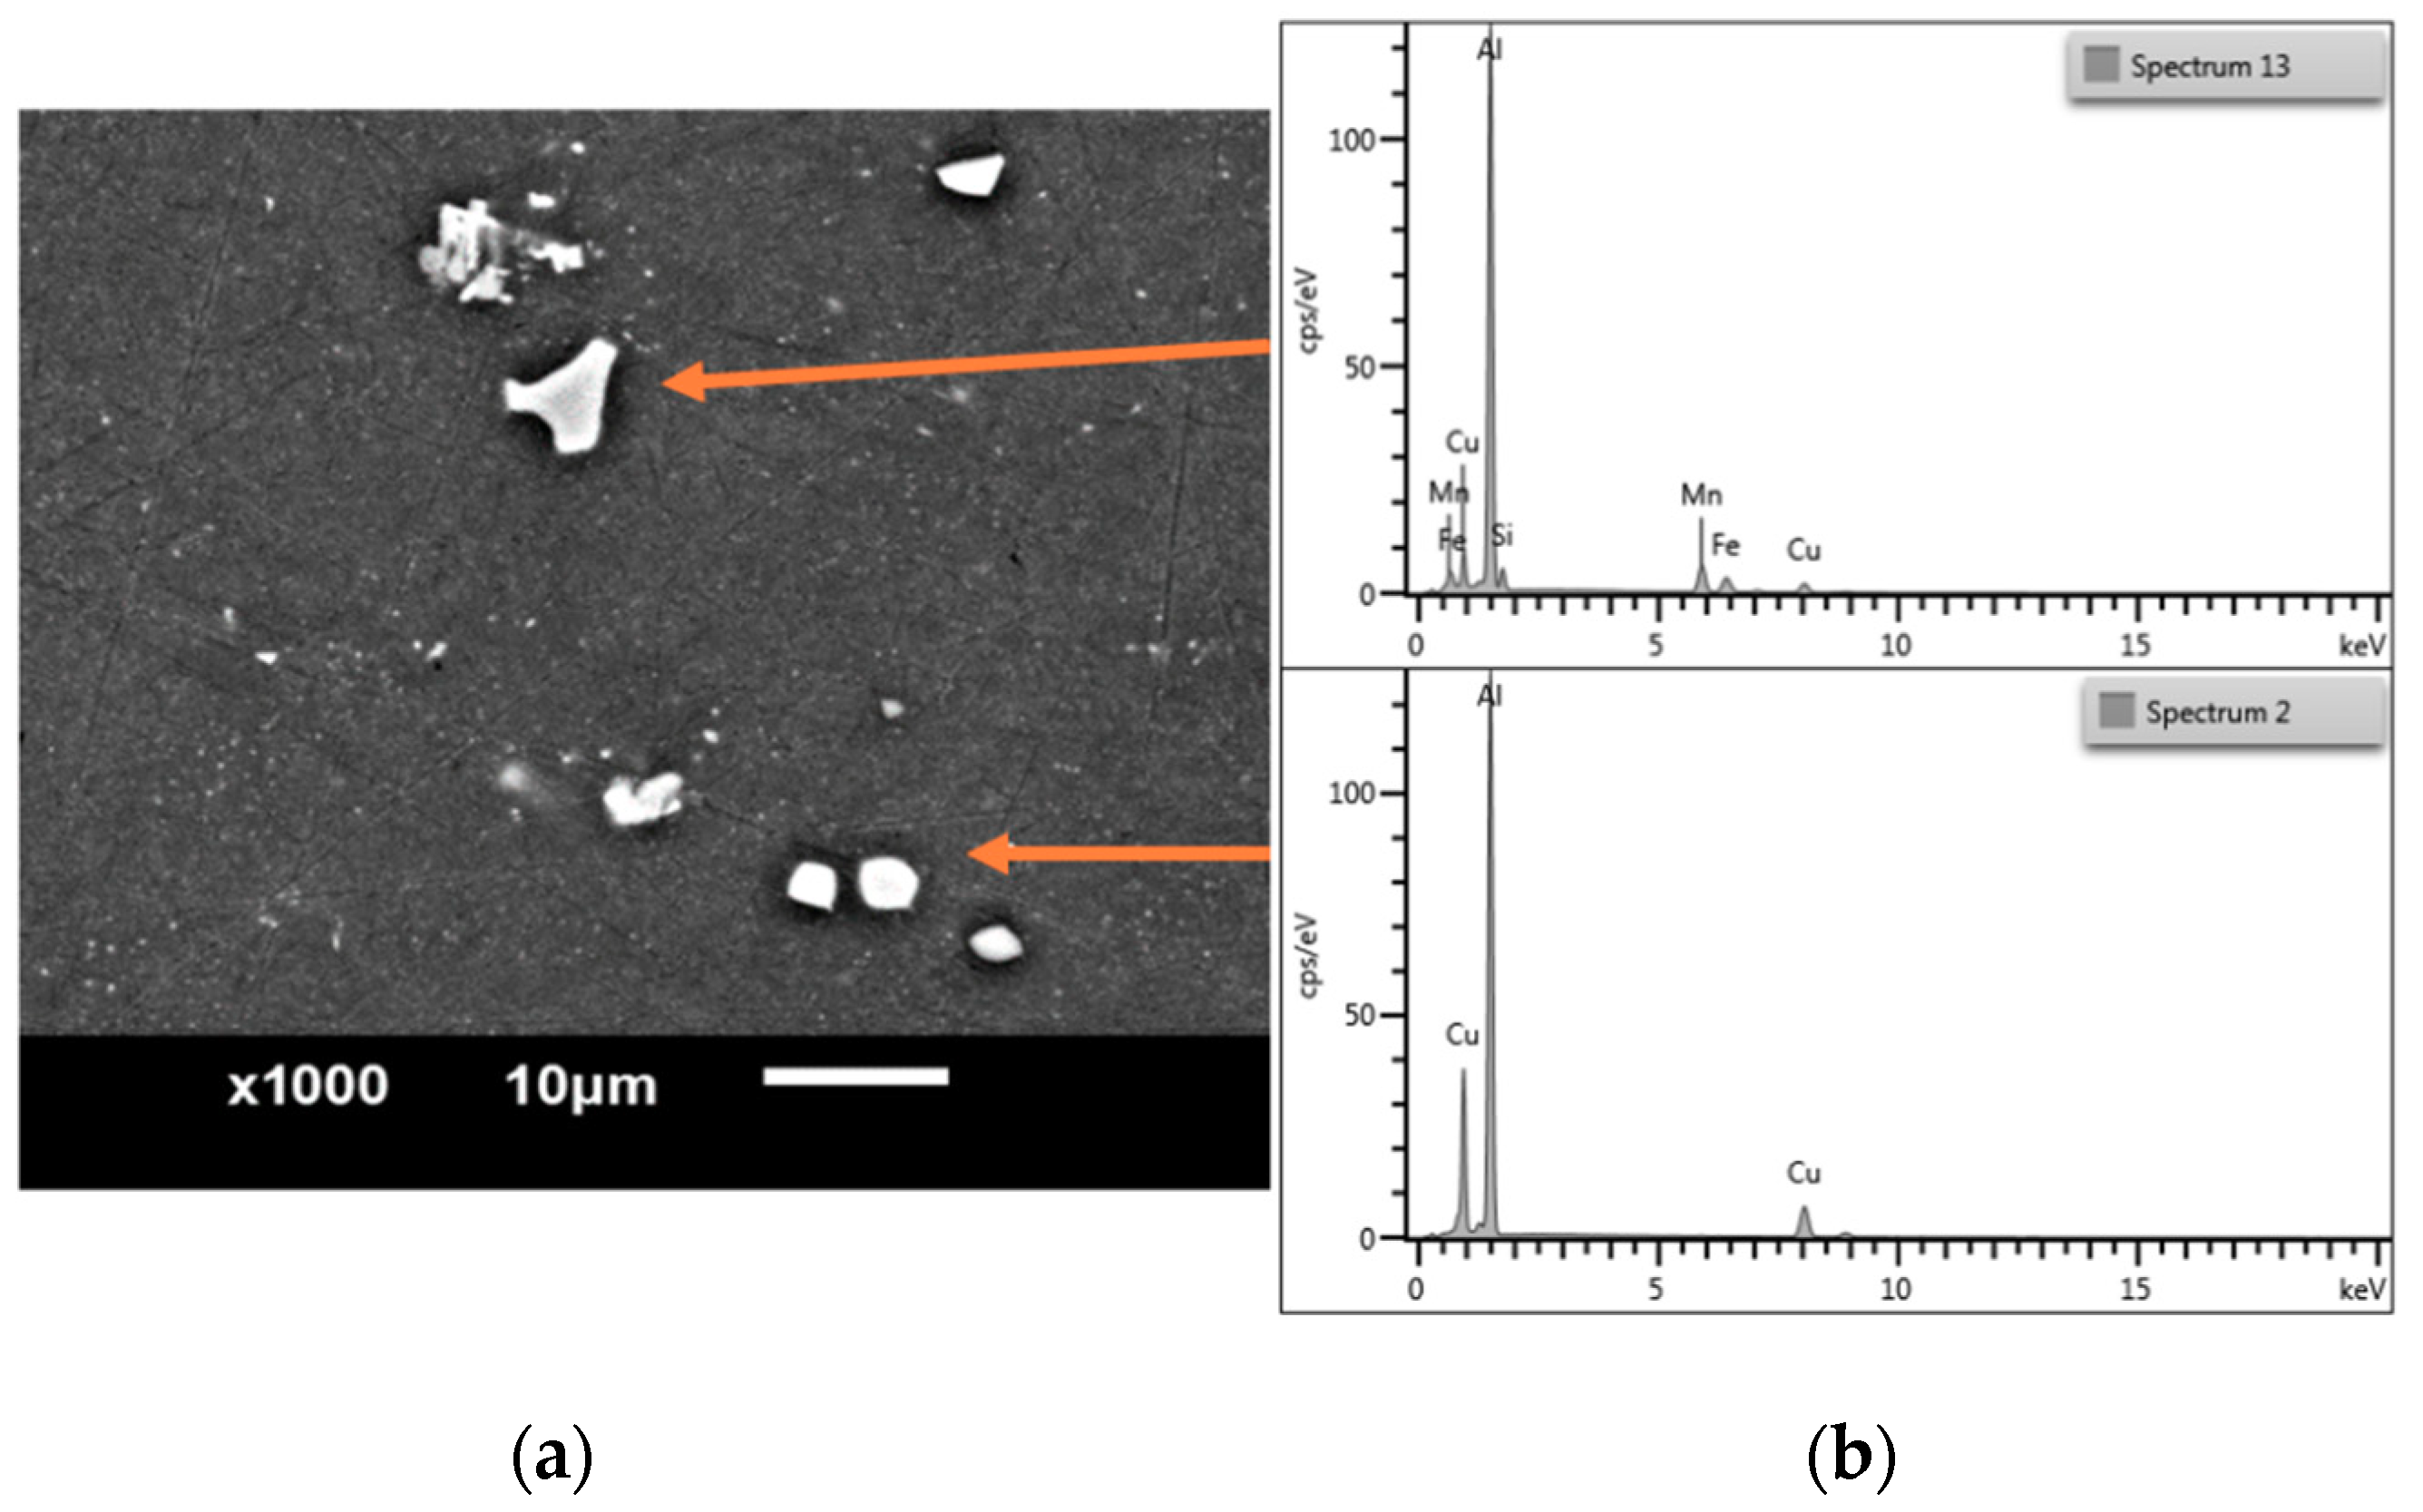
The microstructures of the samples were analysed with scanning electron microscopy (SEM). JEOL JSM-6610LV equipment (JEOL USA Company, Peabody, MA, USA) was used with an EDS X-MAX 80 Oxford Instruments system; the observations were made with an accelerating voltage of 20 keV. The micrographs were taken in the areas containing particles, to observe their shapes and sizes. Analysis of the images revealed that there were two main types of particle present, smaller ones with a rounded shape and bigger ones with more irregular shapes, as shown in
Figure 1.
The identification of the visible phases was based on energy dispersive spectroscopy (EDS) combined with the previous research performed on this alloy and the literature. Smaller and round particles were identified as Al
2Cu and Al
2CuMg. Those two types were present simultaneously in similar numbers in the volume of the sample. Their chemical composition corresponds to phases θ and S, respectively, which are typically observed as the strengthening phase in aged alloys. However, the particles observed were most probably formed during the solidification of the alloy and did not dissolve during further heat treatment. Similar observations in the alloy 2024 were made by Bucheit et al. [
18], Guillaumin and Mankowski [
19], and Boag et al. [
5]. The other type of particle was bigger and more irregular in shape. The EDS results revealed that the particles contained different amounts of Al, Cu, Fe, Mn, Mg, and Si, and they differed in almost every particle. Multiple studies on the topic of intermetallics in 2024 alloy mention it is particularly hard to identify those particles with accurate composition. Phases such as Al
7CuFe
2, Al
6MnFe
2, (Al,Cu)
6Mn, Al
6(Cu,Fe,Mn), Al
8Fe
2Si, Al
10Fe
2Si or Al
12(Fe,Mn)
3Si were previously found among particles similar to those found in this study [
5,
18,
19,
20]. The latest research concluded that most of the phases recognized as large intermetallics in this alloy can be described by the formula Al
3(Cu
xFe
yMn
1−x−y), where 0.45 <
x < 0.86, 0.15 <
y < 0.32, and 0.1 < 1 −
x −
y < 0.5 [
21,
22]. In conclusion, since there is huge variation in the chemical composition of the particles, the authors decided to treat all of the particles as the same type in the nanoindentation measurements.
The mechanical properties, hardness and elastic moduli of the samples, were measured using the nanoindentation technique on a Nano Indenter G200 system (KLA Corporation, Milpitas, CA, USA) equipped with a diamond Berkovich tip (Micro Star Technologies, Huntsville, AL, USA). Mechanical property measurements were conducted in two different ways: (1) by assessing the average values of hardness and modulus for the aluminium alloy matrix and intermetallic particles and (2) by using a nanoindentation mapping technique. In the first approach, the continuous stiffness measurement (CSM) mode was used, allowing the computation of the hardness and modulus continuously during the indentation loading. The tip shape was calibrated by conducting experiments on a fused silica standard. The tests were carried out to a maximum penetration depth of 200 nm and at a strain rate of 0.05 s
−1. The harmonic displacement and frequency were set at 2 nm and 45 Hz, respectively. The data were analysed using the Oliver and Pharr approach [
23]. At least nine experiments were performed within intermetallic-free areas (matrix) and on particles only.
In the second approach, the maps of hardness and elastic modulus distribution were generated using a basic nanoindentation technique at a maximum load of 0.5 mN. Seventy indents (matrix 7 × 10) were executed for each mechanical property distribution map. The indent spacing was set as 2 μm, thus eliminating mutual interaction between neighbouring indents.
All tests were performed under ambient conditions. The thermal drift threshold requirement for performing the mechanical assays was set at 0.05 nm/s. The NanoSuite 6.5 software (KLA Corporation) was used for data acquisition and post-processing.
The value of the Poisson ratio was set manually to 0.33—a value described in the literature for 2024 alloys [
24].
A numerical model was calculated with FEM software, Ansys
® Academic Research Mechanical, Release 19.1. The boundary conditions of the simulation were based on experimental values measured for the matrix and particle. The material model was changed to emulate elastoplastic behaviour with the bilinear characteristic. The values of yield stress required for the plasticity model were calculated as:
where
YS is calculated yield stress and
H is measured hardness [
25,
26].
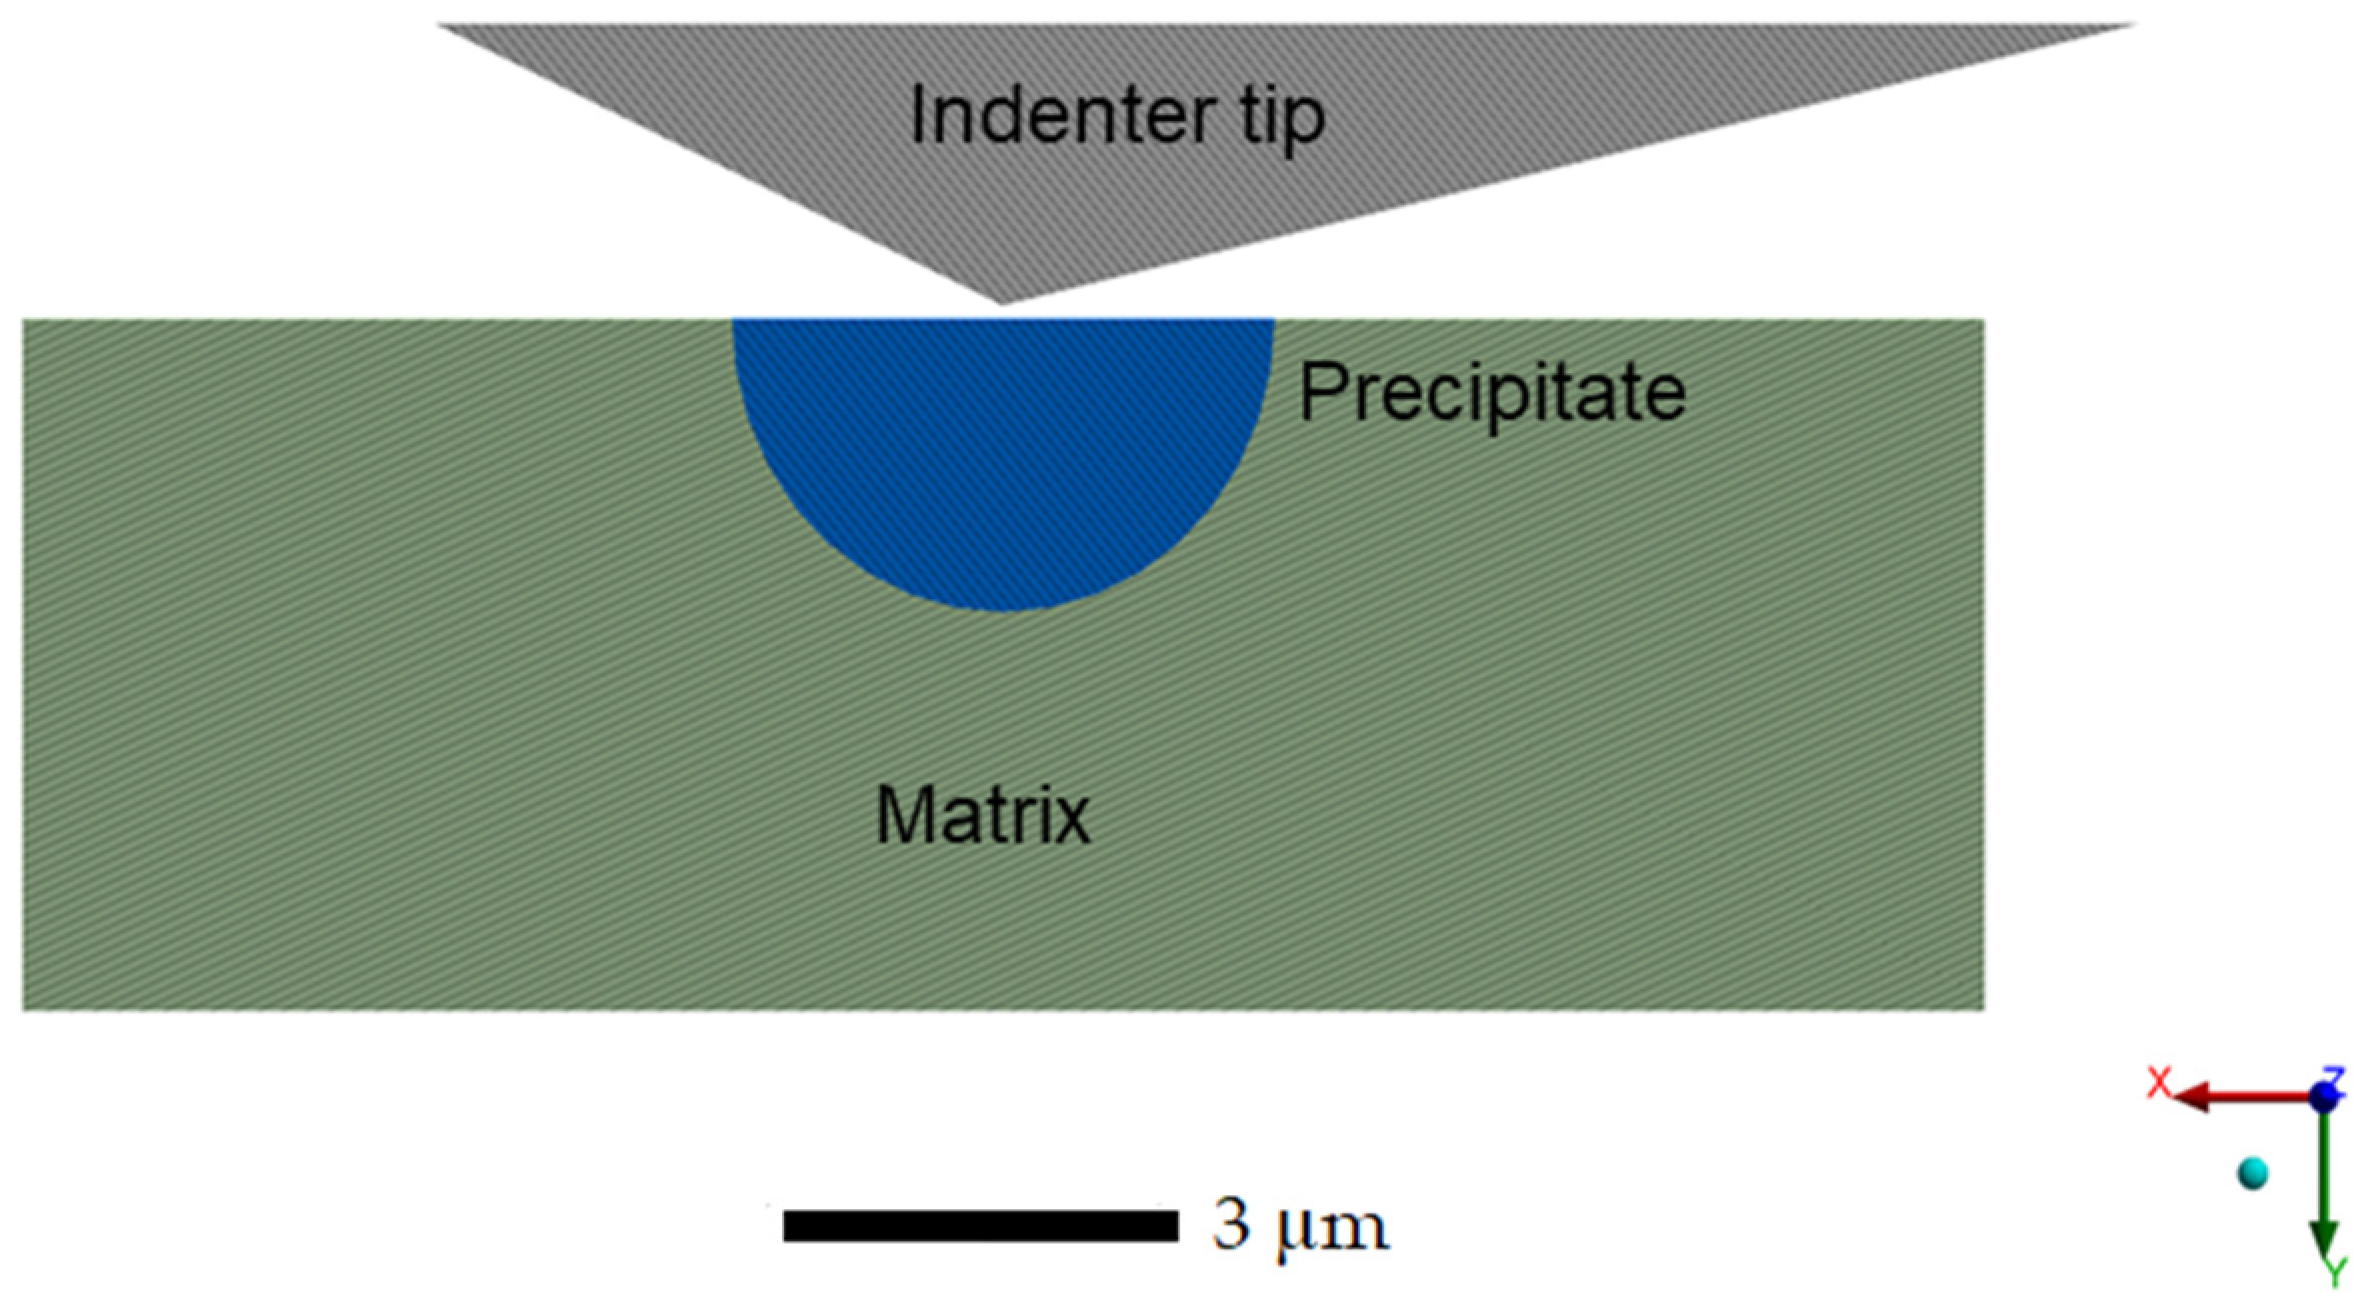
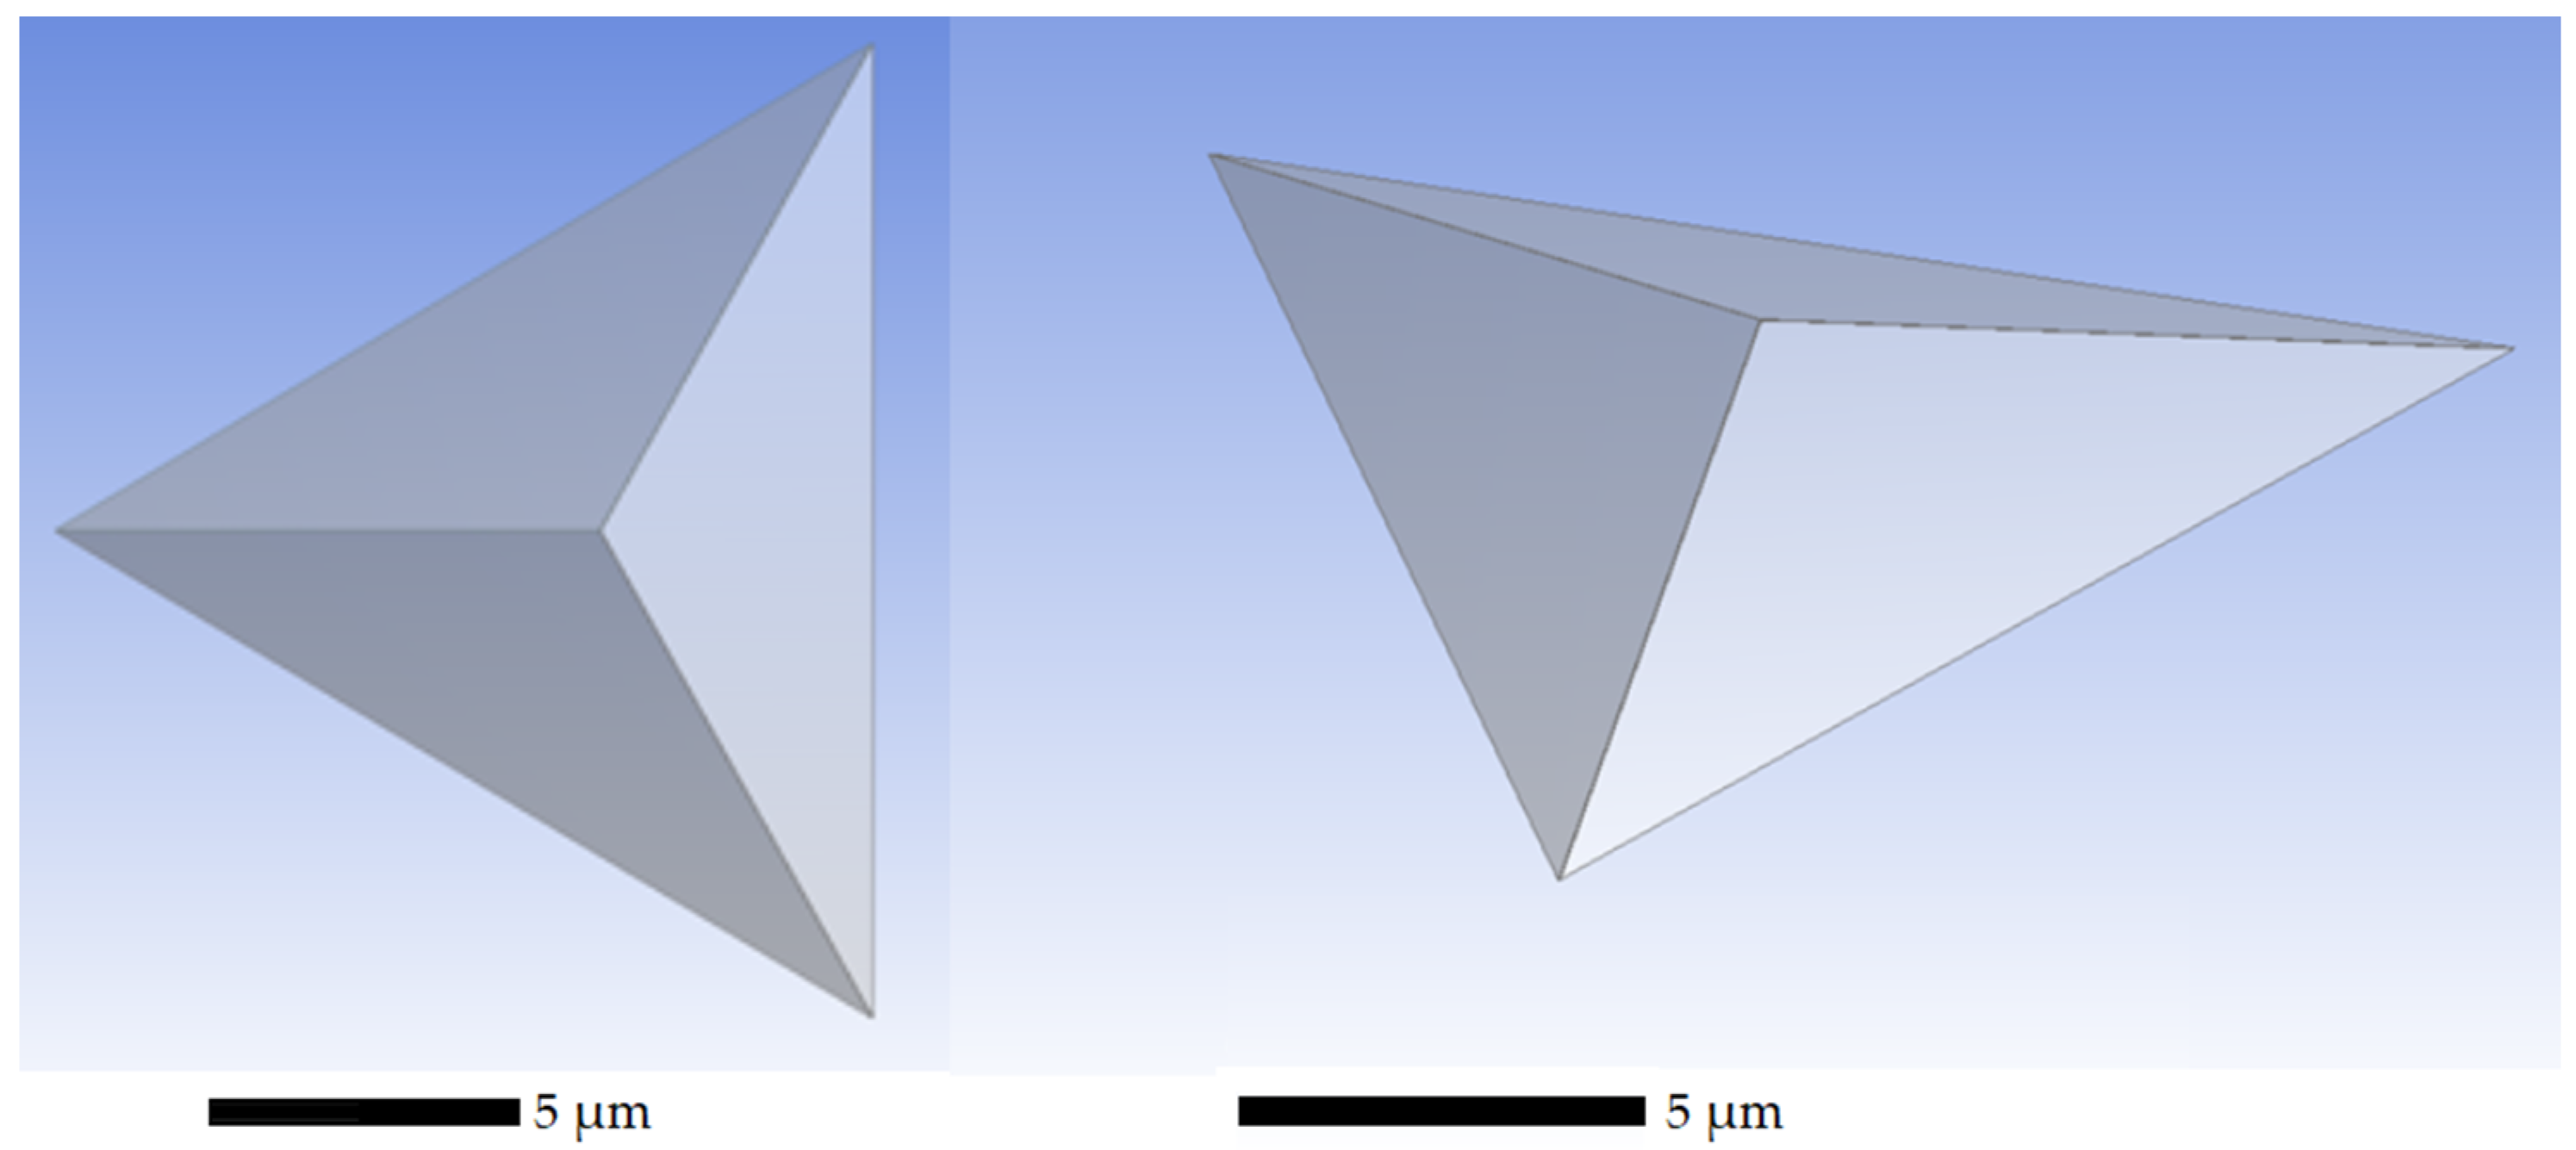
A geometrical model was created consisting of a fragment of the base material, a half-sphere particle with a 2 µm radius and the nanoindenter tip, as shown in
Figure 2 and
Figure 3. The configuration of the particle geometry was later changed to examine different variants. One geometry was created for the matrix only, with no particle. The others simulated situations where the tip penetrated different places on the particle’s cross-section. The whole model was divided into 2,403,379 tetrahedral elements with 3,326,230 nodes. The finer mesh was used at a place where the tip came into contact with the material, with an element size of 0.025 µm at the very centre, becoming coarser further from the tip. A fixed support was placed on the bottom surface of the material matrix. The maximum displacement of the tip during the simulation was 80 nm into the material, as was achieved in the experiment.
The contact between the nanoindenter tip and the surface was set to frictional with a friction coefficient equal to 0.1, and the contact between the particle and the matrix was set to bonded.
Since the diamond nanoindenter is significantly harder than the substrate, its deflection during a measurement is negligible. Its mechanical properties introduced into the simulation were as follows: E = 1141 GPa, ν = 0.07, and no plasticity was introduced.
3. Results
3.1. Experiment
During the first stage of research, a series of single-point measurements were performed on the solution-treated and aged samples. The results are presented in
Table 2. They show mean values from at least five nanoindentation points with the standard deviations calculated. The series of tests was performed in particle-free zones, providing the results of the hardness and elastic modulus of the matrix of the alloy. Another set was performed for large intermetallic particles. The results were highly repetitive and showed a significant difference in hardness between the phases.
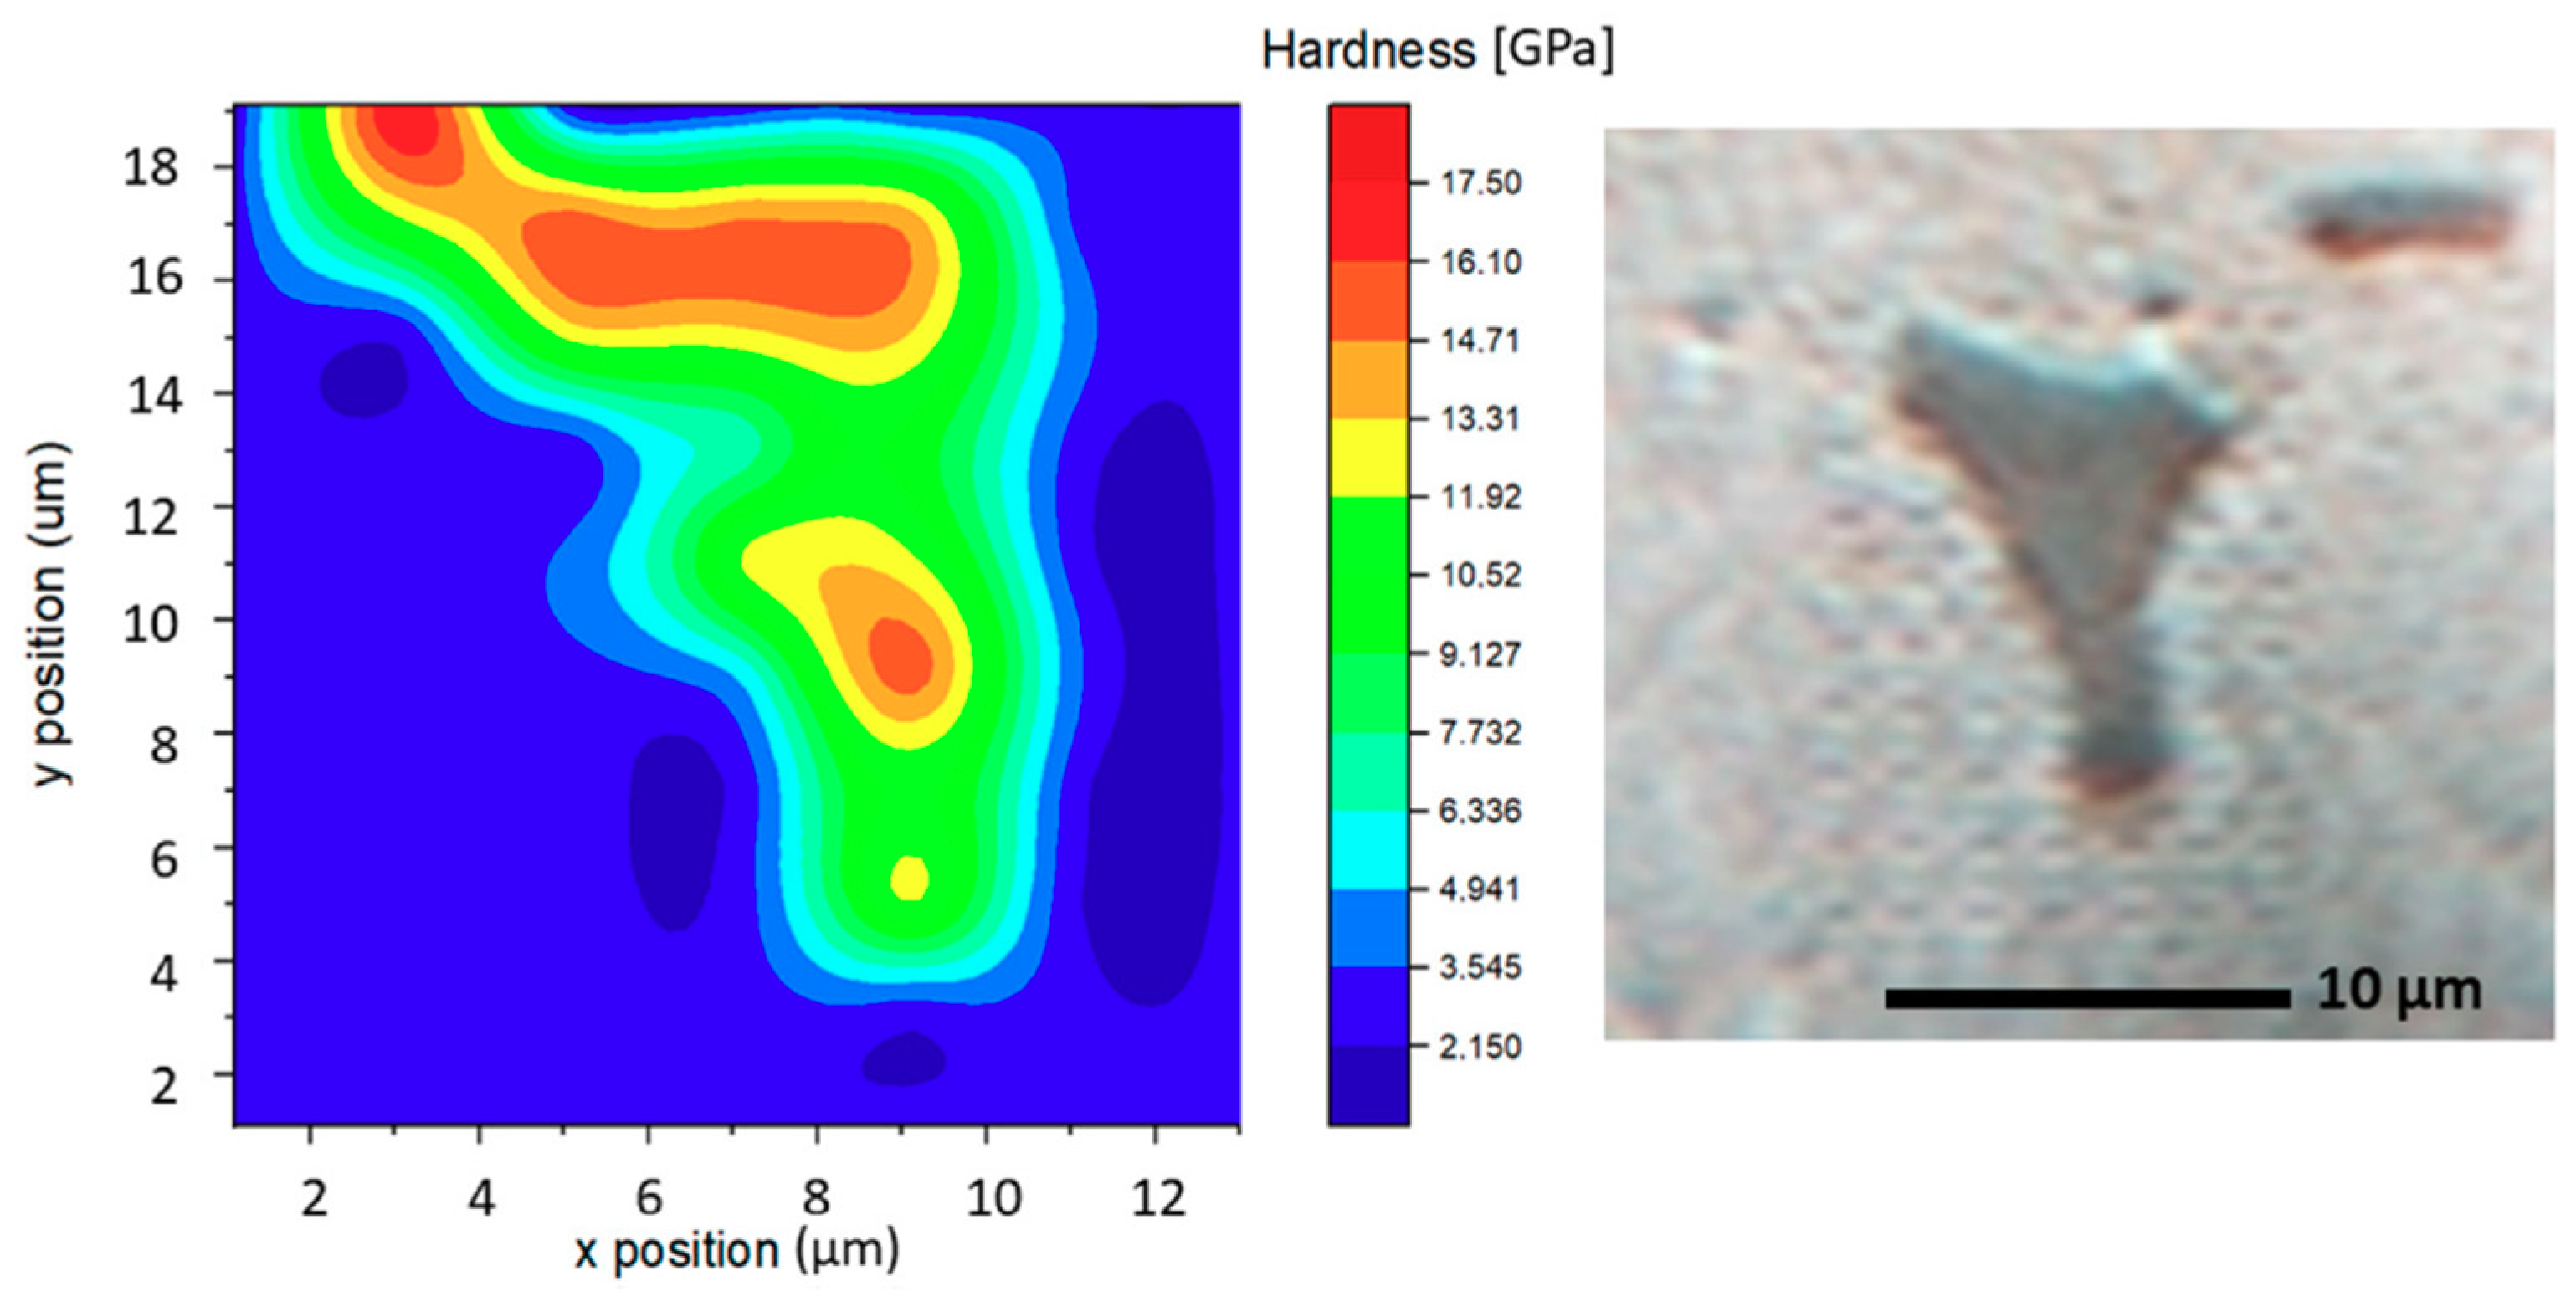
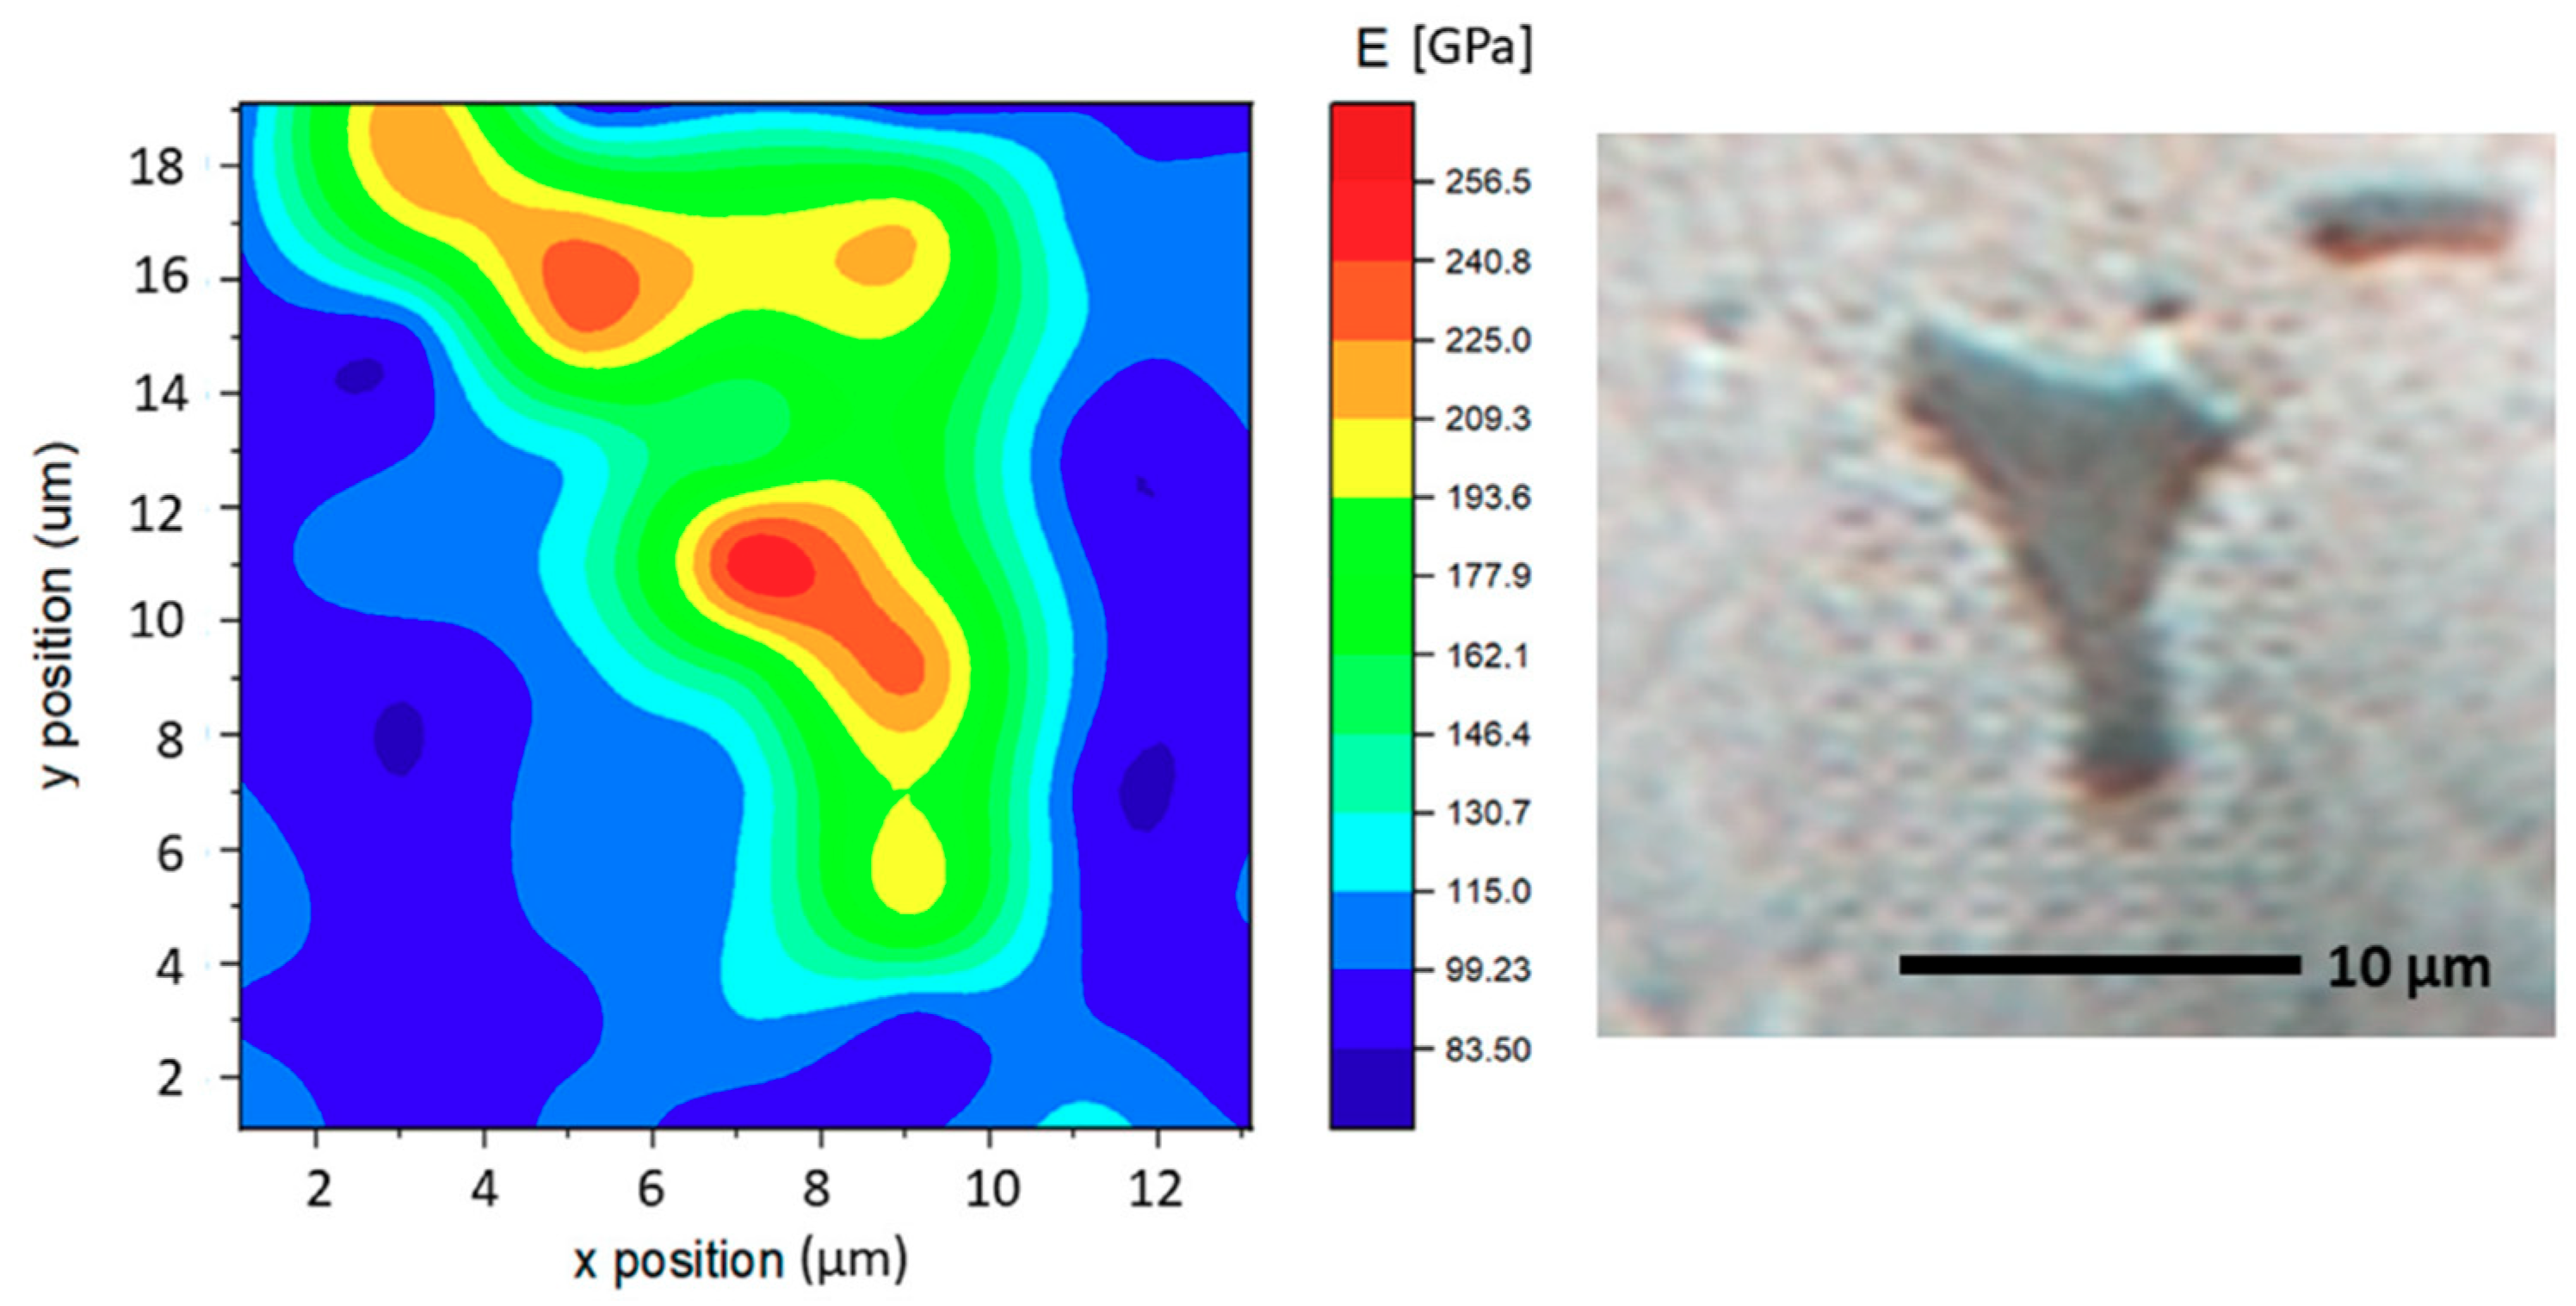
The next part of the experiment was creating a map of mechanical properties on the cross-section of a large intermetallic particle. The distribution of hardness is shown in
Figure 4, and the distribution of Young’s modulus, in
Figure 5.
The maps show a large variation in properties at different points of the particle cross-section. Taking into consideration that the particle depth might vary at nanoindentation points, this does not necessarily mean that a particle is heterogeneous. According to findings in the area of the nanoindentation testing of thin films, if the particle fragment is thin enough, the measured hardness and elastic modulus depend on its thickness and penetration depth ratio. Assuming that the particle was cut in half (which is impossible to determine at the moment of the test) and has a rounded shape, the areas close to the phase boundary should be much thinner than the centre. At those places, the softer substrate would interfere to a much greater extent than at the centre. That would justify the obtained maps, where the highest mechanical properties were measured at the thickest points of the particle fragment, while in reality, the particle has uniform properties through the whole volume.
That hypothesis was a basis for designing a numerical study that would prove that the indentation of different points of one heterogeneous particle would produce different results.
3.2. Simulation
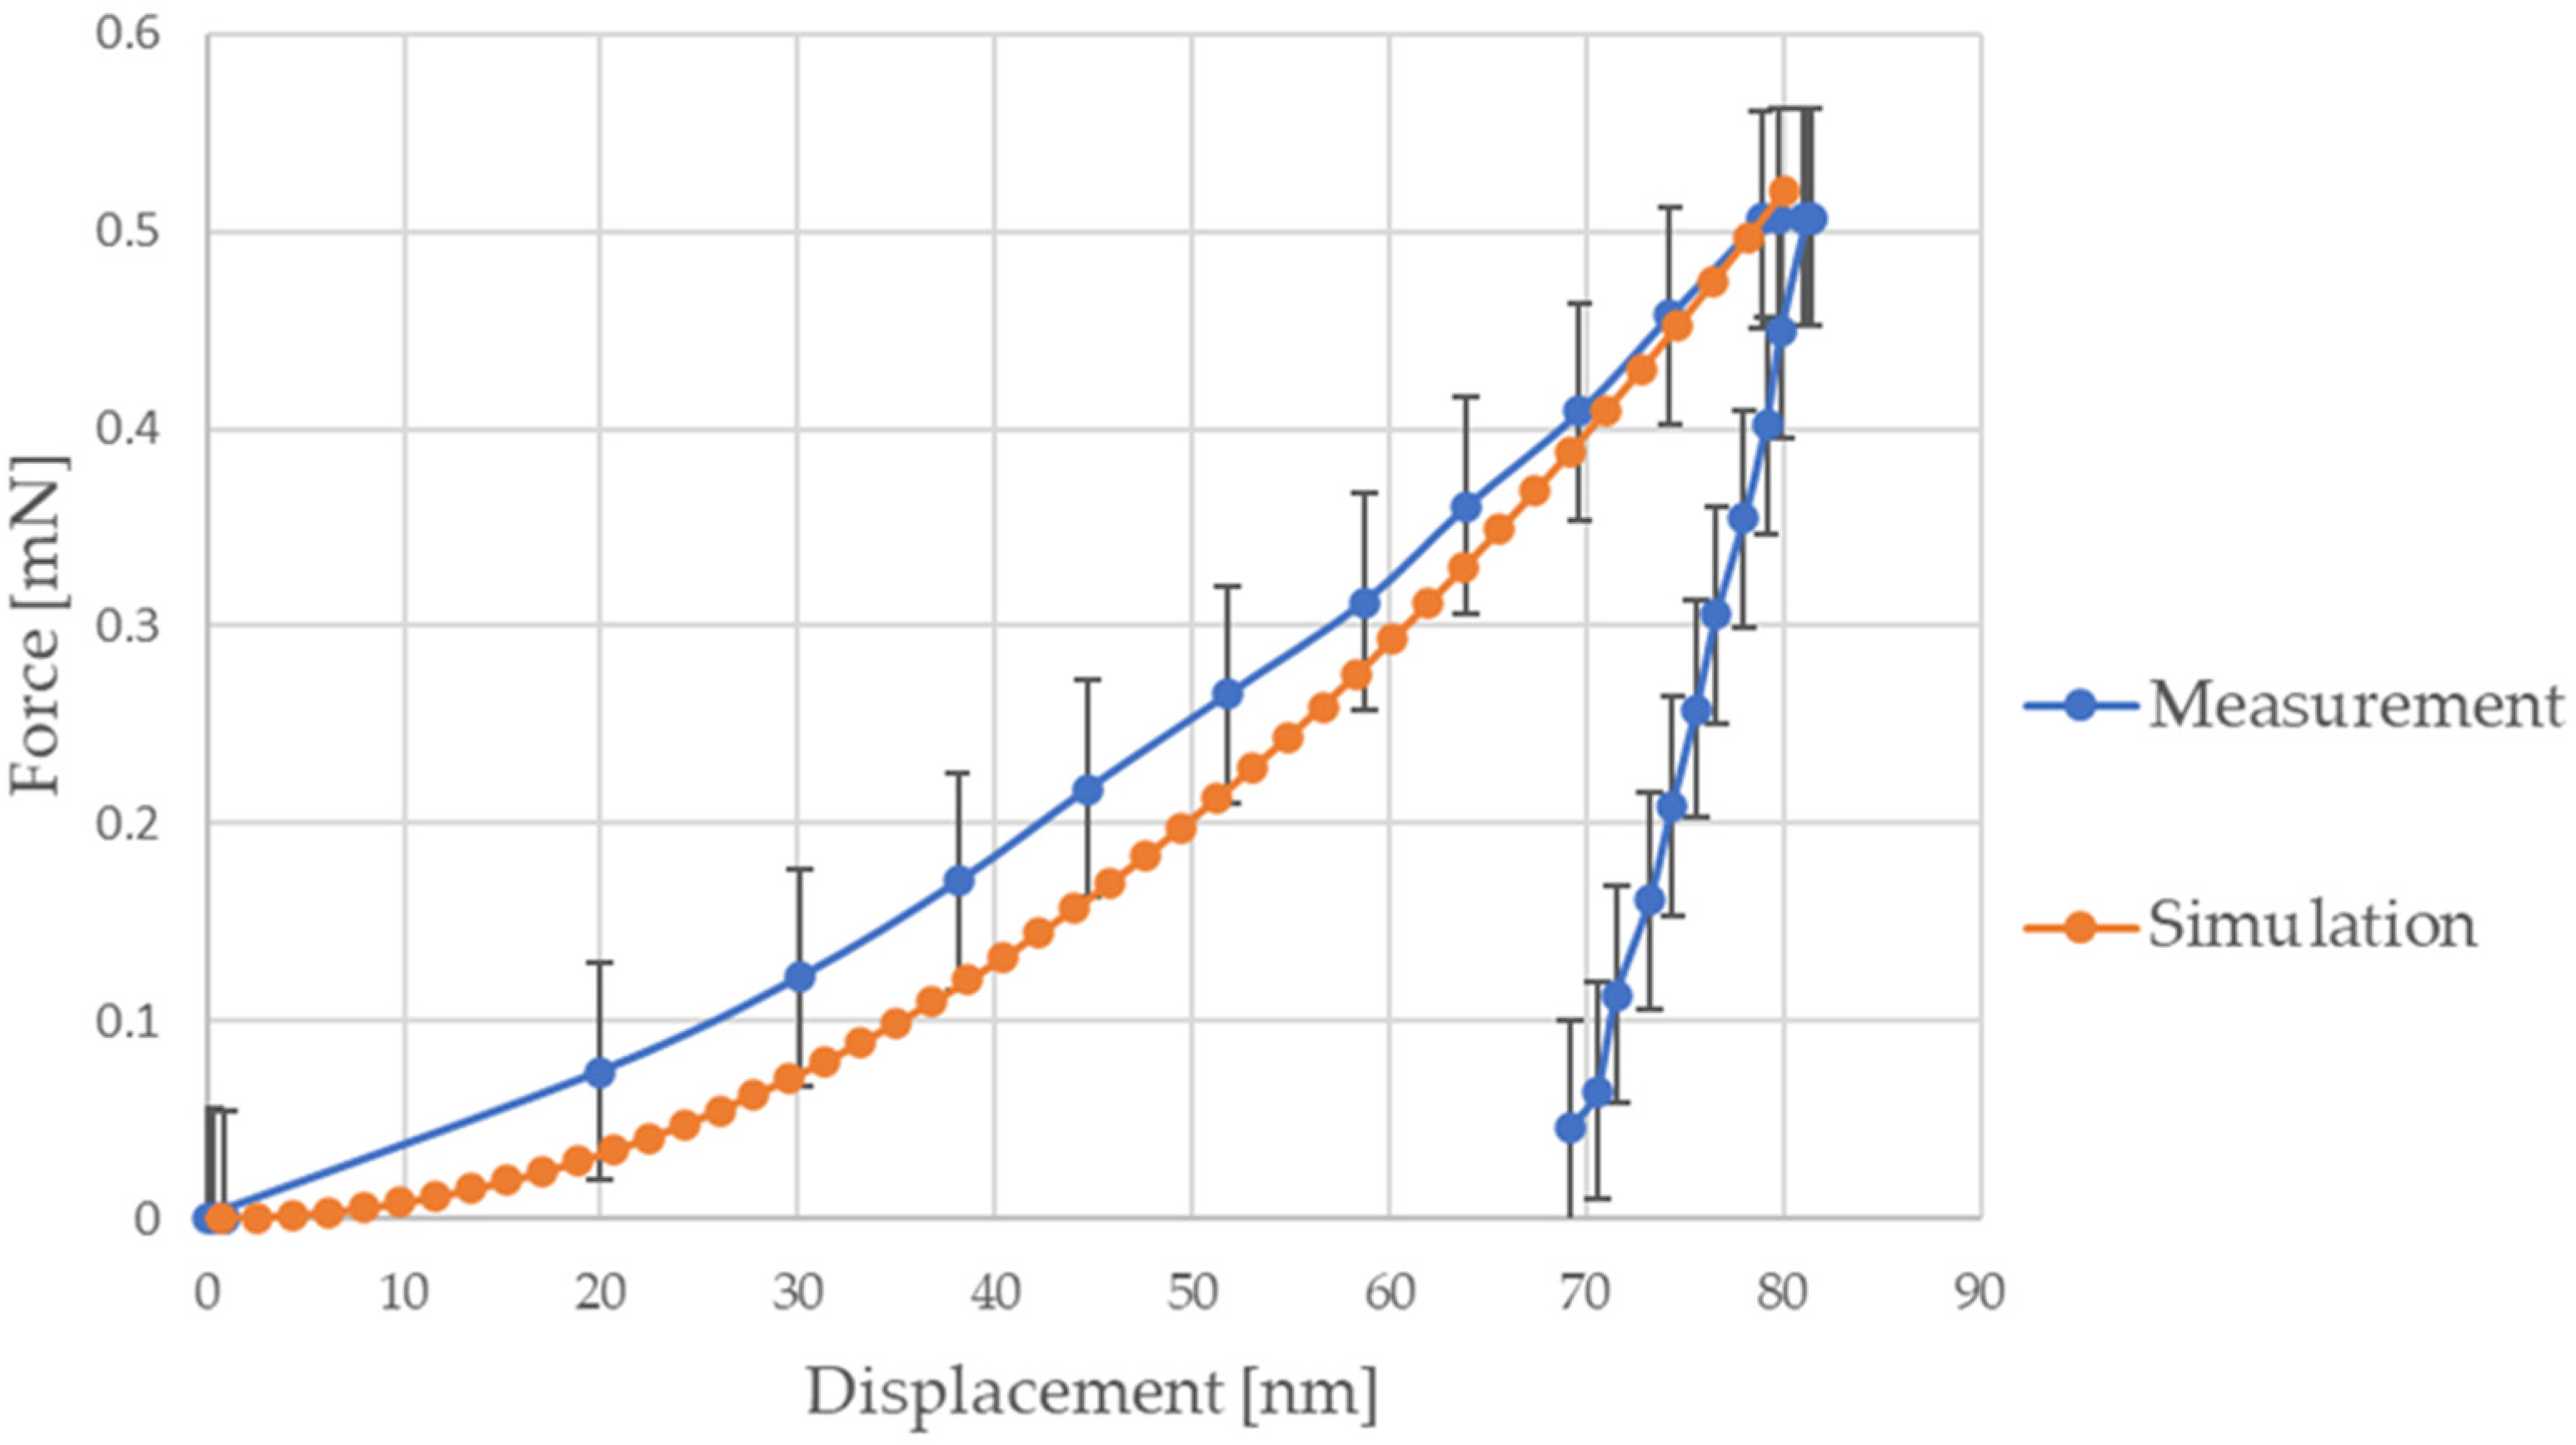
In order to verify the numerical model, in the first stage, the nonlinear characteristics of the matrix material were developed to match the characteristics and measurement error of the experimental nanoindentation test. As a result, taking into account the superposition of factors influencing the correlation between the simulation and the experiment, certain boundary conditions for the analysis and the FEM model were adopted. The values of the properties in the elastic range for the matrix material were estimated from the experiment (
Table 2). The value of the plastic stress required for the adopted bilinear plastic model was calculated according to Equation (1). With the previously described boundary conditions of the adopted FEM model, the final stage of verification was to determine the tangential modulus of the matrix material in the area after plasticization. The final results of the analysis, confirming the correctness and accuracy of the adopted simulation model, are shown in the chart in
Figure 6. The errors plotted on the measurement curves represent the standard deviations of the force values from five experimental tests.
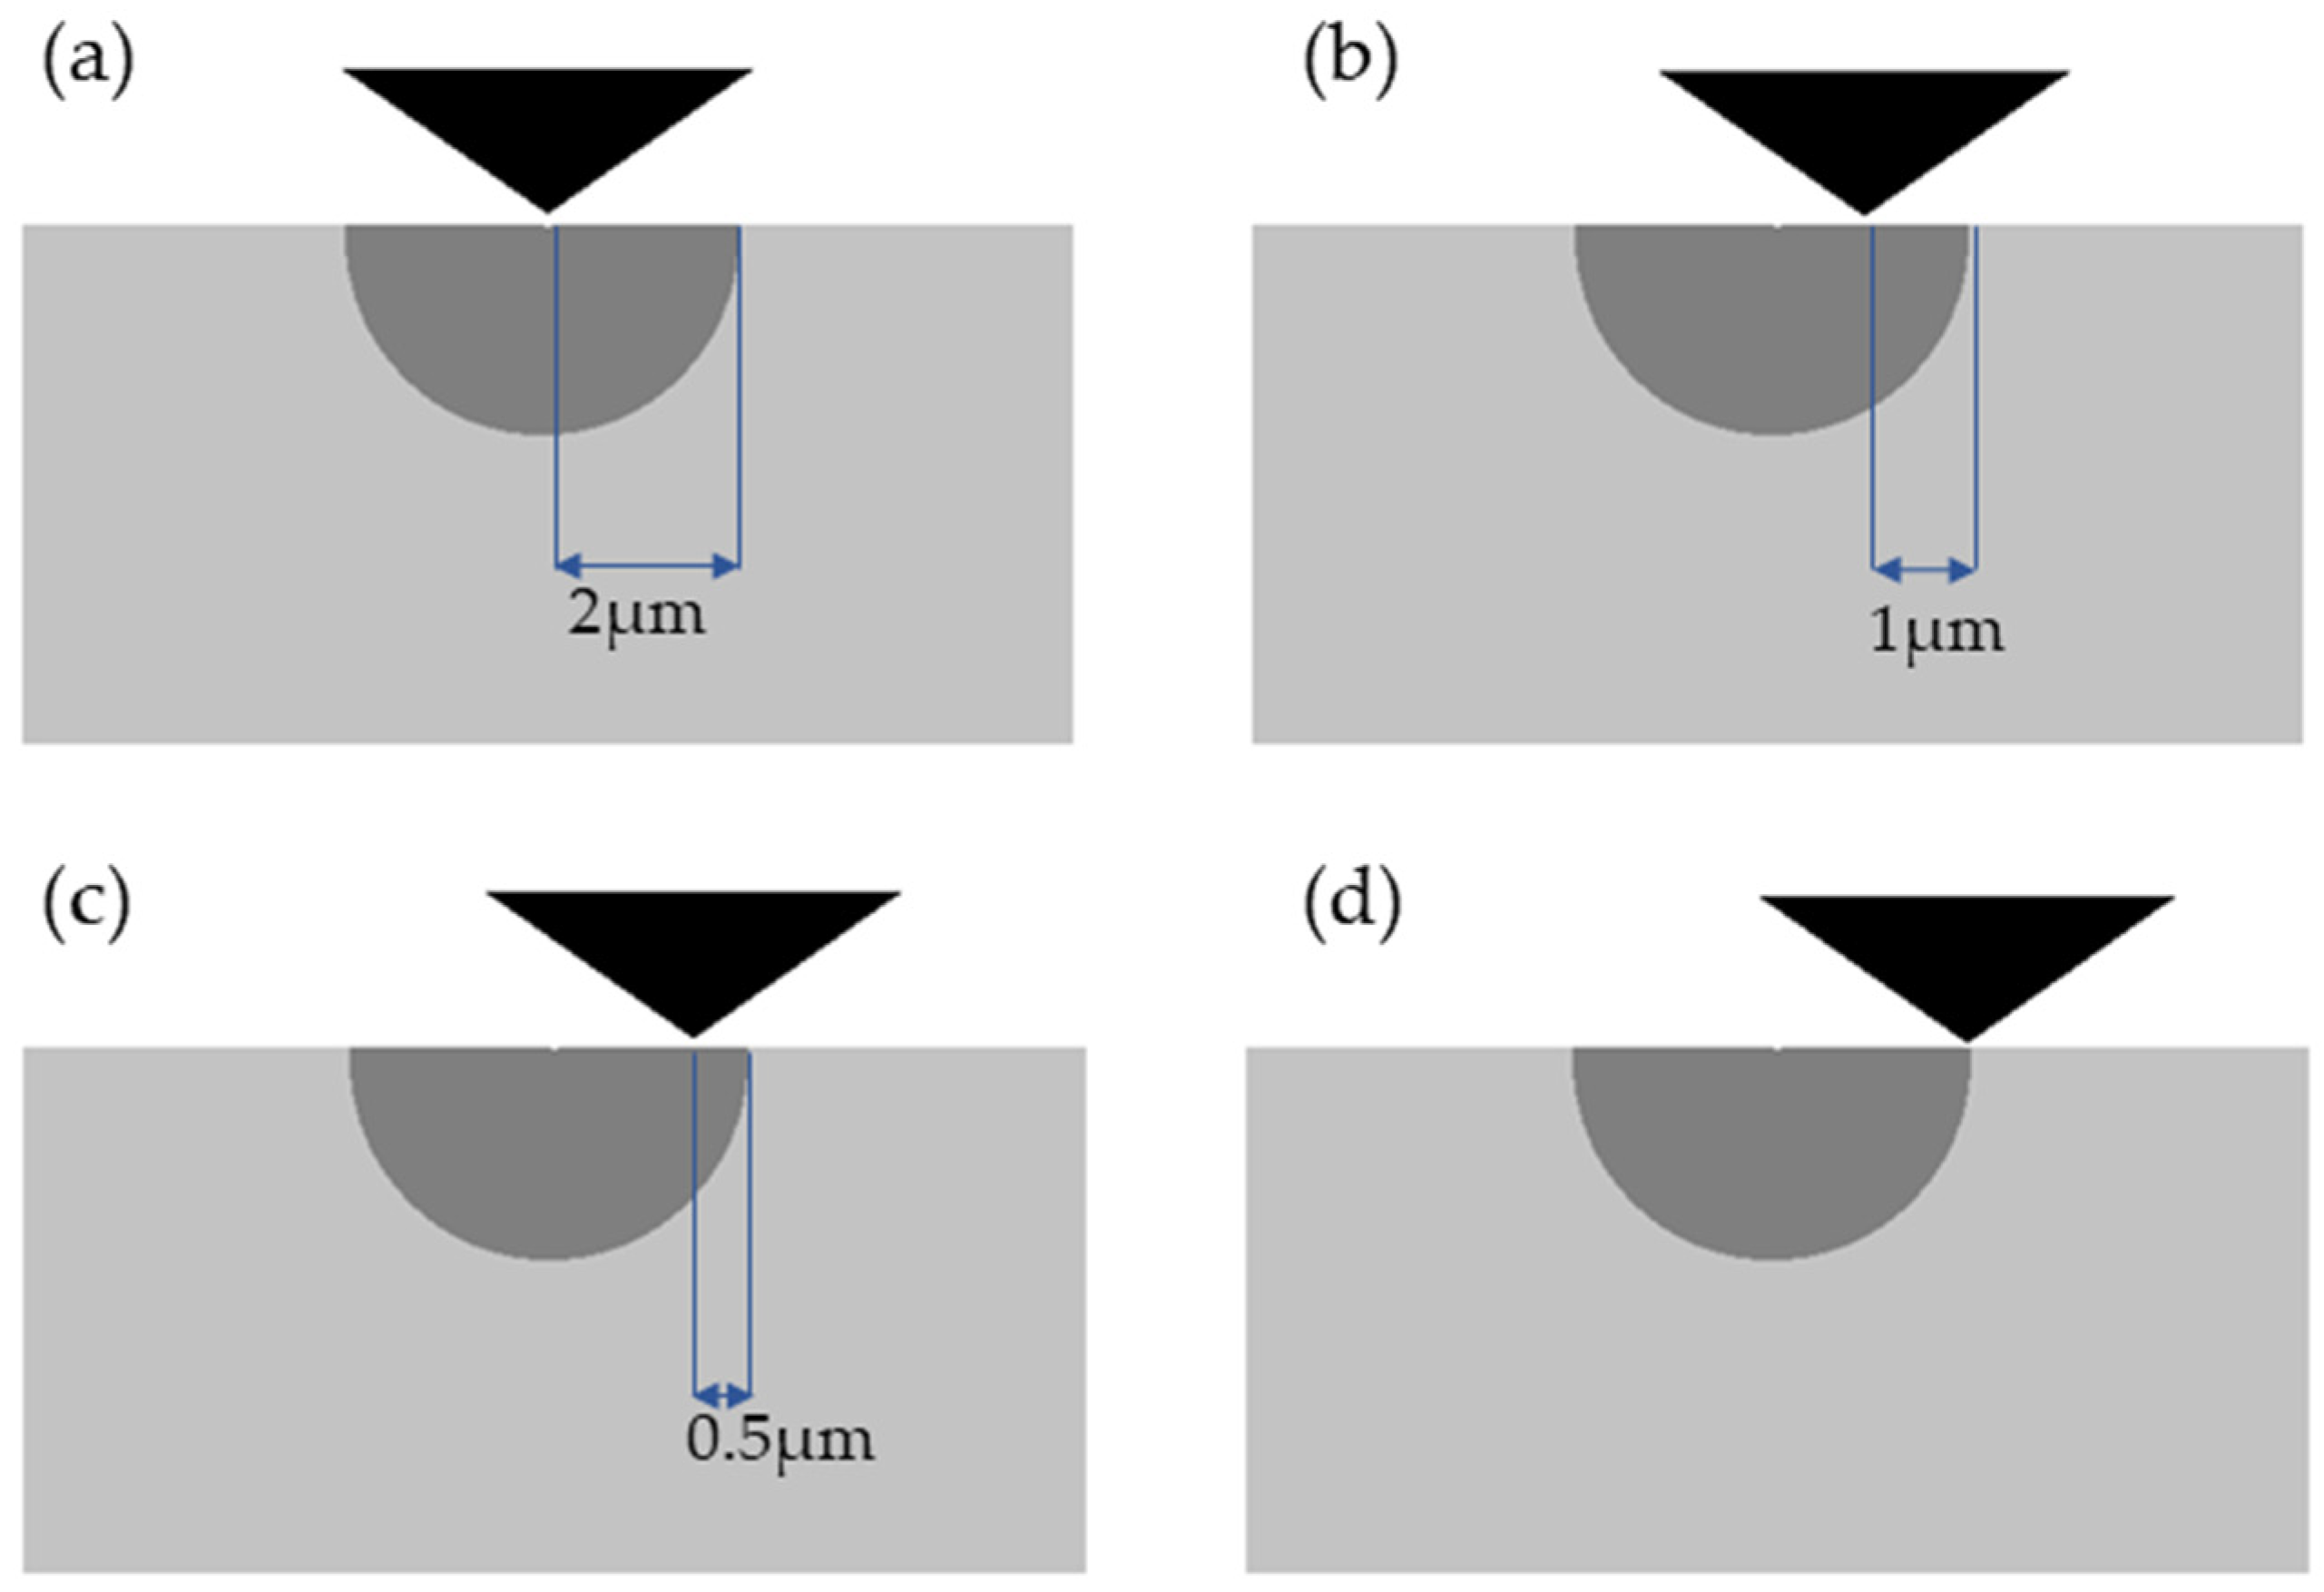
Based on the previously described numerical model, a series of simulations were carried out to determine the influence of the shape and depth of the particle on the accuracy of the nanoindentation result. For all of the variants, the authors decided to keep a constant depth of indentation, equal to 80 nm, and compare the curves of force vs. displacement. Four variants were adopted for the simulation, and they are shown in
Figure 7. They consisted of (a) indentation at the very centre of the particle (2 µm from the boundary), (b) indentation at half of the radius of the particle (1 µm from the boundary), (c) indentation at quarter of the radius of the particle (0.5 µm from the boundary), and (d) indentation at the boundary between the particle and the matrix.
The values characterizing the linear material of the particle were determined on the basis of the nanoindentation test
Table 2, assuming a uniform material.
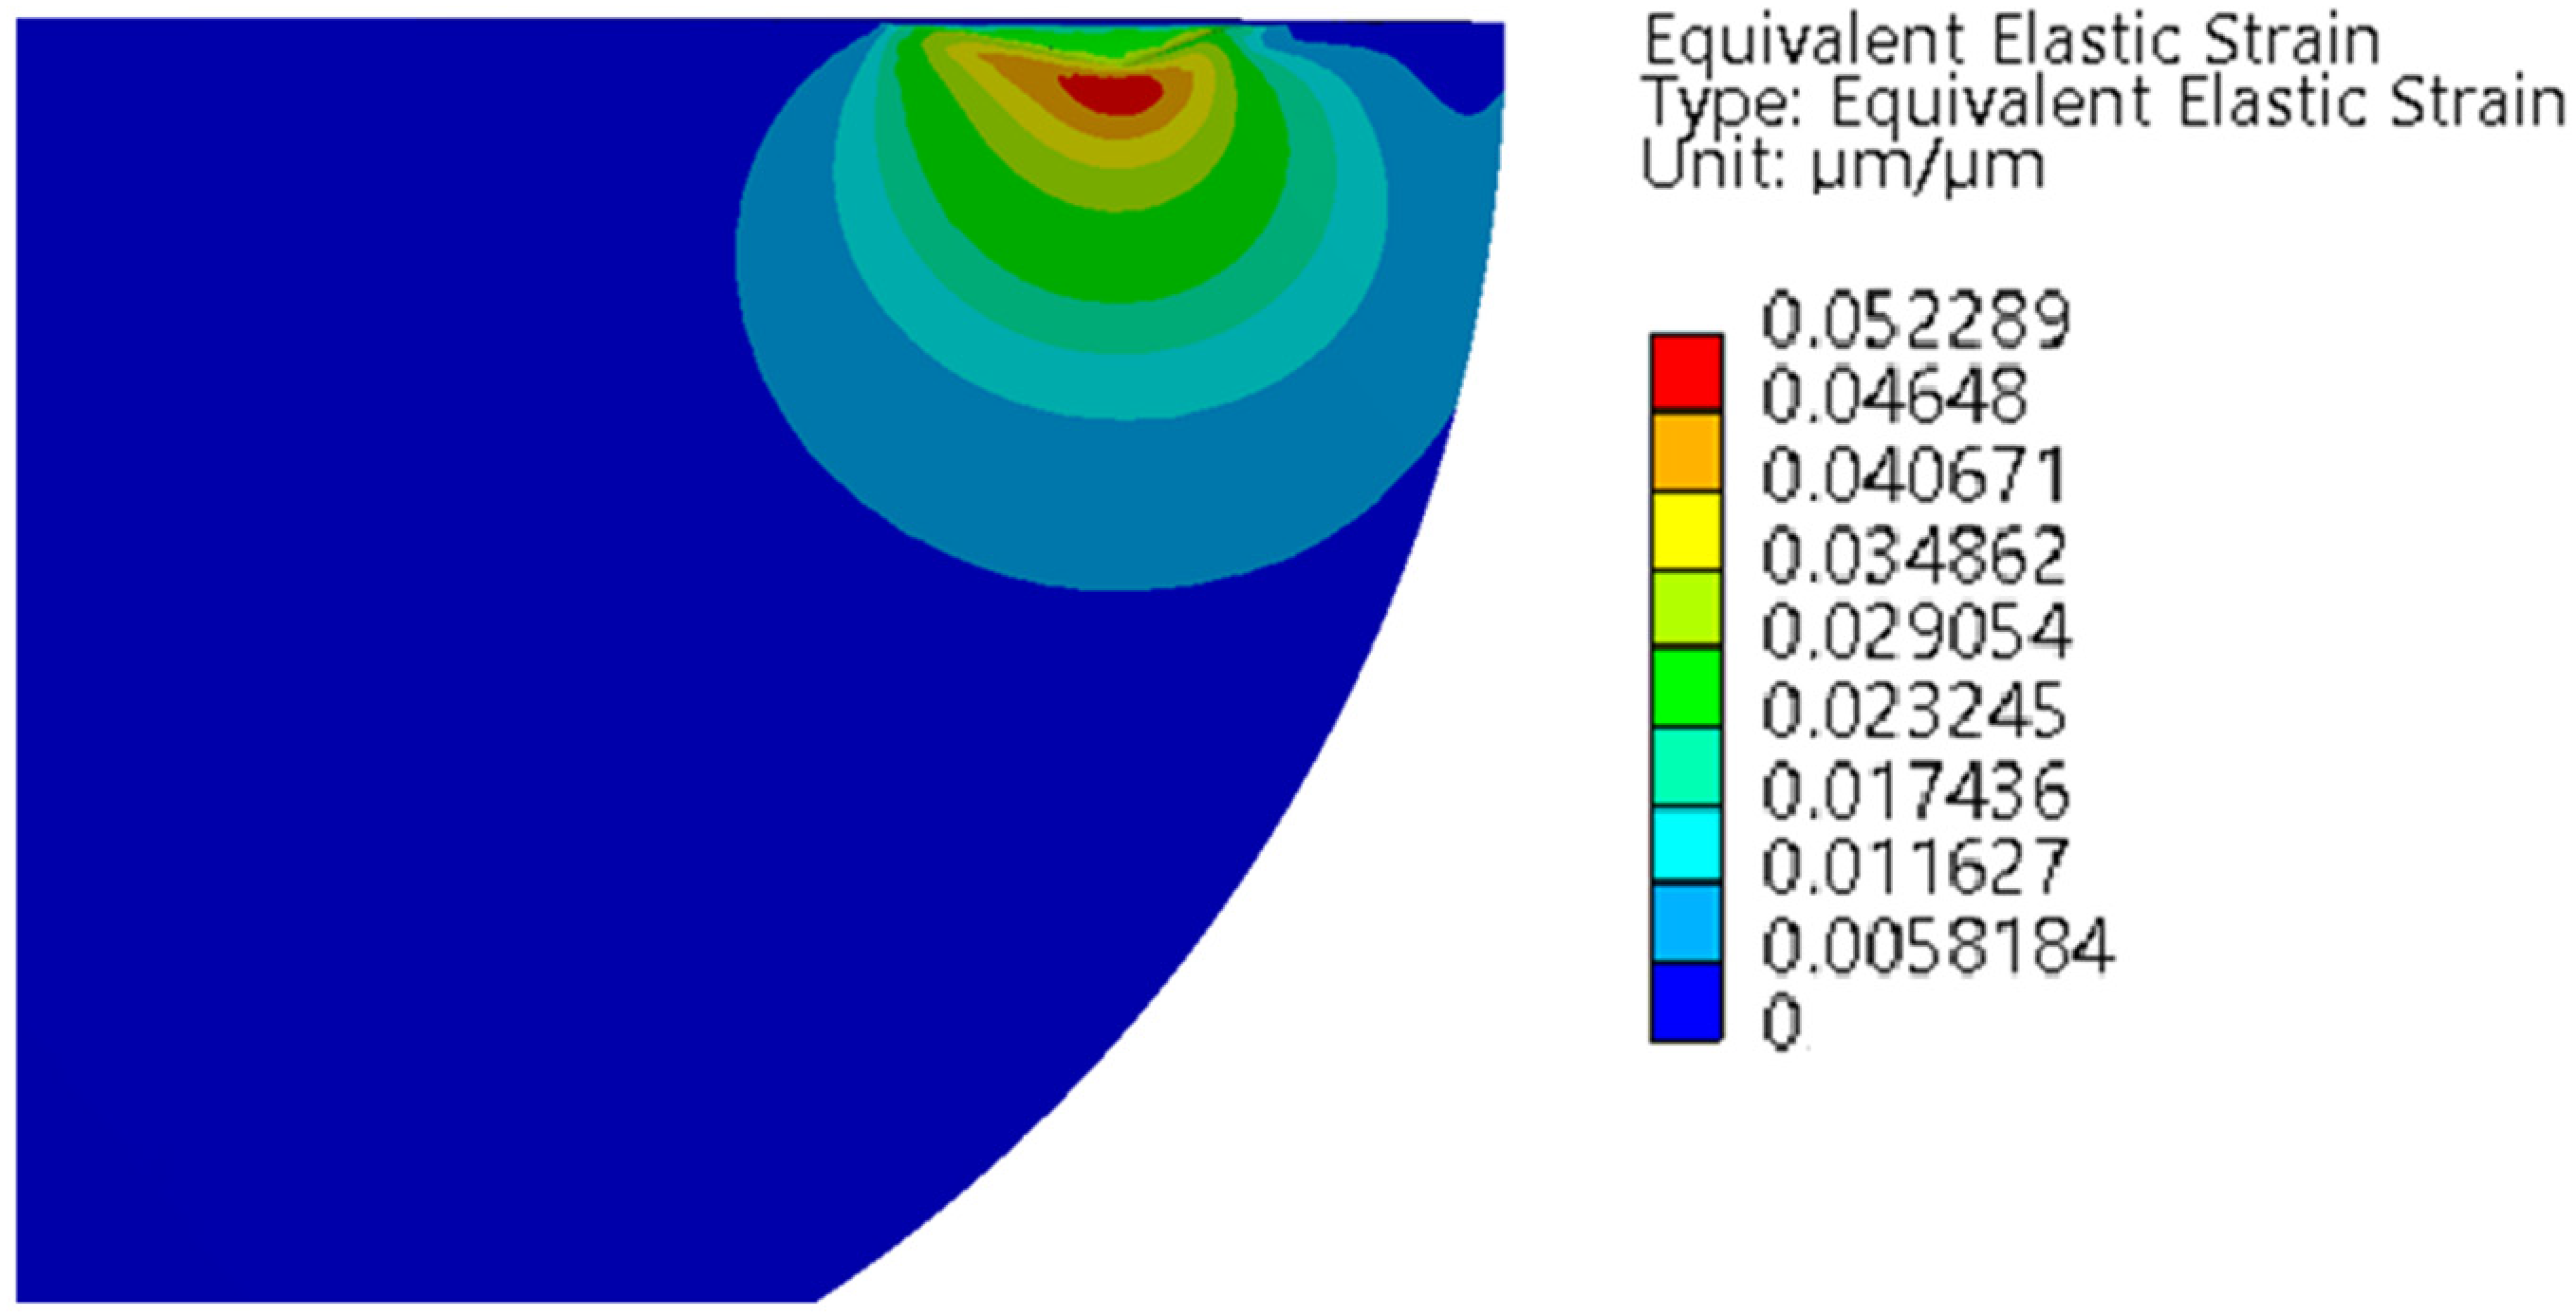
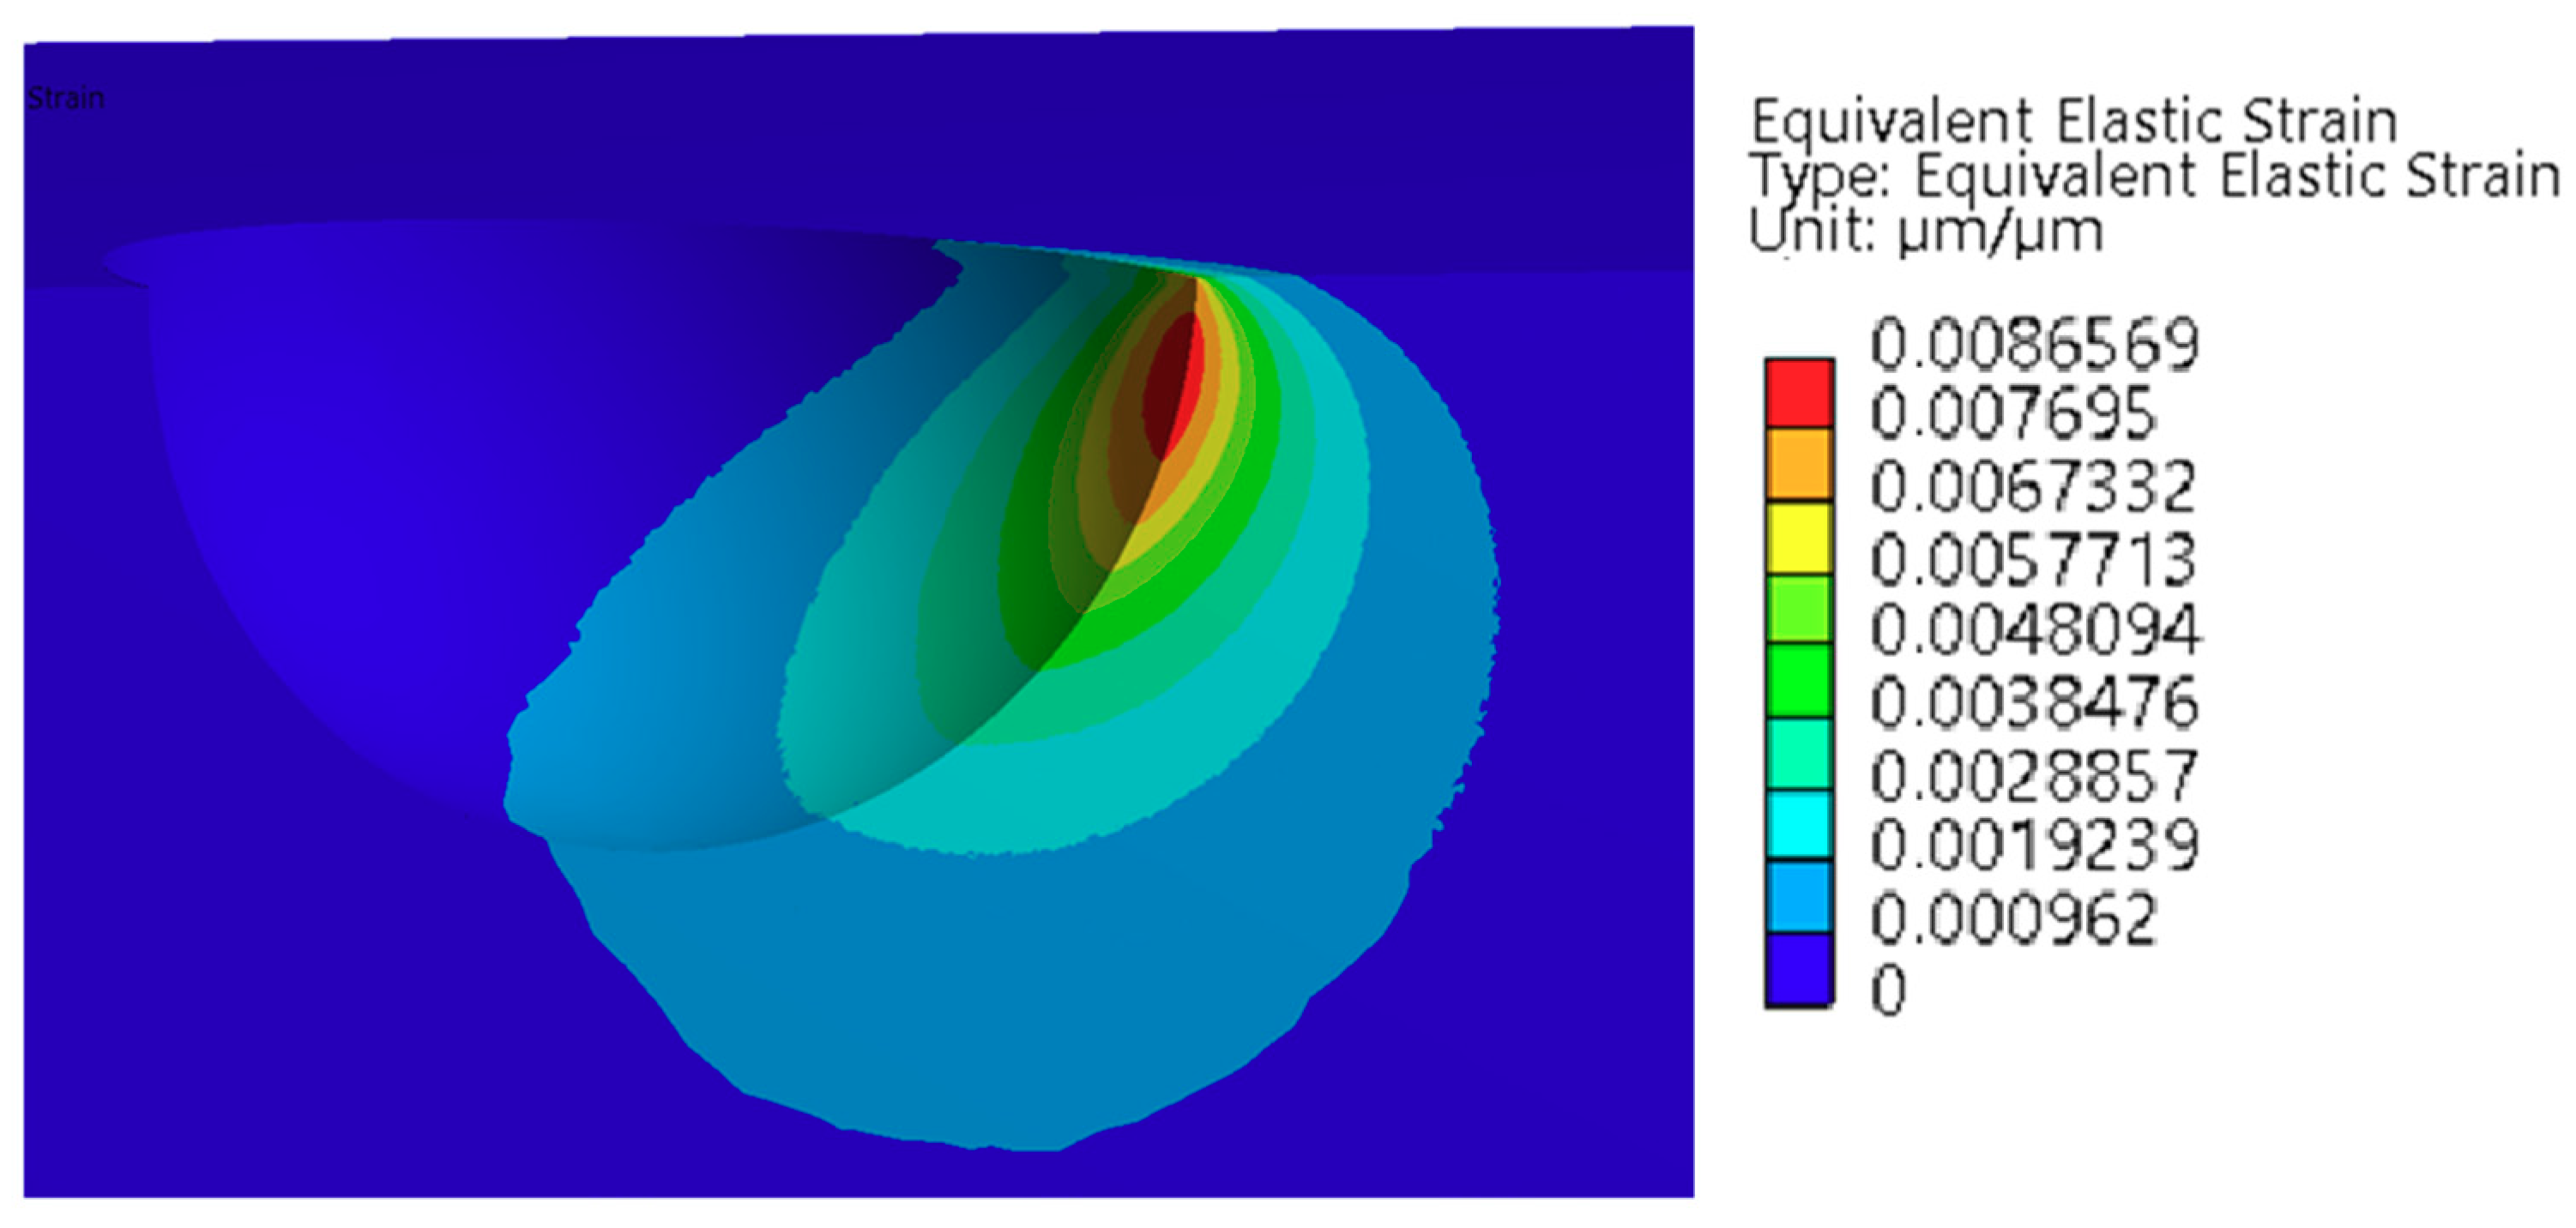
Figure 8 and
Figure 9 show the distribution of elastic strains in one of the variants of simulation.
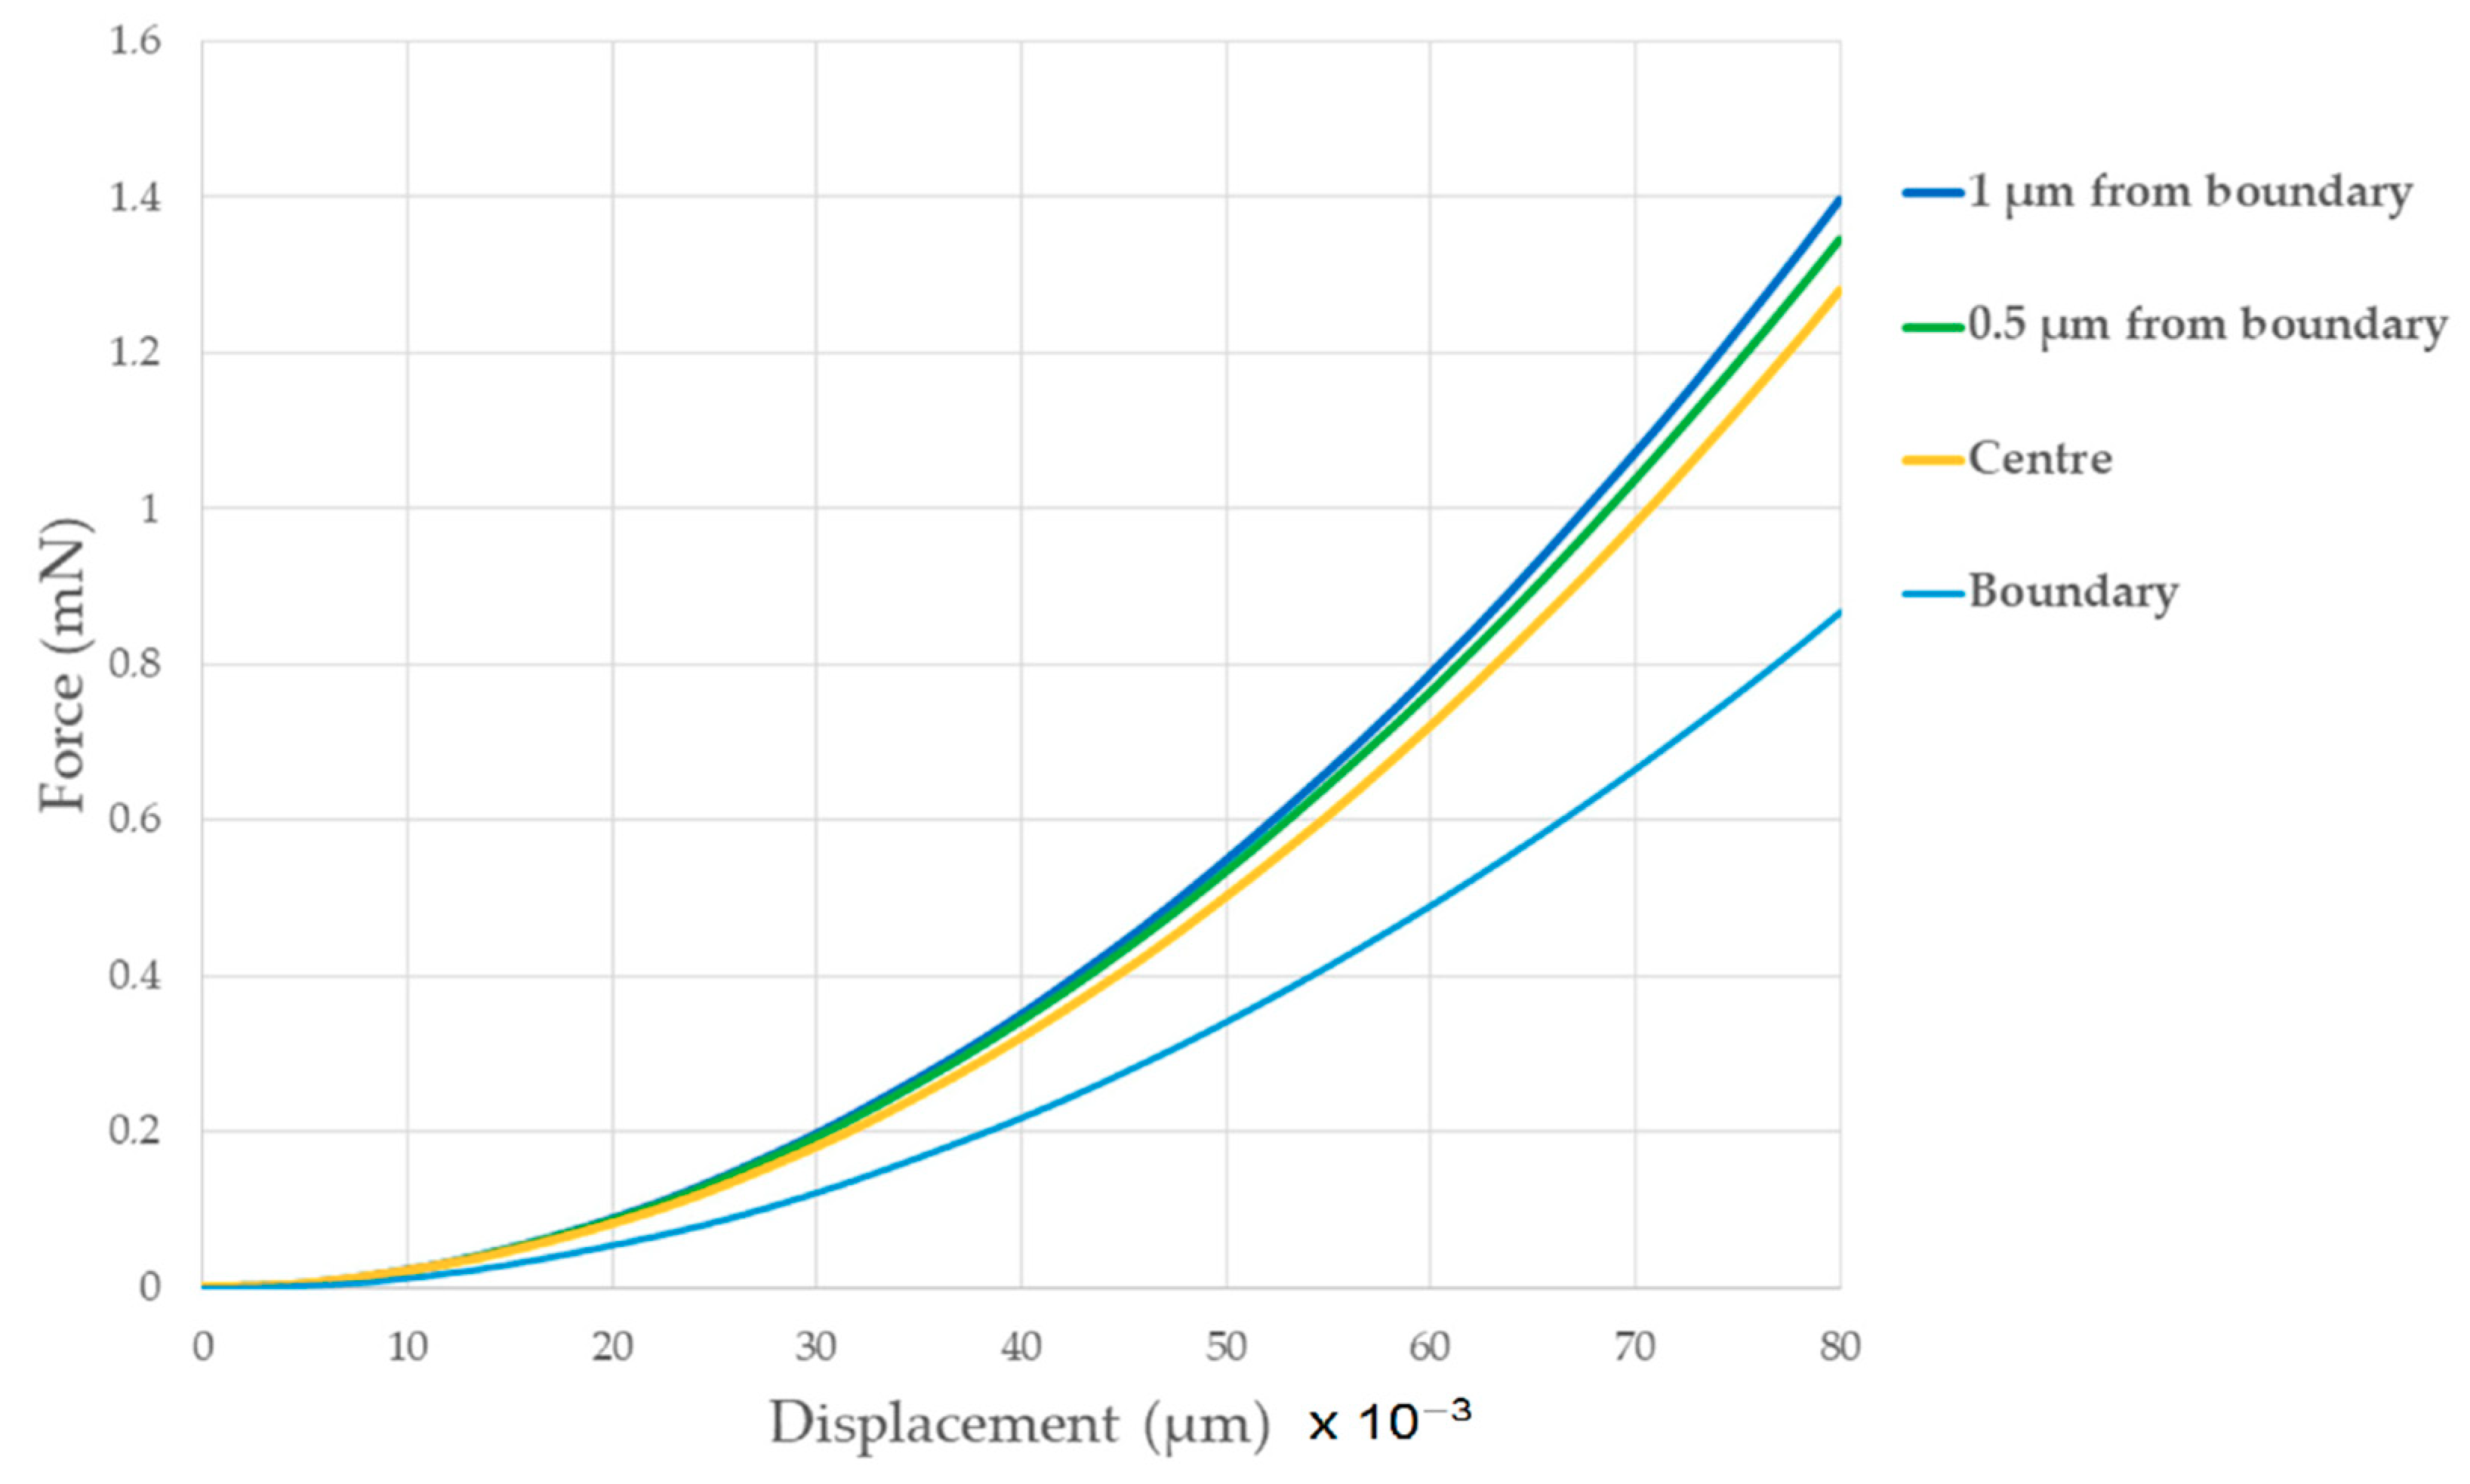
When analysing the obtained results in
Figure 10, a difference was observed in force as a function of displacement for individual variants. Nevertheless, the presented characteristics did not clearly indicate that as the penetrator is brought closer to the boundary, the force decreases significantly in relation to the displacement.
Reading the obtained values of elastic and plastic strains for the individual simulation variants included in
Table 3 and
Table 4 allowed the full interpretation of the obtained results.
Comparing the data of the elastic and plastic strains for the particle and matrix in correlation with the operating characteristics for individual variants, for a displacement up to about 20 nm, the strains in the particle were of crucial importance. At this stage, the characteristics were the same for all variants and did not affect the accuracy of the nanoindentation results. The difference in the results was observed after the displacement of 20 nm was exceeded. Then, not only was the elastoplastic deformation observed in the particle but deformations in the matrix influenced the simulation characteristics. The biggest difference was observed at the end of the test, for the 80 nm displacement. Elastic deformation in the matrix caused an increase in the force and a decrease in the plastic deformation of the particle. Further observation of the strains revealed that the increase in plastic deformation of the particle causes a decrease in force in relation to the displacement (variant at the centre). A similar observation, i.e., a decrease in force in relation to the displacements, was noticed for the variant 0.5 µm from the boundary. Increasing plastic deformations of the matrix resulted in a reduced stiffness of the system and a decrease in force. Therefore, the above observations show that with the increase in elastic strains in the particle and/or the matrix, the force increases in relation to the displacement, which, as the results show, was blocked by the plastic deformation of both structures.
4. Conclusions
Based on the results, it can be stated that the accuracy of the nanoindentation measurement is strongly influenced by the behaviour of the matrix at the boundary with the particle. The elastoplastic behaviour of the matrix depends on the three-dimensional shape of the particle, its size, its mechanical properties and the test method. Consequently, those factors influence the distribution of elastic and plastic strains in the observed area. It can be assumed that the significant differences in the mechanical properties (hardness and Young’s modulus) between the particle and the matrix emphasize the differences in the force vs. deformation characteristics. A much softer matrix will deform faster, which interferes with the nanoindentation of the particle.
The simulation results confirm that the distribution of properties on nanoindentation maps of the particle’s cross-section is caused by its shape rather than heterogeneity. For the intermetallic particles in 2024 Al alloy, due to their size, the matrix always interferes with the nanoindentation result.


