Article

Towards Quantitative Interpretation of Fourier-Transform Photocurrent Spectroscopy on Thin-Film Solar Cells

by
Jakub Holovský
1,2,*,
Michael Stuckelberger
3,4,
Tomáš Finsterle
1,
Brianna Conrad
1,
Amalraj Peter Amalathas
1,
Martin Müller
2 and
Franz-Josef Haug
4
1
Centre for Advanced Photovoltaics, Faculty of Electrical Engineering, Czech Technical University in Prague, Technická 2, 16627 Prague, Czech Republic
2
Institute of Physics, Czech Academy of Sciences, Cukrovarnická 10, 16200 Prague, Czech Republic
3
Deutsches Elektronen-Synchrotron DESY, Notkestr. 85, 22607 Hamburg, Germany
4
Photovoltaic and Thin-Film Electronics Laboratory, Institute of Microengineering (IMT), École Polytechnique Fédérale de Lausanne (EPFL), Rue de la Maladière 71b, 2002 Neuchâtel, Switzerland
*
Author to whom correspondence should be addressed.
Coatings 2020, 10(9), 820; https://doi.org/10.3390/coatings10090820
Submission received: 30 June 2020 / Revised: 13 August 2020 / Accepted: 17 August 2020 / Published: 25 August 2020
(This article belongs to the Special Issue Advances in Thin Films for Photovoltaic Applications)

Abstract

:
The method of detecting deep defects in photovoltaic materials by Fourier-Transform Photocurrent Spectroscopy has gone through continuous development during the last two decades. Still, giving quantitative predictions of photovoltaic device performance is a challenging task. As new materials appear, a prediction of potentially achievable open-circuit voltage with respect to bandgap is highly desirable. From thermodynamics, a prediction can be made based on the radiative limit, neglecting non-radiative recombination and carrier transport effects. Beyond this, more accurate analysis has to be done. First, the absolute defect density has to be calculated, taking into account optical effects, such as absorption enhancement, due to scattering. Secondly, the electrical effect of thickness variation has to be addressed. We analyzed a series of state-of-the-art hydrogenated amorphous silicon solar cells of different thicknesses at different states of light soaking degradation. Based on a combination of empirical results with optical, electrical and thermodynamic simulations, we provide a predictive model of the open-circuit voltage of a device with a given defect density and absorber thickness. We observed that, rather than the defect density or thickness alone, it is their product or the total number of defects, that matters. Alternatively, including defect absorption into the thermodynamic radiative limit gives close upper bounds to the open-circuit voltage with the advantage of a much easier evaluation.

1. Introduction

Sub-bandgap absorptance spectroscopy is a relatively simple defect quantification method, which is well established in the material science of thin-film photovoltaic (PV) materials, such as microcrystalline silicon [1], hydrogenated amorphous silicon (a-Si:H) [2], organic semiconductors [3] and also recently hybrid perovskite materials [4,5,6,7]. Whereas other methods, such as conductivity or photoluminescence, are difficult to interpret and may give results affected by transient effects, sub-bandgap absorptance spectroscopy can already provide a relatively universal indication of semiconductor quality by looking at the sub-bandgap absorptance and the steepness of the absorption edge. At the beginning of the era of a-Si:H, two low-absorptance techniques were established as benchmarks: Photothermal Deflection Spectroscopy (PDS) [2] and the Constant Photocurrent Method (CPM) [3]. To make the CPM faster, more compact and simpler for maintenance, Fourier-Transform Photocurrent Spectroscopy (FTPS) [8,9] was introduced later, replacing the monochromator with a Fourier-Transform Infrared (FTIR) spectrophotometer. While PDS measures all absorbed light that is converted to heat, FTPS is sensitive only to light contributing to the photocurrent. In rare cases, these methods give equivalent results, but more often the combination of both methods is necessary to give accurate absorptance values. The advantage of FTPS compared to PDS is the ability to measure the defect density of absorber layers in complete solar cells. In hybrid perovskites, the main difference might be the lead iodide phase that exhibits differently [4,6,7], while in the case of a-Si:H the main difference is the sensitivity to the surface defects, that is higher in PDS, but can also distort FTPS spectra (see Figure 1a). Surface defect absorption may lead to erroneous features on the apparent (as evaluated) absorption coefficient. Therefore, methods of surface defect determination were proposed [10,11], allowing the determination of true (surface corrected) absorption coefficient. The measurement of thickness series is one such way of determining bulk and surface defect absorptance in the case of solar cells [12].
Traditionally, absorptance is not considered to be a good reference value, and the absorption coefficient, being the true material constant, has to be evaluated instead. Many methods can be applied [13,14,15] to obtain the absolute absorption coefficient for layers on glass. Once the absorption coefficient of the bulk is obtained, the volume defect density of amorphous silicon can be evaluated by taking the value α (1.2 eV) and multiplying it with 2.4 × 10¹⁶–5 × 1016 cm−2 for FTPS (or 1.2 × 1016 cm−2–2.5 × 1016 cm−2 for PDS) according to [16]. Since the volume density of atoms in amorphous Si is around 4 × 1022 cm−2, we may approximately attribute the α (1.2 eV) roughly to the defect ppm (parts per million). The level of 1 ppm is a benchmark for a state-of-the-art laboratory-grade material prepared by capacitively-coupled diode plasma-enhanced chemical vapor deposition (PE-CVD) in a light-soaked state (1000 h, 1 sun, 50 °C) (see Figure 1b) [2,17].
Unfortunately, in the case of optical scattering due to rough surfaces [18], or in the case of solar cells, it is not possible to simply evaluate the absorption coefficient due to light absorption enhancement. Recently, the absorptance at 1.2 eV has been scaled as the internal quantum efficiency and a relation to the fill factor (FF) has been shown [12]. In this approach, the defect density is multiplied by an effective absorber thickness—i.e., the effective length of the photon path in the absorber. A difficulty in this measurement is the determination of the (energy-dependent) effective thickness. This prevents a simple relation to the absorption coefficient and defect density. In this contribution, we follow two different strategies applied for solar cells. We either take the unscaled FTPS spectrum and calculate the radiative limit, or we scale the FTPS spectrum according to an absorptance of a flat reference layer deposited on glass—in this work, this is measured by the PDS.
Finally, for PV device development, it is important to predict the relationship between defect density and device performance. Many laboratories have shown that making the intrinsic absorber layer thicker (to generate a higher current density) decreases the electrical performance—quantified by open-circuit voltage (VOC) and FF. The drop becomes especially pronounced after light soaking [19,20,21,22,23]. In our approach, light soaking or annealing is used as a simple way to vary the defect density due to the Staebler–Wronski effect [24]. Therefore, by measuring FTPS and performing light soaking, it is possible to obtain a quantitative relation between the VOC and the defect density. In this contribution, we demonstrate this on a set of cells with different thicknesses and compare the results with electrical and thermodynamic calculations.

2. Materials and Methods

A set of high-efficiency a-Si:H p-i-n solar cells with i-layer thicknesses of 120, 200, 300, 500 and 1000 nm were deposited on rough ZnO substrates grown by low-pressure chemical vapor deposition (LPCVD). Further details of the sample preparation are given in [22,25]. In addition to the solar cells, a 240 nm thick layer of intrinsic a-Si:H absorber material was deposited on glass, using the same deposition conditions as in the solar cells. Prior to the analysis, cells underwent different light soaking treatments, under approximately 200 mW/cm2 of orange light (cut-off filter passing energies below 2.1 eV) at 40 °C for up to a few days. This procedure guaranteed comparable starting states of the solar cells (after initial irreproducible performance changes) and allowed us to access the effect of metastable defects in the absorber layer. Devices were subsequently annealed in an inert atmosphere at 150 °C to gradually reduce the active defect concentration. During the annealing steps, the VOC was measured under a metal halide lamp with intensity adjusted by a reference a-Si:H cell so that the same current was obtained as with standard AM1.5G (1000 W/m2) illumination. At the same time, the defect density was evaluated by FTPS.
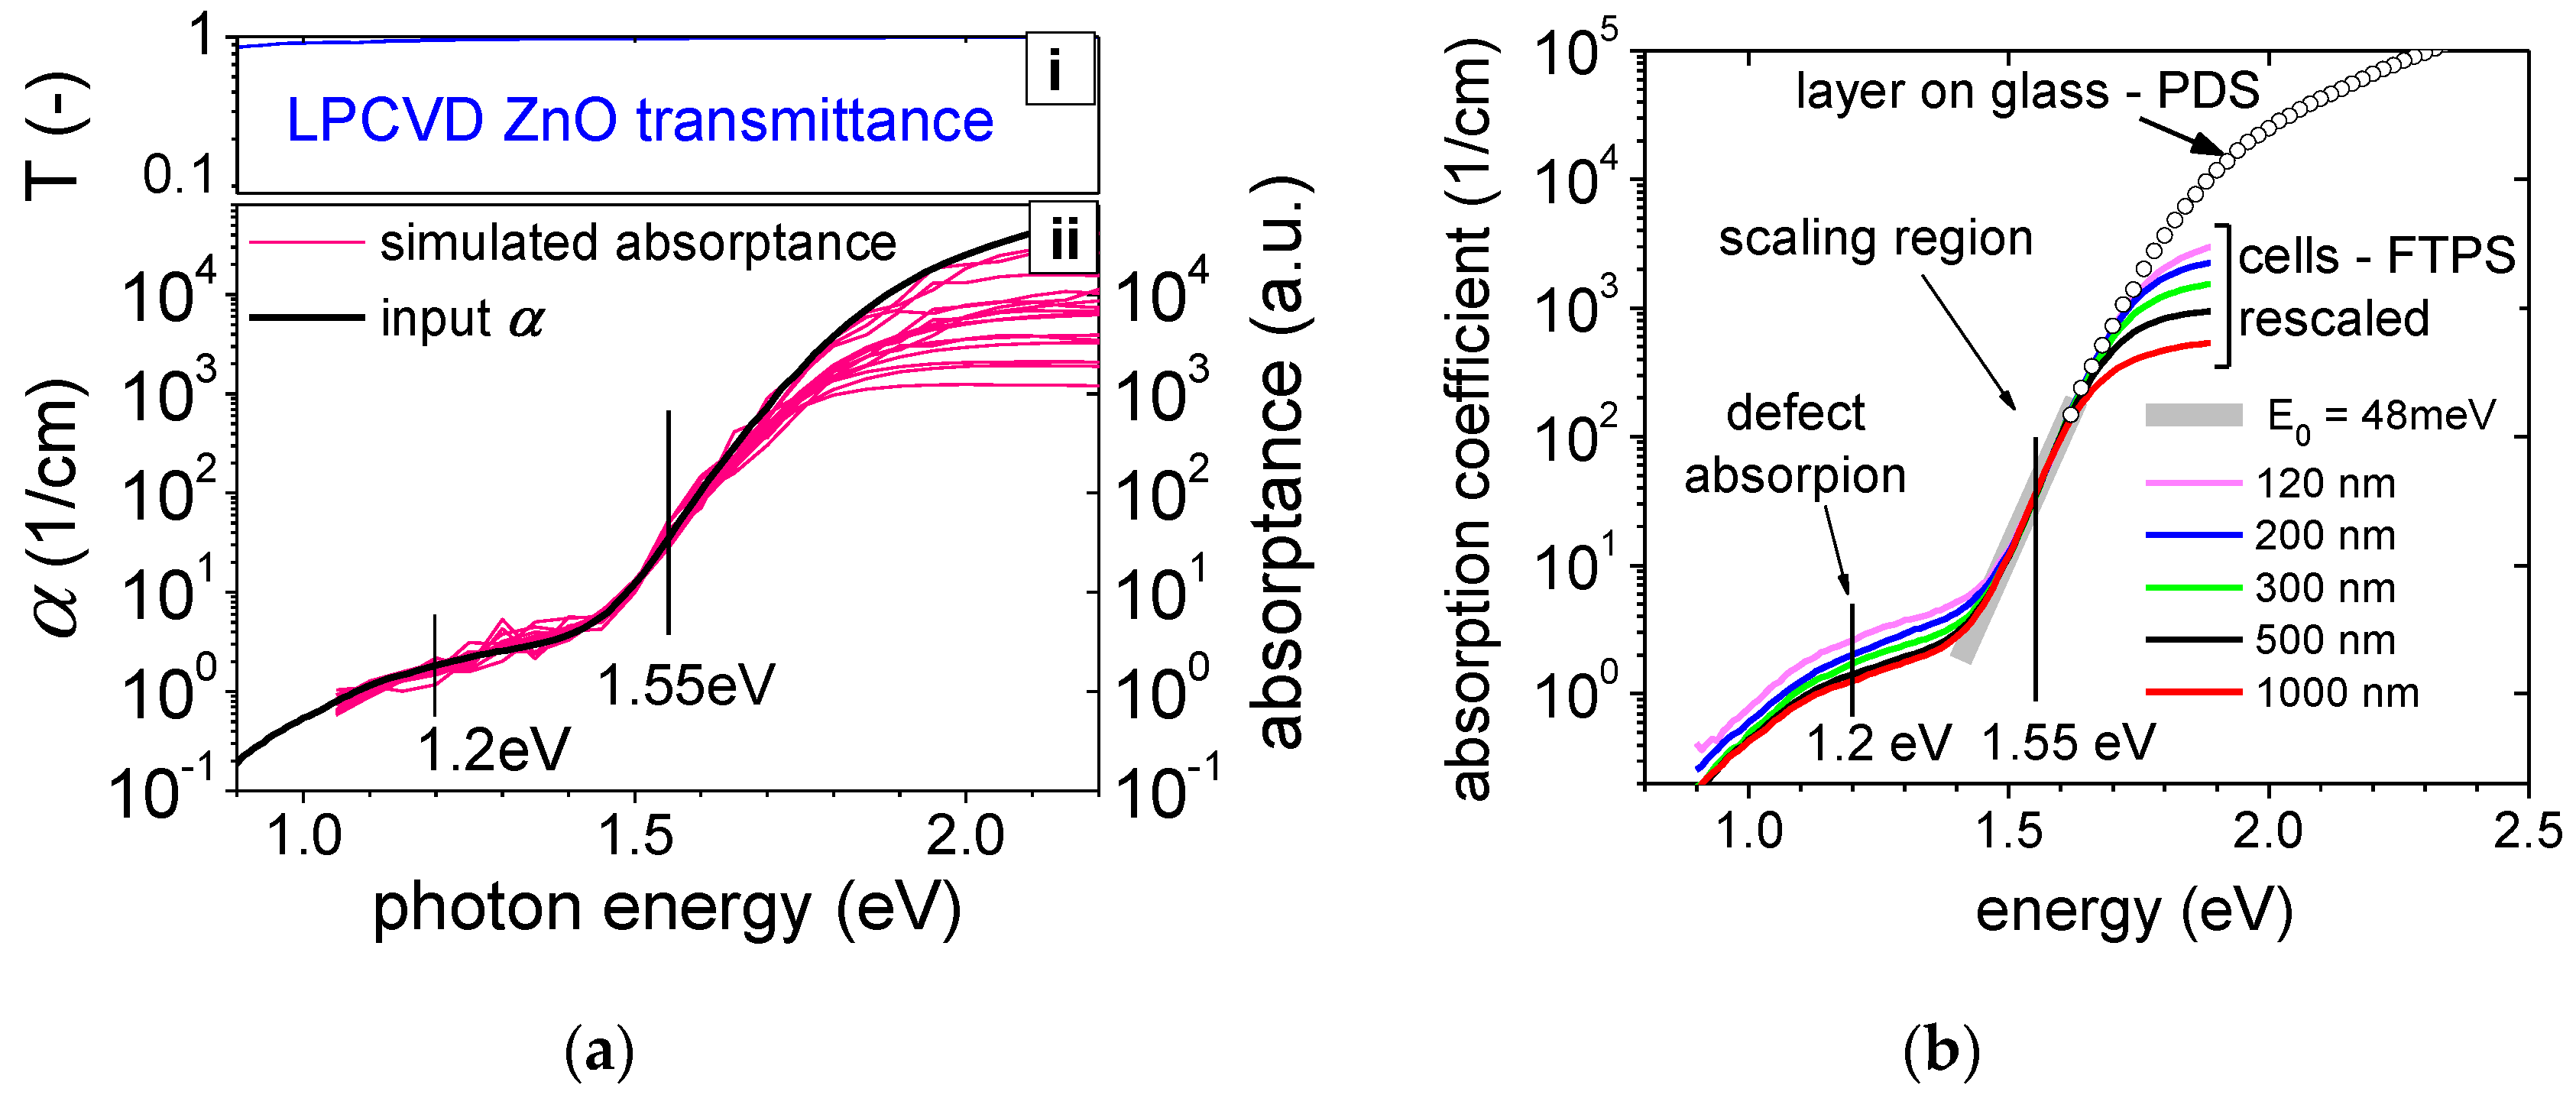
The FTPS setup was based on a Thermo Nicolet 8700 FTIR (used for light modulation) equipped with an external 100 W tungsten lamp, Stanford Research SR570 preamplifier, and a set of color glass filters. Using an optical ray tracing model [26], we demonstrate in Figure 2a (ii) that the shape of the absorptance, that is attributed to FTPS signal, is very close to the shape of the absorption coefficient in the low absorption region, especially between 1.2 eV and the beginning of absorption edge (Urbach slope)—in our case at 1.55 eV. Additionally, we show in Figure 2a (i) that the effect of absorption in the LPCVD ZnO leads to an error of no more than 10%. Therefore, the problem of absolute absorption-coefficient evaluation at 1.2 eV can be transferred to a problem of proper absolute scaling of a point at 1.55 eV. At this point, the true absorption coefficient can be obtained from the PDS measurement of a layer on glass. More accurate scaling is obtained when the steepest part of the FTPS curve is extended (indicated by the thick grey line in Figure 2b before stitching to the PDS data. This approach is valid when assuming that the absorption coefficient—especially the bandgap of the material—is substrate independent. Exceptions from this assumption are discussed in [27].
Alternatively, if an absolute value of the absorption coefficient is not available for scaling the FTPS data, the thermodynamic limit is used. A limit to the device’s V OC using the same calculations as for the so-called radiative limit can be found [28,29,30,31]. FTPS data correspond directly to the (arbitrarily scaled) external quantum efficiency ( E Q E ). With this we can calculate the radiative limit to V OC for such a device, V OC , rad , using Equations (1)–(4), in which k is Boltzmann constant, T is the temperature, e is the electron charge, J 0 , r a d is the saturation current due to radiative recombination and Φ ( AM 1.5 G ) is the tabulated reference solar spectrum. Usually, the exponential (Urbach) slope is used to extrapolate the absorption below the bandgap and no defect-related sub-bandgap absorption is considered. However, because the sub-bandgap absorption is in the range which overlaps with Φ bb ( 300 K ) , the defect-related absorption may strongly increase the radiative recombination and J 0 , r a d , and therefore decrease V OC , rad . This motivates us to use the same radiative limit while including defect-related absorption.
V OC , rad = k T e ln { 1 + J S C J 0 , r a d }
J S C = E Q E · Φ ( AM 1.5 G )
J 0 , r a d = E Q E · Φ bb ( 300 K )
Thanks to reciprocity, the term EQE can be used directly in Equation (3) at the place of emissivity. The blackbody radiation Φ bb is calculated according to Equation (4), where h is the Planck constant, c is the speed of light and λ is the wavelength.
Φ bb = 2 π h c 2 λ 4 E 2 1 exp ( E / k T ) 1
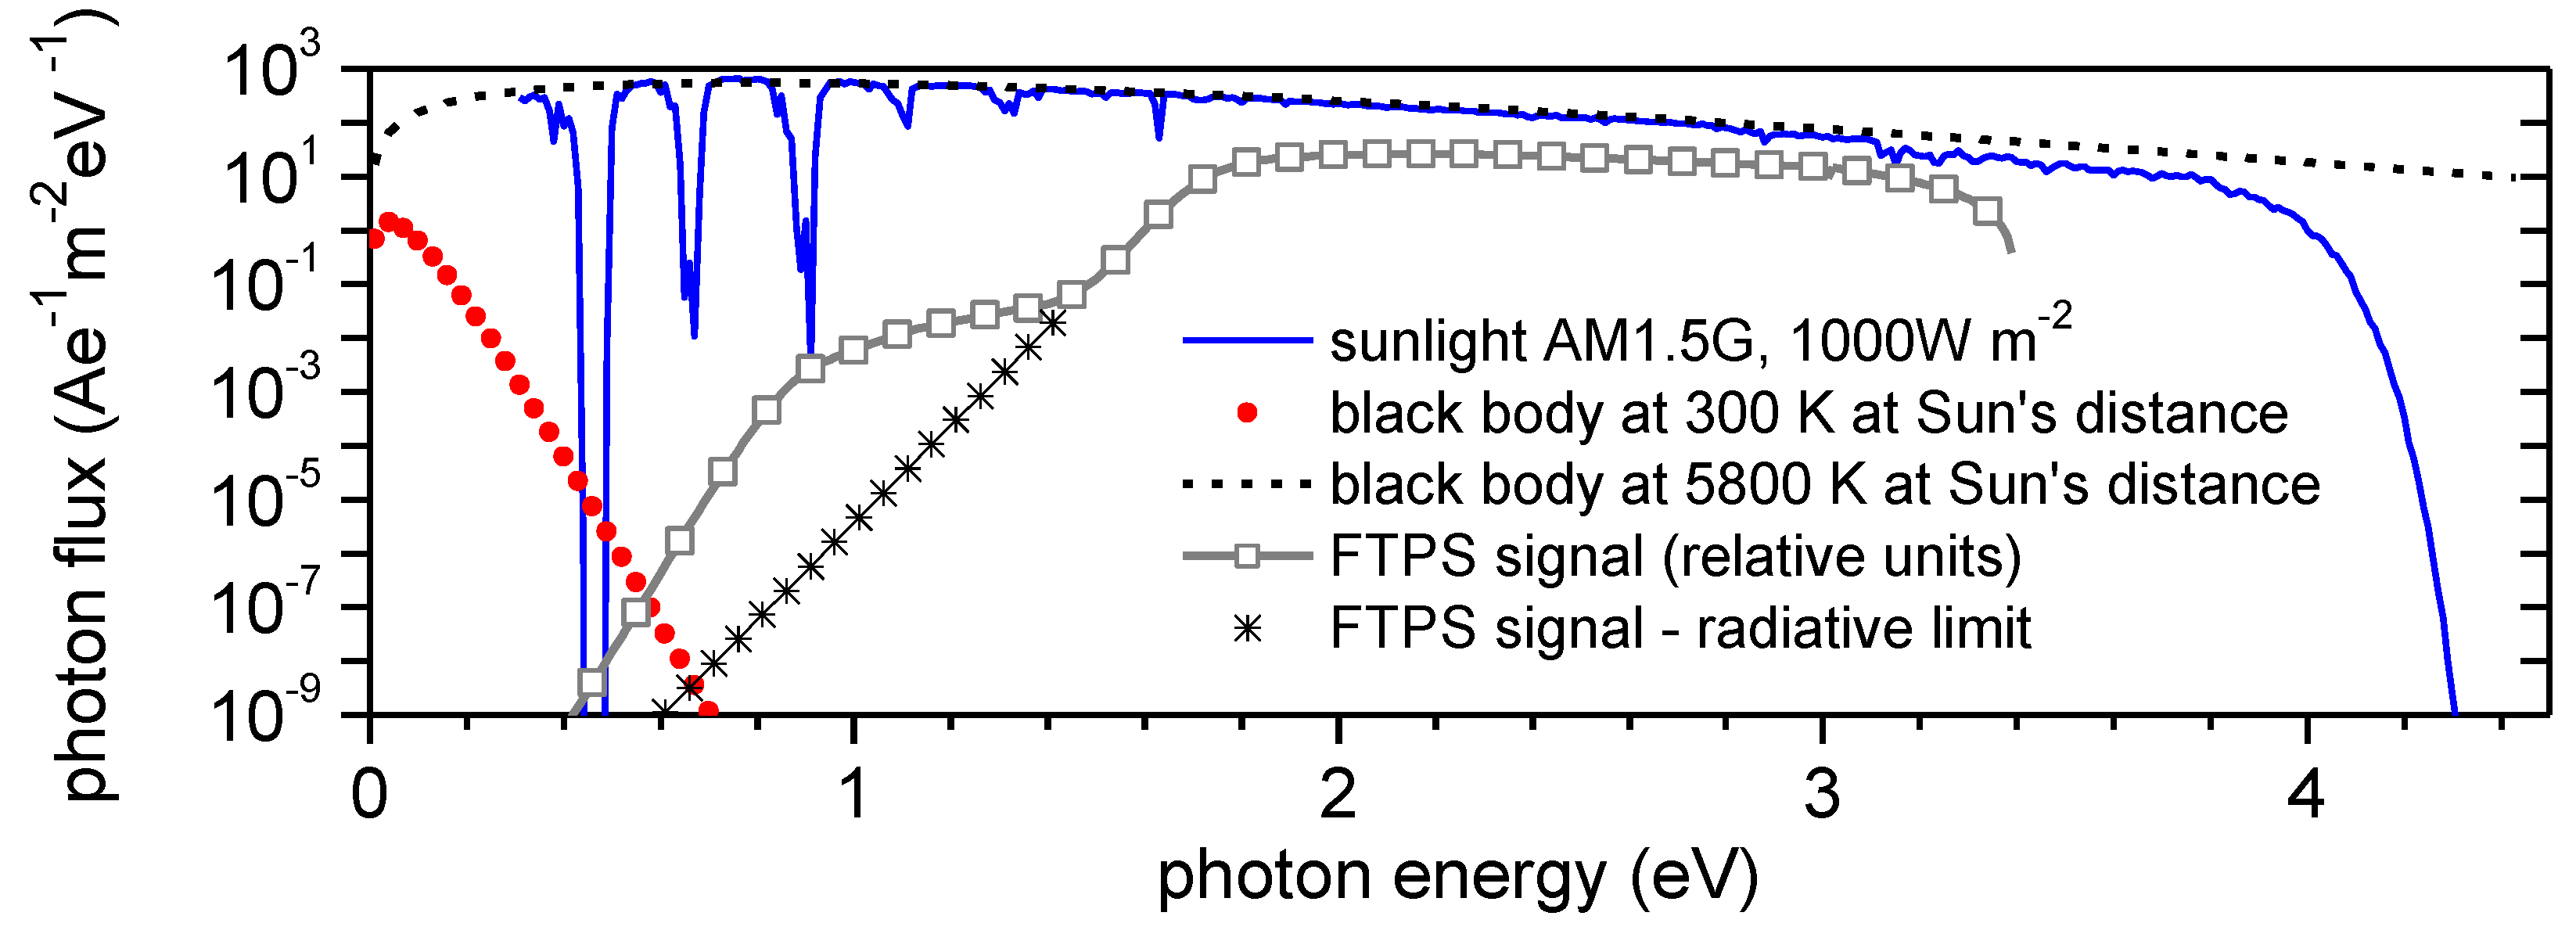
In Figure 3, we show the spectra that are inputs to Equation (1). We also show Φ bb at 5800 K as this is used to extrapolate Φ ( AM 1.5 G ) in the infrared beyond the tabulated values. Similarly, the FTPS signal was extrapolated by an exponential below 0.9 eV. The exponential slope used for extrapolation corresponds to Urbach energy 30 meV. This value was guessed based on previous reports on measurements of this slope [32]. This extrapolation of the low-energy part of the spectrum is critical and strongly dependent on the slope used. On the other hand, in the high energy part, the extrapolation has a much lower impact on the results of Equation (1), as Φ bb ( 300 K ) is negligible in this range (Figure 3).

3. Results

In order to provide more universal values—independent of the bandgap of the a-Si:H material—we plot so-called voltage deficit (sometimes labelled as WOC)—i.e., the difference between bandgap Egap and VOC. The bandgap value E gap = 1.69 eV was obtained from the Tauc plot of (αE)0.5 versus E, where E is photon energy, in the range where (αE)0.5 is between 150 and 300 (eV/cm)0.5.
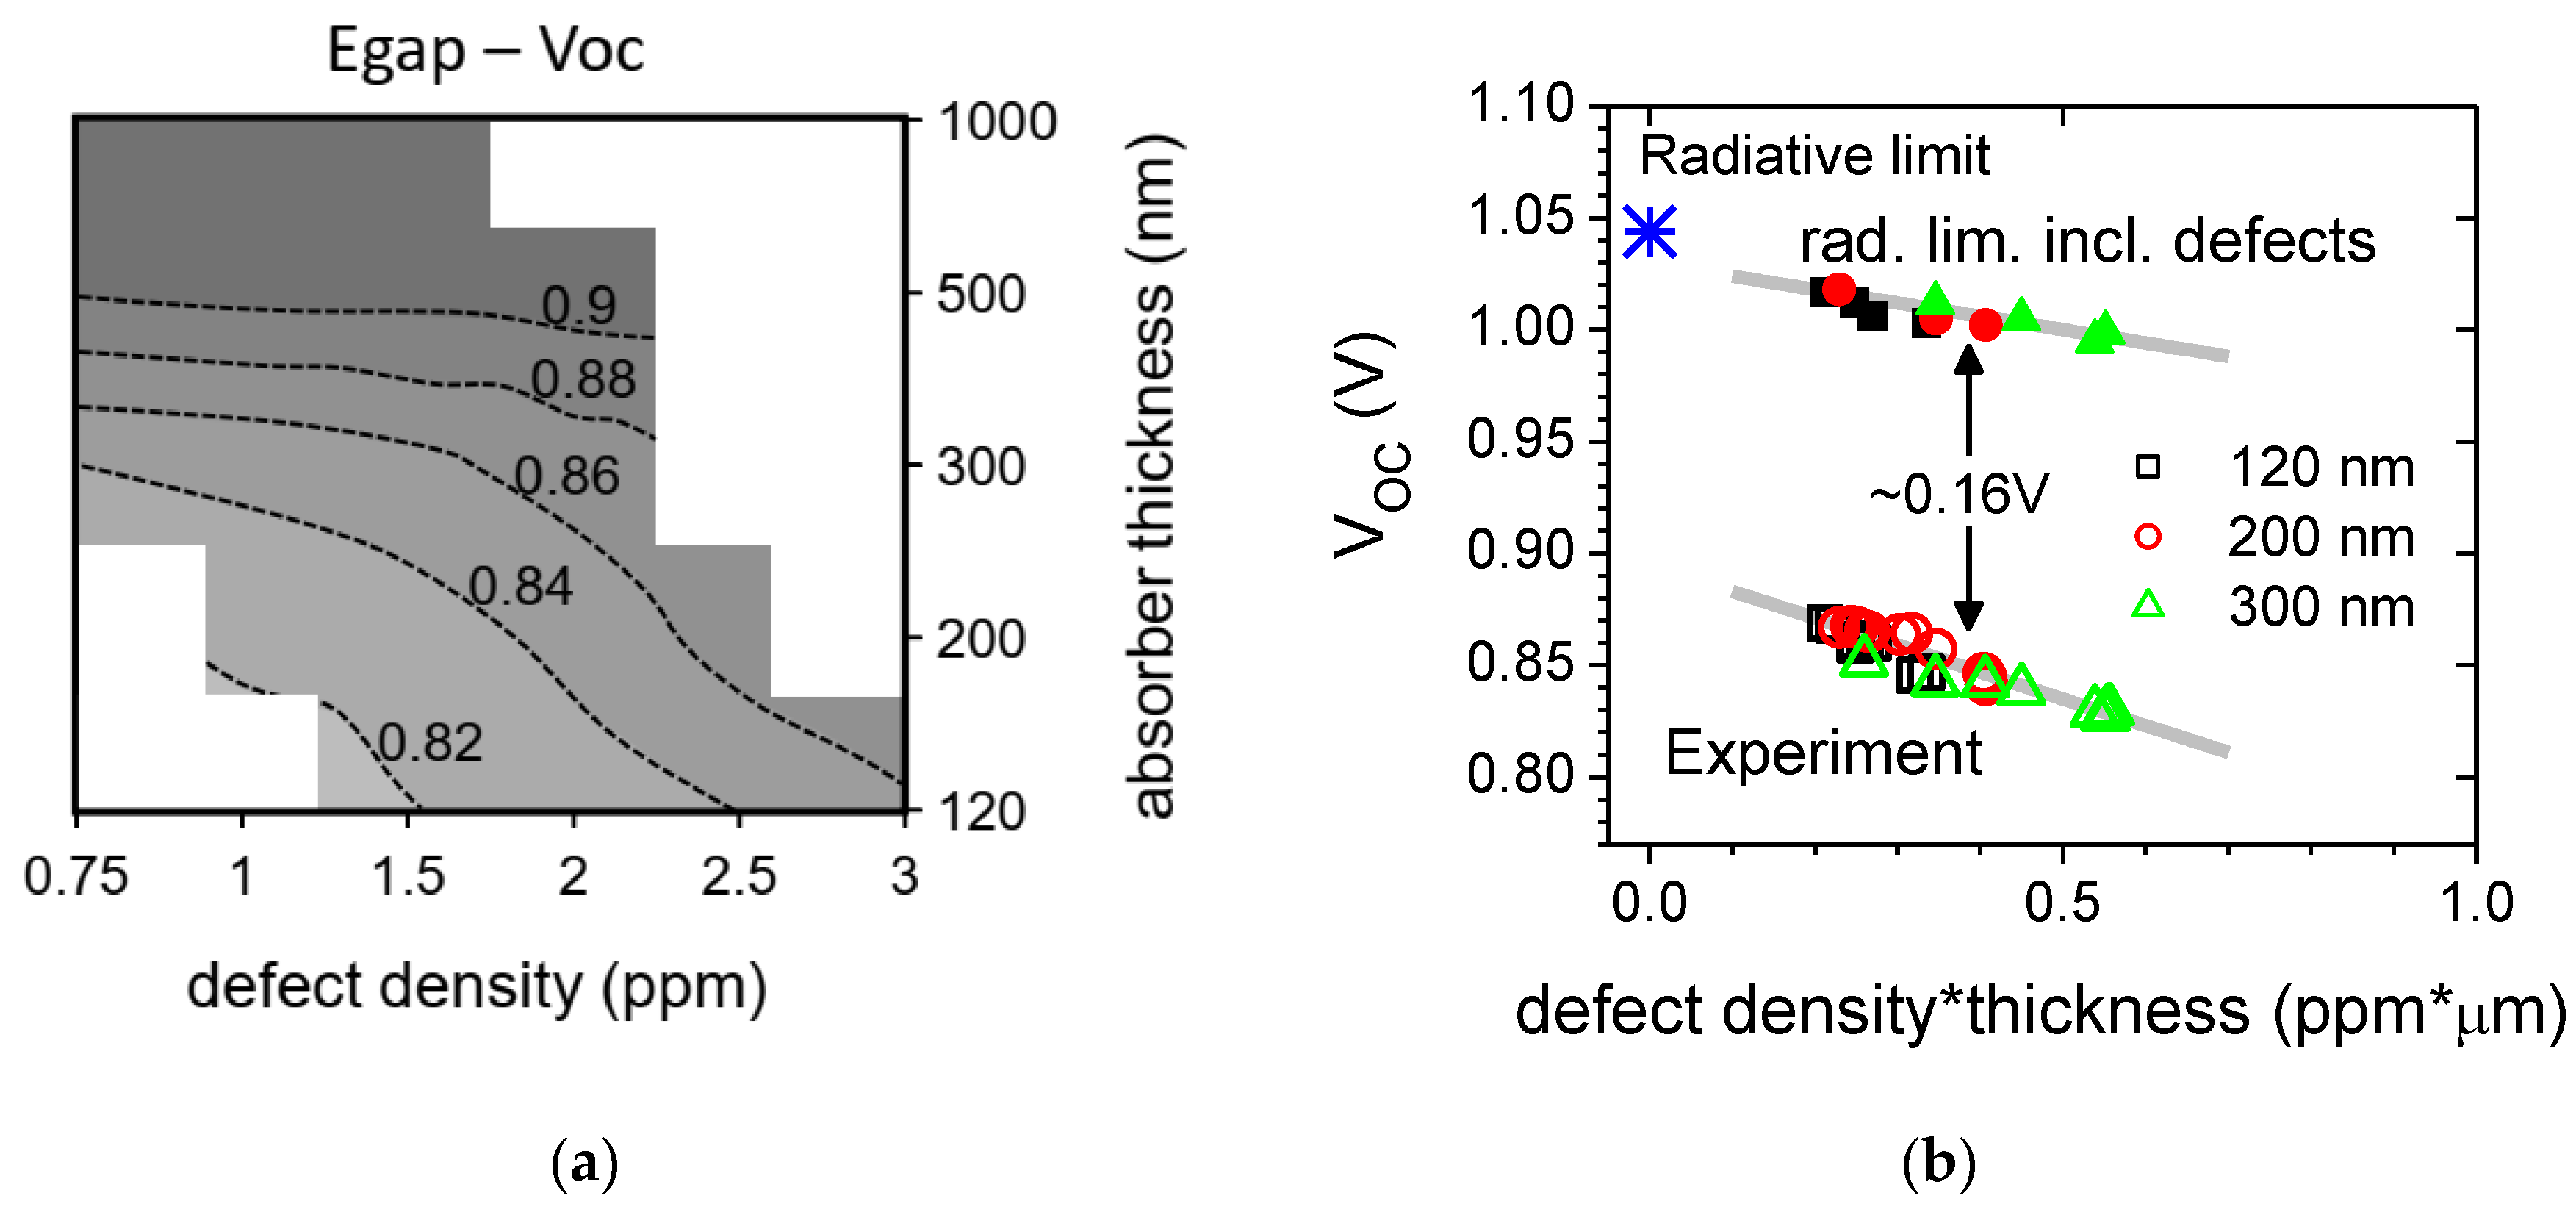
The E gap V OC values are correlated with the defect density and the absorber thickness in the contour plot in Figure 4a. For a given defect density and thickness, the attainable voltage can be assessed. It is also useful to plot the V OC (or E gap V OC ) as a function of the total number of defects—i.e., defect density times absorber thickness. The data follow a linear trend, as shown in Figure 4b. Interestingly, the linear trends for different thicknesses are related. We observed that, after multiplying defect density by thickness (i.e., taking the total amount of defects) the datasets lie on the same straight line. This demonstrates that it is indeed the total number of defects rather than the defect density, independent of thickness, that actually matters.
Interestingly, the radiative limit (with including defect absorption) yields almost the same trend with only a relatively small margin in the voltage (~0.16 V) that is attributed to non-radiative losses. Additionally, the actual defect density itself is responsible for a relatively small portion of voltage drop. This confirms that amorphous silicon fundamentally cannot achieve high efficiencies, as predicted already by Tiedje [28].

4. Discussion

To corroborate and expand upon experimental results, numerical simulations were performed in AFORS-HET [33]. A simplified structure was investigated, with an intrinsic a-Si:H absorber and ideal contacts, realized through highly asymmetric hole and electron surface recombination velocities (107 cm/s vs. 1 cm/s). The same absorber layer thicknesses were used as in the experiment, and the total defect density in a Gaussian distribution within the energy gap was varied from 3 × 10¹⁶ to 1.2 × 1017 cm−3 (0.75–3.0 ppm) for all thicknesses. The Urbach energy was set to 48 meV. Current–voltage curves under AM1.5g (1000 W/m2) illumination were simulated to find the V OC .
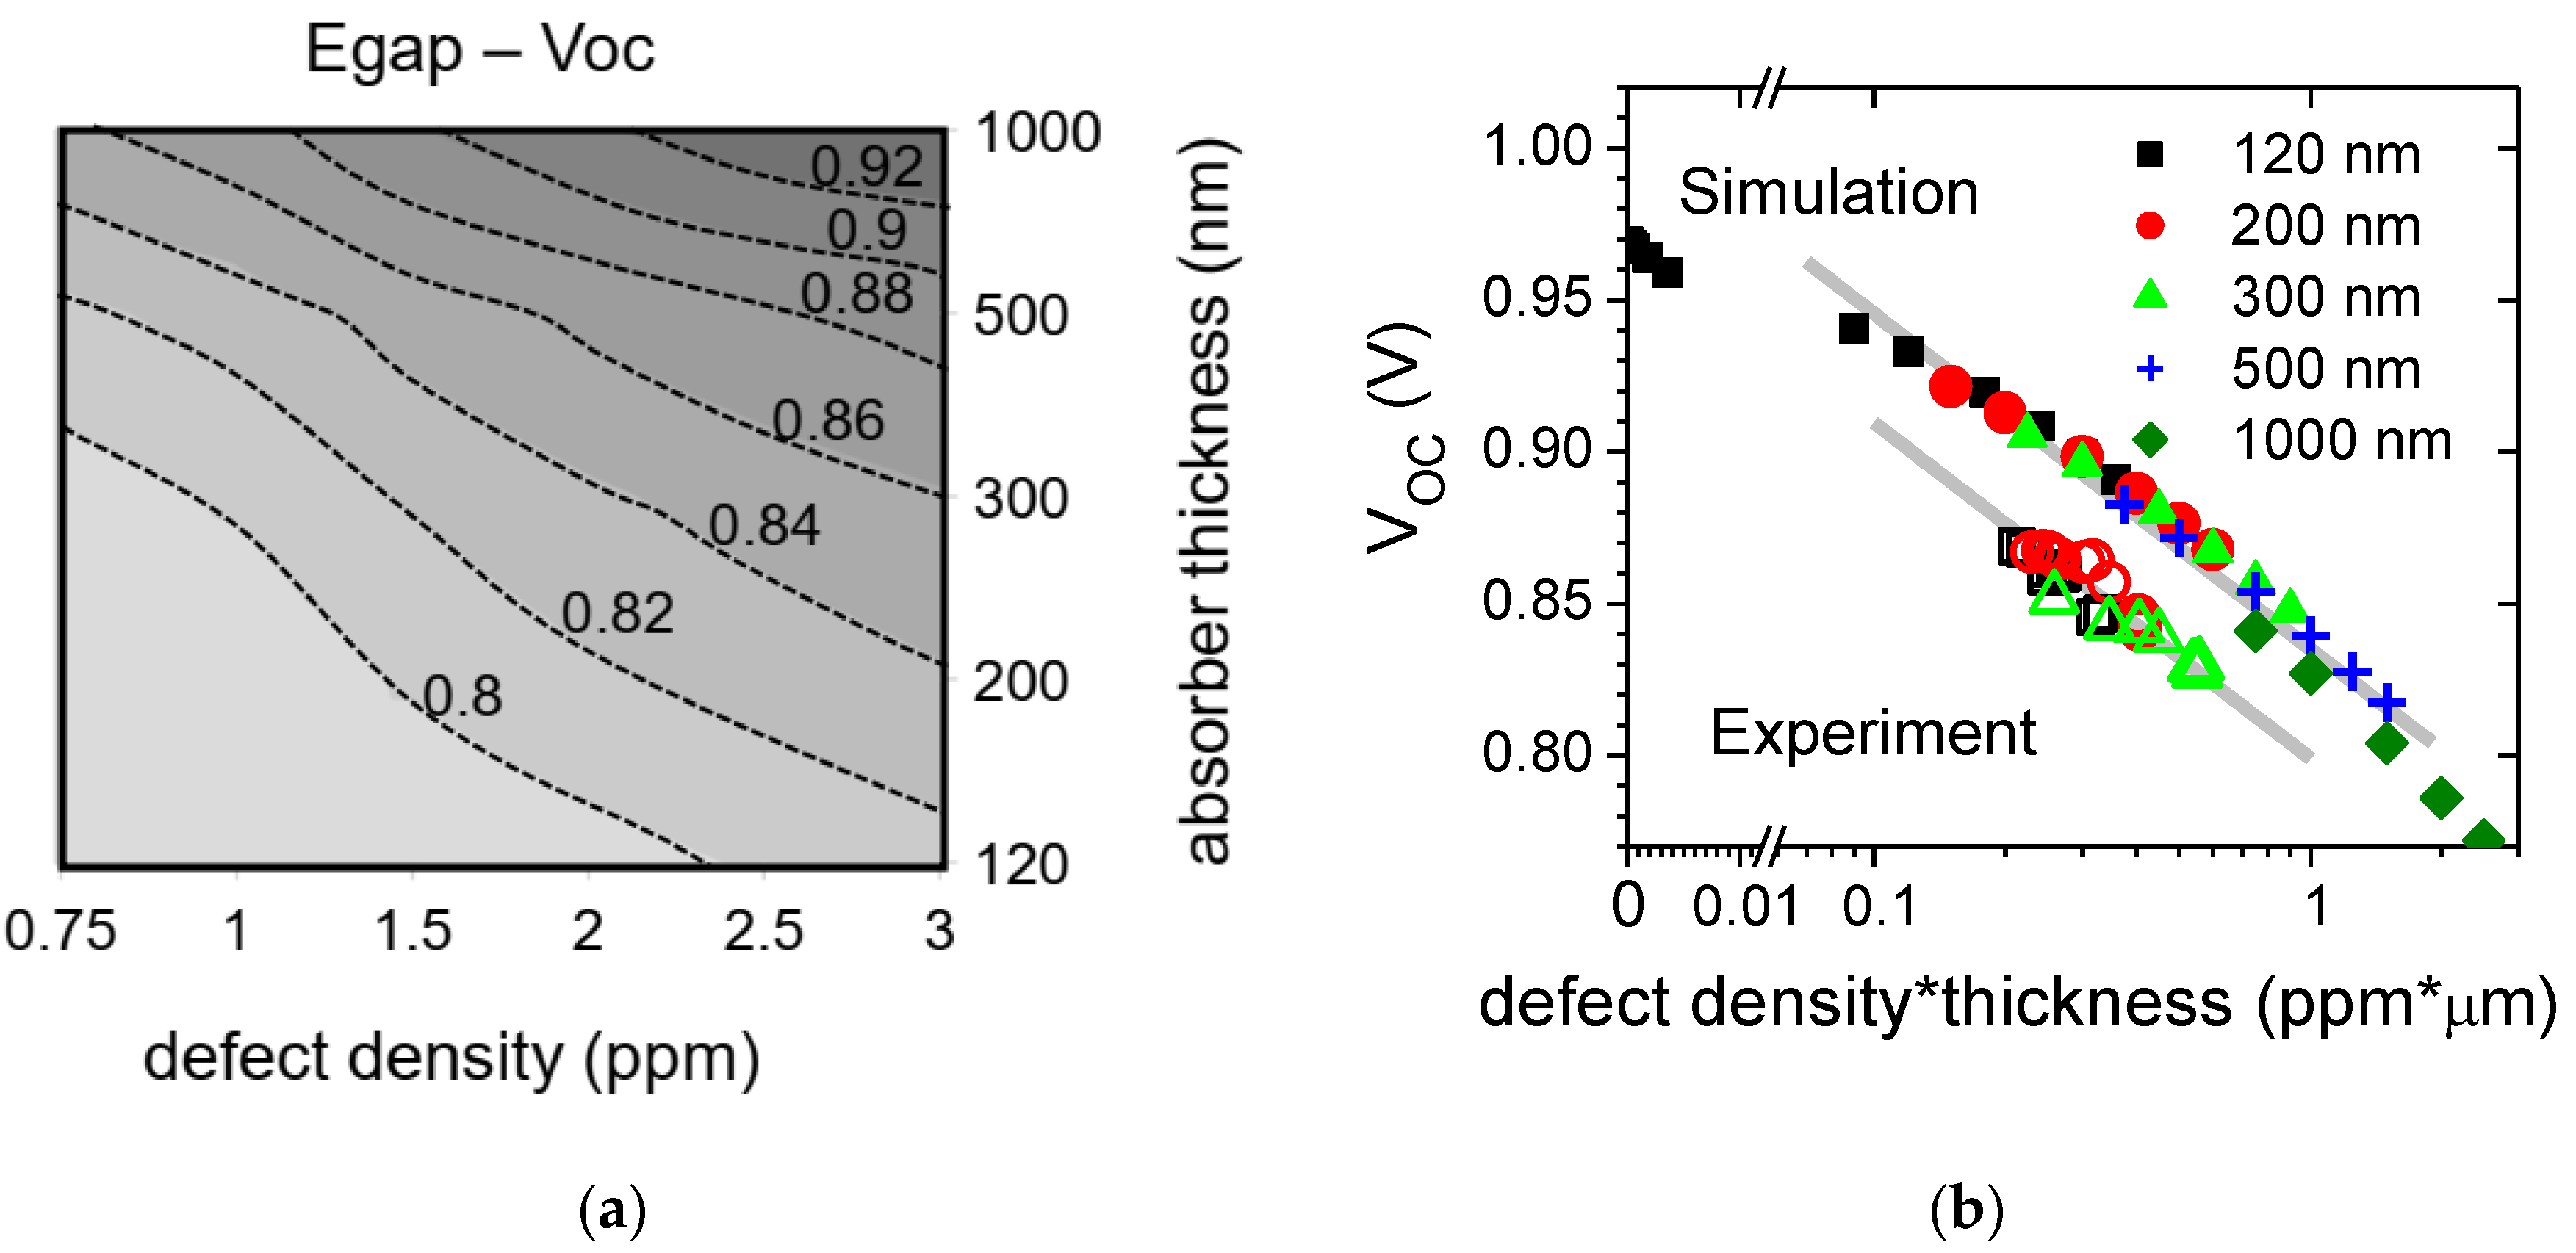
The AFORS-HET simulations show the same trend in V OC with defect density and absorber thickness as the experimental results, albeit with a higher V OC (see Figure 5). The total number of defects continues to be the crucial factor in determining V OC , with the results of all thicknesses lying on the same curve, as shown in Figure 5b. The extension of the regions by the simulated data points reveals that this curve is better characterized by a logarithmic trend. However, logarithmic relation may suggest an infinite voltage for zero defect density, but this does not happen because, at lower defect densities (below ~0.5 ppm), V OC becomes limited by radiative recombination through tails states (see again blue star in Figure 4b). Therefore, more points were simulated close to zero defect density, where the trend changes to linear. Conversely, at the highest defect densities in the thickest devices, the datapoints also deviate from the trend due to current-collection losses.
The higher V OC seen in simulations compared to the experiment likely arise from the imperfect representation of the solar cells by the model. However, developing a more complex or carefully calibrated model is beyond our scope, as we aimed to test the general trend of the V OC dependence on the total number of defects. This trend was observed by both our simulations and experiment as well as by the approximation using the radiative limit including defect absorption. The radiative limit including defect density clearly does not include the non-radiative recombination also caused by the defects that are also present. This is the reason why the experimental values are lower and why the experimental trend is dropping faster, compared to the thermodynamic limit.

5. Conclusions

We have demonstrated that FTPS spectra used in conjunction with the absorption coefficient obtained from PDS on a separately deposited layer on glass can be used to determine the absolute defect density in a-Si:H and potentially other thin-film solar cells. Within the range of state-of-the-art a-Si:H solar cells, the total number of defects (the defect density multiplied by the device thickness) rather than the volume defect concentration was found to determine the maximum achievable V OC . This was confirmed by computer simulations of the semiconductor device. Without the need for any scaling of FTPS spectra (therefore, without the need for reference layers on glass) the radiative limit, including defect absorption, can be determined. This limit describes the vast majority of all voltage losses in the amorphous silicon device, leaving only around 0.16 V to non-radiative losses. This limit follows the same trends in the dependence of the V OC on the total number of defects and can, therefore, be a useful parameter, also serving as an upper bound of V OC potential.

Author Contributions

Conceptualization, J.H. and M.S.; investigation (sample preparation), M.S., M.M., A.P.A., and F.-J.H.; investigation (FTPS), T.F.; investigation (simulations), B.C.; data curation, J.H.; writing—original draft preparation, J.H.; writing—review and editing, B.C.; All authors have read and agreed to the published version of the manuscript.

Funding

This research was funded by the FP7 project “Fast Track”, funded by the EC under grant agreement 283501, Czech Ministry of Education, Youth and Sports grants no. CZ. 02.1.01/0.0/0.0/15_003/0000464—“Centre of Advanced Photovoltaics” and No. CZ.02.1.01/0.0/0.0/16_019/0000760—“SOLID21”, Czech Science Foundation grant No. 18-24268S.

Acknowledgments

We acknowledge the help of Luboš Musálek with simulations.

Conflicts of Interest

The authors declare no conflict of interest.

References

  1. Vanecek, M.; Poruba, A. Fourier-transform photocurrent spectroscopy of microcrystalline silicon for solar cells. Appl. Phys. Lett. 2002, 80, 719–721. [Google Scholar] [CrossRef]
  2. Melskens, J.; Vanelzakker, G.; Li, Y.; Zeman, M. Analysis of hydrogenated amorphous silicon thin films and solar cells by means of Fourier Transform Photocurrent Spectroscopy. Thin Solid Films 2008, 516, 6877–6881. [Google Scholar] [CrossRef]
  3. Vandewal, K.; Goris, L.; Haeldermans, I.; Nesladek, M.; Haenen, K.; Wagner, P.; Manca, J. Fourier-transform photocurrent spectroscopy for a fast and highly sensitive spectral characterization of organic and hybrid solar cells. Thin Solid Films 2008, 516, 7135–7138. [Google Scholar] [CrossRef] [Green Version]
  4. De Wolf, S.; Holovsky, J.; Moon, S.-J.; Löper, P.; Niesen, B.; Ledinsky, M.; Haug, F.-J.; Yum, J.-H.; Ballif, C. Organometallic halide perovskites: Sharp optical absorption edge and its relation to photovoltaic performance. J. Phys. Chem. Lett. 2014, 5, 1035–1039. [Google Scholar] [CrossRef]
  5. Tang, X.; Brandl, M.; May, B.; Levchuk, I.; Hou, Y.; Richter, M.; Chen, H.; Chen, S.; Kahmann, S.; Osvet, A.; et al. Photoinduced degradation of methylammonium lead triiodide perovskite semiconductors. J. Mater. Chem. A 2016, 4, 15896–15903. [Google Scholar] [CrossRef] [Green Version]
  6. Holovský, J.; De Wolf, S.; Werner, J.; Remeš, Z.; Müller, M.; Neykova, N.; Ledinský, M.; Černá, L.; Hrzina, P.; Löper, P.; et al. Photocurrent Spectroscopy of Perovskite Layers and Solar Cells: A sensitive probe of material degradation. J. Phys. Chem. Lett. 2017, 8, 838–843. [Google Scholar] [CrossRef]
  7. Holovský, J.; Peter Amalathas, A.; Landová, L.; Dzurňák, B.; Conrad, B.; Ledinský, M.; Hájková, Z.; Pop-Georgievski, O.; Svoboda, J.; Yang, T.C.-J.; et al. Lead halide residue as a source of light-induced reversible defects in hybrid perovskite layers and solar cells. ACS Energy Lett. 2019, 4, 3011–3017. [Google Scholar] [CrossRef]
  8. Tomm, J.W.; Jaeger, A.; Bärwolff, A.; Elsaesser, T.; Gerhardt, A.; Donecker, J. Aging properties of high power laser diode arrays analyzed by Fourier-transform photocurrent measurements. Appl. Phys. Lett. 1997, 71, 2233. [Google Scholar] [CrossRef]
  9. Holovský, J. Fourier transform photocurrent spectroscopy on non-crystalline semiconductors. In Fourier Transforms–New Analytical Approaches and FTIR Strategies; InTech Publishing: London, UK, 2011; pp. 257–282. ISBN 978–953-307-232-6. [Google Scholar]
  10. Curtins, H.; Favre, M. Surface and bulk states determined by photothermal deflection spectroscopy. In Amorphous Silicon and Related Materials; Fritzsche, H., Ed.; World Scientific Publishing Company: Singapore, 1988; pp. 329–363. [Google Scholar]
  11. Holovský, J.; Ballif, C. Thin-film limit formalism applied to surface defect absorption. Opt. Express 2014, 22, 31466. [Google Scholar] [CrossRef] [Green Version]
  12. Bidiville, A.; Matsui, T.; Matsubara, K. Analysis of bulk and interface defects in hydrogenated amorphous silicon solar cells by Fourier transform photocurrent spectroscopy. J. Appl. Phys. 2015, 118, 184506. [Google Scholar] [CrossRef]
  13. Ritter, D.; Weiser, K. Suppression of interference fringes in absorption measurements on thin films. Opt. Commun. 1986, 57, 336–338. [Google Scholar] [CrossRef]
  14. Vaněček, M.; Kočka, J.; Poruba, A.; Fejfar, A. Direct measurement of the deep defect density in thin amorphous silicon films with the “absolute” constant photocurrent method. J. Appl. Phys. 1995, 78, 6203–6210. [Google Scholar] [CrossRef]
  15. Holovský, J.; Schmid, M.; Stuckelberger, M.; Despeisse, M.; Ballif, C.; Poruba, A.; Vaněček, M. Time evolution of surface defect states in hydrogenated amorphous silicon studied by photothermal and photocurrent spectroscopy and optical simulation. J. Non-Cryst. Solids 2012, 358, 2035–2038. [Google Scholar] [CrossRef]
  16. Wyrsch, N.; Finger, F.; Mcmahon, T.; Vanecek, M. How to reach more precise interpretation of subgap absorption spectra in terms of deep defect density in a-Si:H. J. Non-Cryst. Solids 1991, 137, 347–350. [Google Scholar] [CrossRef]
  17. van Elzakker, G.; Šutta, P.; Tichelaar, F.D.; Zeman, M. Phase control and stability of thin silicon films deposited from silane diluted with hydrogen. Mrs Proc. 2007, 989. [Google Scholar] [CrossRef]
  18. Poruba, A.; Fejfar, A.; Remeš, Z.; Špringer, J.; Vaněček, M.; Kočka, J.; Meier, J.; Torres, P.; Shah, A. Optical absorption and light scattering in microcrystalline silicon thin films and solar cells. J. Appl. Phys. 2000, 88, 148. [Google Scholar] [CrossRef]
  19. Benagli, S. High performance LPCVD-ZnO TCO used in p-i-n amorphous silicon & Micromorph® tandem deviced prepared in industrial KAI R&D reactor. In Proceedings of the 23rd European Photovoltaic Solar Energy Conference, Valencia, Spain, 1–5 September 2008; pp. 2414–2418. [Google Scholar]
  20. Stuckelberger, M.; Shah, A.; Krc, J.; Despeisse, M.; Meillaud, F.; Ballif, C. Internal electric field and fill factor of amorphous silicon solar cells. In Proceedings of the 2010 35th IEEE Photovoltaic Specialists Conference, Honolulu, HI, USA, 20–25 June 2010; pp. 1569–1574. [Google Scholar]
  21. Melskens, J.; Schouten, M.; Mannheim, A.; Vullers, A.S.; Mohammadian, Y.; Eijt, S.W.H.; Schut, H.; Matsui, T.; Zeman, M.; Smets, A.H.M. The nature and the kinetics of light-induced defect creation in hydrogenated amorphous silicon films and solar cells. IEEE J. Photovolt. 2014, 4, 1331–1336. [Google Scholar] [CrossRef]
  22. Stuckelberger, M.; Billet, A.; Riesen, Y.; Boccard, M.; Despeisse, M.; Schüttauf, J.-W.; Haug, F.-J.; Ballif, C. Comparison of amorphous silicon absorber materials: Kinetics of light-induced degradation: Comparison of amorphous silicon absorber materials: Kinetics of light-induced degradation. Prog. Photovolt. Res. Appl. 2014, 24, 446–457. [Google Scholar] [CrossRef]
  23. Stuckelberger, M.; Biron, R.; Wyrsch, N.; Haug, F.-J.; Ballif, C. Review: Progress in solar cells from hydrogenated amorphous silicon. Renew. Sustain. Energy Rev. 2017, 76, 1497–1523. [Google Scholar] [CrossRef]
  24. Staebler, D.L.; Wronski, C.R. Reversible conductivity changes in discharge-produced amorphous Si. Appl. Phys. Lett. 1977, 31, 292. [Google Scholar] [CrossRef]
  25. Stuckelberger, M. Hydrogenated Amorphous Silicon: Impact of Process Conditions on Material Properties and Solar Cell Efficiency; Ecole Polytechnique Federale de Lausanne: Neuchâtel, Switzerland, 2014. [Google Scholar]
  26. Springer, J.; Poruba, A.; Vanecek, M. Improved three-dimensional optical model for thin-film silicon solar cells. J. Appl. Phys. 2004, 96, 5329. [Google Scholar] [CrossRef]
  27. Holovský, J.; Dagkaldiran, Ü.; Remeš, Z.; Purkrt, A.; Ižák, T.; Poruba, A.; Vaněček, M. Fourier transform photocurrent measurement of thin silicon films on rough, conductive and opaque substrates. Phys. Status Solidi 2010, 207, 578–581. [Google Scholar] [CrossRef]
  28. Tiedje, T. Band tail recombination limit to the output voltage of amorphous silicon solar cells. Appl. Phys. Lett. 1982, 40, 627–629. [Google Scholar] [CrossRef]
  29. Kirchartz, T.; Rau, U. Detailed balance and reciprocity in solar cells. Phys. Status Solidi 2008, 205, 2737–2751. [Google Scholar] [CrossRef]
  30. Jean, J.; Mahony, T.S.; Bozyigit, D.; Sponseller, M.; Holovský, J.; Bawendi, M.G.; Bulović, V. Radiative efficiency limit with band tailing exceeds 30% for quantum dot solar cells. ACS Energy Lett. 2017, 2, 2616–2624. [Google Scholar] [CrossRef]
  31. Mahesh, S.; Ball, J.M.; Oliver, R.D.J.; McMeekin, D.P.; Nayak, P.K.; Johnston, M.B.; Snaith, H.J. Revealing the origin of voltage loss in mixed-halide perovskite solar cells. Energy Environ. Sci. 2020, 13, 258–267. [Google Scholar] [CrossRef]
  32. Sládek, P.; Thèye, M.L.; Chahed, L. Analysis of the temperature dependence of the CPM-derived optical absorption spectra of hydrogenated amorphous silicon films. J. Non-Cryst. Solids 1993, 164, 363–366. [Google Scholar] [CrossRef]
  33. Varache, R.; Leendertz, C.; Gueunier-Farret, M.E.; Haschke, J.; Muñoz, D.; Korte, L. Investigation of selective junctions using a newly developed tunnel current model for solar cell applications. Sol. Energy Mater. Sol. Cells 2015, 141, 14–23. [Google Scholar] [CrossRef]
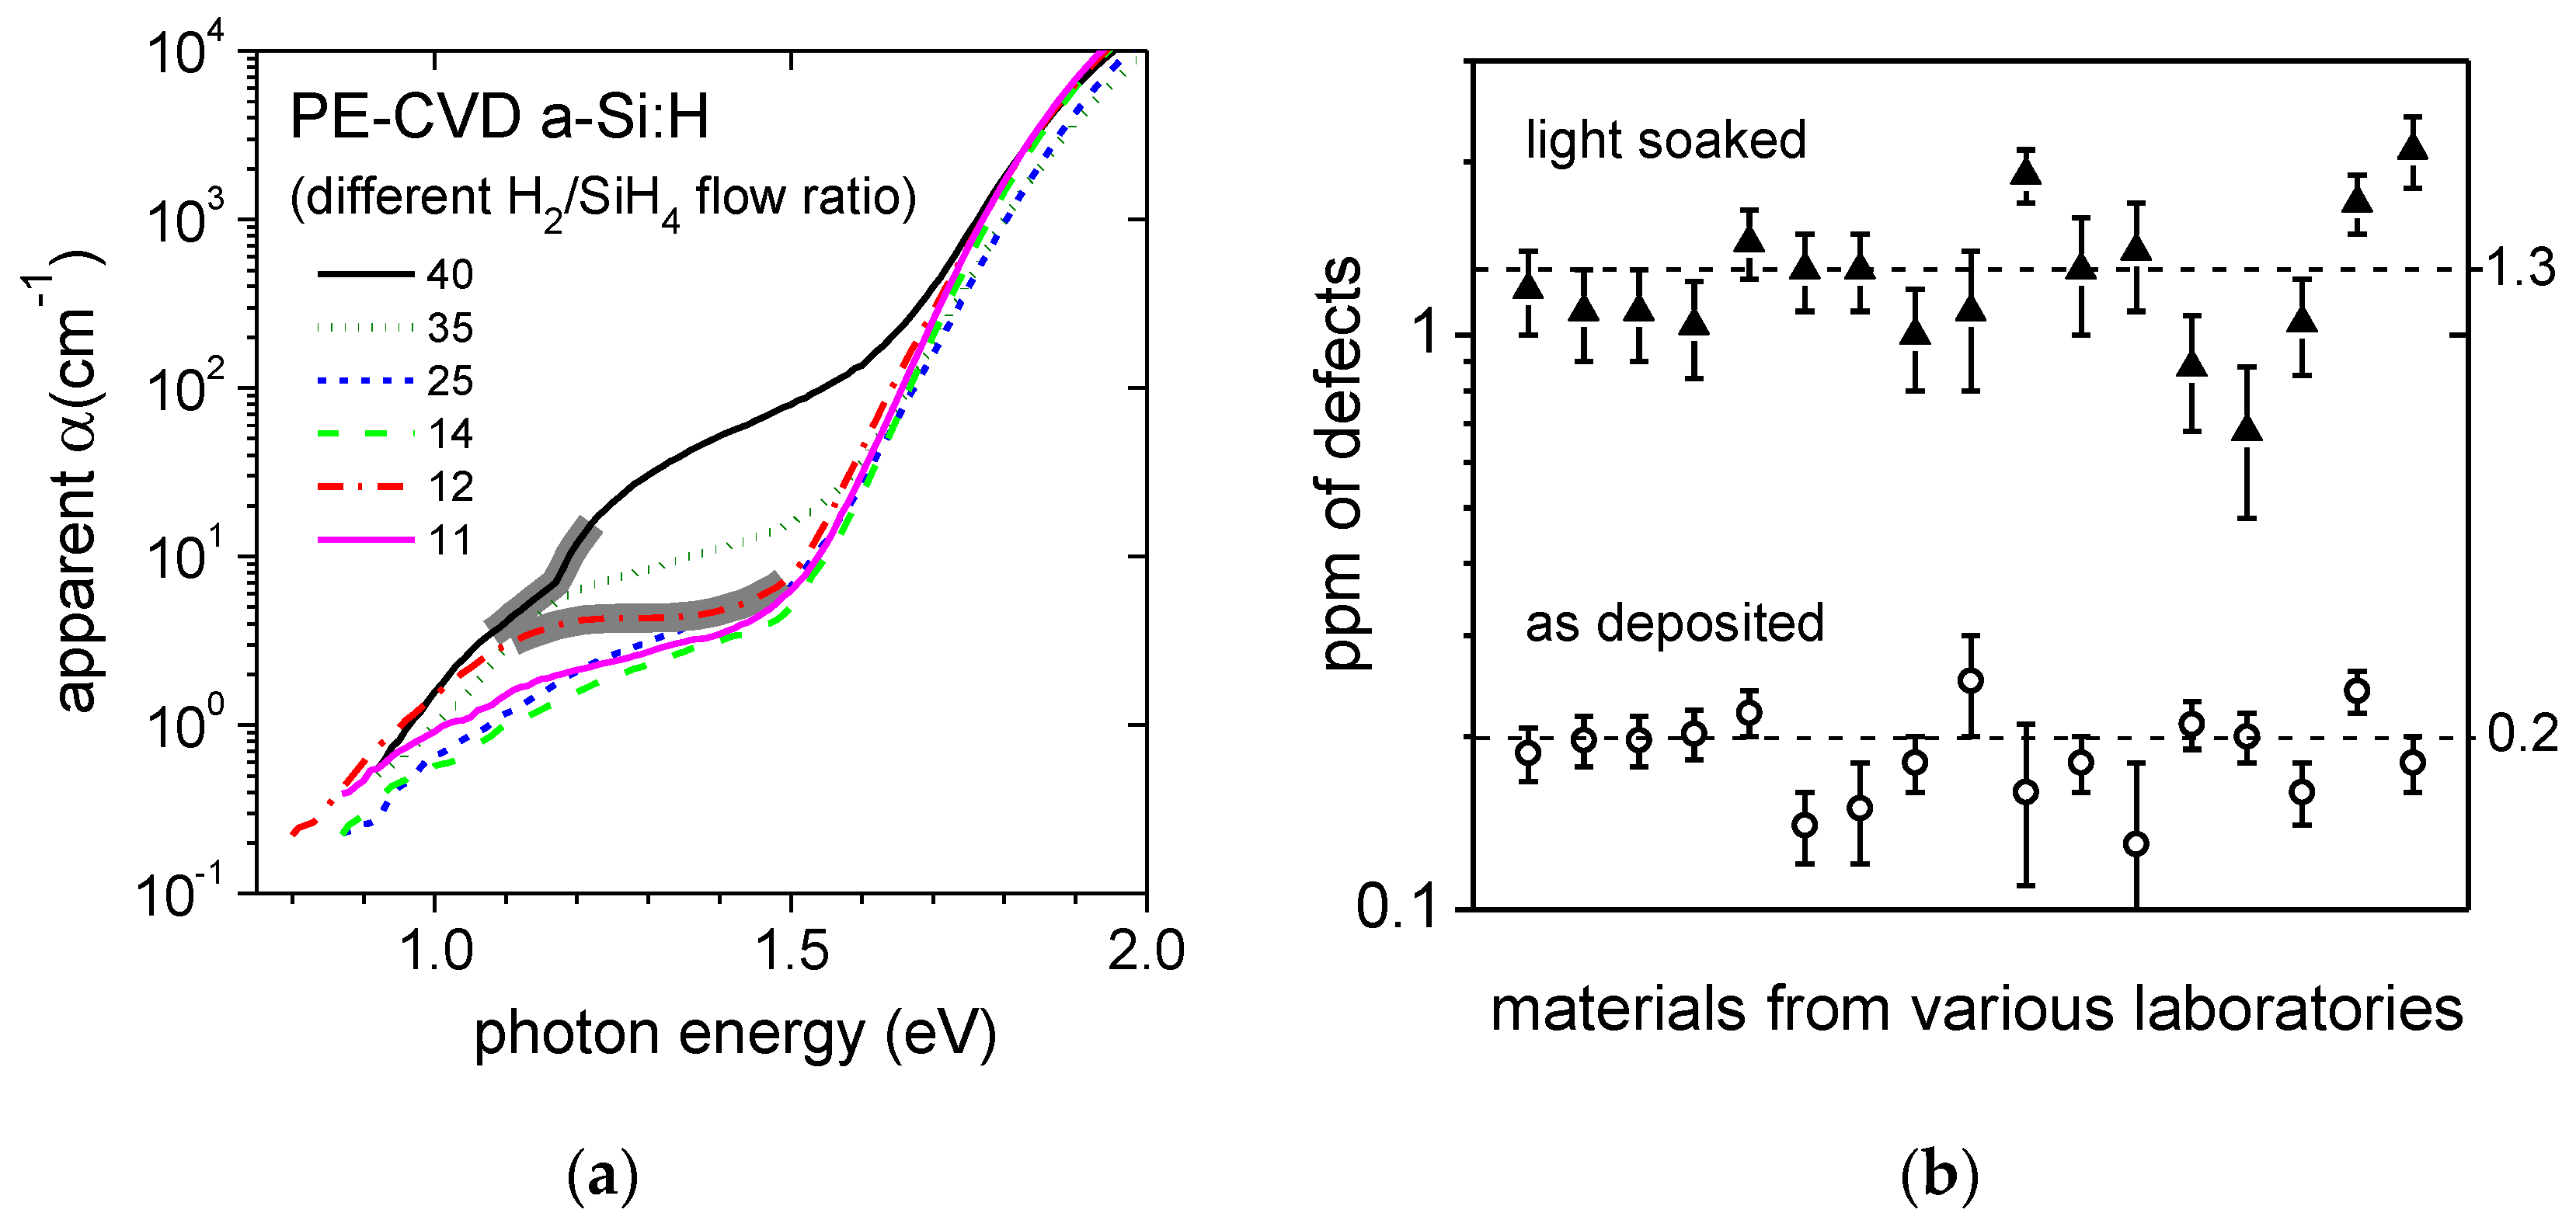
Figure 1. (a) Examples of erroneous features due to surface defects (thick grey lines) on “apparent” absorption coefficient obtained from FTPS by a method described in [13]; (b) Defect densities of state-of-the-art laboratory-grade samples of a-Si:H obtained from different laboratories within the FP7 Fast-Track project. Empty symbols indicate the initial state; full symbols indicate light-soaked (300 h, 1 sun, 50 °C) state.
Coatings 10 00820 g001
Figure 2. (a) (i) High TCO transmittance, which allows for minimal impact on evaluation, and (ii) simulated absorptance in solar cells rescaled to best fit the absorption coefficient between 1.2 and 1.55 eV. Simulations included a variety of absorber thicknesses (from 120 to 1000 nm) and interface RMS roughness values (0 to 100 nm); (b) Absorption coefficient obtained from a combination of PDS measurements on a layer on glass (black symbols above 1.7 eV), and FTPS measurements on cells (color lines below 1.9 eV) rescaled in order to fit in the region of the Urbach slope (thick grey line). The high-energy end of FTPS spectra indicates different saturation levels given by different thicknesses.
Coatings 10 00820 g002
Figure 3. Spectra input into Equation (1). Blackbody spectra were calculated with Equation (2) and for comparison corrected to the flux measured from the distance of the sun using a factor of 2.17 × 10⁻⁵. An example of an extrapolated FTPS spectrum is given in an arbitrary scale.
Coatings 10 00820 g003
Figure 4. (a) Contour plot of voltage deficit obtained by considering all experimental V OC data and E gap = 1.69 eV; (b) Linear plot of experimental V OC data only for thicknesses 120 nm, 200 nm, and 300 nm, in comparison with the radiative limit with including defect absorption. Grey lines show linear trends. The blue star represents the absolute limit given by the radiative limit for the Urbach energy of 48 meV.
Coatings 10 00820 g004
Figure 5. (a) Contour plot of simulated E gap V OC for different defect densities and thicknesses; (b) Logarithmic (horizontal-axis) plot of experimental V OC data compared to the simulation. Grey lines are guides for eye, represented by equation V OC = b + 48 m V ln x .
Coatings 10 00820 g005