Article

Perspectives on Thermal Gradients in Porous ZrO2-7–8 wt.% Y2O3 (YSZ) Thermal Barrier Coatings (TBCs) Manufactured by Air Plasma Spray (APS)

National Research Council of Canada (NRC), Boucherville, QC J4B 6Y4, Canada
Coatings 2020, 10(9), 812; https://doi.org/10.3390/coatings10090812
Submission received: 4 August 2020 / Revised: 19 August 2020 / Accepted: 20 August 2020 / Published: 22 August 2020
(This article belongs to the Special Issue Recent Developments of Thermal Barrier Coatings)

Abstract

:
Porous (~10–20%) ZrO2-7–8 wt.% Y2O3 (YSZ) thermal barrier coatings (TBCs) manufactured via air plasma spray (APS) and exhibiting a thickness range of ~250–500 µm, provide thermal insulation from the hot combustion gases to the metallic parts located in the hot stationary sections of gas turbine engines (e.g., combustion chambers of aerospace turbines). The objective of this paper was to measure and report the thermal gradient values in a benchmark porous (~15%) APS YSZ TBC, working within the known acceptable maximum temperature envelop conditions of a TBC/substrate system, i.e., T-ysz ~1300 °C and T-sub ~1000 °C. In order to accomplish this objective, the following steps were performed. A benchmark APS YSZ TBC exhibiting two distinct thicknesses (~260 and ~460 µm) was manufactured. In addition, a thermal gradient laser-rig was employed to generate a temperature drop (ΔT) along the coated coupon, with the target operate within the acceptable maximum temperature capabilities of this type of TBC/substrate architecture. This target was achieved, i.e., T-ysz values were not higher than ~1300 °C while the substrate temperatures did not reach values above ~1000 °C. The ΔTs for the ~260 and ~460 µm YSZ TBCs were ~280 and ~465 °C, respectively. The thermal gradient value for both YSZ TBCs was ~0.90 °C/µm, which falls within those reported in the literature for porous APS YSZ TBCs.

1. Introduction

1.1. Overall Characterics of Porous APS YSZ TBCs

Gas turbine engines have been widely employed in aerospace, power generation and marine applications. It is one of the most advanced and efficient engines ever engineered by mankind. Among the many critical components of gas turbines, this paper emphasizes the ones located in the static or stationary hot-sections, e.g., combustion chambers, vanes, ducts and afterburners. These components, made from Ni-based superalloys (melting point ~1300–1400 °C), typically exhibit a wall thicknesses in the range of only ~1–2 mm. Moreover, they are subjected to high heating flows resulting from the hot stream of the combustion gases, which can reach maximum temperatures of 2000 °C at the flame core (primary zone) inside the combustion chamber [1,2].
In order to avoid damage and potential catastrophic failure of these metallic stationary components, they are protected by porous ceramic (ZrO2-7–8 wt.% Y2O3; a.k.a. YSZ) thermal barrier coatings (TBCs) manufactured via air plasma spray (APS). According to the author’s best knowledge (specifically regarding combustion chambers of aerospace turbines), these porous APS YSZ TBCs typically exhibit porosity levels of ~10–20% and thicknesses varying from ~250 to 500 µm.
The 7–8 wt.% YSZ (tetragonal t’-phase) is the current state-of-the-art material for TBC application for different reasons, highlighting among those: (i) high melting point (~2700 °C), (ii) high coefficient of thermal expansion (CTE) for a ceramic material (~10 × 10−6/°C) and similar to those of Ni-based superalloys (~12 × 10−6/°C) (room temperature (RT) values), (iii) low APS YSZ TBC thermal conductivity (TC) (~0.7–1.0 W/mK @RT—as sprayed), (iv) initial absence of the cracking-induced tetragonal to monoclinic martensitic transformation (3–5% volume expansion) that occurs upon cooling to RT (e.g., 0–4 wt.%YSZ), (v) higher toughness than that of the cubic phase (e.g., 13–20 wt.%YSZ) and (vi) high chemical-phase-mechanical stability in the aggressive high-temperature environment of the hot-sections. A thermally sprayed TBC system typically exhibits a bilayered structure which, besides the YSZ ceramic top coat also includes a metallic MCrAlY (M = Ni, Co. NiCo or CoNi) bond coat (BC). The metallic BC (~100–200 µm) is an oxidation-/corrosion-resistant metallic layer. It protects the underlying component and improves the adhesion of the ceramic YSZ top coat on the part [3,4,5,6,7,8,9,10,11].

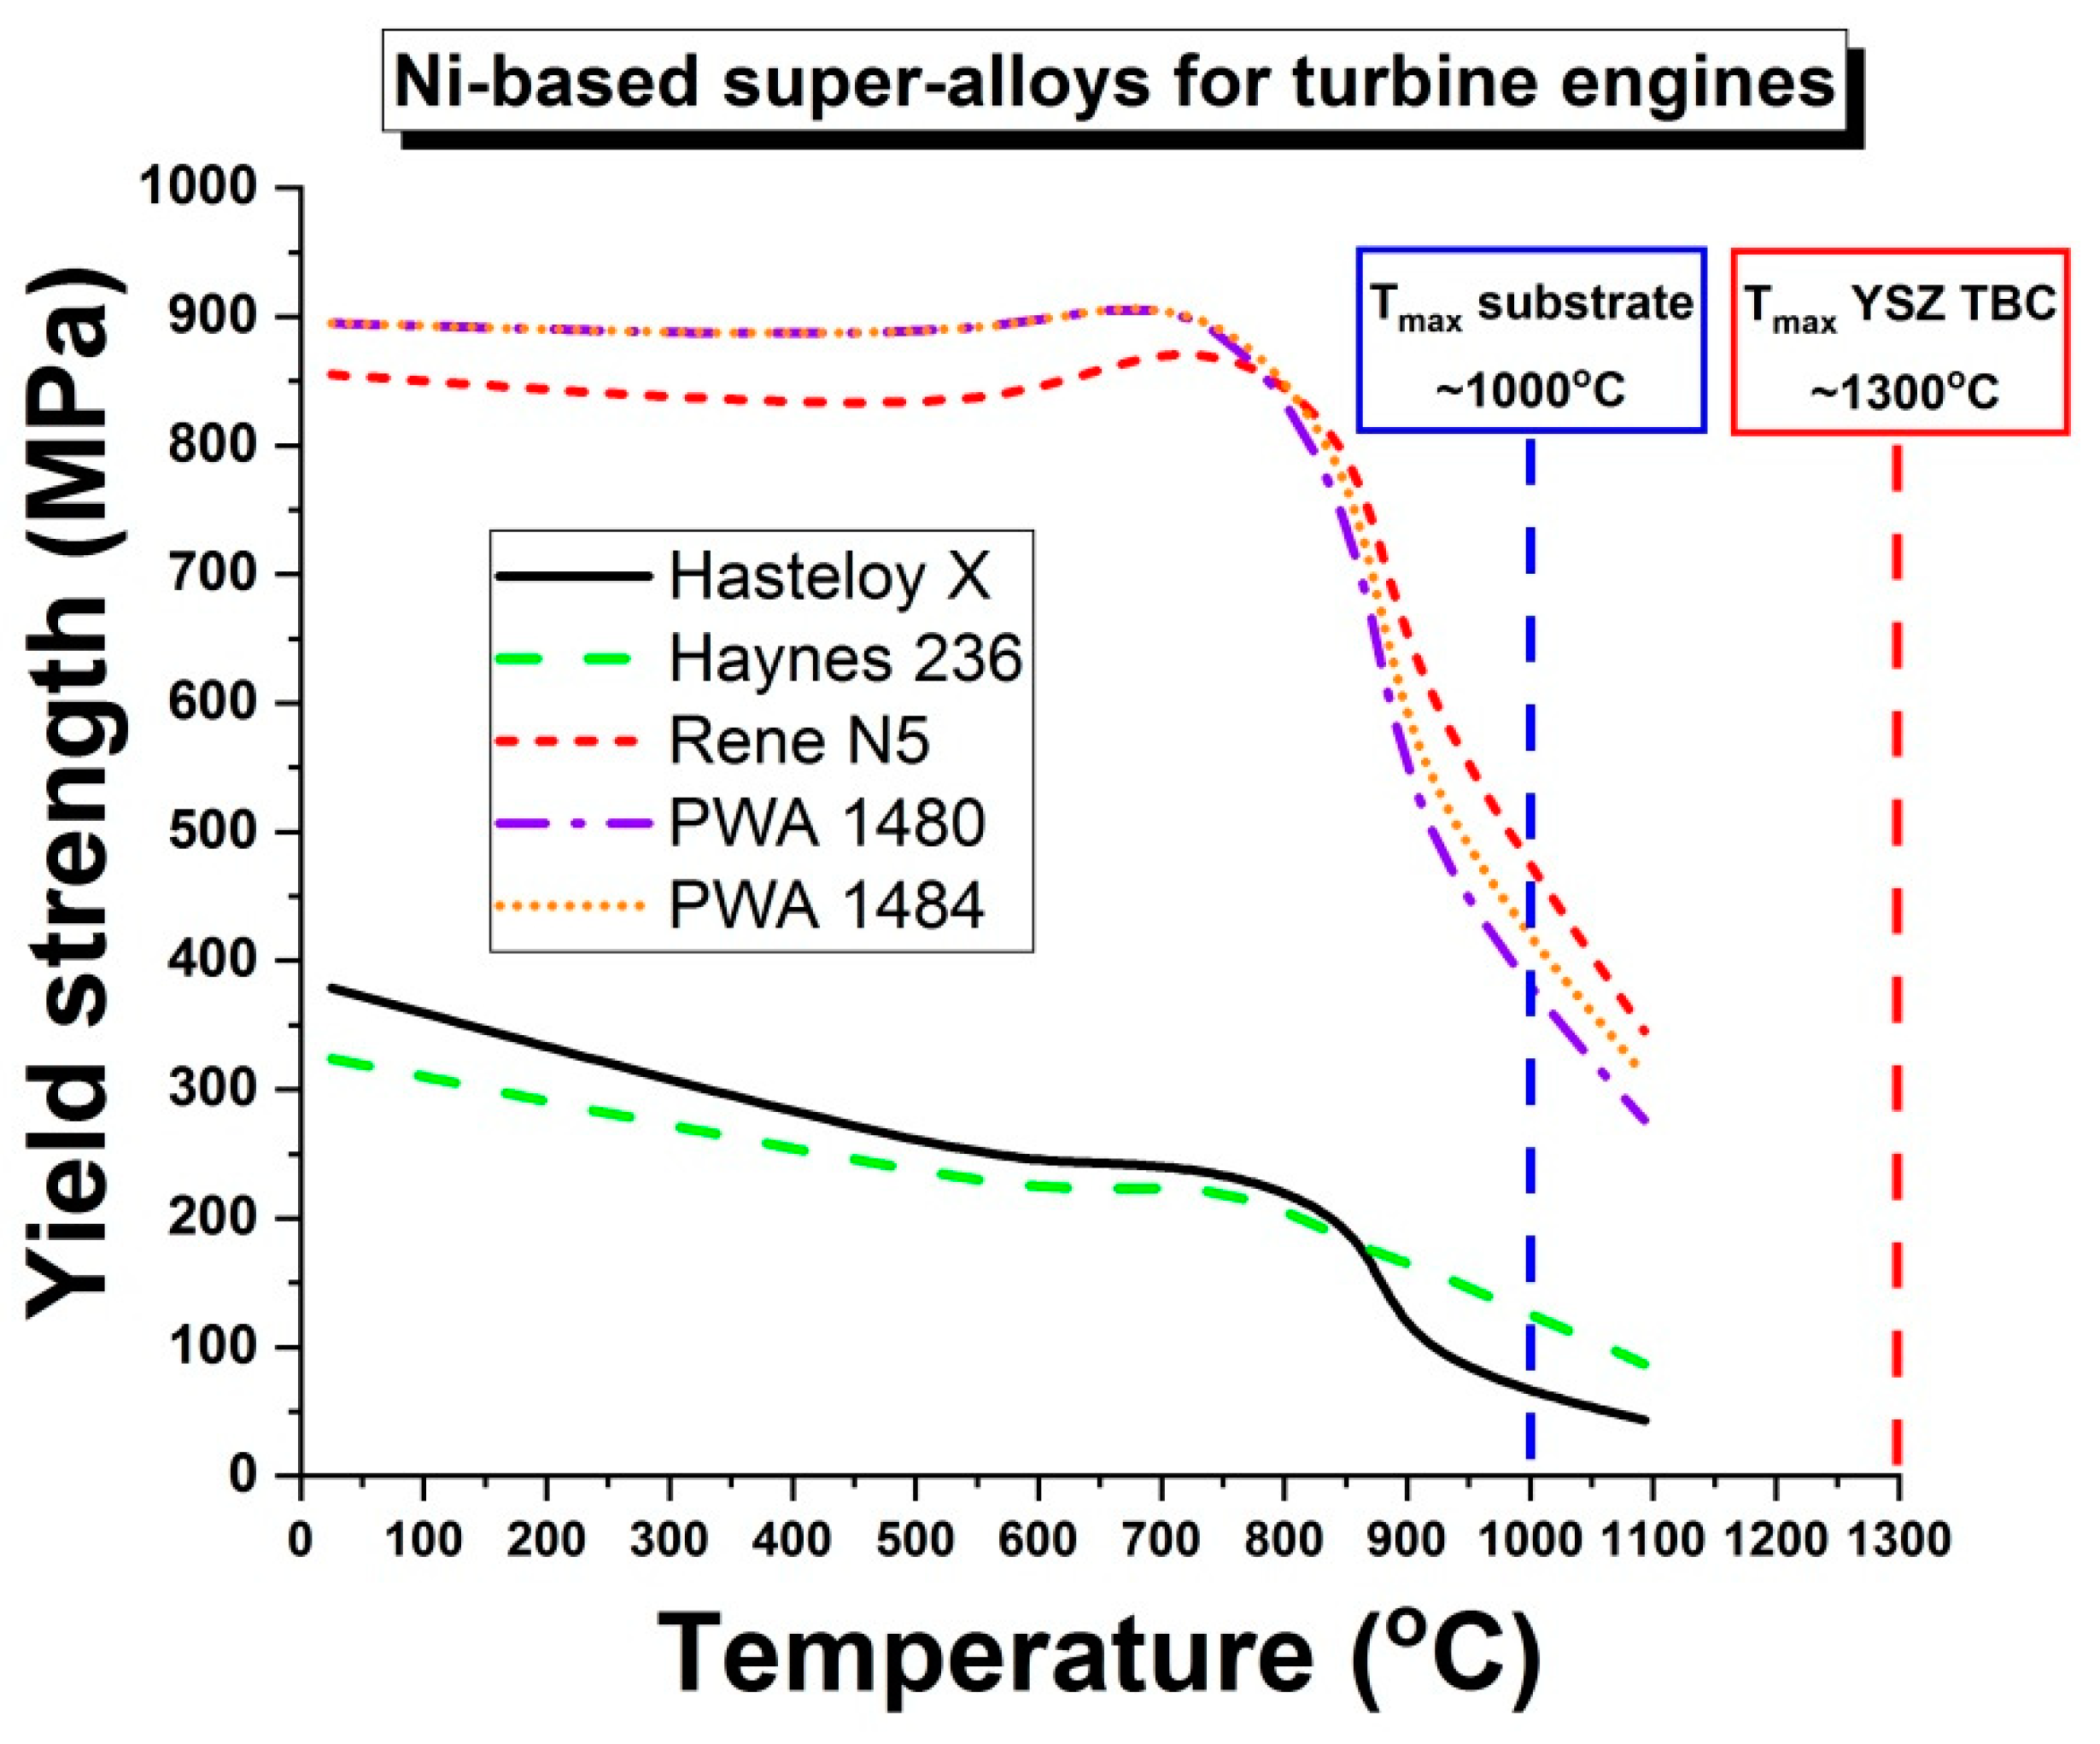
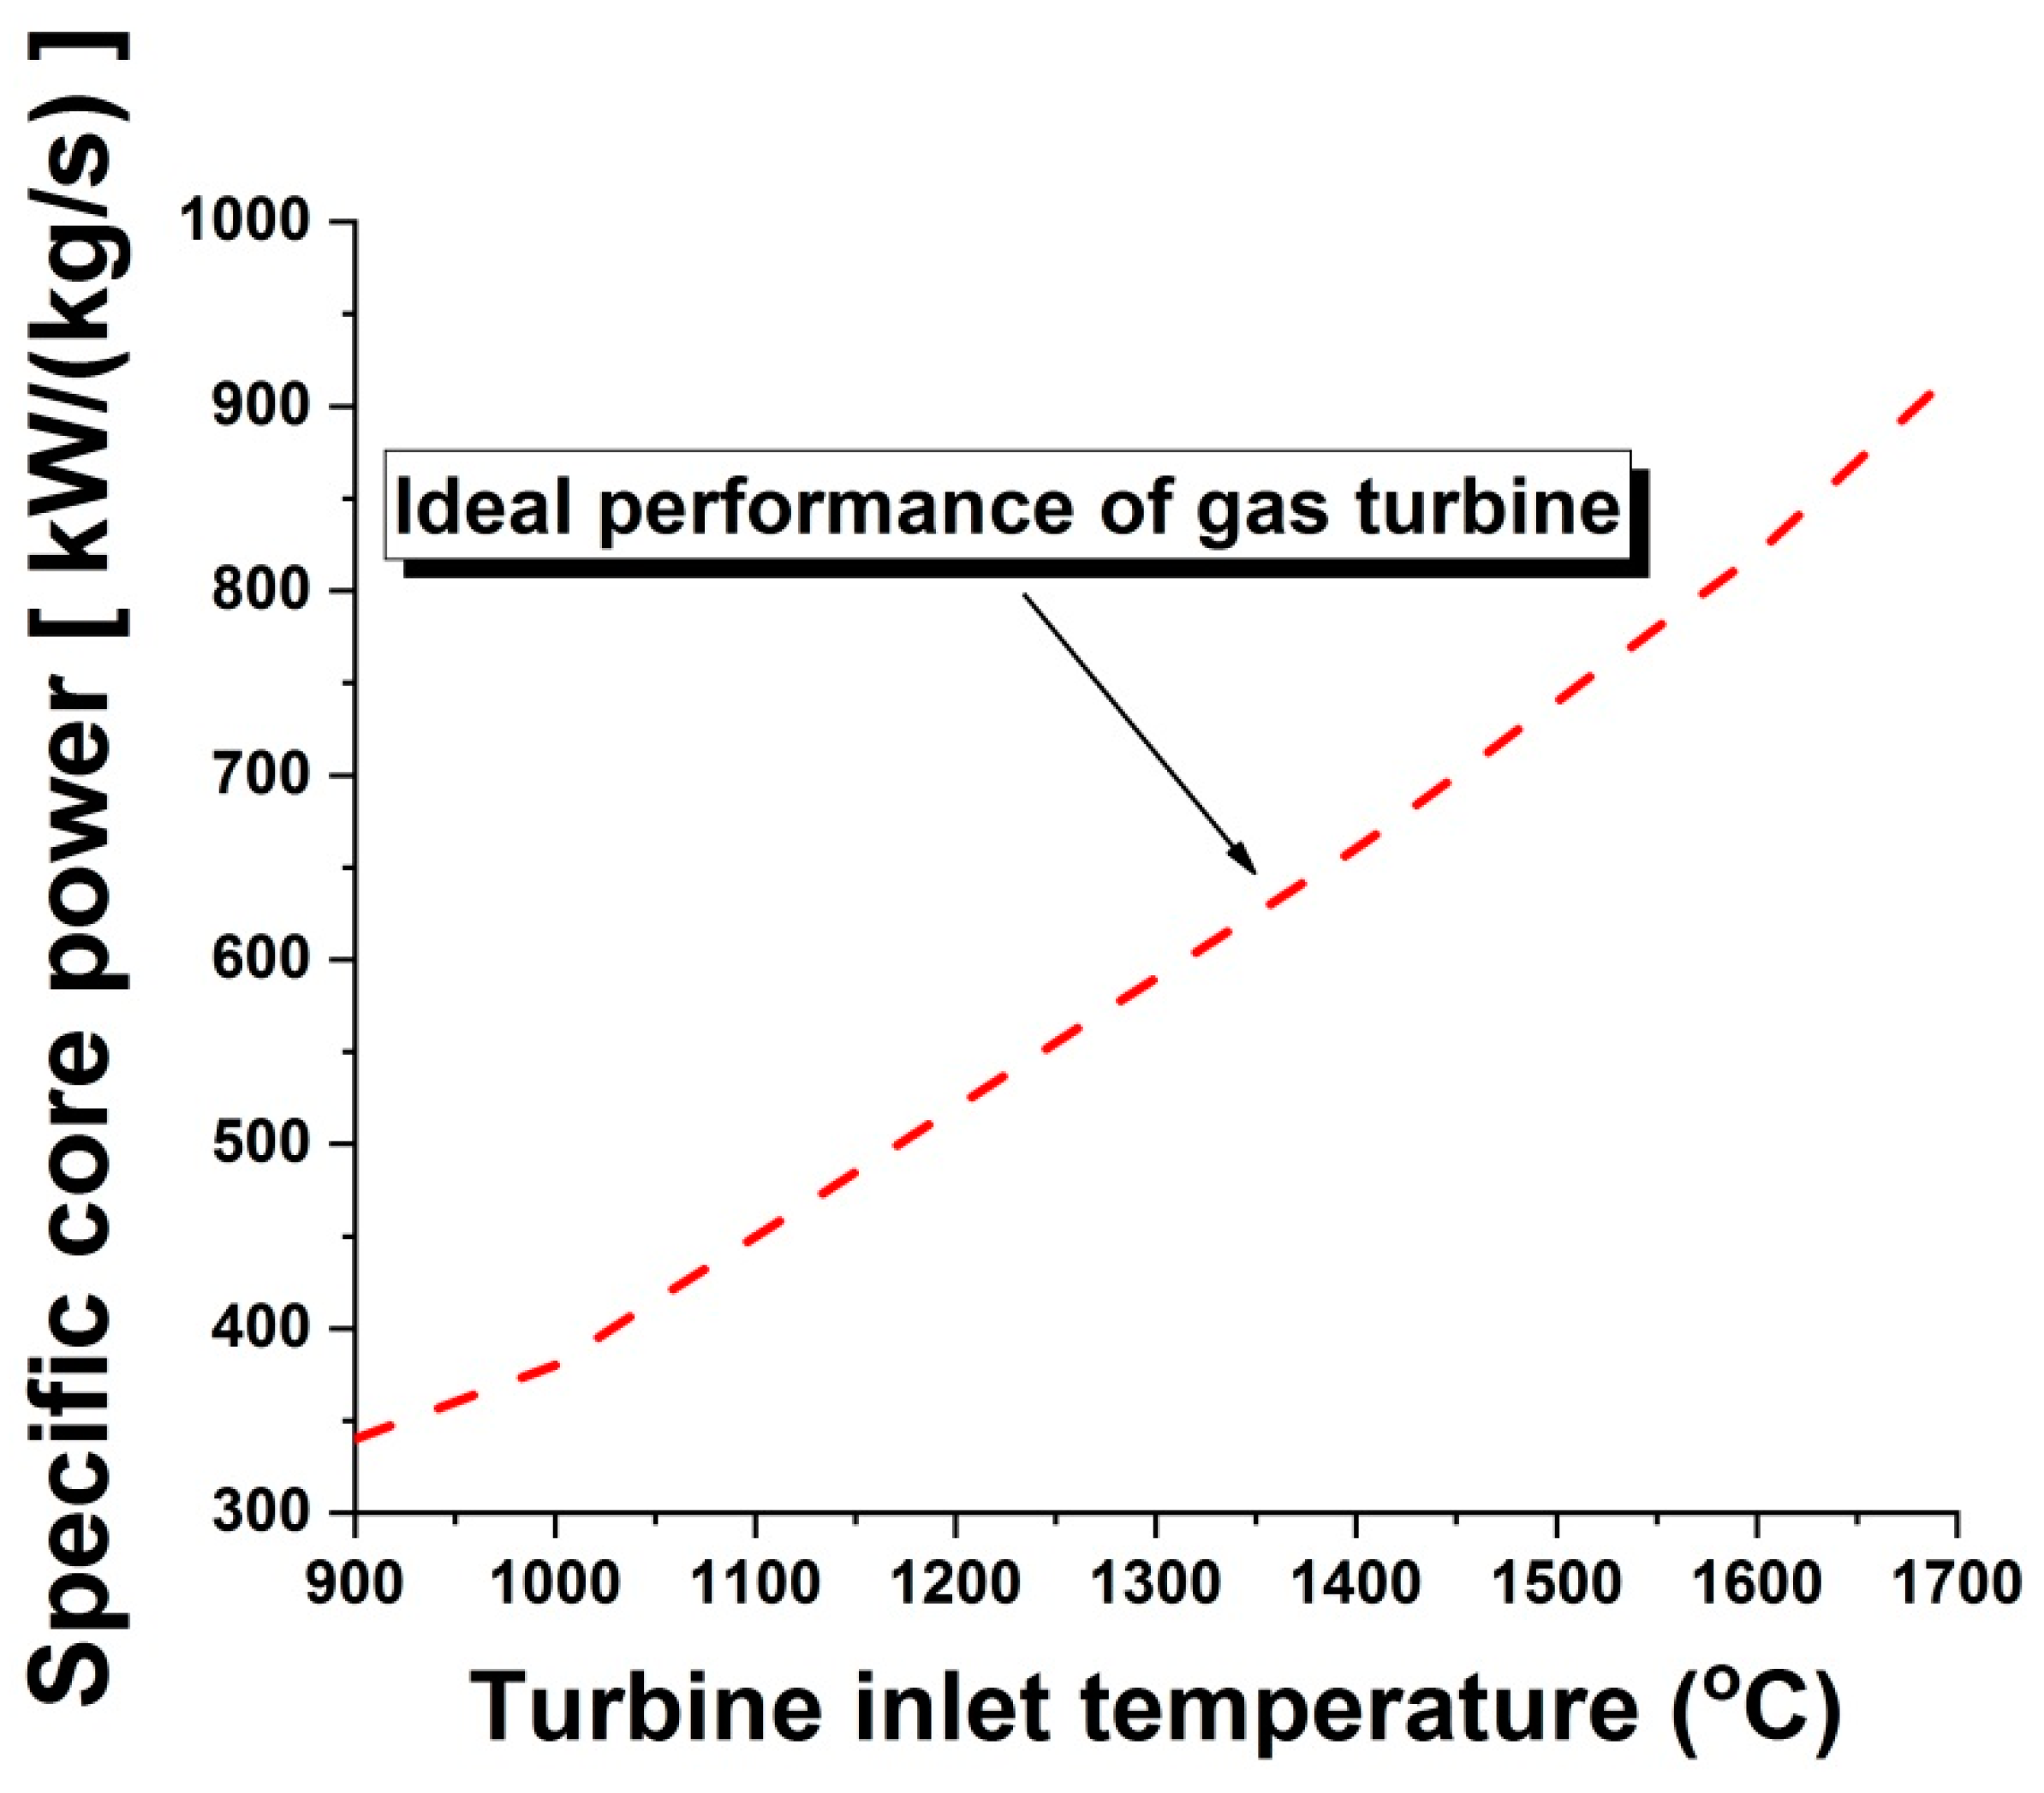
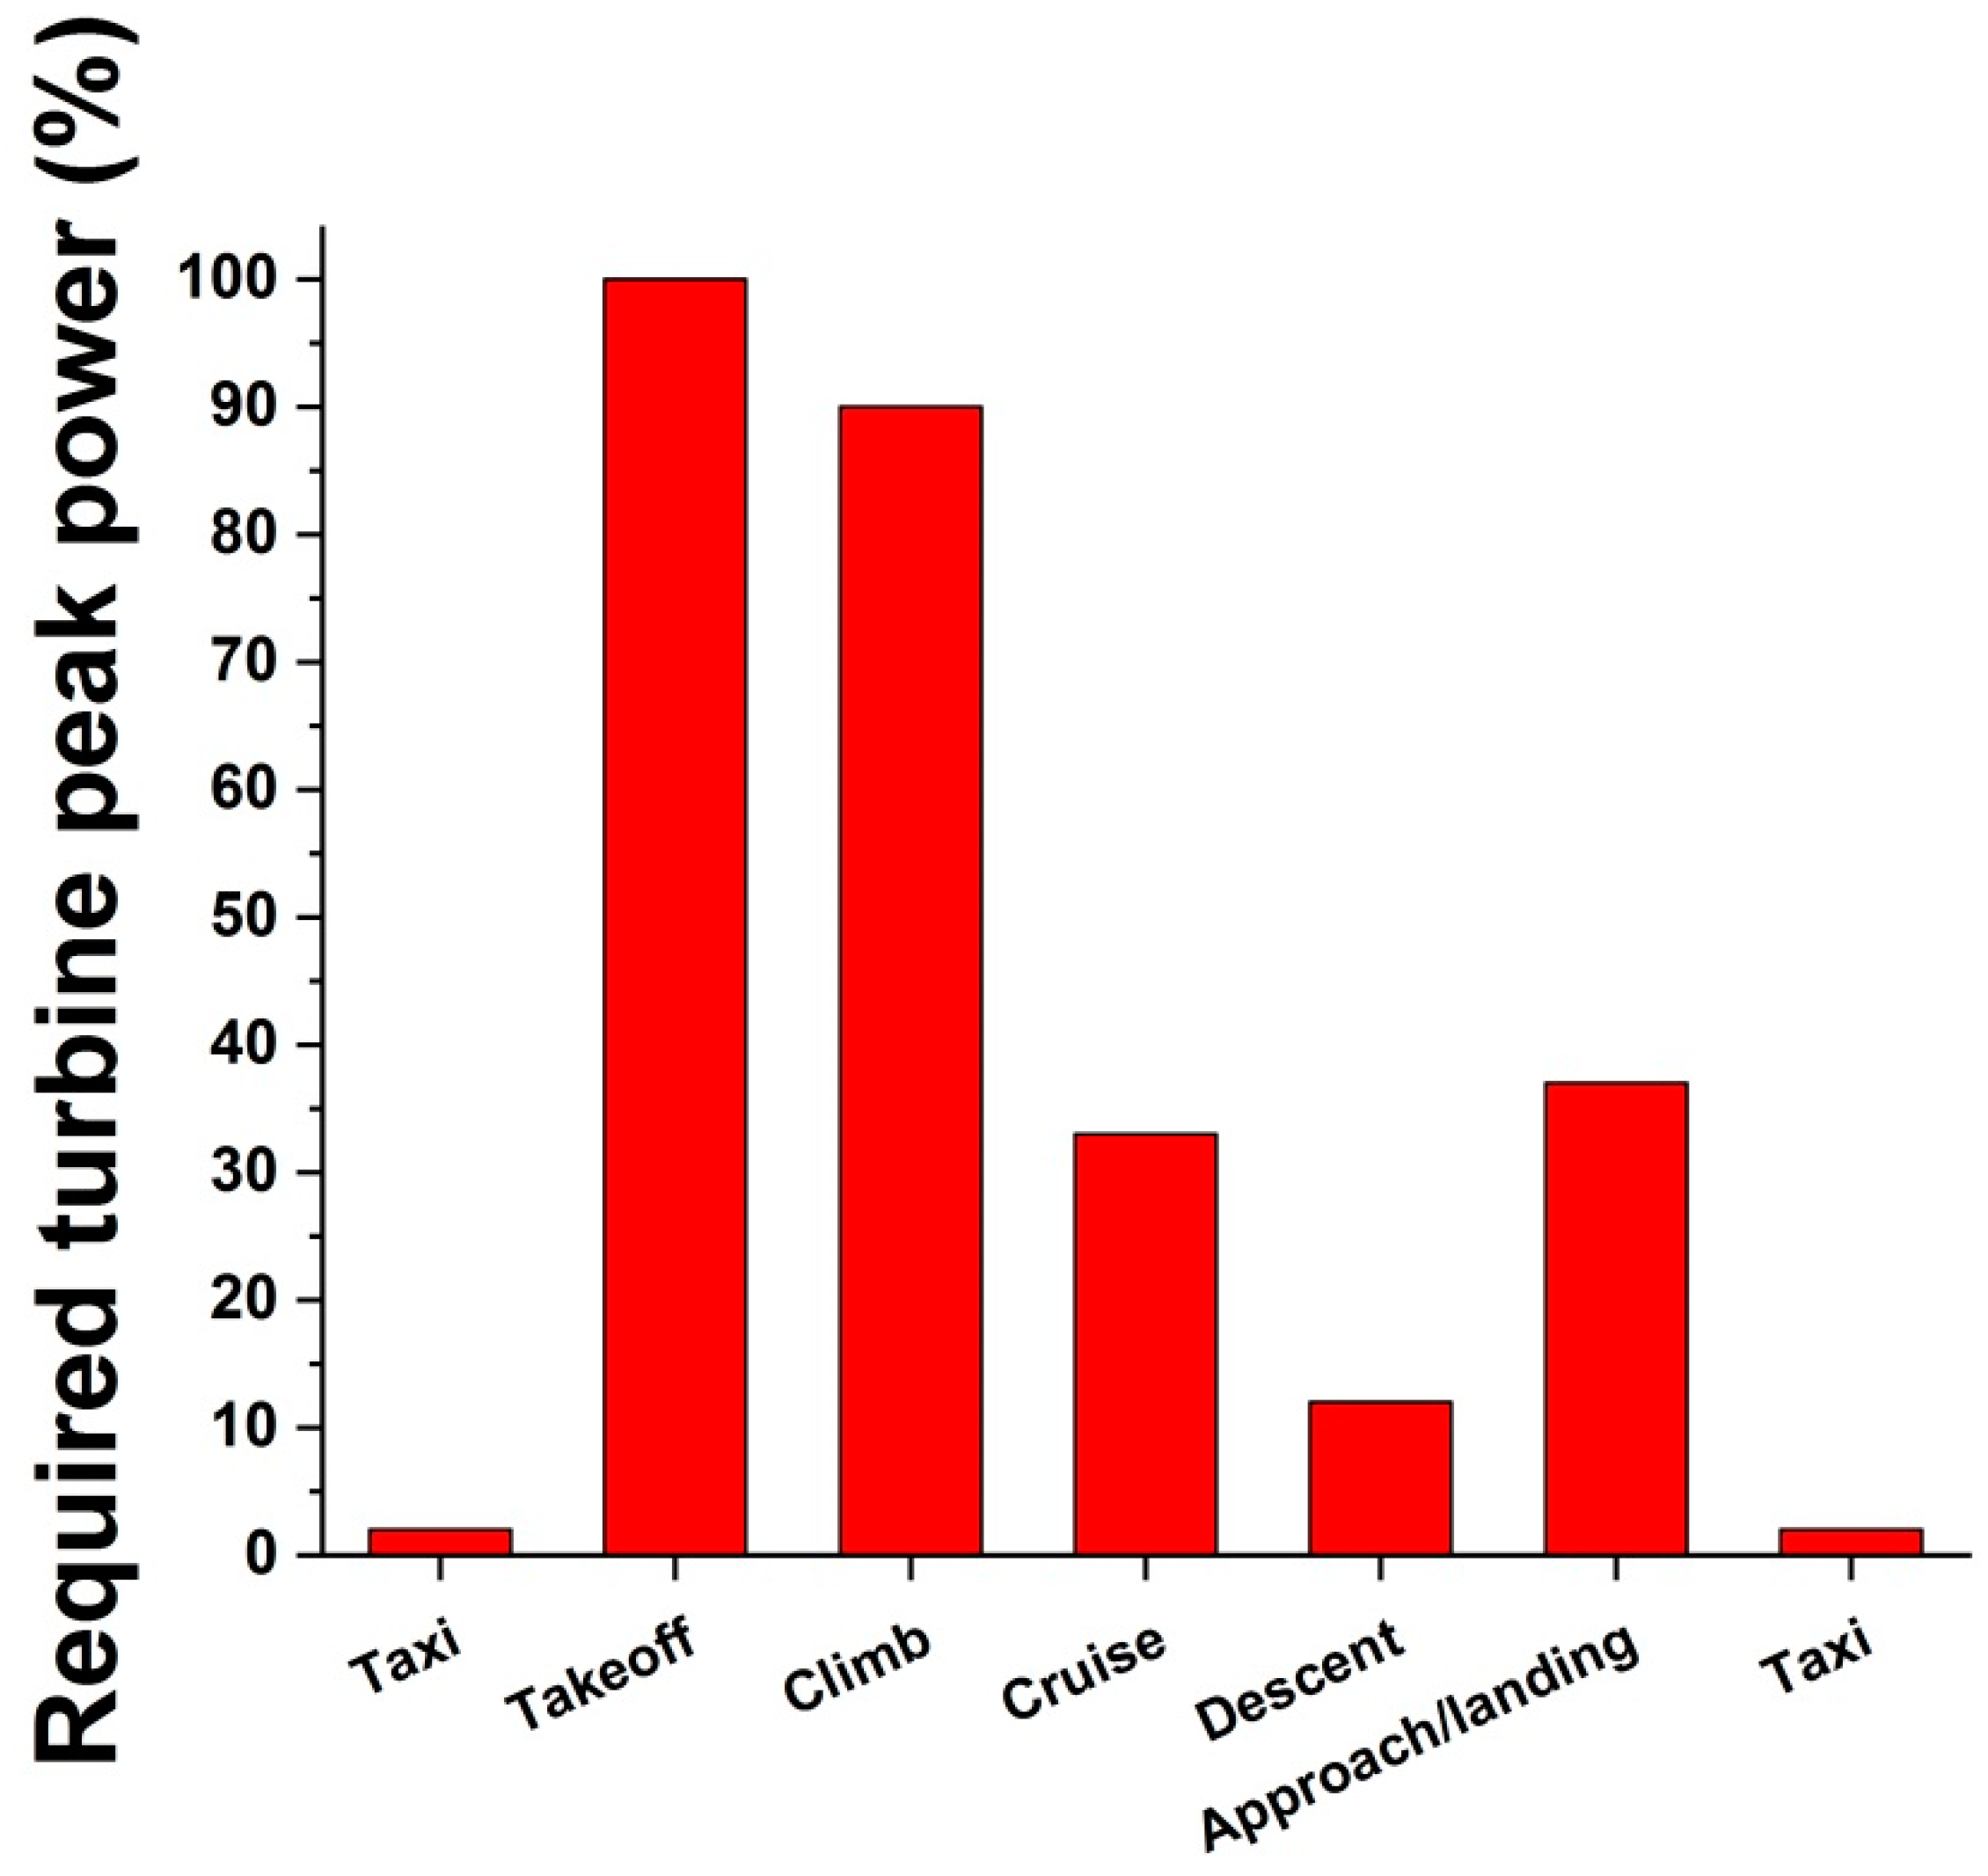
1.2. Maximum Operational Temperatures across APS YSZ TBC/Substrate Systems

The maximum APS YSZ TBC operational temperature in turbine engines is usually considered to be ~1300 °C, whereas that of the substrate is ~1000 °C [2,12]. The main reasons for the ~1300 °C upper temperature limit for APS YSZ TBCs are found on the degradation caused by (i) calcium–magnesium–alumino-silicate (CMAS) glass deposits, (ii) phase transformations and (iii) sintering.
CMAS deposits are formed when environmentally ingested aerial dust, runway/airborne sand and hovering volcanic ash particles melt in the flame of the combustion chamber and get deposited onto the TBC-coated surfaces of the engine, similarly to what occurs in “flame-spray processing”. According to Borom et al. [13], CMAS melt initiates at ~1200 °C and is complete by ~1300 °C. Therefore, when the CMAS layer is exposed to temperatures of ~1300 °C, a glassy phase penetrates into the porosity network of the TBC, leading to stiffening, loss of strain tolerance, undesirable chemical reactions with the YSZ (e.g., aging) and TBC delamination [13,14].
In respect to phase transformations, as highlighted by Brandon and Taylor [15], at ~1300 °C the “desired” non-transformable tetragonal-t’ phase of the 7–8 wt.% YSZ slowly begins to decompose into regular tetragonal-t (low yttria—0–4wt.%YSZ) and cubic-c (high yttria—13–20wt.%YSZ) phases, which are the equilibrium high temperatures phases. These two phases are not preferred. For example, upon cooling to RT the tetragonal-t phase can transform into the monoclinic-m phase, which is followed by an increase of volume (~3–5%). As ceramic materials exhibit negligible plasticity at low temperatures, the stresses associated with this phase transformation tend to be released by microcraking, thereby leading to YSZ loss of mechanical strength and failure. Regarding the cubic-c phase of YSZ, its lower toughness values when compared to those of the tetragonal-t’ phase lead to an inferior thermal cycling lifetime of the TBC.
Regarding sintering, this leads to YSZ densification and thereby an increase of TC values and loss of strain tolerance. Tan et al. [9] measured the TC values of free-standing as-sprayed (~10–15% porous) and heat-treated (1050–1200 °C for 225 h) APS YSZ TBCs from RT to 1200 °C. There were no significant signs of TC stabilization, i.e., TC values were increasing the longer the heat treatment time and measurement temperature. Higher TC values will translate into lower TBC insulating effectiveness to the component, which is not desirable. Thompson and Clyne [16] measured the elastic modulus values at RT of as-sprayed and heat-treated free-standing APS YSZ TBCs. The heat-treated free-standing coatings were subject to isothermal temperatures of 1000, 1100, 1200, 1300 and 1400 °C for different time intervals up to 100 h. Briefly, the elastic modulus values of the free-standing YSZ TBCs heat-treated up from 1000 to 1200 °C exhibited an initial sharp growth but then nearly stabilized after 10 h of sintering. On the other hand, those of the free-standing YSZ TBCs heat-treated at 1300 and 1400 °C exhibited a steady-state linear growth up to 100 h of sintering. Consequently, at 1300 °C and higher temperatures, the sintering/densification begin to induce a significant increase in stiffness (i.e., elastic modulus values) of the YSZ TBC, which lowers the ability of the top coat to resist stresses/strains related to thermal cycling.
Therefore, mainly due to the key reasons above cited, the maximum operational temperature for APS YSZ TBCs in turbine engines is typically accepted to be ~1300 °C [12].
Regarding the metallic parts of the engine, the maximum operational temperature for the Ni-based superalloy substrates is estimated to be ~1000 °C [2,12]. In a “simplistic way”, the main reason for this specific temperature value can be found by looking at Figure 1. It shows the yield strength values in function of temperature for different Ni-based superalloys employed in the hot-sections of gas turbine engines [17]. The yield strength indicates the limit of elastic behavior and the beginning of plastic behavior of materials. For this reason, it is possible to infer that, at ~1000 °C, the yield strength values of these alloys are “dangerously” approaching their respective plastic deformation zones.
Of course, besides temperature, it needs to be stressed that these strength and temperature values can also depend on mechanical loading in which the alloy in being subjected, as well as, if the material is polycrystalline, directionally solidified or single crystal (e.g., turbine blades) [2]. Nonetheless, as a general “safety limit”, the temperature of ~1000 °C is considered to be the maximum temperature that Ni-based alloys operate in gas turbine engines for the components located in the stationary hot-sections (e.g., combustion chambers) [2,12].
In addition, Figure 1 gives an interesting perspective about the paramount importance of TBCs in gas turbine engines, mainly the ones employed in aerospace applications. As one can assume, if the turbine had to operate without TBCs and if temperature levels reached ~1300 °C on the metallic components, a catastrophic failure would definitely occur. Typically, the melting points of Ni-based superalloys are found in the range of ~1300–1400 °C.
On the other hand, by observing Figure 1, one may ask why the maximum temperatures in gas turbines need to reach values higher than those of the yield strength or perhaps even the melting point of metals. The need for the continuing increase of the turbine operational temperatures can be explained by looking at Figure 2, which is a plot adapted from Perepezko [18]. It shows the ideal relationship between the turbine specific core power as a function of its turbine inlet temperature (TIT—a.k.a. combustion chamber outlet temperature), which is the temperature of the combustion gases as they leave the combustion chamber and enter the turbine unit. Between ~900 °C to ~1700 °C, this relationship is essentially linear. Fundamentally, the higher the temperature attained in combustion chamber the greater the expansion of the gases and hence the greater efficiency of the engine. Therefore, higher combustion temperatures are needed in order to fulfil the insatiable demand for more efficient and powerful turbines. This is even more critical for aerospace turbines, where generating lift is a must, and concepts like power and/or thrust-to-weight ratio are chief. The current maximum TITs will be discussed later on in this manuscript.
It is very important to point out that the TBC/component systems are not subjected at these maximum temperature limits (i.e., T-ysz ~1300 °C and T-sub ~1000 °C) during the entire length of operation. In fact, Figure 3 shows the typical required turbine power per mission segment for a representative flight of a 150-passenger single-aisle aircraft with a 5600-km (3000 nautical miles) design range flying a 1900-km (1000 nautical miles) mission [19].
It is possible to observe that, under standard flight conditions, a commercial jet will work at full turbine power (i.e., 100%) only during the so-called “rated takeoff” segment of the flight. After the aircraft has “enough lift”, the turbine power will be reduced to ~90% for the climb segment. At cruise altitude, which is typical the longest part of the flight, the turbine will be operating at ~1/3 of its full power.
It needs to be stressed that the “rated takeoff power” or “rated takeoff thrust” is the maximum peak performance in terms of power/thrust of a gas turbine within the specifications defined by the original engine manufacturer (OEM). This condition usually generates the highest temperatures and stresses in the engine. As a result, the TBC/component systems will tend to be subjected at the maximum temperature and stress limits (i.e., T-ysz ~1300 °C and T-sub ~1000 °C) only during the takeoff segment. This is so critical that aeronautical regulations limit the use of this rating to up only 5 min of operation. If an engine exceeds this 5-min limit when running at “rated takeoff”, it is no longer considered airworthy [20]. Consequently, the TBC/component systems of commercial jet aircrafts will be subjected at these maximum temperature limits (i.e., T-ysz ~1300 °C and T-sub ~1000 °C) for no more than 5 min for each single flight. Of course, an aircraft may fly without employing the “rated takeoff” in order to reduce the deterioration on the engine, extend its life and reduce maintenance costs. This strategy, called “derated takeoff”, can be applied when (i) the aircraft does not carry a heavy payload and/or (ii) there is a “long enough runway” for takeoff.
Nonetheless, it is necessary to mention that this 5-min concept is not applied to fighter jets. Mom and Hersback [21] exemplified that depending on the mission (e.g., from general flying to “dog-fight”), maximum military turbine power/thrust can be applied from few to several times during the flight. Moreover, this 5-min concept is also not applied for non-aeroderivative power generation turbines because, according to Warren and Orenstein [22], they operate at lower peak T-ysz and T-sub temperatures than those of aerospace turbines, although at much longer and continuous times (>20,000 h).
Finally, although the information available in the open literature helps to understand the upper operational temperature limits of TBC/component systems, one question is still not clear: why are the typical minimum and maximum thicknesses of porous YSZ TBCs are typically considered to be ~250 and ~500 µm for combustion chambers? This question will be addressed in this paper.

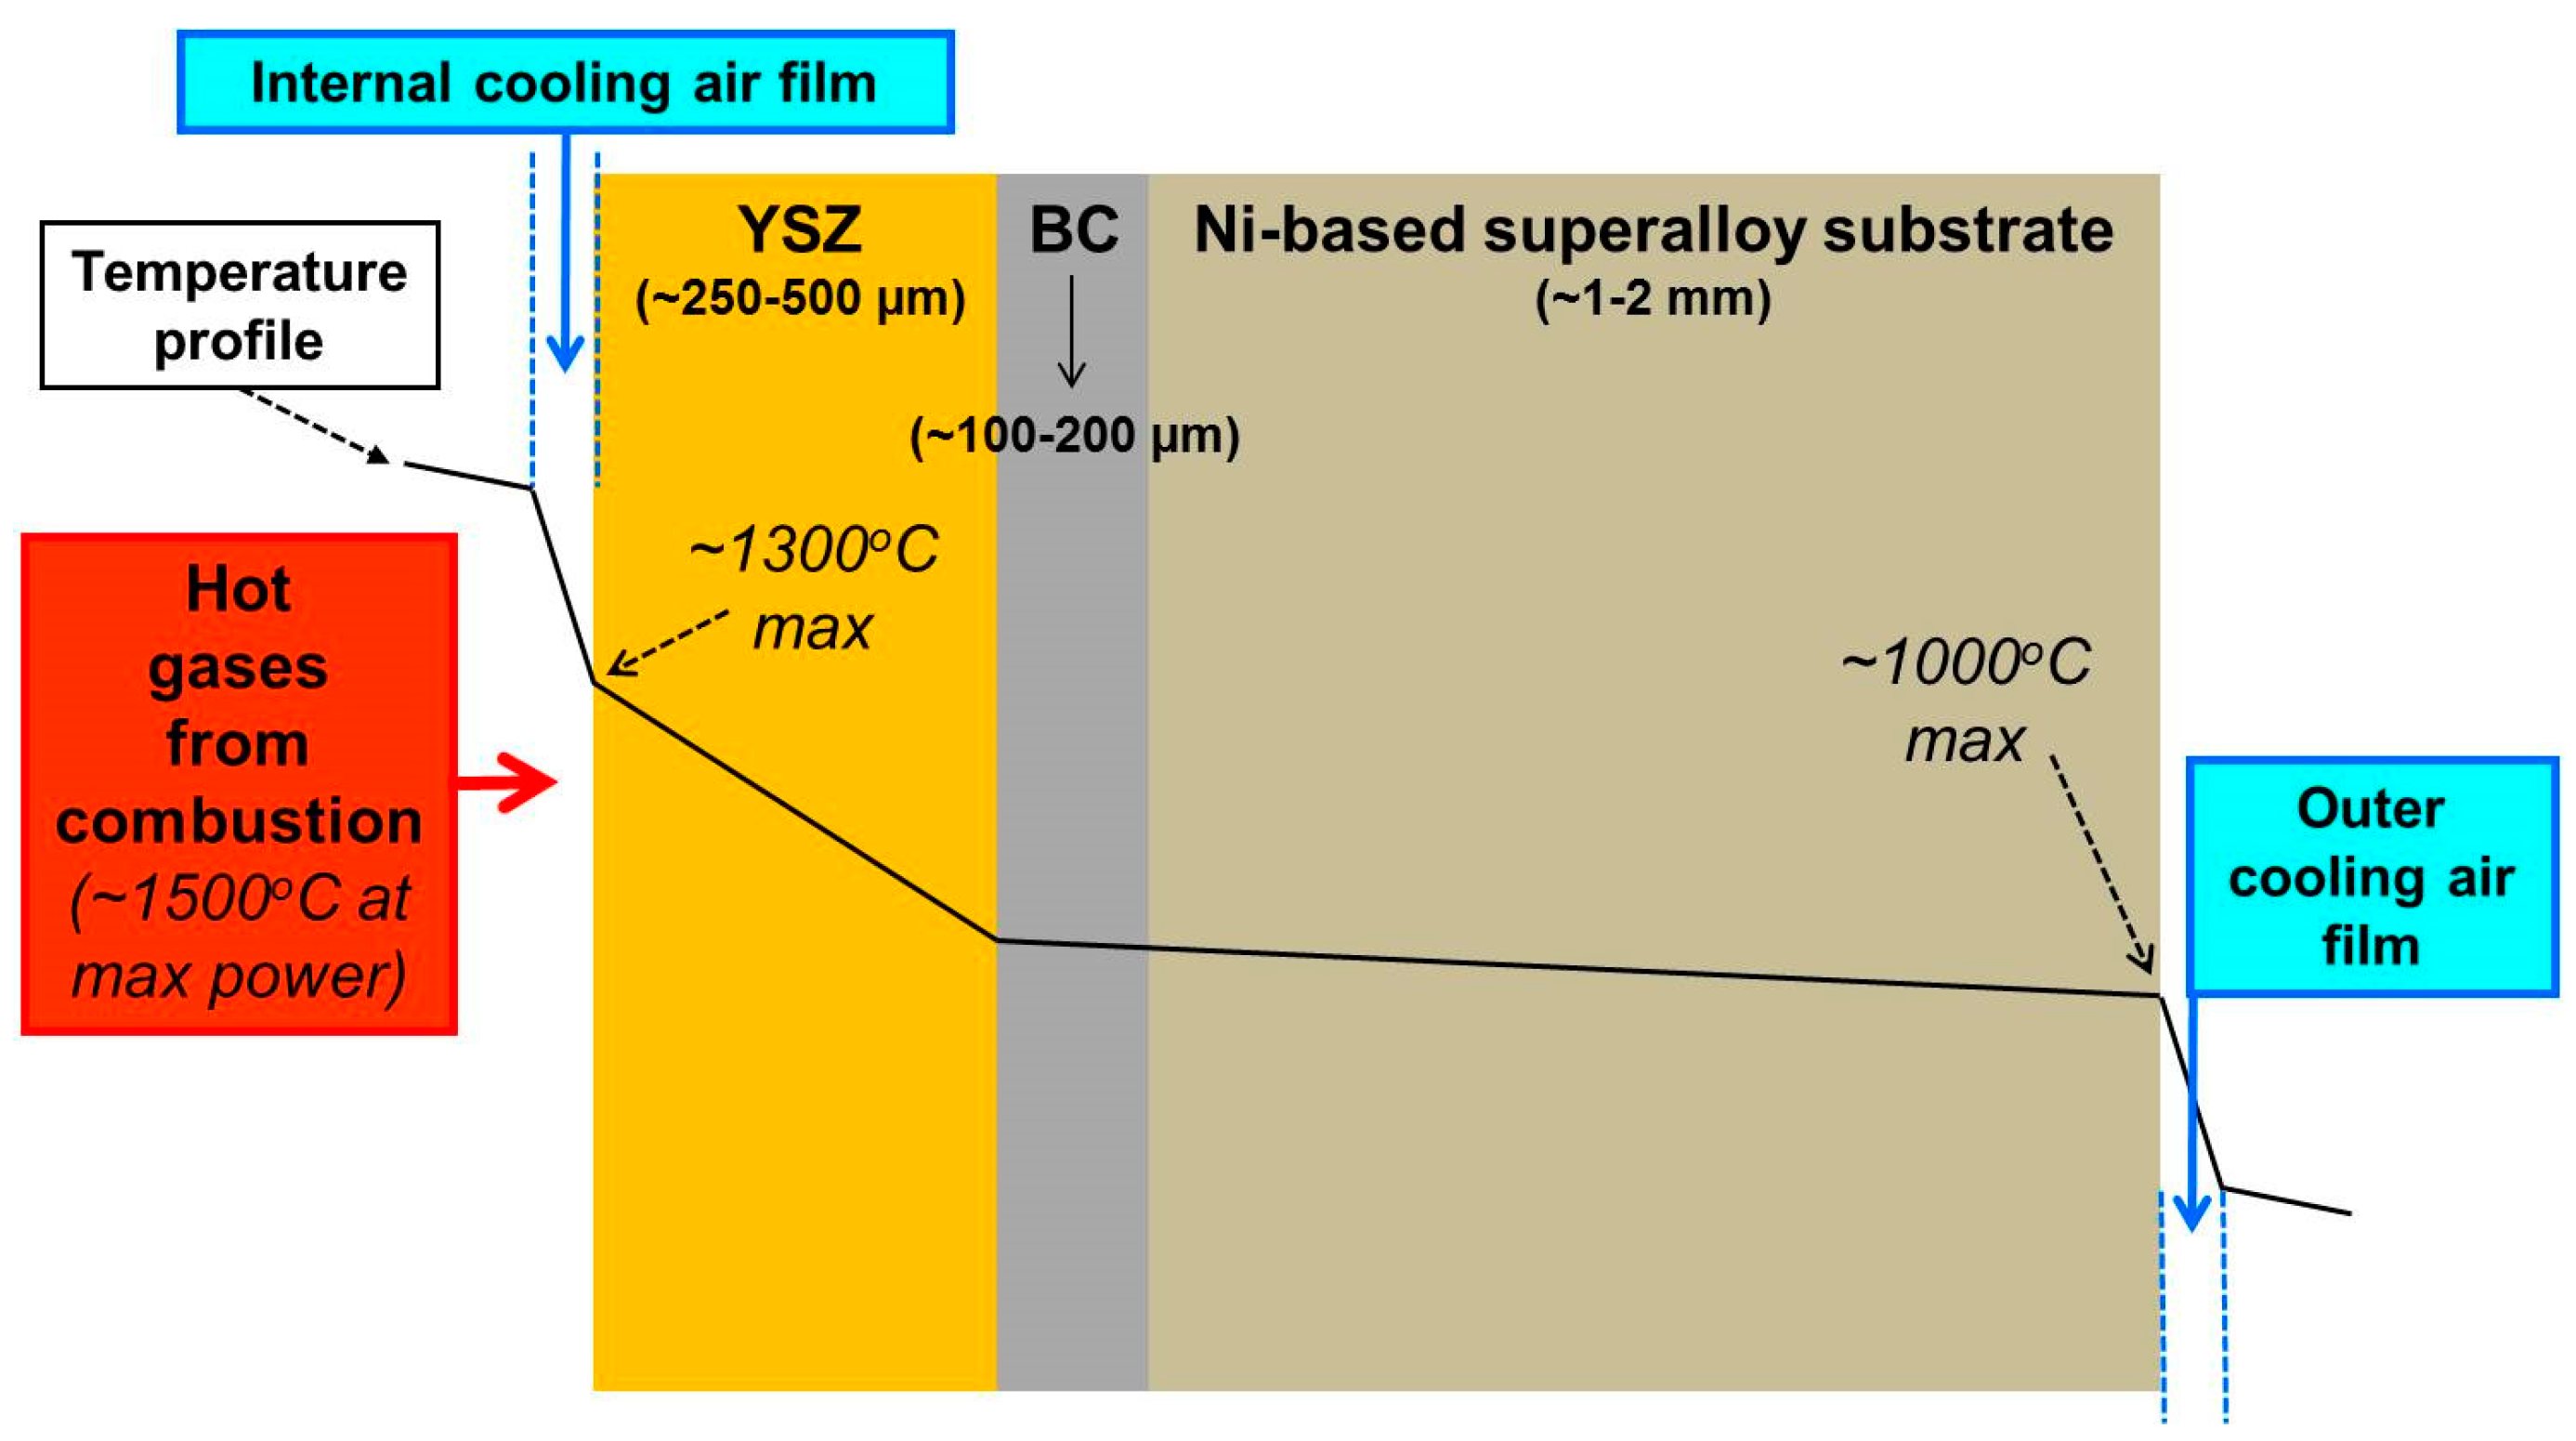
1.3. Thermal Gradients across APS YSZ TBC/Substrate Systems

APS TBCs have been commercially used in gas turbine engines since the 1980s. Today, 40 years later, it is possible to find a vast array of information on the processing, microstructure, properties and performances of APS YSZ TBCs in the open literature. However, although it is widely known that TBCs reduce the temperature of the metallic parts of engines, little information is in fact available on the actual thermal gradients produced across the overall thickness of TBC/substrate architectures. Moreover, this lack of information in the open literature is even more critical for TBC/substrate architectures operating within their maximum temperature capabilities, i.e., T-ysz ~1300 °C and T-sub ~1000 °C [2,12]. This type of information is paramount for engineers, researchers and students working in this field. The key reason is that turbine designers have to find the best compromise in keeping the APS YSZ TBC surface temperature not higher than ~1300 °C while not allowing the substrate temperatures to reach values above ~1000 °C.
In addition, as mentioned earlier, temperatures of 2000 °C (typically at maximum power) can be reached at the flame core (primary zone) inside the combustion chamber [1,2], which is essentially the stoichiometry combustion temperature of kerosene in air (the amount of kerosene added to the air will depend upon the temperature rise required). However, even with TBCs, hot-section metallic materials cannot withstand these stoichiometry temperatures. For this reason, a batch of cold air is bled from the compressor an introduced into the combustion chamber (via dilution holes) to lower the flame temperature towards producing a desired TIT profile [1,2]. As a curiosity, the current TITs of state-of-the-art jet fighter turbines are reaching values in between 1500–1600 °C at maximum engine power [2]. Evidently, this temperature level is still higher than the maximum operational limit of YSZ TBCs of ~1300 °C. For this reason, an engineering trade-off is needed.
In order to achieve such a trade-off, turbine designers will adjust TBC thickness (based on its TC properties) and optimize the cooling air flow on the TBC surface and on the un-coated backside of the metallic component (i.e., substrate). The schematic is shown in Figure 4. The cooling air flow on the TBC surface and component backside is provided by an additional batch of cold air that is re-directed from compressor of the turbine. For cooling the metallic component (un-coated backside), the air flow is simply ducted from the compressor. Regarding the TBC surface, the cold air by-passed from compressor needs to be guided thorough specifically engineered cooling holes, which create a cooling air film that flows along right above the coated-surface of the component, thereby providing a “cooler shielding layer” over the TBC surface [1,2]. By creating these complex engineering features, the maximum YSZ TBC temperature of ~1300 °C is respected.

1.4. Rationale and Objectives

As previously mentioned, there is lack of information in the open literature on TBC/substrate architectures operating within their maximum temperature capabilities, i.e., T-ysz ~1300 °C and T-sub ~1000 °C [2,12], as well as, the influence of the porous YSZ thickness in these gradients (i.e., ~250–500 µm). By ‘‘anecdotal evidence’’ (i.e., informal statements from members of the thermal spray community) when researchers/engineers/students are asked about the thermal gradient that occurs from the TBC surface to the substrate backside, the answers are generally found in the statement “anything in between 100 and 300 °C”. These answers are typically based on “educated guesses”, considering the fact that these gradients also depend on the TBC thickness.
For this reason, the objective of this paper is to measure and report the thermal gradients in an optimized and representative porous APS YSZ TBC, working within the temperature envelope conditions of a TBC/substrate system (more specifically targeting combustion chambers). This optimized and representative porous APS YSZ TBC needs to exhibit porosity and TC values within the range of those reported in the literature for this type of coating, which are 10–20% and 0.7–1.0 W/mK, respectively. Moreover, this type of TBC needs to be one that has demonstrated “good performance” in thermal cycle tests. In order to simulate the typical lower and upper thickness range (~250–500 µm) of porous APS YSZ TBCs in combustion chambers, the same YSZ top coat but with two distinct levels of thickness (e.g., ~260 and ~460 µm) needs to be manufactured. This TBC needs also needs to be manufactured by using an APS torch and feedstocks that are commercially available.
Finally, by using a thermal gradient laser-rig, the TBC surface temperature must be kept constant at ~1300 °C all times (i.e., the highest acceptable operation temperature for an APS YSZ TBC). At the same time, it is expected that the substrate temperature should not be higher than ~1000 °C (i.e., the highest acceptable operation temperature for a metallic component in turbine engines) under a constant back cooling [2,12].

2. Materials and Methods

2.1. APS YSZ TBC Manufacturing and Properties

Initially, it has to be stated that the TBC architecture (YSZ and BC) employed in this work is the current porous APS YSZ TBC benchmark of the National Research Council of Canada (NRC), in which other TBCs are tested and compared. The TBC (YSZ and BC) is manufactured by using by the legacy Metco 3MB APS torch (Oerlikon Metco, Westbury, NY, USA), which is an industry “workhorse equipment” highly employed in North America by OEMs and thermal spray service centers. The porosity of the YSZ top coat (measured via Archimedes) is 15 ± 1%, whereas its as-sprayed TC at RT is ~0.80 W/mK (i.e., values that are within the range of those reported in the literature for porous APS YSZ TBCs). Moreover, this porous APS YSZ TBC has demonstrated optimized thermal cycle performance and deposition efficiency (DE) values in the range of 60–70%; thereby (i), it is employed as benchmark and (ii) chosen to be evaluated in this study. The complete sets of spray parameters for both YSZ and BC manufacturing are proprietary information of the NRC.
The TBCs were manufactured on puck-shaped (25.4-mm diameter and 3.2 mm thick) Rene’ N515 substrates. Before spraying, a 0.87-mm hole was drilled at the mid-thickness of the substrate throughout its entire 25.4-mm diameter (for thermocouple insertion during thermal gradient testing). In addition, on the side where the TBCs were deposited, the edges were rounded up to minimize sharp-corner stresses that arise during coating deposition and thermal gradient testing. The substrates were grit-blasted with white Al2O3 grit #24 prior to BC spraying (Ra = 3.8 ± 0.5 μm (n = 10)).
The BC feedstock composition was the NiCoCrAlY-HfSi (Amdry 386-4, Oerlikon Metco, Westbury, NY, USA). This powder displays a particle size distribution of d10: 50 μm; d50: 64 μm; d90: 80 μm. The BC was sprayed using a N2 single-plasma (i.e., without H2) and exhibited a DE value of ~67%. The BC thickness was in the range of 150–200 µm and its Ra roughness value was 4.9 ± 0.8 µm (n = 10) (NRC ID# 191114B1).
The YSZ (ZrO2-8 wt.% Y2O3) top coat feedstock (AuerCoat YSZ LD-B, Treibacher Industrie AG, Althofen, Austria) exhibits an agglomerated and sintered morphology, which is manufactured from fine YSZ particles rather than a mixture of ZrO2 and Y2O3 particles. The powder has a particle size distribution of d10: 33 µm; d50: 57 µm; d90: 89 µm. The YSZ was sprayed using a N2/H2 plasma and exhibited a DE value of ~65%. In order to simulate the typical lower and upper thickness range of porous YSZ APS TBCs (~250–500 µm) and minimize possible microstructural variations, two YSZ TBCs were manufactured in two consecutive spray runs using the same spray parameters: ~260 µm (NRC ID# 191115B1) and ~460 µm (NRC ID# 191115B2).

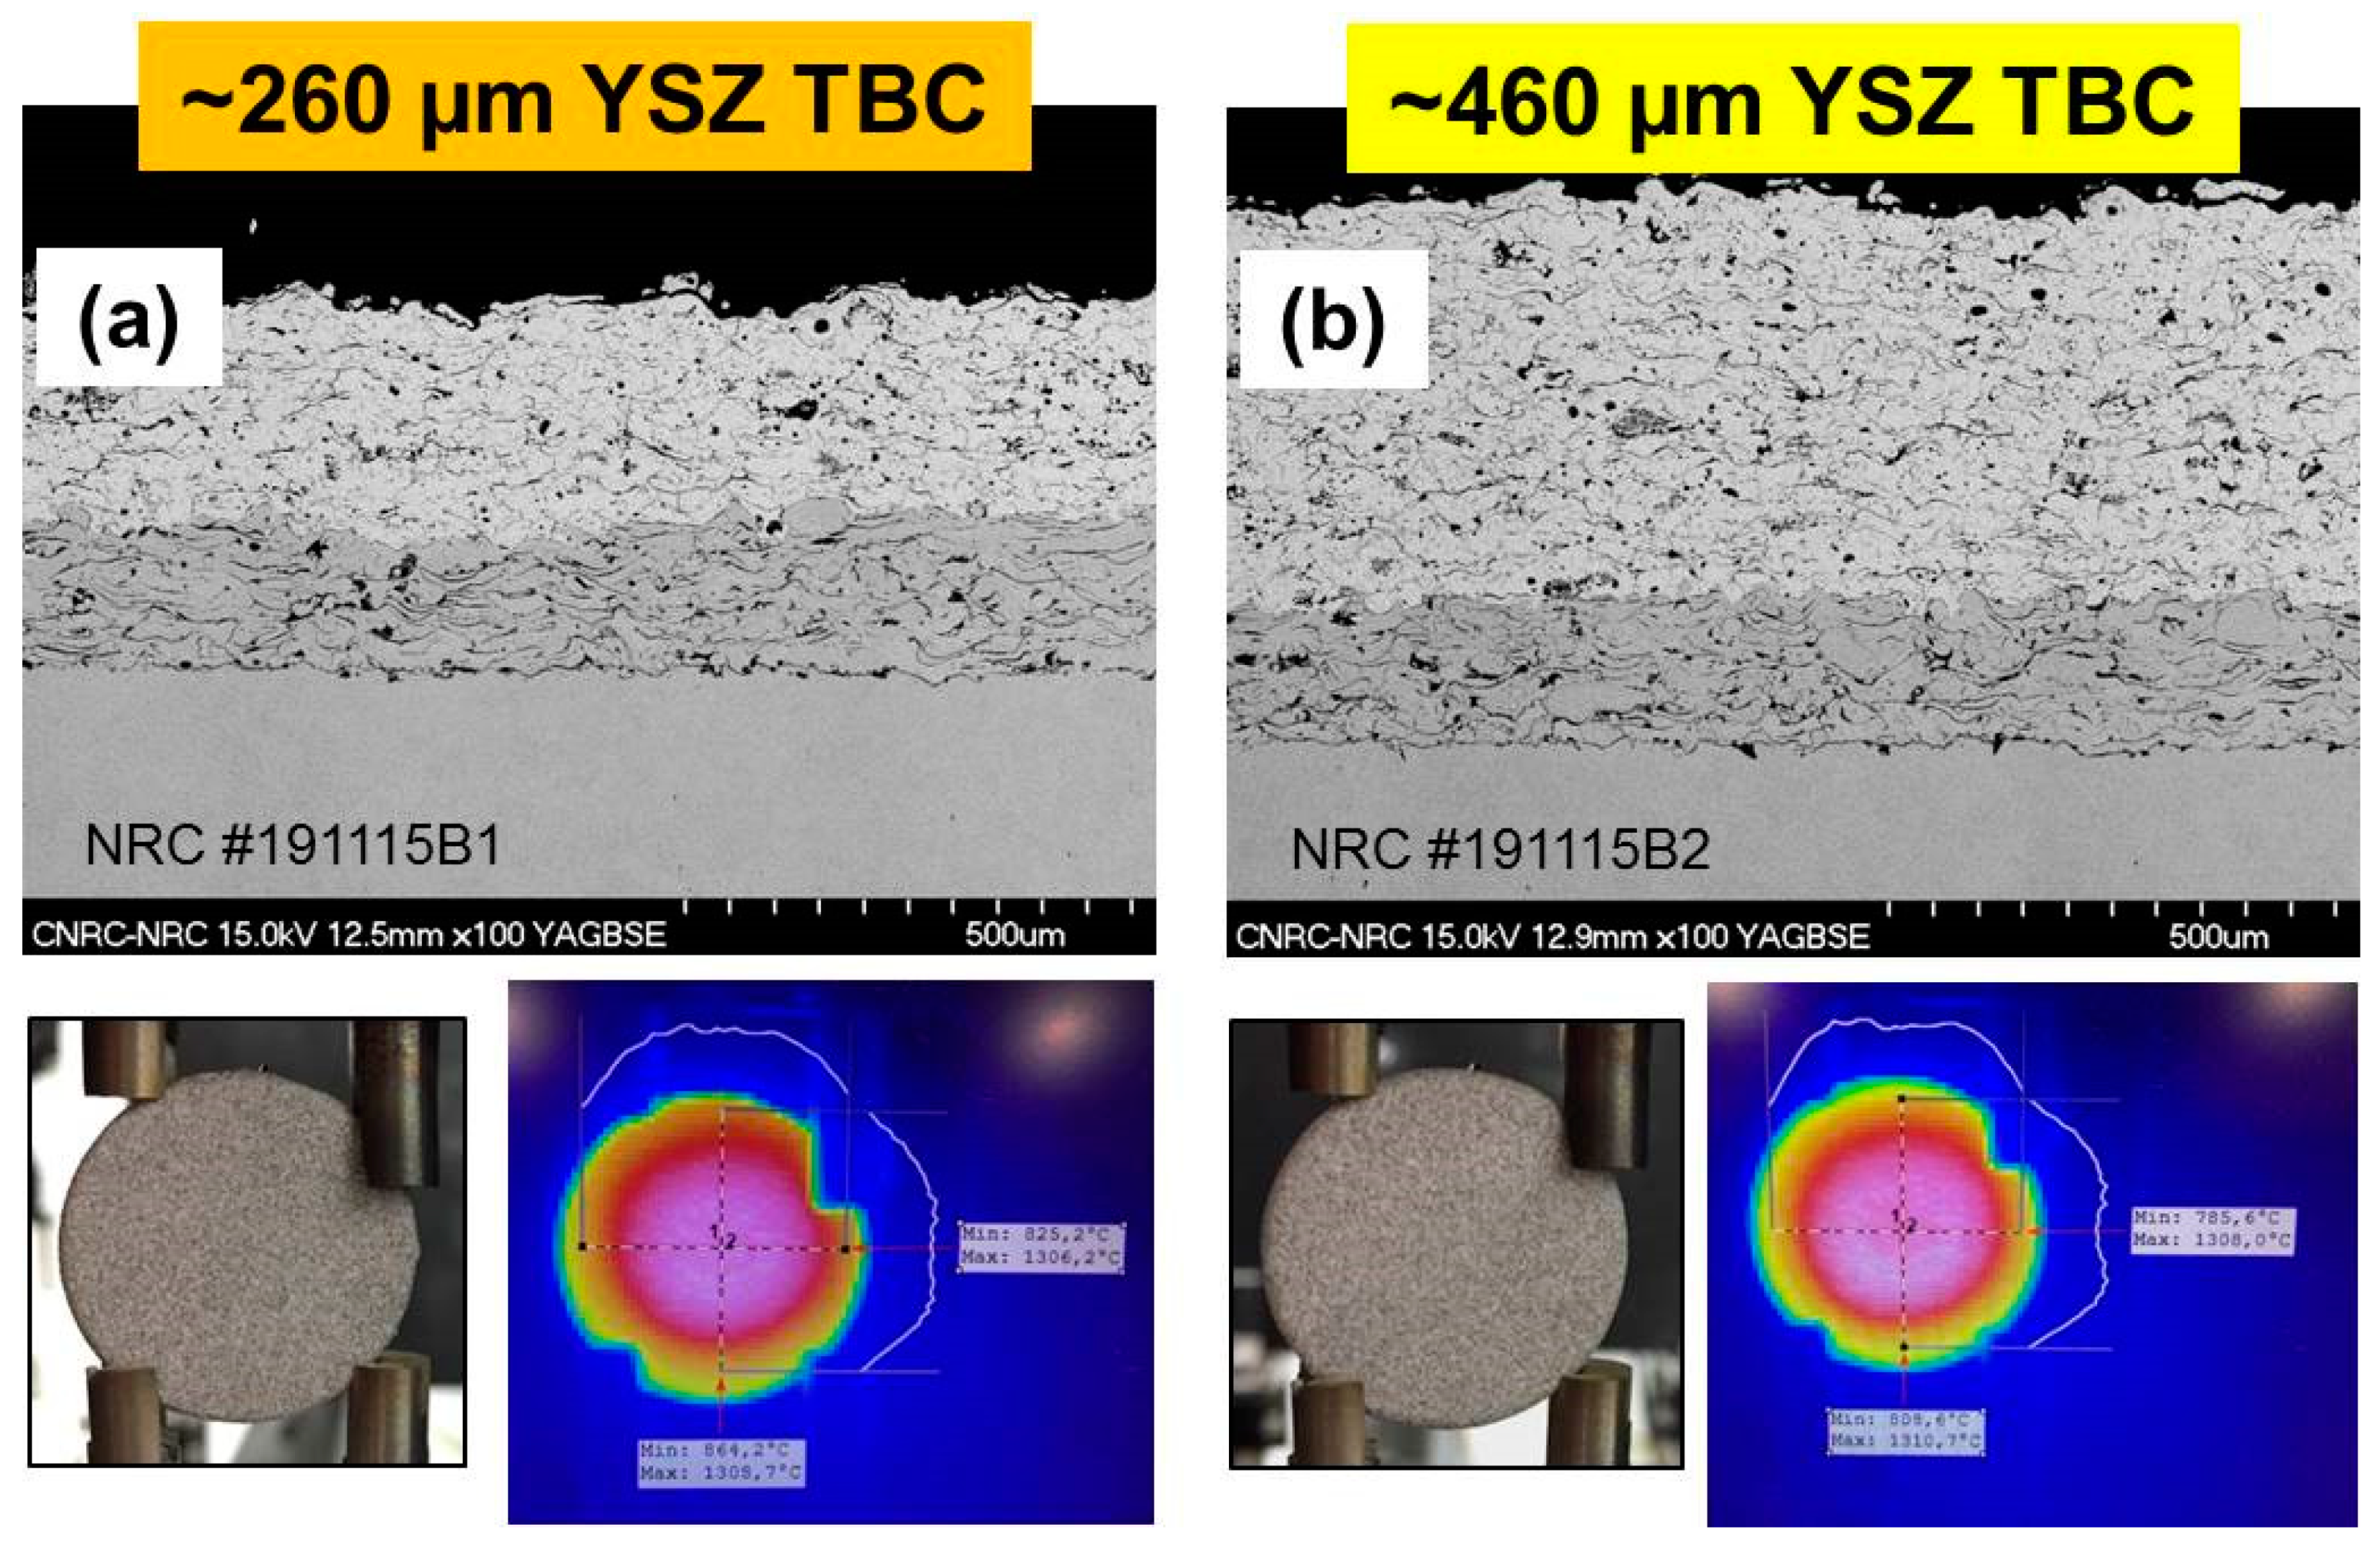
2.2. APS YSZ TBC Microstructure

In order to better preserve their real microstructures, the as-sprayed TBC samples were initially vacuum impregnated in epoxy resin and posteriorly ground/polished according to standard metallography procedures for TBCs. The cross-sectional microstructural features of the TBCs were analyzed by scanning electron microscopy (SEM).

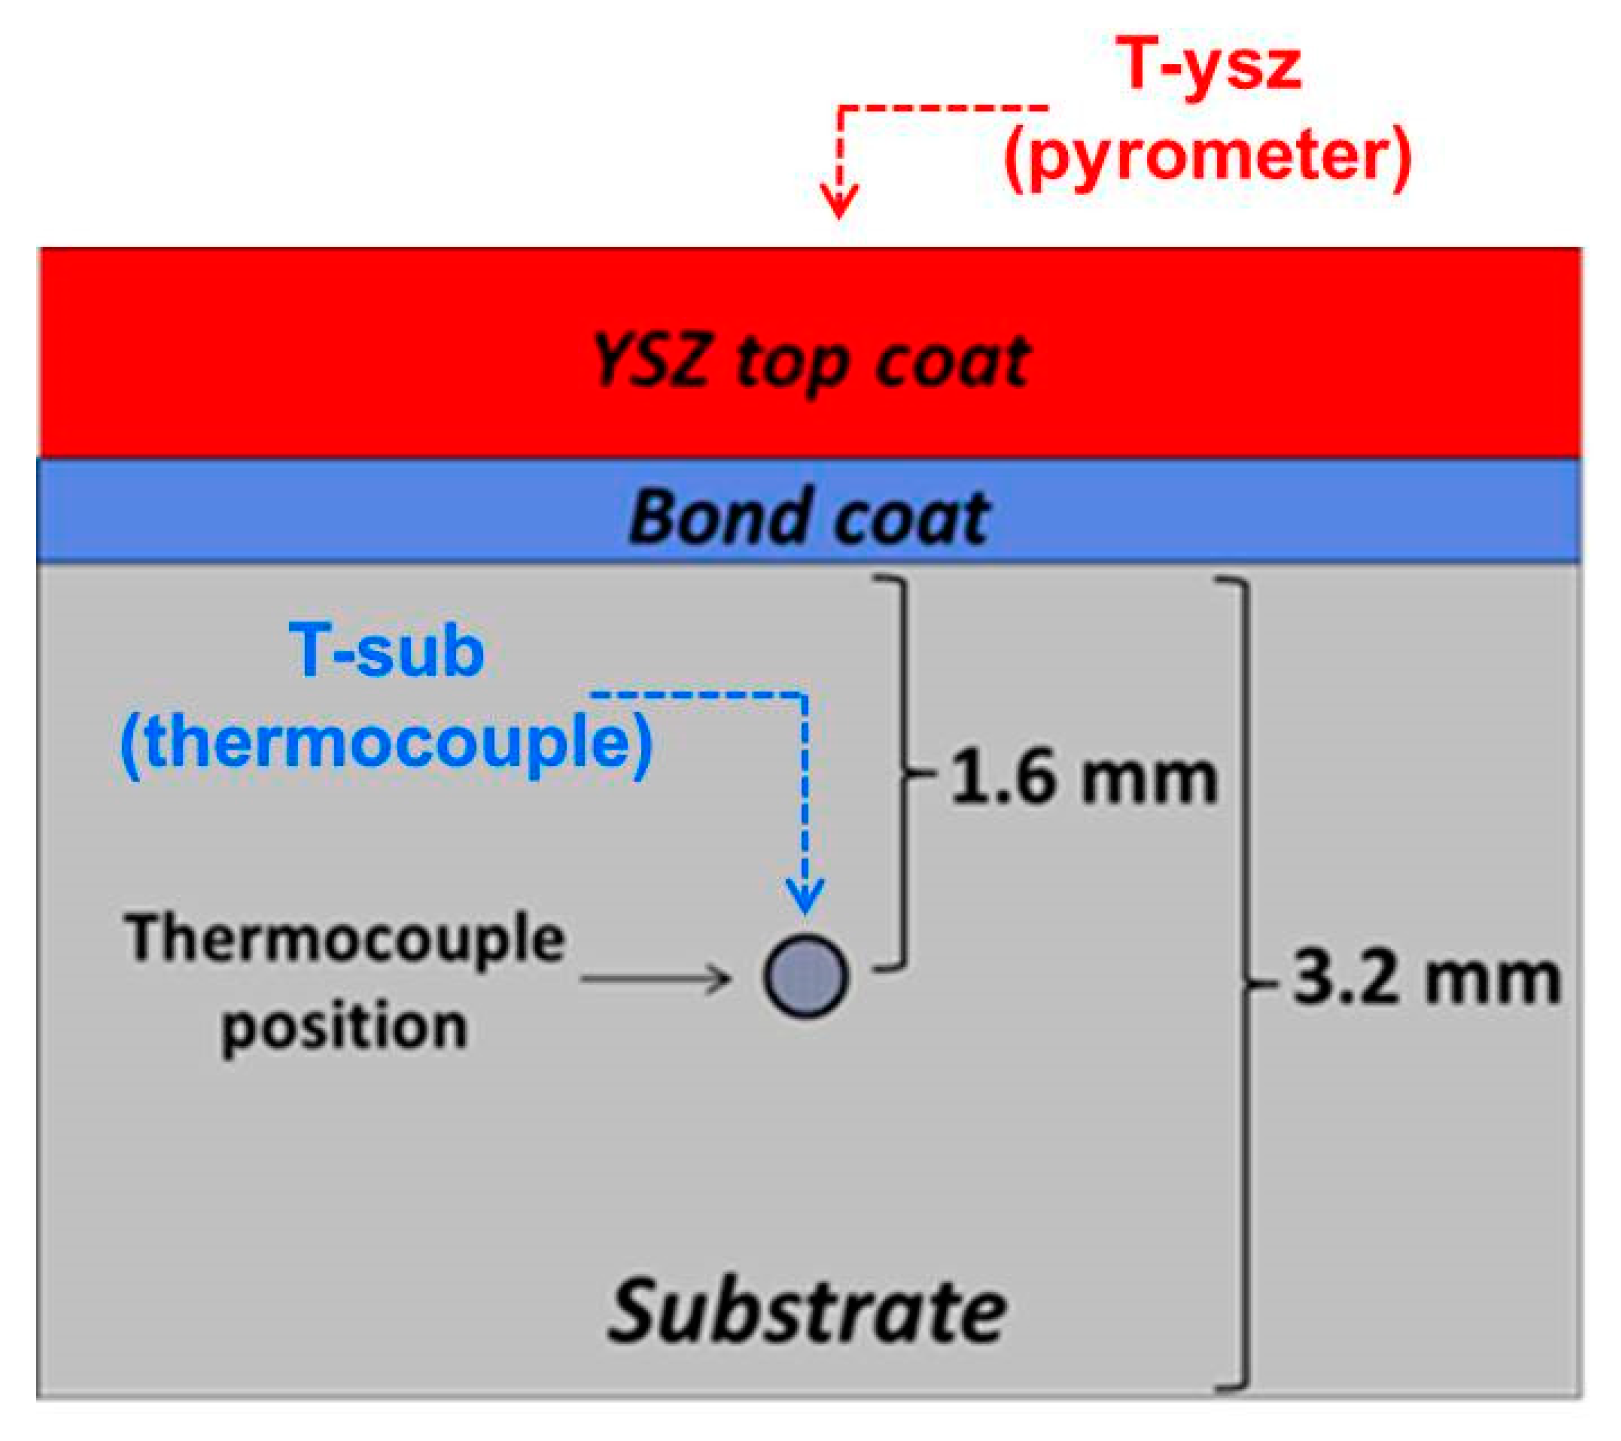
2.3. Laser-Rig Thermal Gradient Testing

The NRC thermal gradient laser-rig is based on a 3-kW CO2 laser, which produces a constant laser beam (10.6-µm wavelength) over the YSZ TBC top coat. The rig is set to create a laser spot size of about 25 mm (1”) in diameter, in order to fit the dimensions of the substrate. A compressed air jet exhibiting a flow of ~425 lpm (at RT) cools the un-coated backside of the substrate in order to generate the thermal gradient along the TBC/substrate profile. The rig is closed loop and computer controlled; therefore, the temperature of the YSZ top coat (T-ysz) and the temperature of the substrate (T-sub) are continuously monitored during the tests. This type of laser-rig system has been previously developed at the National Aeronautics and Space Administration (NASA) by Zhu and Miller [23] to test TBCs in gradient configuration. The overall image of the laser-rig is found in Figure 5.
The temperature of the YSZ top coat (T-ysz) was monitored using a one-color 7.9-µm-wavelength pyrometer with a spot size of ~7 mm at the center of the sample. An infrared (IR) camera (7.5–14 µm spectral range) coupled with a CO2 notch filter at 8 µm was also employed to measure the overall distribution of temperature on the surface of the YSZ top coat (Figure 5). The IR camera is used as a guide to guarantee that a uniform laser beam is right centered on surface of the TBC. The emissivity value for the YSZ was measured and set as 0.96. It is important to highlight that this is the average value reported in the literature by Gonzalez-Fernandez et al. [24] for an APS YSZ coating at the 8–12-µm IR wavelength range.
The substrate temperature (T-sub) was evaluated at the sample center by using a thermocouple (Omega, KMQIN-032U-12, Nicrosil/Nisil, Norwalk, CT, USA) that was inserted into a hole drilled at the mid-thickness position of the substrate. For this reason, as the substrate is 3.2 mm thick, the T-sub was measured at a position of ~1.6 mm beneath the BC/substrate interface, as schematically presented in Figure 6. This position is considered to be representative of the back-side a combustion chamber wall thickness, if its total thickness was 1.6 mm. As the wall thicknesses of combustion chambers are typically found within the range of ~1–2 mm, this is considered to be a representative approach.
For creating the thermal gradient via the laser-rig along the TBC/substrate system, initially the RT cooling air jet on the un-coated backside of the substrate was set to be constant at ~425 lpm. The laser power was set to “run free” in order to keep T-ysz at ~1300 °C. In other words, the laser power would automatically adjust itself (if necessary), by lowering or increasing its value in order to maintain the T-ysz at ~1300 °C during the duration of the test. In other words, even if the substrate back cooling intensity and/or the YSZ TC levels changed significantly during the testing, the laser power would adjust itself to maintain T-ysz at ~1300 °C. Due to safety reasons, the laser-rig can only be operated during regular working-hours. Consequently, a total of 4 consecutive thermal gradient tests of 6 h each (totaling 24 h) were performed for the two porous APS YSZ TBCs of this study (i.e., ~260 and ~460 µm).

3. Results and Discussion

3.1. Porous APS YSZ TBC Microstructures and Laser-Rig Thermal Gradient Setup

Figure 7 shows (i) the as-sprayed cross-sectional microstructure, (ii) snap-shot of sample in the laser-rig at setup and (iii) IR camera image after the thermal gradient started for the ~260 µm thick (Figure 7a) and ~460 µm thick (Figure 7b) porous APS YSZ TBCs. Both TBCs display similar features as those typical of porous APS coatings, exhibiting a lamellar microstructure and a porosity network, but no through-thickness vertical cracks. Additionally, there are no major horizontal cracks or gaps in between the substrates and BCs, or in between the BCs and YSZ the top coats, or within the YSZ top coats, thereby denoting a well-adhered TBC. The IR camera images show that the laser beam was well-adjusted at the center of the YSZ TBC surface at the start of the thermal gradient testing. This is important to guarantee the uniformity of the thermal gradient along the TBC/substrate profile.

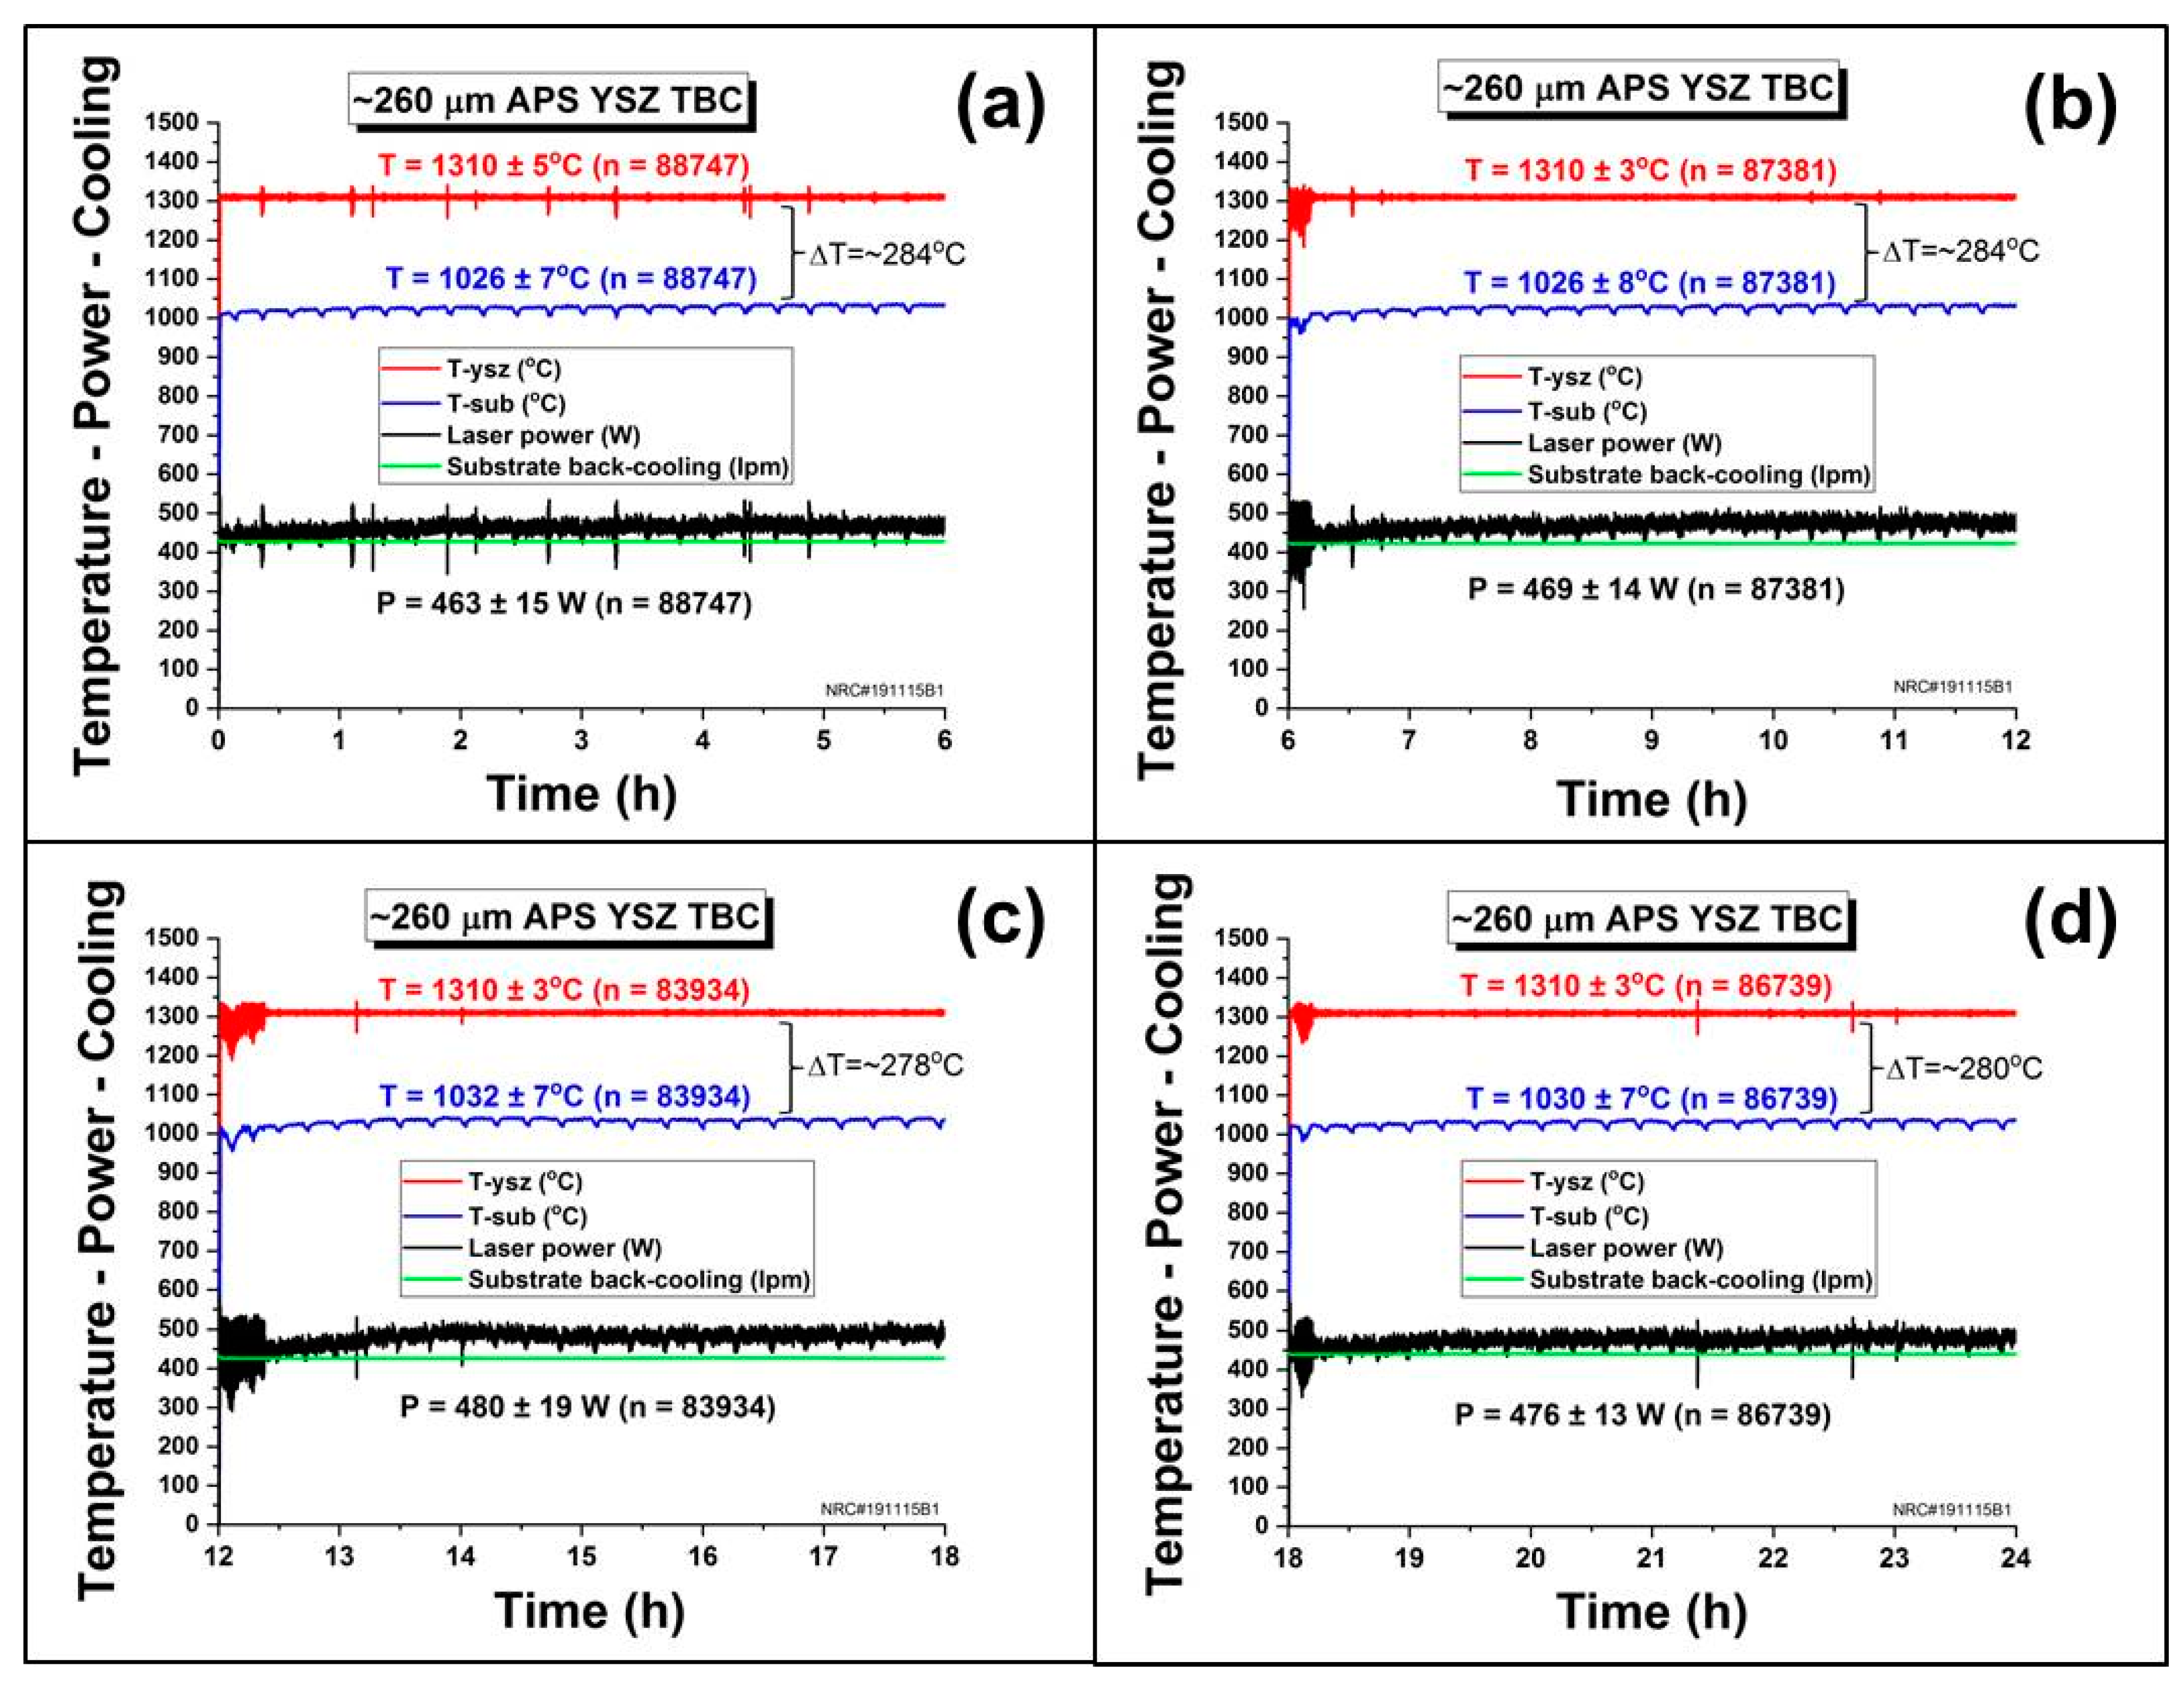
3.2. Laser-Rig Thermal Gradient Testing

Figure 8 shows the laser-rig thermal gradient results for the ~260 µm thick porous APS YSZ TBC. It includes the temperature values on the TBC surface and substrate, as well as, the air cooling jet flow for the substrate backside and the laser power employed to keep the T-ysz at ~1300 °C. It is interesting to observe the overall stability of the experiment.
It is import to stress that the test was performed for a total of four consecutive days (6 h each day). As previously stated, turbine designers have to find the best compromise in keeping the APS YSZ TBC surface temperature not higher than ~1300 °C, while not allowing the substrate temperatures to reach values above ~1000 °C. Briefly, the laser-rig system was able to keep constant the T-ysz at ~1310 °C during a total of 24 h of testing, which was the target of the experiment. Coincidentally, the temperature of the substrate (T-sub) was also kept within the limits, i.e., T-sub ~1030 °C. The overall temperature drop between the TBC surface and the substrate (ΔT) was ~280 °C.
By seeing the results of Figure 8, one may imagine why the “minimum thickness” of porous APS YSZ TBCs is considered to be ~250 µm. For example, if the thickness of the YSZ top coat was ~160 µm for the same T-ysz at ~1310 °C, most likely the T-sub would reach values within their yield strength limits, thereby leading to a catastrophic failure. Consequently, the ~250 µm minimum thickness limit was probably not established randomly.
Figure 9 shows the laser-rig thermal gradient results for the ~460-µm-thick porous APS YSZ TBC. It also includes the temperature values on the TBC surface and substrate, as well as the air-cooling jet flow for the substrate backside and the laser power employed to keep the T-ysz at ~1300 °C. Just like the previous results, it is interesting to observe the overall stability of the experiment.
The target of the experience was again respected. The laser-rig was able to keep T-ysz constant at ~1305 °C during a total of 24 h of testing. However, due to the larger YSZ top coat thickness, and as the substrate back cooling was kept at the same level (~425 lpm), the overall substrate temperature was ~840 °C. As a consequence, the general temperature drop between the TBC surface and the substrate (ΔT) increased to ~465 °C.
By seeing the results in Figure 9, one may infer why the “maximum thickness” of porous APS YSZ TBCs is considered to be ~500 µm for combustion chamber applications. At a YSZ thickness of ~460 µm, the T-sub was kept at ~840 °C, which is well below the maximum temperature limit of ~1000 °C [2,12], thereby offering a good protection and safety window against high temperature deterioration. Even if a thicker porous YSZ was produced (e.g., ~660 µm), most probably there would not be major advantages. In fact, manufacturing a much thicker YSZ TBC in this case could be detrimental, based on the fact that it would increase production costs and even add un-wanted extra weight on the turbine. Moreover, Helminiak et al. [10] compared the short and long-duration furnace cycle test (FCT) performance at 1100 °C of porous 375-750-1125-µm-thick APS YSZ TBCs. For both tests, the best thermal cycle FCT performance was provided by the 375-µm-thick TBC (short at 155 cycles and long at 480 cycles), followed by the 750 (short at 110 cycles and long at 420 cycles) and 1125-µm-thick (short at 25 cycles and long at 300 cycles) TBCs. In this case, it seems that when the porous YSZ APS YSZ TBC becomes “too thick”, the residual stresses begin to deteriorate the top coat performance in thermal cycling.
Consequently, it is predicted that for combustion chambers, porous APS YSZ TBCs in the range of ~400–500 µm are preferred. They will induce the needed extra thermal protection and safety for the metallic component and BC (Figure 9), thereby decelerating the thickening of the thermal grown oxide (TGO) on the BC, which is one of the mechanisms that provoke spallation of TBCs [3,4,5,6,10]. At the same time, at these thicknesses levels (i.e., ~400–500) the residual stresses are probably not still “high enough” to cause a significant detriment in thermal cycle performance. Thus, it will increase the lifetime of the TBC and consequently the number of hours of “turbine airworthiness”, extending its life and reducing maintenance costs.
Specifically regarding reducing maintenance costs, combustion system components often have the shortest life in gas turbines. It happens because they operate under the highest temperatures and stresses in the engines. For this reason, turbine engines need to pass by a preventive evaluation called hot-section inspection (HSI) [24,25]. Traditionally, an HSI is required when the engine reaches the halfway point of its time between overhaul (TBO), which means having to perform a complete overhaul on an engine at the OEM’s recommended times. When an HSI is done, the hot-section components of the engine are inspected (e.g., combustion chamber, vanes, shrouds and blades). If all the components of the hot-section are still in acceptable conditions (e.g., no major TBC spallation), the turbine keeps flying. However, if necessary, those components will be repaired or replaced; leading to un-wanted maintenance costs. Consequently, one can realize how paramount TBC R&D is regarding improving engine efficiency, longevity while reducing operational costs.
As a brief note, one may have observed that for Figure 8b–d and Figure 9a, in the first ~15–45 min of thermal gradient test, there was a noticeable fluctuation of the laser-rig power, which was translated to discernible variations of T-ysz and T-sub. These fluctuations may occur in the beginning of the testing, because the overall system of the laser-rig (e.g., lenses, mirrors and operation temperature) need “some time” to warm up, dilate and stabilize. The average data values reported in Figure 8 and Figure 9 represent those obtained after laser power was stabilized.
Finally, it has to be clarified that the so-called dense-vertically-cracked (DVC) APS YSZ TBCs are typically thicker than ~500 µm. In fact, they can reach thickness values in the order of ~800–1000 µm or higher. APS YSZ DVC-TBCs exhibit porosity values lower than 10%. These lower porosity values will translate into TC values higher (e.g., ~1.5 W/mK) than those of porous (10–20%) YSZ APS TBCs (e.g., ~0.7–1.0 W/mK). Consequently, in order to keep their thermal insulating effectiveness at “acceptable” levels, they are thicker than the typical porous YSZ TBCs [5,7]. However, DVC-TBCs were not the subject of this study.

3.3. Porous APS YSZ TBC—Thermal Resistance

By comparing the laser power levels of Figure 8 and Figure 9, it is possible to observe that the power required to keep T-ysz at ~1300 °C is lower for the thicker YSZ TBC; i.e., ~375 W versus ~470 W. As both were subjected to the same back cooling intensities (air flow ~425 lpm at RT), the thinner TBC exhibits a lower thermal resistance, thereby requiring additional laser power to keep T-ysz at ~1300 °C and yielding higher T-sub values (i.e., ~1030 °C versus ~840 °C).
Helminiak et al. [10] introduced the concept of thermal resistance of a TBC (Rtherm), which is given by:
R t h e r m = h c e r a m i c   t o p   c o a t k c e r a m i c   t o p   c o a t   ( m 2 K / W )
where h is the thickness and k is the TC of the ceramic top coat. The thermal resistance is a measure of the thermal insulating effectiveness of a TBC. It can be maximized by increasing the top coat thickness and/or by minimizing the TC of the top coat. In this study, as both YSZ TBCs were the same (i.e., same TC), it is fair to say that the thicker one exhibited the higher insulating effectiveness, i.e., higher thermal resistance at the same T-ysz and back cooling intensity.

3.4. Understanding the Porous APS YSZ TBC Stability at High Temperatures

Additional important understandings and concepts can be interpreted from the results of Figure 8 and Figure 9. Initially it is observed that for each individual TBC/substrate system, all T-ysz and T-sub values, their respective ΔTs, laser power levels and back cooling flows (considering their averages and standard deviations) remained nearly constant during the 24 h of testing (more specifically, after the initial period of laser power stabilization). Based on these facts, it is hypothesized that during thermal gradient testing the sintering/densification levels on both YSZ TBCs were negligible, even after 24 h of high temperature exposure.
As a practical example, if a TBC displayed some significant sintering and densification, its TC value would increase. As a consequence, the thermal resistance of the TBC would drop. A thermal resistance value drop would trigger the laser-rig power to be automatically increased in order to maintain the T-ysz at ~1300 °C, as the substrate back cooling was kept constant at ~425 lpm. Besides, the T-sub value would also increase. However, by looking at the data of Figure 8 and Figure 9, none of these events materialized in a significant manner.
One may suggest that the total time of high temperature exposure (24 h) is still “too short” to produce distinguishable sintering/densification effects. Another one may argue that due to the thermal gradient profile, just the very upper layers of the YSZ TBC were exposed to temperatures levels of ~1300 °C. As a consequence, if sintering/densification indeed developed, it would be so localized to yield observable effects in the overall TBC/substrate system. These facts probably influenced the results seen in Figure 8 and Figure 9.
However, there are other events that need to be considered. Rangaswany et al. [26] measured the CTE of APS oxide ceramics, from RT up to 1000 °C. Two types of samples were analyzed: (i) free-standing coatings and (ii) coatings attached to steel substrate. They reported that the CTE values of the free-standing ceramic APS coatings were in the range of those of bulk ceramics, whereas those of the coatings attached to steel substrate nearly matched that of the steel substrate. This near-match proceeded probably because at high temperatures, the splats followed the expansion of the substrate. As the lamellar microstructure of thermal spray coatings allow the splats to slide and adjust over each other, they tend to exhibit “good” strain tolerance thereby accommodating CTE mismatch effects. According to Yanar et al. [27], the CTE values of Rene’ N5 (similar to Rene’ N515 employed in this work) at ~840 °C and ~1030 °C are ~14.5 and ~15.7 × 10⁻⁶/°C, while that of APS YSZ from 800 to 1200 °C is nearly constant at ~11 × 10−6/°C. Therefore, the CTE of the metallic substrate is on average ~37% higher than that of the APS YSZ within the respective temperature range. For this reason, it is hypothesized that the higher CTE of the metallic substrate pulled the splats apart during the thermal gradient testing, thus slowing down sintering and densification developments.
Thompson and Clyne [16] observed a similar event that supports this hypothesis. They measured the elastic modulus values of as-sprayed and heat-treated (i) free-standing and (ii) attached-to-Nimonic 80A substrate APS YSZ TBCs. As previously highlighted in this manuscript, at 1300 °C the elastic modulus values of the free-standing TBC displayed a continuous increase up to 100 h of high temperature exposure, reaching ~55 GPa. However, for the attached-to-substrate TBC, after an initial steep increase of stiffness during the initial 10 h of heat treatment, the elastic modulus values nearly stabilized at ~15 GPa and remained nearly un-changed until the 100 h of heat treatment (1300 °C) was completed. Hence, here the substrate also probably created a barrier that counter-acted higher densification and sintering levels on the attached-to-substrate YSZ TBC. Similar to the event reported by Rangaswany et al. [26], the YSZ top coat most likely tended to follow the expansion of the metallic substrate at high temperatures, which would occur via inter-splat sliding. This action would retard sintering and densification.
Another factor that probably has played a role in the stability of the porous APS YSZ TBCs under the 24 h of thermal gradient is the purity of the YSZ feedstock. For comparison sake, Table 1 shows the chemical composition of the YSZ feedstock employed in this work (AuerCoat YSZ LD-B) and that of a known commercial benchmark powder used for YSZ APS TBC manufacturing (204B-NS). A YSZ feedstock is generally denominated “high purity” when its level of impurities (particularly SiO2 and Al2O3) is below than 0.1wt.%. For this reason, the AuerCoat YSZ LD-B is a high purity powder, whereas the commercial benchmark is a conventional purity one. Xie et al. [28] compared the sintering properties of APS YSZ TBCs produced from conventional and high-purity YSZ feedstocks by heat treating free-standing YSZ TBCs at 1400 °C for 20 h. YSZ TBCs with impurity contents of 0.2 wt.% of Al2O3 and SiO2 exhibited linear shrinkages in the order of ~1.4%, whereas that of the high purity was less than 0.4%. Therefore, it is also hypothesized that the high purity of the YSZ feedstock employed in this work influenced the stability of the results observed in Figure 8 and Figure 9, as it decelerates sintering and densification.

3.5. Thermal Gradient Values at Maximum T-ysz and T-sub Limits

As previously highlighted, according to the author’s best knowledge, porous (10−20%) APS YSZ TBCs employed on the combustion chambers of aerospace turbines typically exhibit thickness levels of ~250 to 500 µm and operate at maximum T-ysz and T-sub limits of ~1300 and ~1000 °C, respectively.
It is well beyond the scope of this work to determine the thermal gradients within the YSZ TBCs temperature of the BC (T-bc) via complex modelling and simulation. Nonetheless, by using the data of Figure 8 and Figure 9, their approximate values can be estimated via the heat-flow equation, assuming that the heat-flow through the YSZ-TBC/substrate architecture is the same at a steady state:
Q = K A T t h i c k
Q y s z = Q s u b
K y s z A T y s z T B C t h i c k y s z = K s u b A T B C T s u b t h i c k s u b
T B C = ( K y s z t h i c k s u b T y s z ) + ( K s u b t h i c k y s z T s u b ) ( K y s z t h i c k s u b +   K s u b t h i c k y s z )
where “K”, “thick” and “T” represent TC, thickness and temperatures values; respectively. The letter “A” represents the puck-shaped coupon area. The TC of the YSZ TBC (Kysz) was considered to be 0.80 W/mk, which is the as-sprayed TC value of the TBC employed in this study. The substrate+BC was accepted to be as a single-system (thicksub and Ksub), exhibiting a total thickness of 1.6 mm (substrate) + 0.2 mm (BC) = 1.8 mm (thicksub) and TC values of 28.4 W/mK (Ksub) at 1030 °C and 24.8 W/mK (Ksub) at 840 °C, from CMSX-4 data [23].
Based on these figures, the summary of the thermal gradient related values obtained in this experiment is found in Table 2. It needs to be highlighted that these thermal gradient values are representative of newly-manufactured and optimized porous APS YSZ TBCs, operating within the acceptable maximum temperature capabilities, i.e., T-ysz ~1300 °C and T-sub ~1000 °C [2,12].
It is interesting to note that the T-bc values are ~45 and ~55 °C higher than their respective T-sub values. These ranges are similar to those reported by Vaßen et al. [31] (i.e., 30–55 °C) for porous APS YSZ TBCs deposited onto puck-shaped substrates (30 mm diam. × 3.0 mm thick), which are subjected to burner-rig testing. The T-sub in their burner-rig system is also measured by inserting a thermocouple at the mid-thickness of the substrate, while T-ysz is also measured via a pyrometer. By using the average thermal conductivities of the coatings and the substrate, they estimate T-bc, in the similar manner applied to this work.
It needs to be remembered that in FCT evaluation of TBCs, the testing temperature is typically 1100 °C [6,10], which is chosen to induce an accelerated oxidation on the BC of the TBC in order to quicken TBC spallation. By looking at Table 2, the calculated T-bc for the ~260-µm-thick TBC was ~1075 °C (next to typical FCT levels); while that of the ~460-µm-thick TBC was ~895 °C. Consequently, these sets of estimated data also corroborate on what was previously predicted; in the sense that porous APS YSZ TBCs in the range of ~400–500 µm are probably preferred for combustion chambers. They would provide an extra thermal protection and safety for the BC and substrate, thereby prolonging TBC and turbine operational lifetime.

3.6. Thermal Gradient Values for Porous APS YSZ TBCs Reported in the Literature

The summary of thermal gradient values for porous APS YSZ TBCs reported in the literature can be found in Table 3. It needs to be stressed that the thermal gradient data reported in Table 3 are the results of different experiments, distinct TBCs and non-identical objectives. Therefore, the T-ysz, T-bc and T-sub values are randomly distributed. However, overall, the thermal gradient values for porous APS YSZ TBCs are found within the ~0.43–1.06 °C/µm range, which the current results of this manuscript fall within (~0.90 °C/µm—Table 2). Besides, it is important to realize that these values are coming from two unique types thermal gradient rigs (i.e., laser and burner-rigs), which have been reported by independent R&D groups. Due to these reasons, this overall outcome of findings outlined from different teams is thought to be “surprisingly comparable” and, therefore, the results reported in this work are considered to be representative of porous APS YSZ TBCs.

3.7. Final Remarks on Thermal Gradients

Finally, as stated in this manuscript, turbine designers have to find the best compromise in keeping the TBC surface temperature not higher than a pre-determined limit at the same time not allowing the metallic substrate to reach another pre-determined temperature value. Certainly, the concept of TBC thermal resistance proposed by Helminiak et al. [10] is very important in this case. To achieve this compromise they need to work on the range of TBC thicknesses (based on their TC properties), as well as the intensities of TBC film cooling and substrate back cooling flows, with the objective to keep increasing the TIT values. The driving force behind this objective is found on the non-stoppable demand for more efficient propulsion and energy generation systems. The use of computer modelling/simulation to achieve this target is paramount. Nevertheless, it is necessary to provide reliable data for these computer models. The results of this work show that a laser-rig can be very useful to provide data regarding the ranges of thermal gradients in which TBC/component architectures can operate safely. This is also valid for environmental barrier coatings (EBCs) deposited on ceramic matrix composites (CMCs). For this reason, besides being able to provide regular thermal cycling in gradient (e.g., 5 min hot and 2 min cool), a laser-rig can be an asset instrument in providing important information to turbine designers.

4. Conclusions

Benchmark (previously optimized) porous (~15%) YSZ TBCs were manufactured via APS at two different YSZ thicknesses (~260 and ~460 µm) on the same bond-coated superalloy substrate. These features are considered to be representative of TBCs applied on the combustion chambers of aerospace turbines. A thermal gradient laser-rig was employed to generate a temperature drop (ΔT) along the coated coupon, with the target operate within the acceptable maximum temperature capabilities of this type of TBC/substrate architecture, i.e., T-ysz ~1300 °C and T-sub ~1000 °C. This target was achieved, i.e., T-ysz values were not higher than ~1300 °C, while the substrate temperatures did not reach values above ~1000 °C for up to 24 h of thermal gradient testing. The ΔTs for the ~260 and ~460 µm YSZ TBCs were ~280 and ~465 °C, respectively. The thermal gradient value for both YSZ TBCs was ~0.90 °C/µm, which falls within those reported in the literature for porous APS YSZ TBCs. Finally, based on the experimental results it is hypothesized that (i) the high purity of the YSZ feedstock employed in this study and (ii) the higher CTE value of the substrate (when compared to that of the YSZ) are limiting YSZ sintering and densification, thereby reducing the augmentation of its TC levels and (probably) elastic modulus values in thermal gradient environments. If they are confirmed true, these data would be of paramount towards engineering porous APS YSZ TBCs with enhanced efficiency and longevity.

Funding

This research received no external funding. It was performed under internal NRC funding (A769-CAPA-B).

Acknowledgments

The author (R.S.L.) would like to acknowledge the important contributions of the following technical officers (TOs) of the NRC: Jean-Claude Tremblay for porous APS YSZ TBC manufacturing and invaluable commitment during laser-rig operation; David Delagrave for TBC metallographic prepping and Karine Theberge for taking SEM pictures.

Conflicts of Interest

The author declares no conflict of interest.

References

  1. Rolls-Royce. The Jet Engine. Available online: http://www.valentiniweb.com/Piermo/meccanica/mat/Rolls%20Royce%20-%20The%20Jet%20Engine.pdf (accessed on 20 July 2020).
  2. Farokhi, S. Aircraft Propulsion, 2nd ed.; John Wiley & Sons Ltd.: Chichester, West Sussex, UK, 2015; pp. 7–9, 483–488. [Google Scholar]
  3. Hardwicke, C.U.; Lau, Y.-C. Advances in Thermal Spray Coatings for Gas Turbines and Energy Generation: A Review. J. Therm. Spray Technol. 2013, 22, 564–576. [Google Scholar] [CrossRef]
  4. Padture, N.P. Thermal Barrier Coatings for Gas-Turbine Engine Applications. Science 2002, 296, 280–284. [Google Scholar] [CrossRef] [PubMed]
  5. Feuerstein, A.; Knapp, J.; Taylor, T.; Ashary, A.; Bolcavage, A.; Hitchman, N. Technical and Economical Aspects of Current Thermal Barrier Coating Systems for Gas Turbine Engines by Thermal Spray and EBPVD: A Review. J. Therm. Spray Technol. 2008, 17, 199–213. [Google Scholar] [CrossRef]
  6. Lima, R.S.; Guerreiro, B.M.H.; Curry, N.; Leitner, M.; Körner, K. Environmental, Economical, and Performance Impacts of Ar-H2 and N2-H2 Plasma-Sprayed YSZ TBCs. J. Therm. Spray Technol. 2019, 29, 74–89. [Google Scholar] [CrossRef]
  7. Smith, J.; Scheibel, J.; Classen, D.; Paschke, S.; Elbel, S.; Fick, K.; Carlson, D. Thermal Barrier Coating Validation Testing for Industrial Gas Turbine Combustion Hardware. J. Eng. Gas Turbines Power 2015, 138, 031508. [Google Scholar] [CrossRef]
  8. Kulkarni, A.; Wang, Z.; Nakamura, T.; Sampath, S.; Goland, A.; Herman, H.; Allen, J.; Ilavsky, J.; Long, G.; Frahm, J.; et al. Comprehensive microstructural characterization and predictive property modeling of plasma-sprayed zirconia coatings. Acta Mater. 2003, 51, 2457–2475. [Google Scholar] [CrossRef]
  9. Tan, Y.; Longtin, J.P.; Sampath, S.; Wang, H. Effect of the Starting Microstructure on the Thermal Properties of As-Sprayed and Thermally Exposed Plasma-Sprayed YSZ Coatings. J. Am. Ceram. Soc. 2009, 92, 710–716. [Google Scholar] [CrossRef]
  10. Helminiak, M.A.; Yanar, N.M.; Pettit, F.; Taylor, T.A.; Meier, G.H. Factors affecting the microstructural stability and durability of thermal barrier coatings fabricated by air plasma spraying. Mater. Corros. 2012, 63, 929–939. [Google Scholar] [CrossRef]
  11. Smialek, J.L.; Miller, R.A. Revisiting the birth of 7YSZ thermal barrier coatings: Stephan Stecura. Coatings 2018, 8, 255. [Google Scholar] [CrossRef] [Green Version]
  12. Clarke, D.R.; Oechsner, M.; Padture, N.P. Thermal-barrier coatings for more efficient gas-turbine engines. MRS Bull. 2012, 37, 891–898. [Google Scholar] [CrossRef] [Green Version]
  13. Borom, M.P.; Johnson, C.A.; Peluso, L.A. Role of environmental deposits and operating surface temperature in spallation of air plasma sprayed thermal barrier coatings. Surf. Coat. Technol. 1996, 86–87, 116–126. [Google Scholar] [CrossRef]
  14. Morelli, S.; Testa, V.; Bolelli, G.; Ligabue, O.; Molinari, E.; Antolotti, N.; Lusvarghi, L. CMAS corrosion of YSZ thermal barrier coatings obtained by different thermal spray processes. J. Eur. Ceram. Soc. 2020, 40, 4084–4100. [Google Scholar] [CrossRef]
  15. Brandon, J.; Taylor, R. Phase stability of zirconia-based thermal barrier coatings part I. Zirconia-yttria alloys. Surf. Coat. Technol. 1991, 46, 75–90. [Google Scholar] [CrossRef]
  16. Thompson, J.; Clyne, T. The effect of heat treatment on the stiffness of zirconia top coats in plasma-sprayed TBCs. Acta Mater. 2001, 49, 1565–1575. [Google Scholar] [CrossRef]
  17. High-Temperature High-Strength Nickel Base Alloys. Available online: https://www.stainless-steel-world.net/pdf/393.pdf (accessed on 28 June 2020).
  18. Perepezko, J.H. The Hotter the Engine, the Better. Science 2009, 326, 1068–1069. [Google Scholar] [CrossRef]
  19. Academies of Sciences, Engineering, and Medicine—Commercial Aircraft Propulsion and Energy Systems Research: Reducing Global Carbon Emissions. Available online: https://www.nap.edu/catalog/23490/commercial-aircraft-propulsion-and-energy-systems-research-reducing-global-carbon (accessed on 20 July 2020).
  20. Federal Aviation Administration—Advisory Circular—Subject: Ratings and Operating Limitations FOR Turbine Engines (SECTIONS 33.7 and 33.8). Available online: https://www.faa.gov/documentLibrary/media/Advisory_Circular/AC%2033-7.1.pdf (accessed on 20 July 2020).
  21. Mom, A.; Hersbach, H. Performance of high temperature coatings on F100 turbine blades under simulated service conditions. Mater. Sci. Eng. 1987, 87, 361–367. [Google Scholar] [CrossRef]
  22. Nelson, W.A.; Orenstein, R.M. TBC experience in land- based gas turbines. J. Therm. Spray Technol. 1997, 6, 176–180. [Google Scholar] [CrossRef] [Green Version]
  23. Zhu, D.; Miller, R.A. Thermal Conductivity and Elastic Modulus Evolution of Thermal Barrier Coatings under High Heat Flux Conditions. J. Therm. Spray Technol. 2000, 9, 175–180. [Google Scholar] [CrossRef]
  24. Aircraft Turbine Engine Combustion Section Inspection. Available online: https://www.aircraftsystemstech.com/2017/05/combustion-section-inspection.html (accessed on 26 July 2020).
  25. Why Your Engine Needs a Hot Section Inspection. Available online: https://www.pwc.ca/en/airtime-blog/articles/technical-tips/why-your-engine-needs-a-hot-section-inspection (accessed on 26 July 2020).
  26. Rangaswany, S.; Herman, H.; Safai, S. Thermal expansion study on plasma-sprayed oxide coatings. Thin Solid Films 1980, 73, 43–52. [Google Scholar] [CrossRef]
  27. Yanar, N.M.; Helminiak, M.; Meier, G.H.; Pettit, F. Comparison of the Failures during Cyclic Oxidation of Yttria-Stabilized (7 to 8 Weight Percent) Zirconia Thermal Barrier Coatings Fabricated via Electron Beam Physical Vapor Deposition and Air Plasma Spray. Met. Mater. Trans. A 2010, 42, 905–921. [Google Scholar] [CrossRef] [Green Version]
  28. Xie, L.; Dorfman, M.; Cipitria, A.; Paul, S.; Golosnoy, I.; Clyne, T. Properties and Performance of High-Purity Thermal Barrier Coatings. J. Therm. Spray Technol. 2007, 16, 804–808. [Google Scholar] [CrossRef] [Green Version]
  29. Standard powder certificate provided by manufacturer together with powder batch, Treibacher Industrie AG—Certificate of Analysis—AuerCoat YSZ LD Grade B–lot #170901-B–13 September 2018.
  30. Material Product Data Sheet—8% Yttria Stabilized Zirconia Agglomerated and HOSP Powders. Available online: https://www.oerlikon.com/ecomaXL/files/metco/oerlikon_DSM-0242.3_8YO_ZrO_HOSP.pdf&download=1 (accessed on 26 July 2020).
  31. Vaßen, R.; Traeger, F.; Stöver, D. Correlation Between Spraying Conditions and Microcrack Density and Their Influence on Thermal Cycling Life of Thermal Barrier Coatings. J. Therm. Spray Technol. 2004, 13, 396–404. [Google Scholar] [CrossRef]
  32. Tan, Y.; Longtin, J.P.; Sampath, S.; Zhu, D. Temperature-Gradient Effects in Thermal Barrier Coatings: An Investigation Through Modeling, High Heat Flux Test, and Embedded Sensor. J. Am. Ceram. Soc. 2010, 93, 3418–3426. [Google Scholar] [CrossRef]
  33. Vaßen, R.; Kerkhoff, G.; Stöver, D. Development of a micromechanical life prediction model for plasma sprayed thermal barrier coatings. Mater. Sci. Eng. A 2001, 303, 100–109. [Google Scholar] [CrossRef]
  34. Karger, M.; Vaßen, R.; Stöver, D. Atmospheric plasma sprayed thermal barrier coatings with high segmentation crack densities: Spraying process, microstructure and thermal cycling behavior. Surf. Coat. Technol. 2011, 206, 16–23. [Google Scholar] [CrossRef]
Figure 1. Yield strength versus temperature for different Ni-based superalloys employed in the hot-sections of gas turbine engines—adapted from [17].
Coatings 10 00812 g001
Figure 2. Specific core power versus turbine inlet temperature—adapted from [18].
Coatings 10 00812 g002
Figure 3. Typical required turbine peak power per mission segment for a representative flight of a 150-passenger single-aisle aircraft with 5600 km (3000 nautical miles) design range flying a 1900 km (1000 nautical miles) mission—adapted from [19].
Coatings 10 00812 g003
Figure 4. Schematic of the TBC/component in thermal gradient and air cooling.
Coatings 10 00812 g004
Figure 5. Schematic image of the NRC’s thermal gradient laser-rig.
Coatings 10 00812 g005
Figure 6. Schematic of TBC/substrate architecture displaying T-ysz and T-sub measurement locations.
Coatings 10 00812 g006
Figure 7. As-sprayed cross-sectional microstructure, sample snap-shot in the laser-rig at setup and IR camera image after the thermal gradient started and stabilized: (a) ~260 µm thick porous APS YSZ TBC and (b) ~460-µm-thick porous APS YSZ TBC.
Coatings 10 00812 g007
Figure 8. Laser-rig thermal gradient results for the ~260 µm thick porous APS YSZ TBC: (a) 0–6 h; (b) 6–12 h; (c) 12–18 h; (d) 18–24 h.
Coatings 10 00812 g008
Figure 9. Laser-rig thermal gradient results for the ~460-µm-thick porous APS YSZ TBC: (a) 0–6 h; (b) 6–12 h; (c) 12–18 h; (d) 18–24 h.
Coatings 10 00812 g009
Table 1. Chemical compositions of YSZ feedstock powders: AuerCoat YSZ LD-B (high purity) [29] and 204B-NS [30] (conventional purity).
YSZ FeedstockZrO2Y2O3 wt.%SiO2 wt.% (Max)TiO2 wt.% (Max)Al2O3 wt.% (Max)Fe2O3 wt.% (Max)
AuerCoat YSZ LD-B [29]Balance7.60.010.050.00050.0005
204B-NS [30]Balance7−80.30.20.20.2
Table 2. Porosity, TC, thermal gradient temperatures, temperature drops and gradients of newly manufactured and optimized porous APS YSZ TBCs, operating within the acceptable maximum temperature capabilities, i.e., T-ysz ~1300 °C and T-sub ~1000 °C [2,12].
YSZ TBC Thickness (µm)Porosity
(%)
TC (W/mK)T-ysz (°C)T-bc (°C)
calculated
T-sub (°C)ΔTYSZ-SUB (°C)
T-ysz−T-sub
ΔTYSZ (°C)
T-ysz−TBC
YSZ Gradient (°C/µm)
~260~15 1~0.80 1~1310~1075~1030~280~235~0.90
~460~15 1~0.80 1~1305~895~840~465~410~0.90
1 As-sprayed values at RT.
Table 3. Summary of thermal gradient values for porous APS YSZ TBCs reported in the literature.
MaterialSubstrate Shape DimensionsBC Thick
(µm)
YSZ Thick
(µm)
YSZ Porosity (%)Thermal Gradient SourceT-ysz
(°C)
T-bc
(°C)
T-sub
(°C)
YSZ Gradient
(°C/µm)
Ref.
Inconel 738Puck-shaped
diam: 30 mm
thick: 3.0 mm
~150~290~12%Burner-rig~1333~1067~1022 2~0.92Vaßen et al. [31]
Inconel 738Puck-shaped
diam: 30 mm
thick: 3.0 mm
~150~260~12%Burner-rig~1322~1047~1002 2~1.06Vaßen et al. [31]
Inconel 738Puck-shaped
diam: 30 mm
thick: 3.0 mm
~150~320~12%Burner-rig~1333~1064~1019 2~0.84Vaßen et al. [31]
Inconel 738Puck-shaped
diam: 30 mm
thick: 3.0 mm
~150~260~12%Burner-rig~1326~1074~1029 2~0.97Vaßen et al. [31]
Hastelloy XPuck-shaped
diam: 25.4 mm
thick: 3.2 mm
~64~560n.a. 1Laser-rig~1140~900~840~0.43Tan et al. [32]
Inconel 738Puck-shaped
diam: 30 mm
thick: 3.0 mm
~150~300~12%Burner-rig~1280~1045 2~1000~0.78Vaßen et al. [33]
Inconel 738Puck-shaped
diam: 25 mm
thick: 3.0 mm
~150~450~15%Burner-rig~1269~1070~1045~0.50Karger et al. [34]
1 Not available. 2 Estimated.

