Article

High-Porosity Thermal Barrier Coatings from High-Power Plasma Spray Equipment—Processing, Performance and Economics

Treibacher Industrie AG, 9330 Althofen, Austria
*
Author to whom correspondence should be addressed.
Coatings 2020, 10(10), 957; https://doi.org/10.3390/coatings10100957
Submission received: 15 September 2020 / Revised: 30 September 2020 / Accepted: 1 October 2020 / Published: 4 October 2020
(This article belongs to the Special Issue Recent Developments of Thermal Barrier Coatings)

Abstract

:
High-porosity thermal barrier coatings are utilized on gas turbine components where maximizing the coating thermal insulation capability is the primary design criteria. Though such coatings have been in industrial use for some time, manufacturing high-porosity coatings quickly and efficiently has proven challenging. With the industry demand to increase productivity and reduce waste generation, there is a drive to look at improved coating manufacturing methods. This article looks at high-porosity coatings manufactured using a high-power plasma system in comparison with a current industrial coating. A commercial spray powder is compared with an experimental Low-Density powder developed to maximize coating porosity without sacrificing coating deposition efficiency. The resultant coatings have been assessed for their microstructure, adhesion strength, furnace cyclic lifetime, thermal conductivity and sintering behavior. Finally, the impact of spray processing on coating economics is discussed. The use of a Low-Density powder with a high-power plasma system allows a high-porosity coating to be manufactured more efficiently and more cost effectively than with conventional powder feedstock. The improvement in thermal properties for the experimental coating demonstrates there is scope to improve industrial coatings by designing with specific thermal resistance rather than thickness and porosity as coating requirements.

1. Introduction

Conventional air plasma-sprayed (APS) thermal barrier coatings (TBCs) are typically produced with porosity levels ranging from 5%–15%, thermal conductivity in there as a produced state of around 0.8–1.0 W/m·K. [1]. Such coatings are commonly used on airfoils in industrial gas turbines (IGT) or combustion chamber parts on aero engines at thicknesses of 250–450 µm [1,2,3]. With the increasing industry demands for gas turbines that can operate at higher temperatures for longer operational periods more cost effectively, there is a push to develop TBCs with improved performance.
Helminiak et al. proposed a parameter R (Specific Thermal Resistance) that combines the coating thickness h and its thermal conductivity λ, in order to demonstrate the effective thermal resistance of a TBC [4].
R = h λ   ( m 2 K / W )
A higher thermal performance from TBC systems would, therefore, require a higher R value, that could be achieved by an increase in the coating thickness and/or lowering of the coating thermal conductivity in order to increase the effective insulating capability of the coating system [4].
Historically, the approach to the problem of higher performance (higher R values) was to increase the thickness for a known conventional coating [5]. However, increasing the thickness of a TBC alone to increase its effective insulating capability has a side effect in increasing the driving force for coating failure, normally leading to coatings with poorer durability [4,6]. One solution to the issue of low strain tolerance in thick TBCs was the development of the vertically segmented/cracked (dense vertically cracked) coating that allows a thicker TBC to be used [5,7,8]. This approach is not without its drawbacks as segmented coatings tend to be denser by nature of their manufacturing process, leading to a higher thermal conductivity than a conventional porous TBC [9,10]. As a result, the R value for segmented coatings tends to be lower relative to a conventional porous TBC as thermal properties are sacrificed for improved strain tolerance.
An alternative approach has been to increase coating porosity levels over those of conventional TBCs, leading to the development of high-porosity coatings. Scrivani et al. reported that a higher level of porosity (21%–29%) in a thick TBC was able to relax the stresses generated during thermal cycling, leading to longer cyclic lifetime compared to a conventional porous TBC [11]. Increased porosity level also reduces the thermal conductivity of the coating [12]. Gas filled pores have a thermal conductivity two orders of magnitude less than that of the yttria stabilized zirconia (YSZ) ceramic, therefore increased pore content improves coating thermal insulation properties [13]. The high-porosity TBC design approach, therefore, allows the increase in specific thermal resistance via simultaneously enabling greater coating thicknesses and lowering thermal conductivity.
In industrial gas turbine applications, high-porosity (20%–30%) thermal barrier coatings are utilized on components with high thermal loads such as combustor liners and transition ducts [14,15]. High-porosity coatings are frequently used at greater thicknesses than would be used for a conventional porous TBC in an aero engine, with utilized thicknesses from 500 µm up to several millimeters [2,11,14,16]. IGT combustor spends 16,000–24,000 h operating at or close to maximum power level; an aero engine combustor liner, by contrast, may experience more frequent cycles with a higher peak temperature, but only several hundred hours at peak temperature conditions during its lifetime [17]. Coating design considerations for an IGT are, therefore, different than those of an aero turbine as the focus is on long periods of steady-state operation. Consequently, coatings are generally thicker than those used in the aero-turbine field to maximize thermal insulation properties and engine operating efficiency rather than focusing on cyclic performance.
Several researchers have focused on the characterization of high-porosity thermal barrier coatings though their manufacturing conditions are not disclosed [11,16,18]. Research groups that have disclosed the spray parameters for TBCs, typically focus on lower powder feeding rates relative to production systems or on conventional porosity TBCs [19,20,21]. Consequently, little to date has been published on high-porosity thermal barrier coatings manufactured both at high feed rates and with high porosity levels. However, the coating industry is also experiencing a push towards reducing wasted material and energy consumption; thus, TBC production involving high powder feed rates must also include efficiency improvements that can make the overall process more environmentally friendly [22]. Particularly for IGT’s, the components can be exceptionally large, requiring coating across a large surface area. Due to this fact, coating processes that allow for high coating rates are preferred in order to reduce processing time and cost [2].
With conventional low-power (~50 kW) plasma torches, achieving such high coating porosity levels while maintaining high coating rates and deposition efficiency has proven quite difficult. In general, the limitation of legacy plasma spray systems has been their unstable voltage behavior in operation, leading to uneven heating and acceleration of powder particles during spraying. Therefore, achieving the desired high porosity levels, the deposition rate and deposition efficiency are sacrificed when using these legacy torches [23]. Achieving increased process consistency and efficiency requires improved plasma torch designs. Cascaded plasma systems were developed in order to give more consistent particle treatment by reducing voltage fluctuations in the plasma system [21,24,25]. The more uniform heating of the powder particles in the plasma jet improves the process consistency and can allow for an increased efficiency or an increase in the potential throughput for the spray process [19,21,25].
Another approach is to use a gas-extended arc torch that can improve the arc stability and provide higher plasma enthalpy in comparison to legacy plasma torches which produce plasma under similar operating principles. One example of this type of high enthalpy plasma torch is the 100HE from Progressive Surface (Grand Rapids, MI, USA). The 100HE can utilize ternary plasma-forming gas mixtures of argon, hydrogen and nitrogen, thereby providing greater plasma enthalpy potential than systems using Ar-H2 mixtures [22,26]. Additionally, the higher total gas flow through the 100HE and the stepped anode geometry improve the arc stability over that of legacy torches [26]. The arc length within the 100HE is approximately twice that of legacy torches. The longer arc increases the gas ionization interactions, raising the plasma enthalpy, and it raises the torch voltage, which reduces the electrical current required for a desired power level and the hardware degradation rate. Thus, relative to a legacy torch, the 100HE should allow for higher powder feed rates to be processed more efficiently for longer periods of time.
In summary, there is an industrial need for the ability to produce high-porosity thermal barrier coatings on very large components that dictates a requirement for high feeding rates during plasma spraying. A faster and more efficient coating processes that meet the required coating demands benefit the coating manufacturer in reduced costs. As the world focuses on the environmental impact of manufacturing processes, there is a strong push to reduce the environmental impact of thermal spray coating processes by reduction resources such as materials, gasses and energy used in the coating process.
The focus of this study is, therefore, on the production and characterization of high-porosity coatings via high spray rate processing. Furthermore, an experimental powder that was specifically engineered to produce high-porosity coatings will be tested against an existing commercial YSZ spray powder. The coatings will be benchmarked against a state of art industrial coating for an IGT combustor produced by a coating company.

2. Materials and Methods

2.1. Spray Powders

This paper compares coatings prepared from two agglomerated and sintered (A & S) powders, one commercially available and one developed specifically to produce high-porosity coatings. The commercial powder is representative of a typical powder used in production currently for IGT components. A comparison of the powders physical and chemical properties is outlined in Table 1.
The powders have comparable powder particle size distribution. From the perspective of chemistry, the two powders are similar in their main constituents, though differences exist in impurity contents. The commercial powder has an apparent density of ~2.3 g/cc; whereas, the Low-Density powder has an apparent density of ~1.6 g/cc, meaning this new powder has only 70% the mass of the commercial TBC powder for a given particle size. Additionally, because powder feed rates are typically defined in grams per minute, a lower density results in a larger volume of powder injected into the plasma jet for a given feed rate. The hypothesis is that this high-volume powder will allow for greater porosity transfer to the coating during the deposition process. Therefore, the Low-Density powder can enable high-porosity coatings produced at high feed rates without adversely affecting the spray efficiency. An SEM overview of the two types of powders can be seen in Figure 1.

2.2. Coating Conditions

APS bond coats were sprayed using the Axial III spray system (Northwest Mettech Corp., Surrey, BC, Canada) and NiCoCrAlY+HfSi bond coat powder (Ni-192-5, Praxair, Danbury, CT, USA) to a thickness of approximately 200 µm. All bond coats were manufactured in a single spray run to avoid variations between samples. Coating samples for thermal fatigue furnace cycle testing (FCT) testing were deposited onto Hastelloy-X substrates of 50 mm × 30 mm × 6.2-mm-thick dimensions. Carbon steel samples 25.4 mm in diameter and 6.2 mm thick were used for metallography purposes and for bond strength testing. Samples for thermal property evaluation were deposited on to grit blasted stainless-steel substrates 25 mm × 25 mm × 1.6 mm without bond coat.
Ceramic coatings for this study were produced using a Computer Integrated Thermal Spray (CITS) system (Progressive Surface, Grand Rapids, MI, USA) that controlled an 100HE plasma torch and a gravimetric G4 powder feeder (Uniquecoat, Richmond, VA, USA). The target goal for these coatings was a porosity level in the range 20%–30% and a coating thickness of 800 ± 50 µm. The spray parameters for the commercial A & S powder were the manufacturer-recommended starting conditions. Plasma conditions for spraying are outlined in Table 2; gas flows are expressed in standard liters per minute (SLM).
When making the ceramic coatings, powder was injected at every 120° around the plasma perimeter using a 3-port injection ring. The powder injectors were at an 83° angle relative to the plasma centerline, give a 7° backward injection angle that should improve powder entrainment into the plasma stream [27]. With the commercial powder, the diameter of each powder injector was 2.54 mm. For the Low-Density powder, each injector diameter was reduced to 1.8 mm. The smaller-diameter powder injectors were necessary to increase the momentum of the lower-density powder particles and improve the entrainment into the plasma stream. This reduction in injector diameter also results in a reduction in the required carrier gas flow rate required, as shown in Table 2. An Accuraspray G3C system (Tecnar, Saint-Bruno-de-Montarville, QC, Canada) was used to check particle in flight diagnostics before coating deposition.
For each condition, all ceramic coating samples were produced in a single run using a 300-mm-diameter rotating fixture. The rotational fixture allows for spraying to be performed in a similar fashion as a combustor liner. The surface speed of the robot program was the same for both powders at 106 m/min, with a standoff distance of 175 mm. During initial testing, it was observed that deposition rates above 25 µm per pass led to vertical cracking within the microstructure. For this study these cracks were undesirable, so the robot index step size between passes was adjusted to maintain deposition rates below a 25 µm per pass limit. The robot index step size was 10 mm between passes for the commercial powder, but, due to the higher volumetric feed rate produced by the Low-Density powder, the step size had to be increased to 14 mm to stay below the thickness per pass limit.
Before deposition of the ceramic, samples were pre-heated above 250 °C using the plasma torch. Sample cooling was provided during spraying by 3 torch air jets operating at 5 bar with a focal point of 180 mm from the plasma exit nozzle. Secondary cooling was provided by external cooling of the sample surfaces with compressed air. Maximum temperature during coating deposition was approximately 280 °C.
A commercial coating used on IGT combustor liners was used as a reference system. The reference industrial samples were produced using a cascaded plasma system operating in the 45–55 kW power range. Powder feeding was via a 3-port powder injector similar to that used with the 100HE torch, but with a 90-degree angle to the plasma axis. The bond coat material used was a NiCoCrAlY + HfSi. The powder was AMDRY 386-4 (Oerlikon Metco, Wohlen, Switzerland). The ceramic topcoat was manufactured with the same commercially available A & S powder used in this study. Powder feed rate for deposition of the topcoat was slightly lower than that used with the 100HE torch at 270 g/min. The remaining coating parameters for coating manufacturing are proprietary to the coating manufacturer. Finally, an overview of the three coatings investigated in this study is given in Table 3.

2.3. Deposition Efficiency

Deposition efficiency (DE) was evaluated using a modification of the ISO standard for coating deposition efficiency measurement. In this case, a wider ring with an approximate diameter of 300 mm was used. The modification allowed the DE tests robot program conditions to be identical to those used to manufacture the evaluation samples, therefore giving a more representative evaluation. The ring was 10 cm high and had been coated previously with an APS bond coat. DE was evaluated by the mass gain of the ring after a programmed number of topcoat passes. The time to complete the program was measured and the DE was calculated from the difference in weight gain of the ring versus the known feed rate of powder multiplied by the time to spray the coating (i.e., the total amount of powder processed while the plasma torch was on the target ring). This test was performed twice for each of the coating types manufactured with the 100HE plasma system. For the reference coating manufactured with the cascade plasma torch, the DE was not measured during the study. According to the coating manufacturer, the deposition efficiency for this reference process is approximately 38%.
The results for the evaluation with the 100HE spray conditions give a deposition efficiency for the commercial powder of 39.4% and an efficiency of 51.6% for the Low-Density powder. The difference in deposition efficiency is quite notable between the two powder types. Utilizing the Low-Density powder, approximately 31% more powder will be deposited on the component. As discussed in the Introduction, there are few studies that report deposition efficiency along with the conducted spray experiments. Though other researchers report DE levels higher than reported here, the majority of these researchers use powder feeding rates a tenth of that used here and not relevant for large scale production [28].

2.4. Microstructure Preparation and Porosity Evaluation

Samples for microstructure analysis were prepared by cold mounting in low viscosity epoxy resin (Logitech 301, Logitech Ltd., Glasgow, UK) under vacuum conditions. The subsequent sample was cut for cross-section and remounted in a standard cold mounting epoxy resin. Upon curing, the samples were prepared for microstructure analysis using a standard TBC grinding and polishing procedure. Samples were sputter coated with a thin layer of platinum before observation in a scanning electron microscope.
Porosity analysis was performed using two conventional techniques. Firstly, image analysis was used to evaluate porosity content on coating microstructures. Image analysis is considered a standard evaluation for coatings and is used to verify a coating meets its required specification. For the analysis, 20 images of the coating were taken at a magnification setting that captured an area of 0.0108 mm2 per image. The images were analyzed using the open source image analysis software ImageJ with an automated thresholding and analysis routine to detect coating porosity [29]. A second porosity evaluation was performed during preparation of samples for thermal diffusivity measurement. As a requirement for thermal property evaluation, coating apparent density was measured using a water infiltration method developed for evaluating porous ceramics [30]. In addition to determining the apparent density of the sample, this method may also be used to calculate porosity level if it is assumed that fully dense IGT would have a density of 6.1 g/cm3. While other methods exist for the evaluation of coating porosity and apparent density, the majority bring additional issues of complexity in performing the measurement [31,32,33,34]. In practice, multiple techniques are required for porosity evaluation of TBC coatings.

2.5. Adhesion Testing

Adhesion testing was performed according the ASTM C633 test with 5 samples evaluated for each coating set and a reference dummy sample used to verify the glue performance [35]. The test was performed on coated 25.4-mm-diameter steel samples that had their non-coated, rear face grit blasted before glue bonding. FM1000 glue was used in order to prevent impregnation of the ceramic coating and influence on the adhesion result.

2.6. Thermal Conductivity Evaluation

Samples for thermal conductivity evaluation were deposited onto grit blasted steel substrates without bond coat. The samples were cut into 10 mm × 10 mm test samples using a precision sectioning saw and detached from the substrate using an acid bath of hydrochloric acid before rinsing clean and drying. Samples were measured for their bulk density before thermal diffusivity measurement utilizing water infiltration, as described in Section 2.4.
Thermal diffusivity of the samples was measured using a HyperFlashHT system (Netzsch Thermophysics, Selb, Germany). Before measurement, both sides of the samples to be measured were coated in a thin layer of graphite to avoid translucency issues with the YSZ coating. Four samples from each coating set were measured in their as-produced state. In each case, the samples were measured from room temperature up to 1200 °C in 200-degree temperature steps. At each temperature step five measurement ‘shots’ were performed on each sample to collect a reliable average value of thermal diffusivity.
Further samples were isothermally heat treated at 1200 °C before being analyzed using the same thermal diffusivity program. The 10-h exposure time was selected in order to produce a stable coating structure that would have seen stage 1 sintering effects [36]. Longer-term sintering exposures were carried out at additional time intervals of 25, 50, 100, 200 and 400 h at 1200 °C. A minimum of three thermal conductivity samples were prepared at each sintering interval. Finally, the thermal conductivity of the samples was calculated using the sample bulk density, sample thickness and specific heat capacity of the YSZ material. Calculation of the thermal diffusivity was performed using the Netzsch Proteus software.

2.7. Furnace Cycle Fatigue Evaluation

FCT, thermo-cyclic fatigue evaluations were carried out using an Entech elevator test furnace (Entech AB, Angelholm, Sweden). The FCT test cycle consisted of an 1121 °C furnace hold for 60 min, followed by forced air cooling to approximately 100 °C within 10 min. Cycle parameters were selected to meet the testing requirements of an industrial gas turbine subjected to cyclic operation. Coatings were monitored for surface integrity using an automated image capture of the sample stage on during each cooling cycle. Sample failure was deemed to have occurred when 20% of the coating surface showed spallation. Failure of such thick and porous TBCs results in the coating delaminating in one piece with the fracture occurring at the thermally grown oxide layer. Delaminated samples from the TBC after failure were glued to a grit blasted steel substrate using PVA based glue to provide support. Thermal diffusivity samples, 10 mm × 10 mm, were then cut from this bonded laminate with the glue subsequently dissolved in a water bath overnight to detach the ceramic layer from the steel support. Samples were then washed and heated at 400 °C to remove any residues. Four samples for each coating type were prepared. Further preparation followed the same procedure as previously outlined in Section 2.4.

3. Results and Discussion

3.1. Coating Diagnostics

Before deposition of the ceramic layer, the Accuraspray system was utilized to measure apparent particle velocity and temperature at the 175-mm standoff distance chosen for deposition. The coatings were deposited at roughly comparable particle conditions. The commercial powder gave a measured particle velocity of 126 m/s and particle temperature of 2590 °C. The Low-Density powder had an apparent particle velocity of 138 m/s and temperature of 2610 °C. It can be noted that the measured particle velocities and temperatures are lower relative to published literature [22,23]. The AccuraSpray measurement is an ensemble measurement technique and it is believed that the reading becomes biased to the coarsest powder particles when high feed rates are processed [37]. Vaidya et al. have also reported that the melting or solidification point of YSZ may actually be lower than reported [20]. Similarly, Matsumoto et al. quote a lower temperature for the melting of YSZ [38]. It is also expected that, as the measurement is made at the same standoff distance as the deposition of the coating, much of the powder may be cooling down or partially solidified [19]. Experience during parameter development suggests that deposition rate and, therefore, efficiency drops off dramatically once the particle temperature conditions are below ~2450 °C.

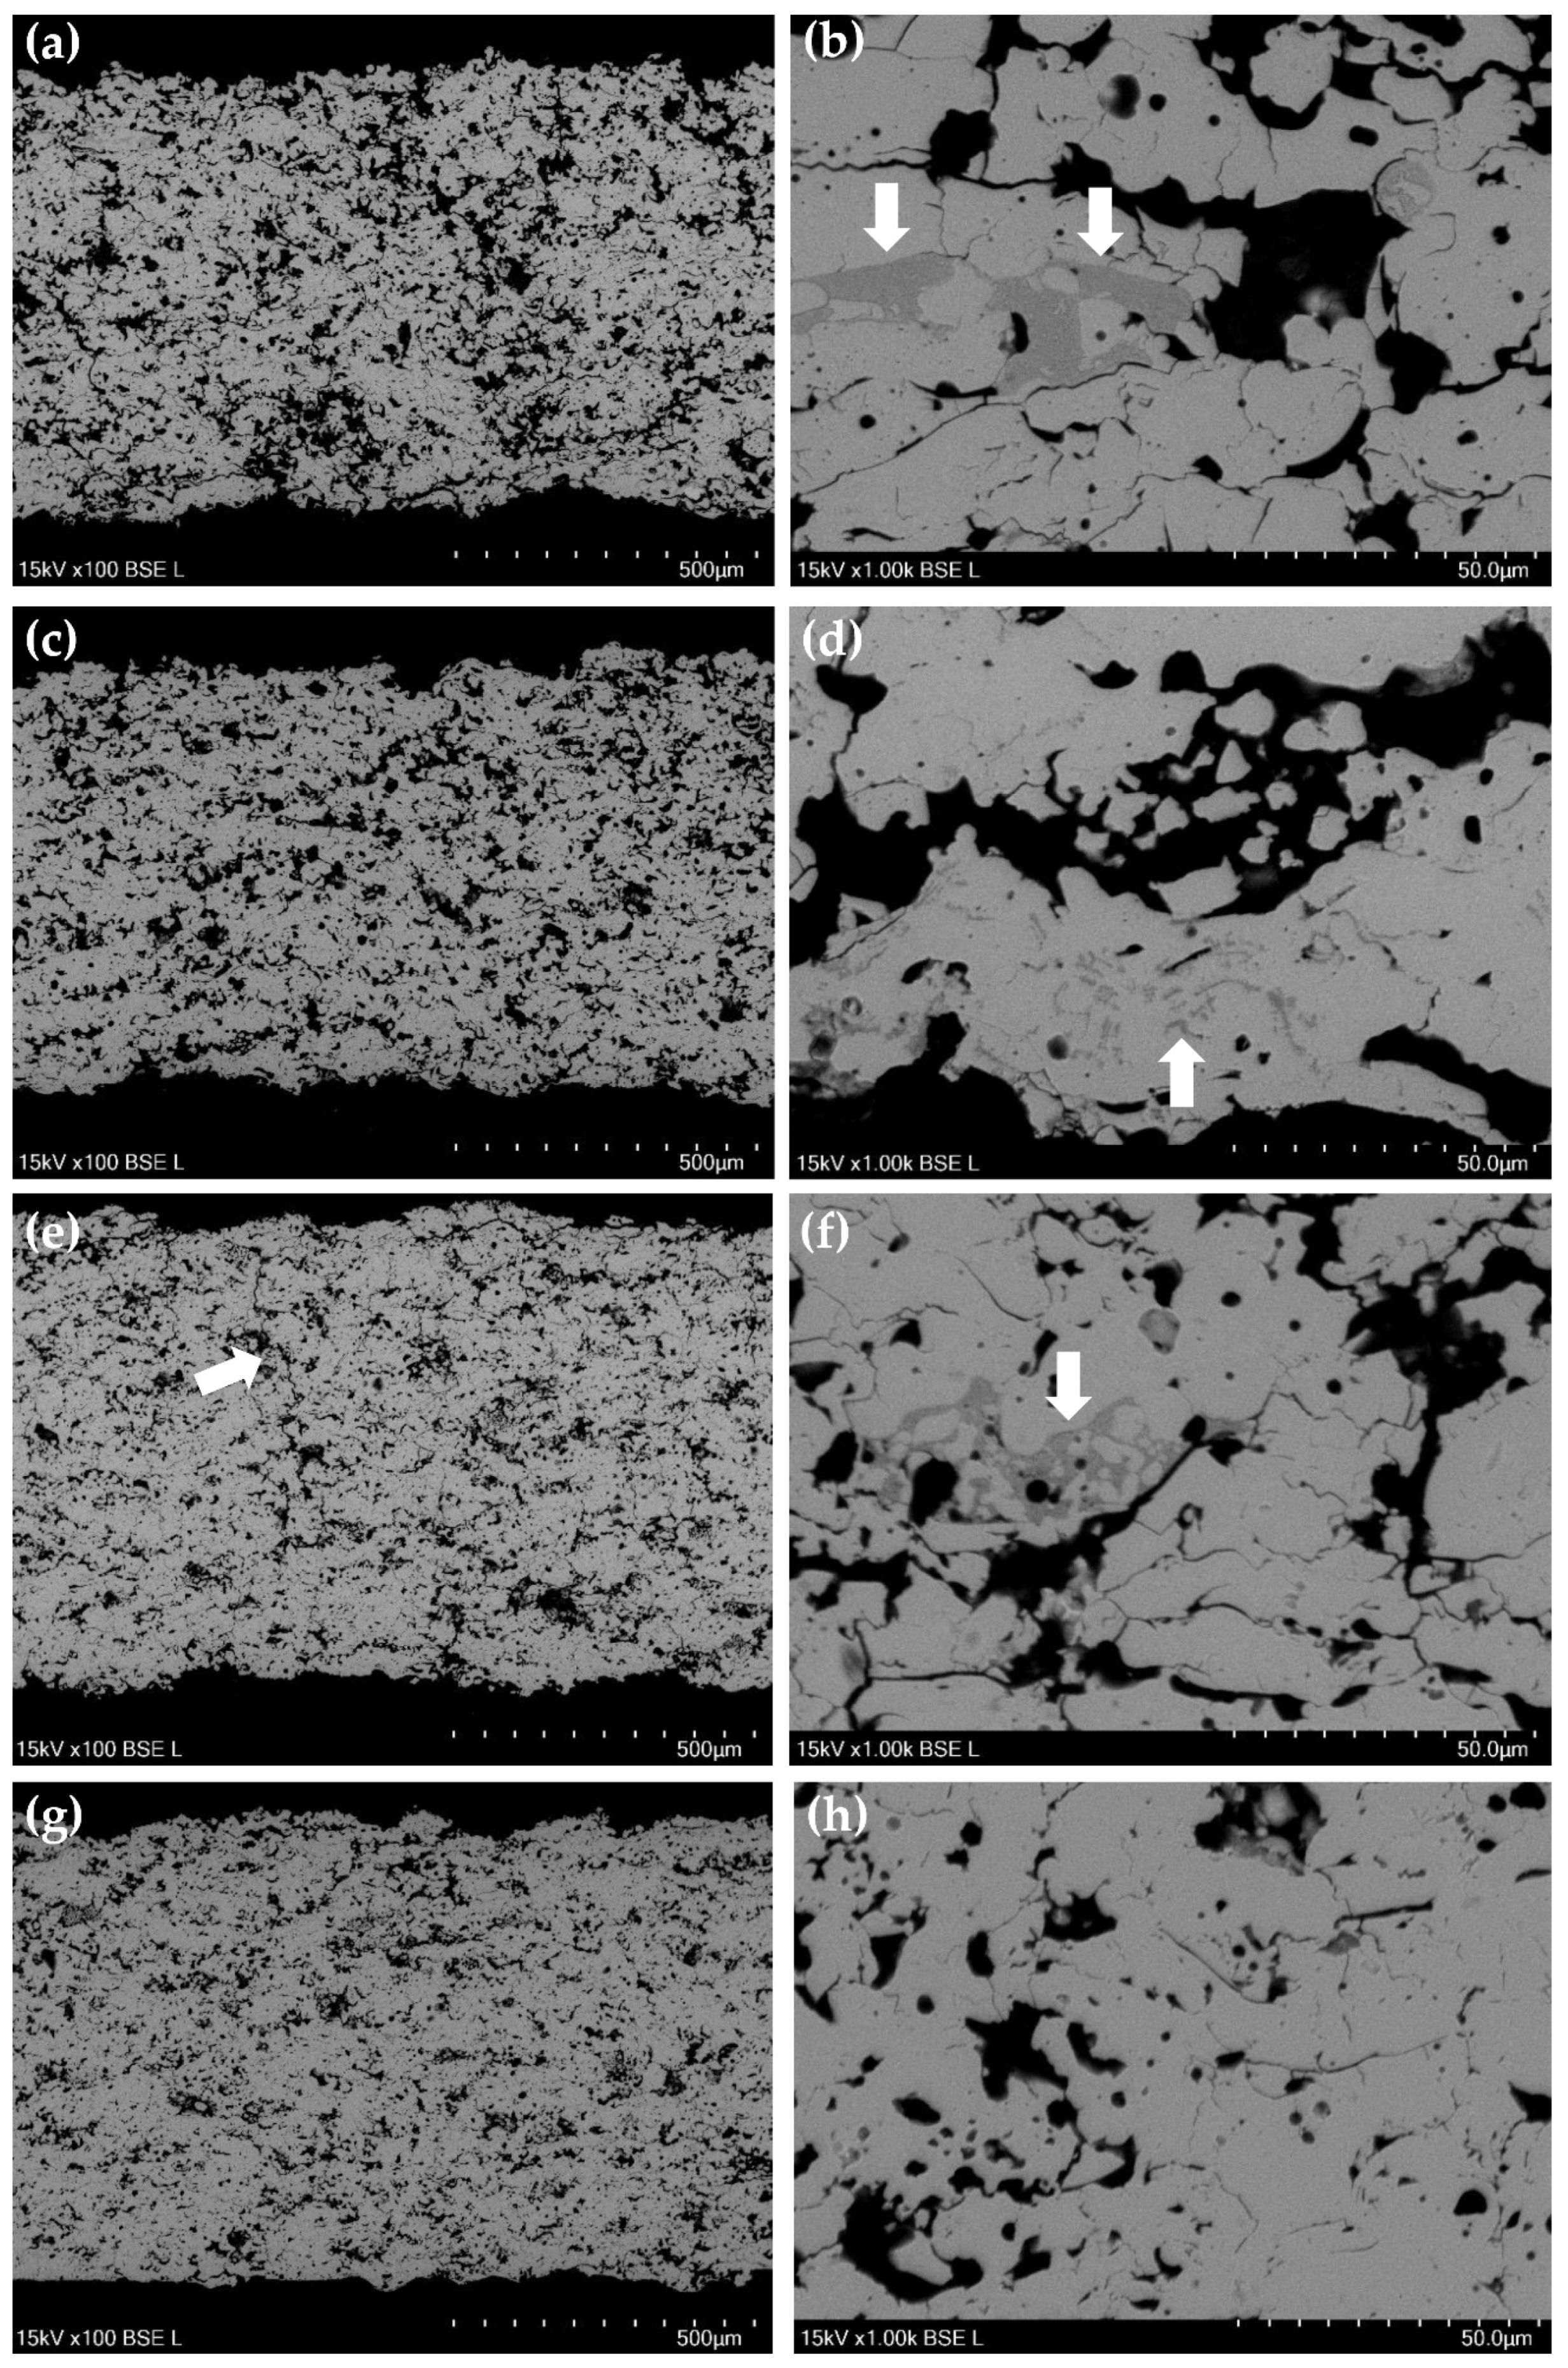
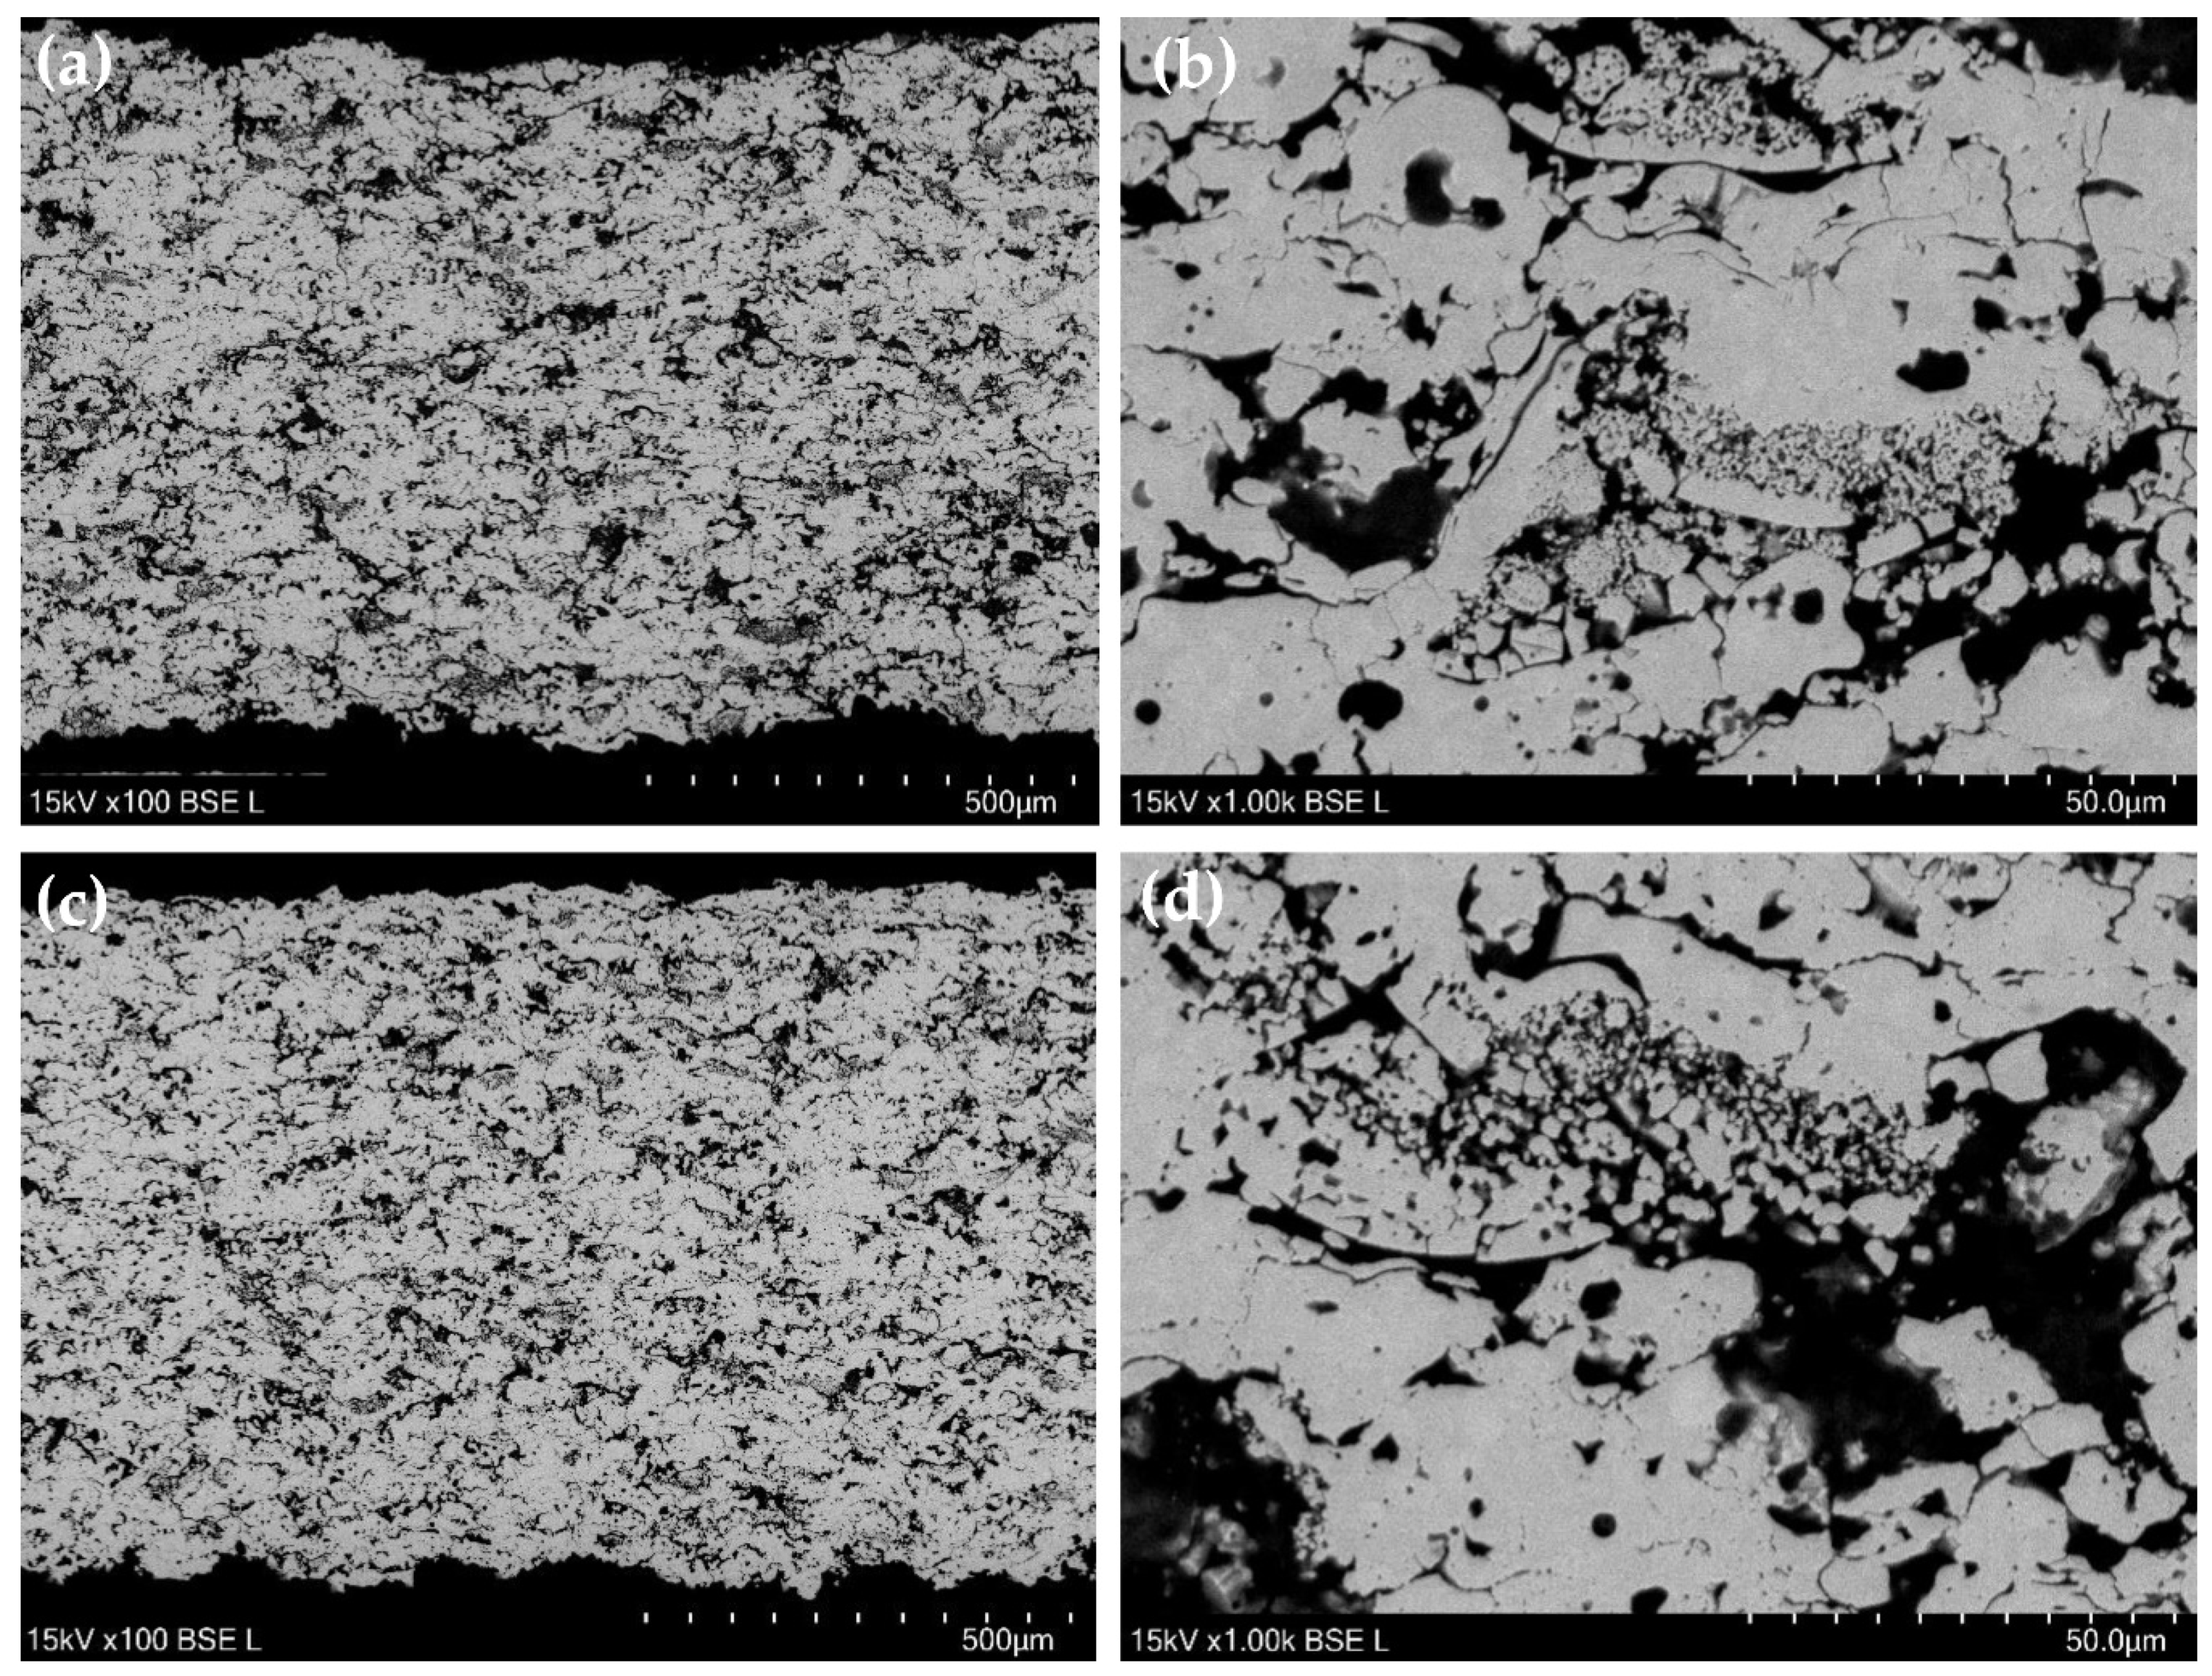
3.2. Coating Microstructures

The images of the as-produced coating micrographs can be seen in the following figures. Figure 2 shows the reference high-porosity coating manufactured with a cascade plasma torch and the commercial YSZ spray powder; this coating will be referred to as the Reference coating from this point forward. It can be observed that there is a large degree of globular porosity that is typical for an agglomerated and sintered spray powder coating. The white arrow in the high-magnification image on the right indicates a large splat deposit that contained some secondary phases that were rich in silica and alumina.
Figure 3 shows a cross section of the coating produced by spraying the commercial A & S powder using the 100HE system; for the remainder of the article this coating will be referred to as the Commercial Powder coating. Globular porosity is also present, as with the reference coating; however, the porosity level of the Commercial Powder coating appears to be significantly lower than that of the Reference coating. The cross section of the coating produced from the Low-Density powder is displayed in Figure 4. In comparison with the previous two coatings, the porosity is formed from a larger amount of distributed globular pores within the coating. There are also finely structured porosity zones from partially melted powder particles also present.

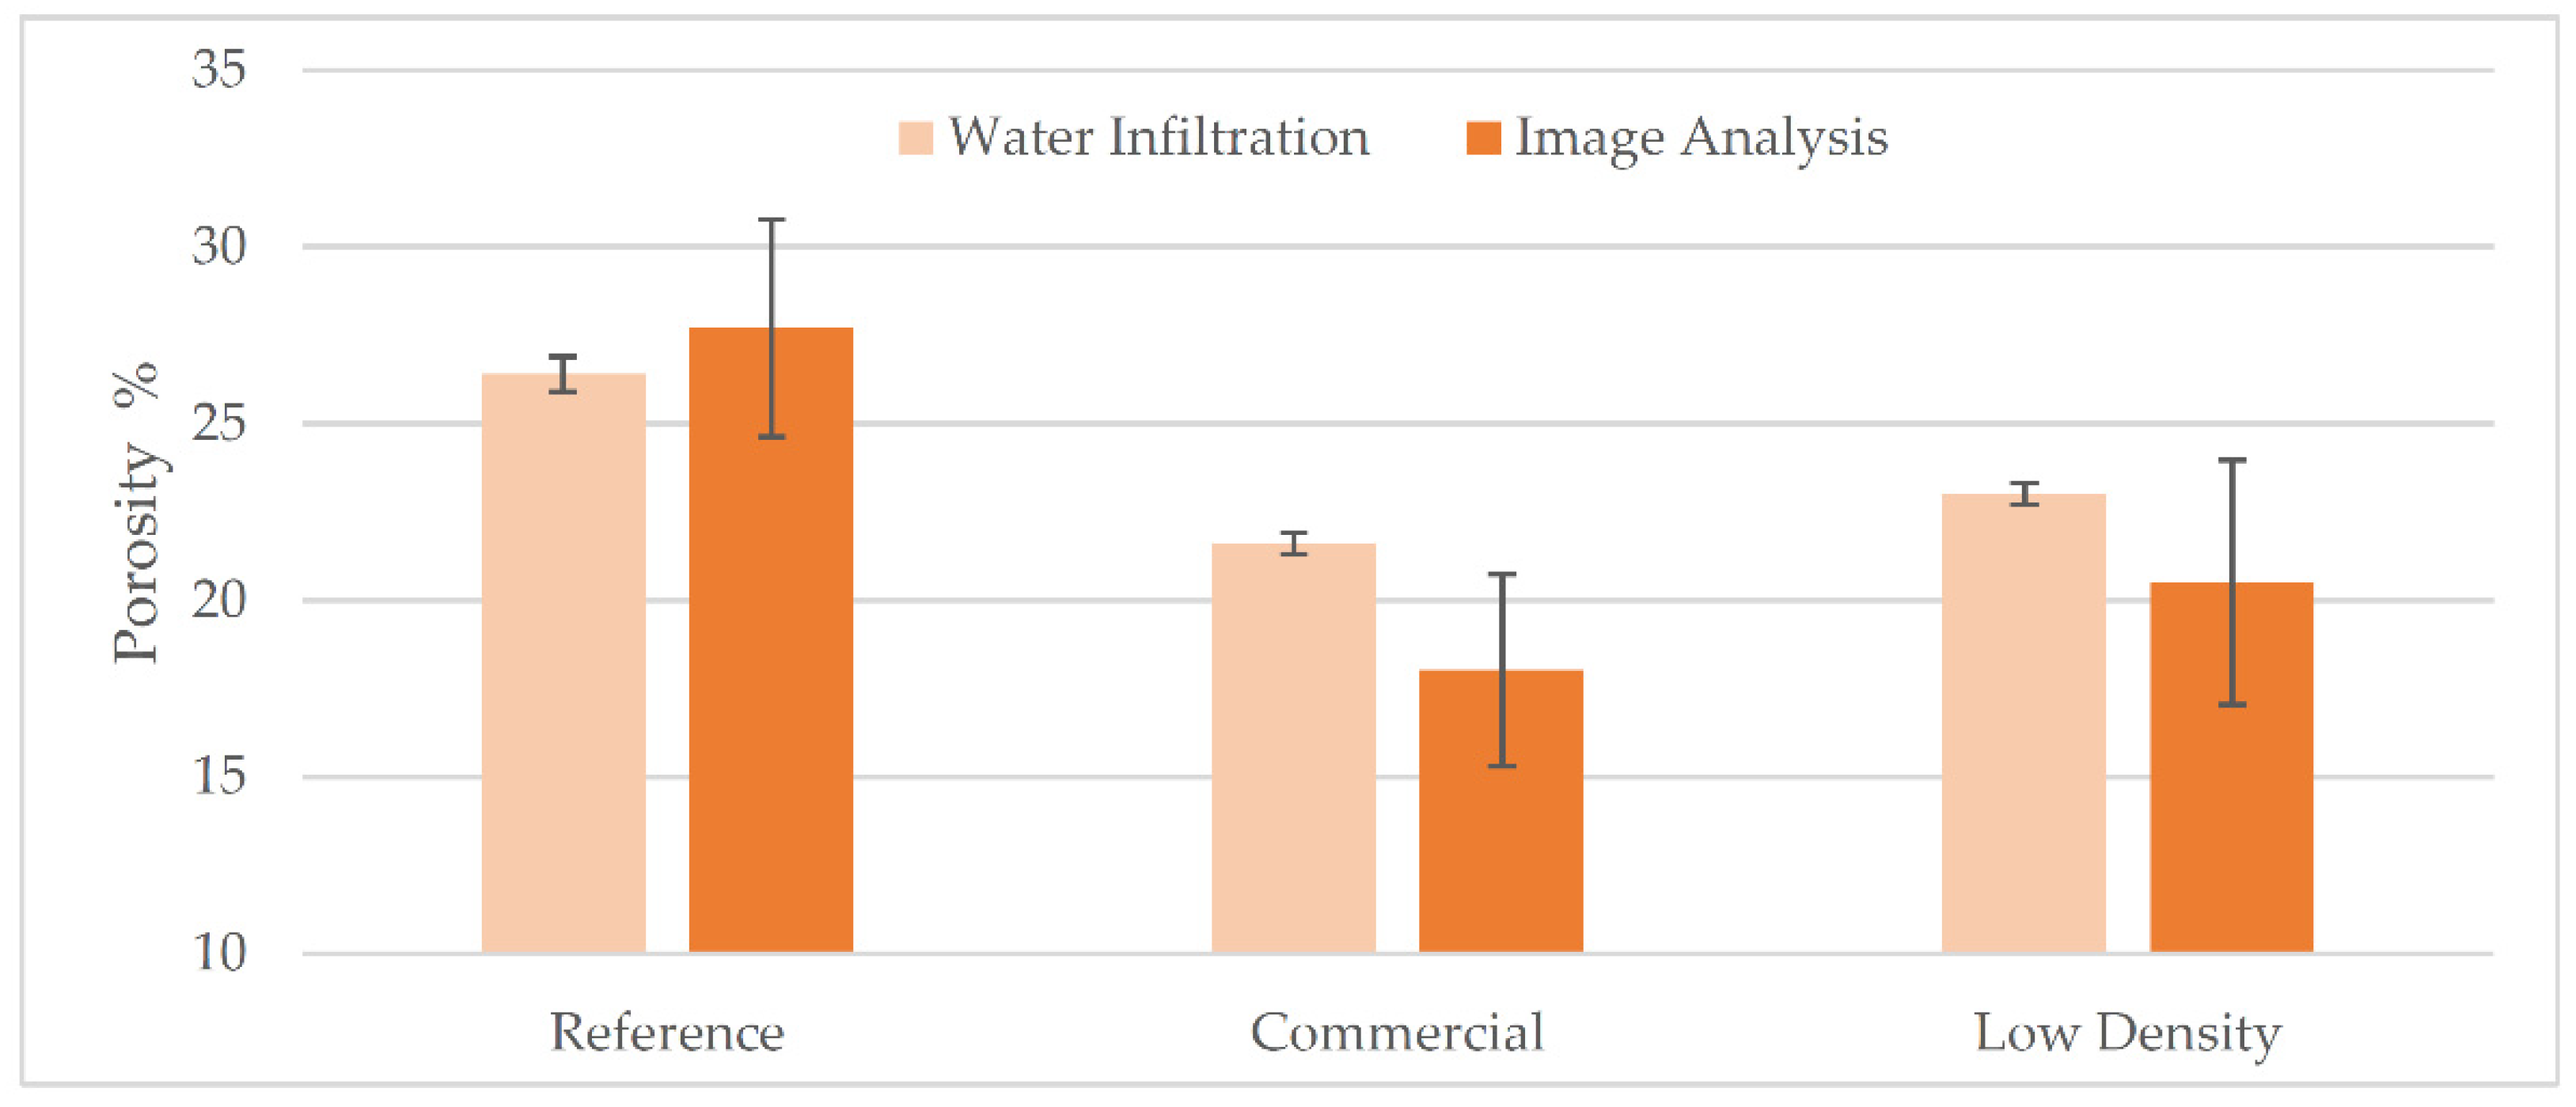
3.3. Porosity Evaluation

Combined porosity results from image analysis and from water infiltration for the as-produced coatings are shown in Figure 5. The Reference coatings from the cascade torch show the target level of approximately 26.4% porosity, which is near the middle of the target range of 20%–30%. For the coatings manufactured by the 100HE torch, the Commercial powder generates lower porosity levels than the reference coating at 21.6%. The coating manufactured from the Low-Density powder contained the second most porosity at 23%. Figure 5 shows that there is a high degree of variability in the image analysis results. This variability is because the evaluation images exhibited non-homogenous porosity areas, which reduced the consistency of the percent porosity calculation from image to image. This then leads to a larger standard deviation for the image analysis results. This in-homogeneity is more prevalent for high-porosity TBC coatings in comparison to conventional TBC coatings and can be partially offset by increasing the number of images used for the evaluation. This approach has diminishing improvements beyond 25 images as the time to collect the required images becomes excessive. The trend of the image analysis method to yield lower porosity percentages may be understood as caused by an inability to detect the smaller pores and cracks in the SEM micrographs. Water infiltration, in contrast to the image analysis evaluation, gave a lower degree of variability of results. This can be understood due to the method evaluating the entire volume of a sample rather than localized two-dimensional images used in image analysis. In this case, the results indicate an average measurement from six to eight samples.
The chart shown in Figure 6 shows further measurements made by the water infiltration technique on samples produced for thermal diffusivity evaluation. Along with the as-produced data stated in Figure 5, measurements for three additional exposure points are given; coating states are given—after 10 h at 1200 °C, after 400 h at 1200 °C, and after undergoing furnace cyclic fatigue exposure. Figure 6 shows that the porosity levels for the corresponding coating types in the as-produced, 10- and 400-h, heat-treated states display only minor variations; the porosity level can be said to be statistically the same. The cyclic fatigue results by contrast, show an increase in porosity level for all three coating types in comparison to all other conditions evaluated.

3.4. Adhesion Testing

For the Commercial Powder coating the adhesion strength was 15.3 MPa ± 0.8. For the low density powder the coating adhesion strength was 8.2 MPa ± 1.0. For both coating types the failure was at the interface between bond coat and topcoat. No adhesion data were made available for the reference coating. Smith et al. report that the lower adhesion acceptance limit for an industrial coating having ~25% porosity would be >5.5 MPa, with their own YSZ coating having and adhesion strength of 7.5 MPa [14]. A thinner (350 µm) coating with a conventional level of porosity (10%–15%) would be required to exceed 7.6 MPa [14]. Both coatings from this study would, therefore, exceed the adhesion strength requirements for a TBC in this case. Lee et al. reported adhesion strengths on the order ~8 MPa for coatings ~600 µm thick with porosities in the range 15%–20%, while thicker samples resulted in a drop in adhesion strength to ~5 MPa [39]. For further reference, 450 µm coatings produced from the same Low-Density experimental powder with a porosity of 10%–15%, typically give adhesion strengths in the range 22–25 MPa. This result would suggest that the difference in adhesion strength reported above for this study is related to the porosity level of the coatings since they are of equivalent thickness. The samples produced with the experimental Low-Density powder have a lower adhesion strength than those produced from the commercial powder due to the former’s higher porosity level. It should be noted, however, that other researchers have seen that TBC adhesion strength differences do not necessarily correlate to performance differences in furnace cycle testing [40].

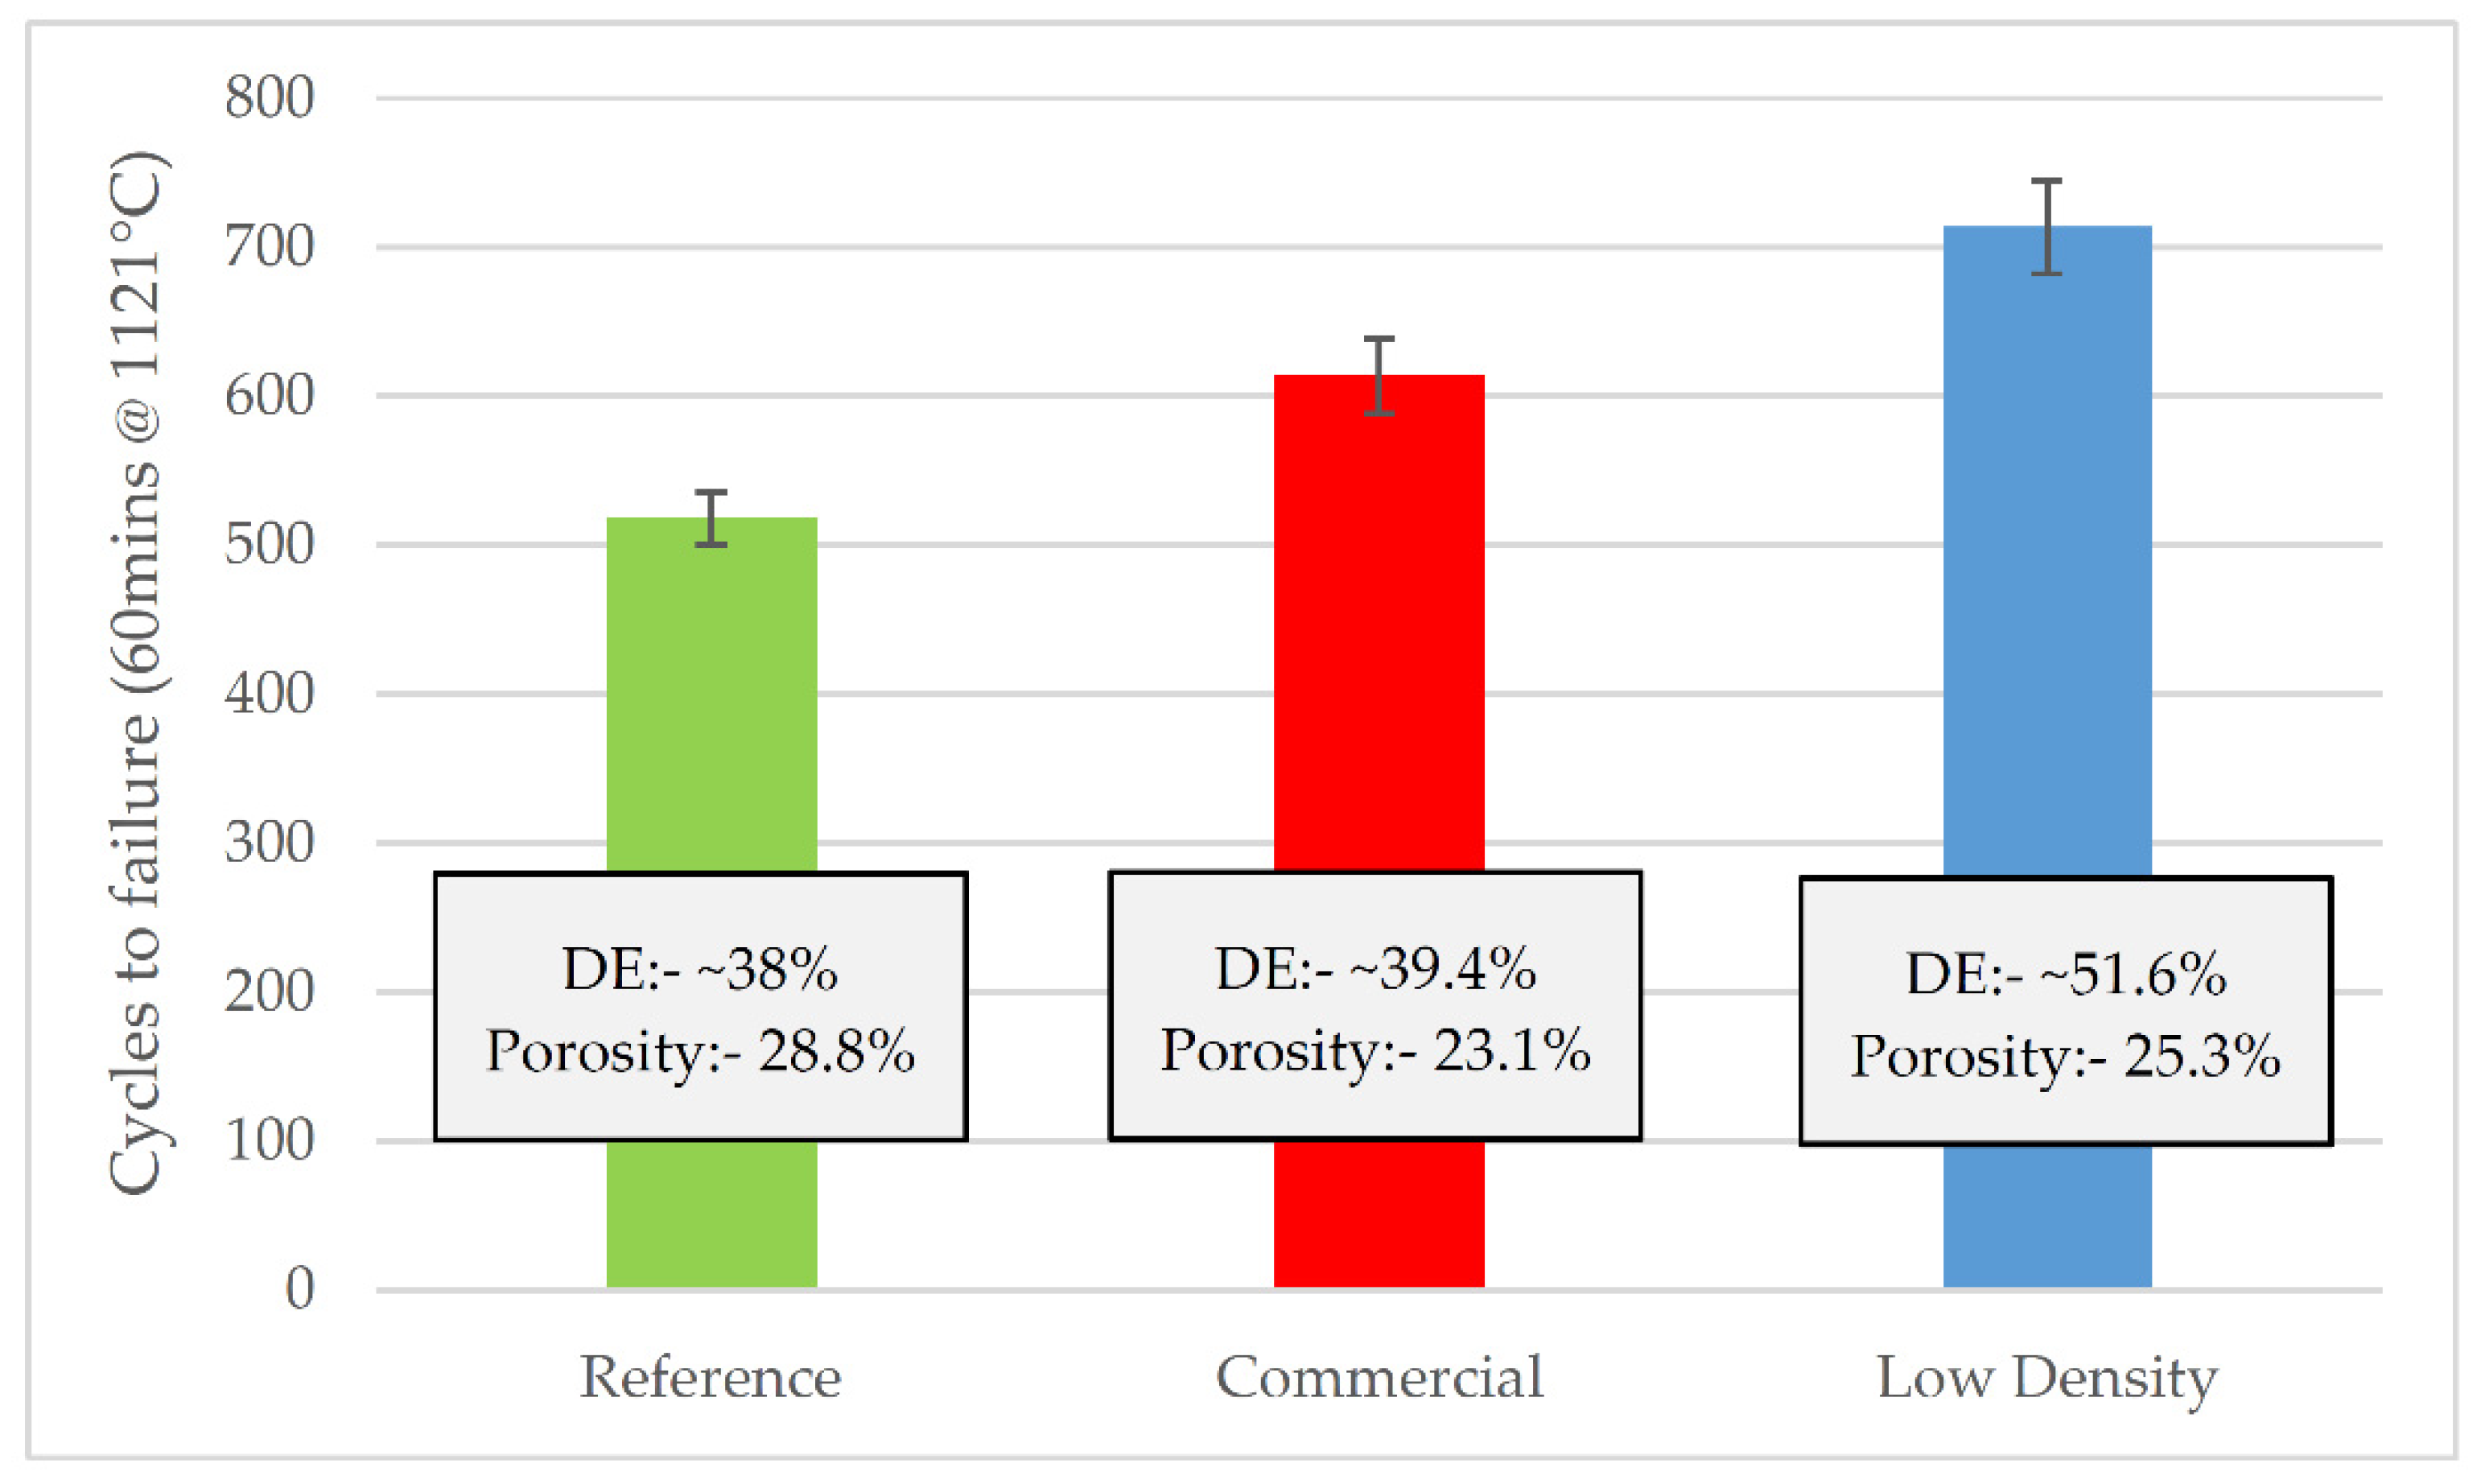
3.5. Furnace Cyclic Fatigue Lifetime

Results for the furnace cyclic fatigue (FCT) exposure are shown in Figure 7. It can be noted that both the coatings produced in this study have outperformed the reference high-porosity coating in terms of lifetime, with the Commercial powder coating exceeding the Reference coating by 18% and the Low-Density powder coating exceeding the reference by 38%. It can be argued that the lifetime of the coatings in FCT is dominated by the oxidation rate of the bond coat in high-temperature conditions, with the ceramic topcoat having the minor role in influencing test lifetime [41,42]. In this study, the chemical composition of the bond coats for all three coating types are close to identical, though they were produced using different APS equipment. Potentially, the bond coat of the Reference coating has a higher oxidation rate, resulting in earlier failure in comparison to the other coating types. For the two YSZ coatings produced with the 100HE spray system, a clearer comparison can be drawn as they are both were produced with identical bond coats from the same manufacturing run. In this case, the behavior of the ceramic topcoat will determine the difference in FCT performance. It could be expected that the increased lifetime of the Low-Density coating versus the Commercial coating is due to the former’s higher porosity level. As discussed previously, higher porosity levels have been shown to allow greater stress relaxation during cycling, leading to longer FCT lifetime [11,16]. The failed coatings were examined using x-ray diffraction to check for formation of detrimental monoclinic phase within the coatings due to high-temperature exposure. However, in all three coating types, monoclinic phase content was detected in the range of 1% by weight and within the accuracy of the detection system. Phase segregation may, therefore, be ruled out as a contributing factor to coating failure. In terms of ultimate coating lifetime, it should be stated that the FCT evaluation is a form of accelerated test, with the evaluation temperature well above the approximate 950 °C maximum bond coat temperature expected in service [17]. Consequently, the total lifetime is reduced relative to the expected service life of ~24,000 h.
It is generally difficult to compare furnace cyclic lifetime of thermal barrier coatings reported by published studies simply due to the variety of equipment used, cycle times, temperatures, substrate types, bond coat types and ceramic coating parameters that are investigated. All these variables will influence the evaluation of sample lifetime. Patterson et al. reported that the average lifetime for a TBC at 1121 °C was 527 cycles, for a total hot exposure time of 351 h [43]. However, the cycle used in this case was 50 min long rather than the 60 min used in this study. The coatings were thinner at around 600 µm and porosity was not stated. By comparison, all coatings in this study demonstrated longer cyclic lifetime and longer hot hours exposure time. It is, however, difficult to draw conclusions given the large number of differences between the test samples and test procedure. Scrivani et al. tested coatings with high porosity levels (21%–29%) at a test temperature of 1150 °C [11]. In this case, the coatings are required to survive 250 cycles, with most failing in the region of 300 to 450 cycles. Again, the coatings in this study demonstrate higher lifetimes; however, the difference in test temperature, sample geometry and coating thickness do not allow a clear comparison to be made. While further examples could be discussed, the same issues in making direct comparisons remain. Currently, there is no standardized test procedure that allows a simple comparison to be made between studies.

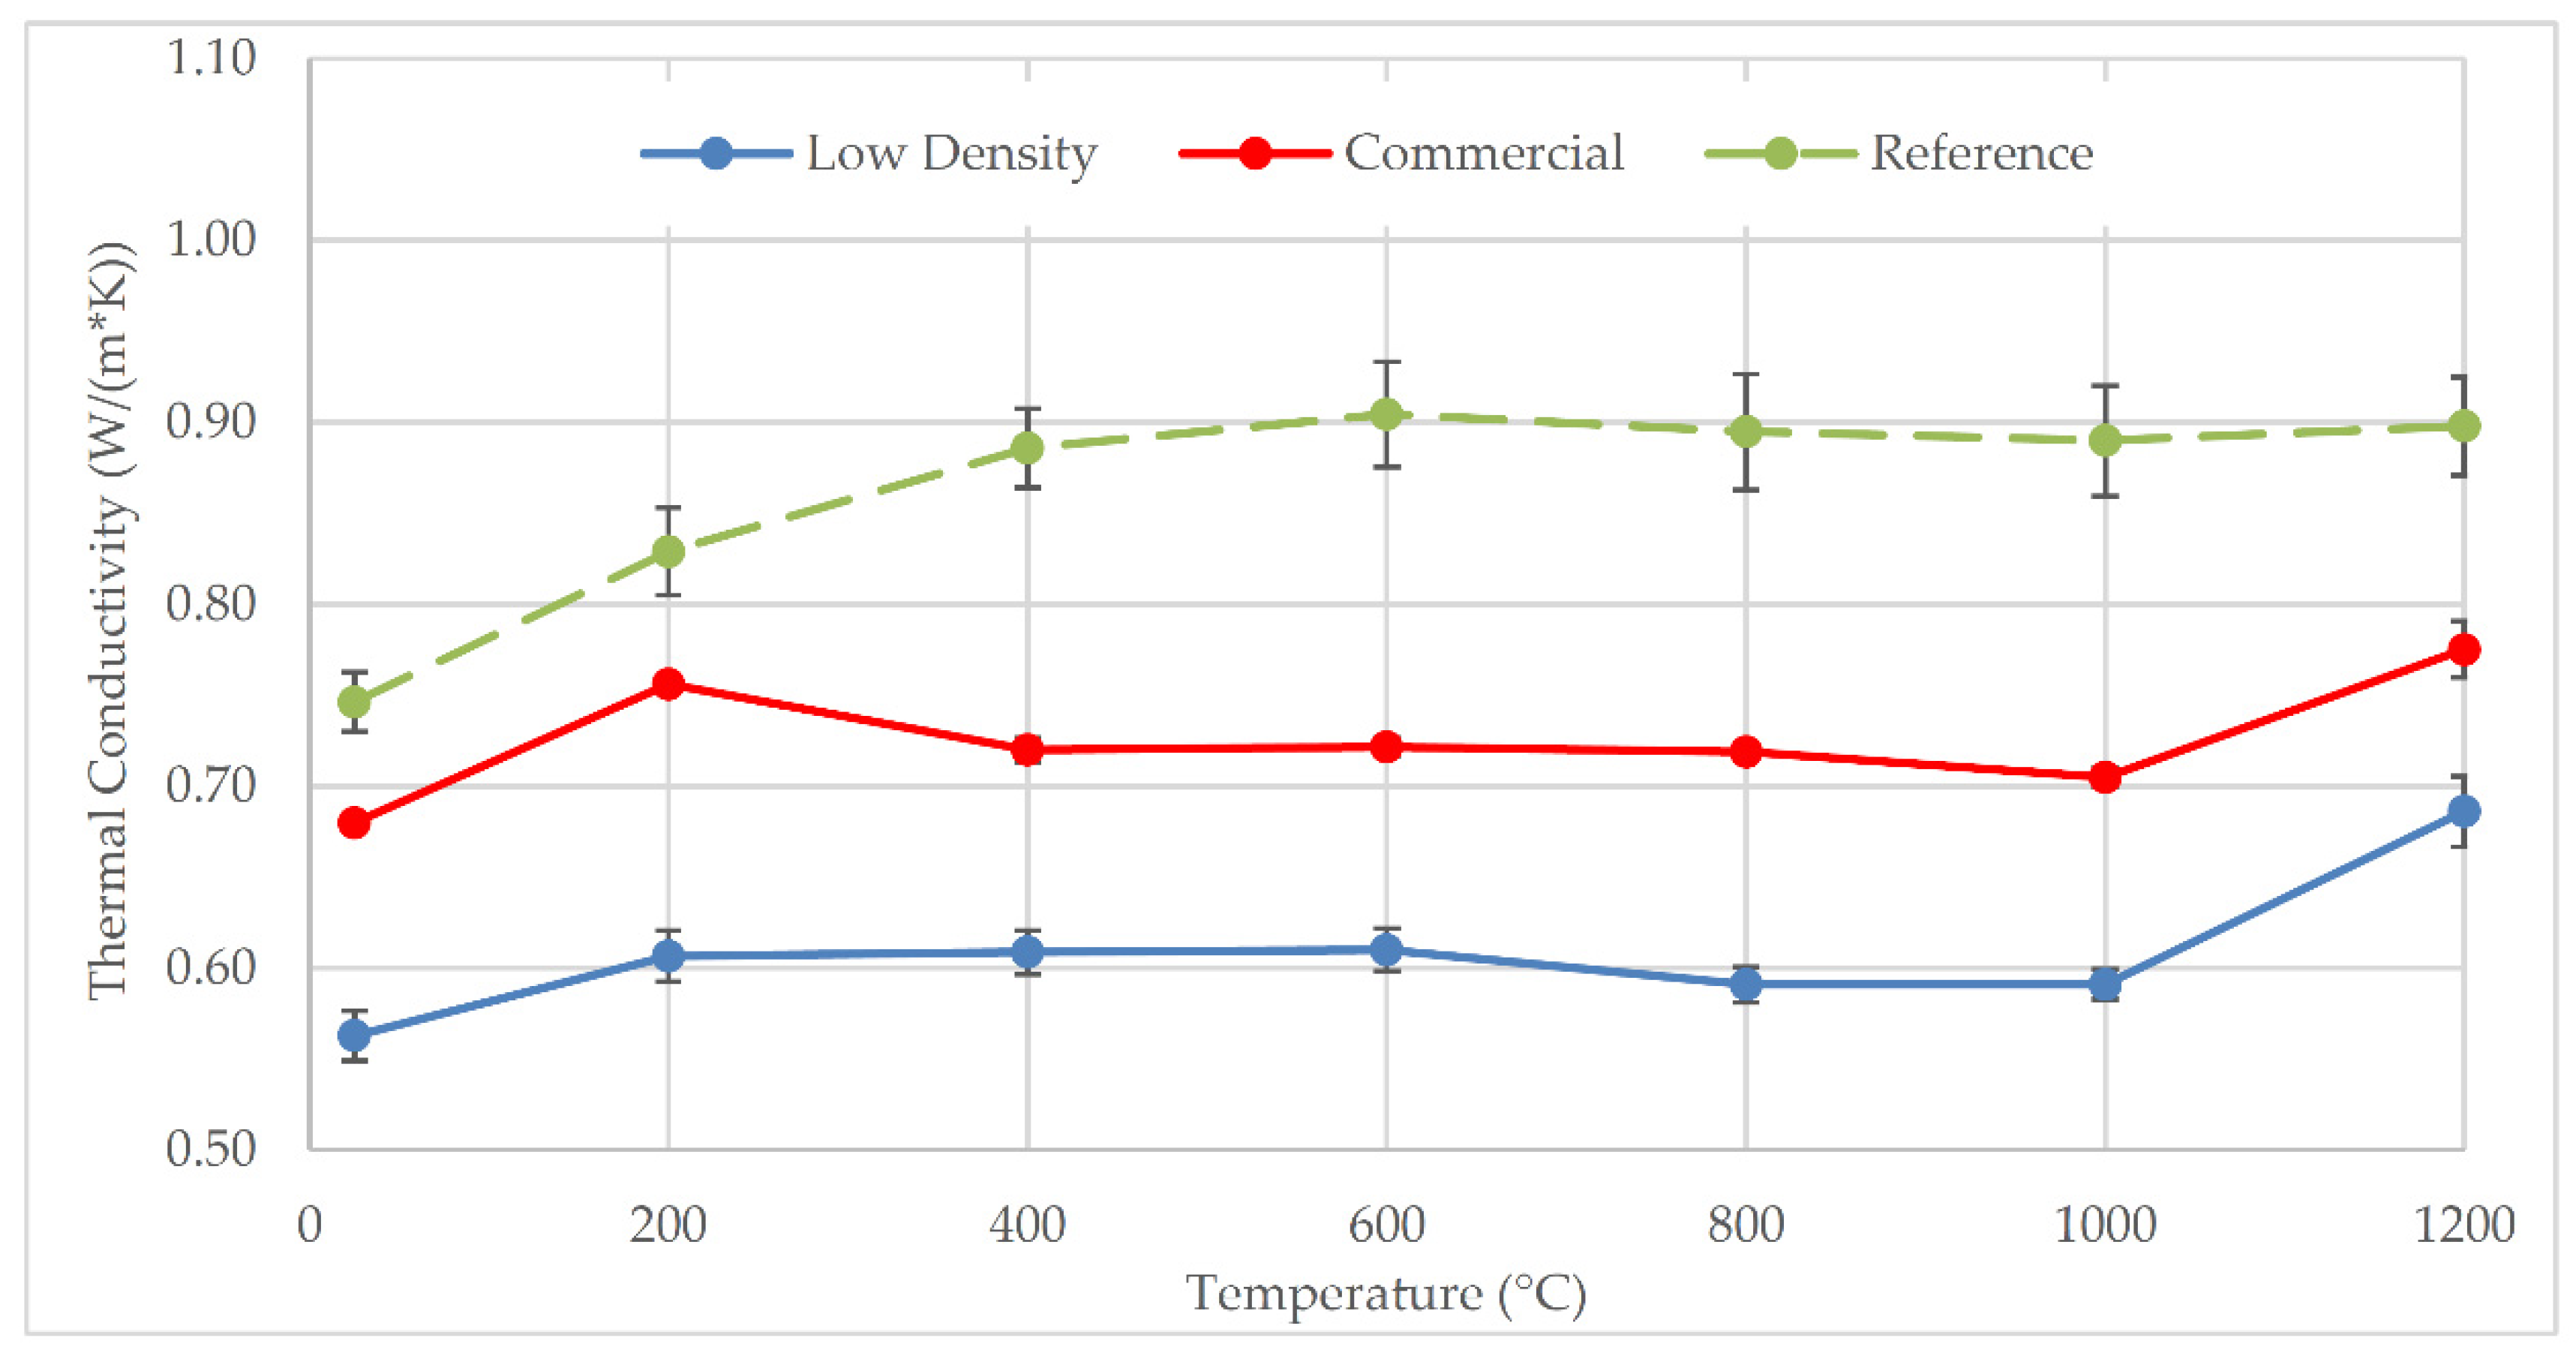
3.6. Thermal Conductivity Evaluation

Thermal conductivity results can be broken down into as-produced coatings, heat-treated coatings, long-term heat treatment and FCT coatings. Measurements made on the as produced coatings are shown in the Figure 8. The Reference coating exhibits unusual behavior in that its thermal conductivity increases with temperature up to 600 °C before plateauing. Its notable also that the reference coating shows a high degree of measurement scatter for the four measured samples at each temperature measurement point. For the Commercial and Low-Density coatings, the plot of thermal conductivity follows a flatter profile. There is a more dramatic increase in thermal conductivity from 1000 to 1200 °C for these two coating types that is due to the coatings sintering in situ during the measurement. As-produced coatings contain a large amount of active internal surface in the form of cracks and lamellar interfaces. When the TBC experiences high temperatures in excess of 1000 °C, these active surfaces undergo what is known as first stage sintering [36]. This has the effect of changing the microstructure of the coating through healing of splat interfaces and cracks and, therefore, increasing its thermal conductivity. While the evaluation of as-produced coating thermal conductivity is very typically presented in research publications, it has a major drawback since as-sprayed thermal conductivity measurements are not representative of the coating thermal conductivity of the coating in service as the evaluation provides transient behavior during first thermal exposure.
Figure 9 displays the coatings measured after a 10-h exposure at 1200 °C. For all three coating types, the thermal conductivity has increased across the measured temperature range in comparison to Figure 8. The measurements no longer show an increase in thermal conductivity above 1000 °C as seen in the as-produced samples, with a flat or slightly decreasing thermal conductivity with increased temperature. While the Low-Density powder coating still has the lowest thermal conductivity of the three coatings, the coating produced from the Commercial powder has seen its thermal conductivity increase significantly by 20%–30% and is now within the same range as the Reference industrial coating.
The long-term isothermal heat treatment experiments were selected in order to expose the TBCs to high temperatures expected during operation to understand the susceptibility to sintering of the coatings. A summary of the thermal conductivity of coatings measured at 1200 °C plotted against isothermal heat treatment time is displayed in Figure 10. It can be observed that the high-temperature results show a rapid increase in thermal conductivity over the first 25–50-h exposure followed by a slower increase in conductivity with time out to 400 h. This can be understood from the two stage sintering process whereby during the initial exposures fine cracks and delaminations with high amounts of surface area sinter together, forming new pathways for heat transfer to occur [36,44]. Once the first stage sintering is completed after the first few hours, second stage sintering proceeds at a slower rate. Further details of thermal conductivity after heat treatment or each coating type can be found in the supplementary information section (Figure S1–S3). For the coatings produced with the commercial powder, it can be observed in Figure 10, that the lower porosity Commercial coating increases in thermal conductivity over the higher porosity Reference coating after 10 h of high-temperature isothermal exposure. As noted in Figure 6, the Commercial coating displayed a porosity level of 21.5% in comparison to the Reference coating at 25.7%. After 400 h of exposure and the associated influence of coating sintering, the difference between the two coatings thermal conductivity is in the range 0.14 W/m·K. The Reference coating, therefore, has only a 10% reduction in thermal conductivity, despite having 20% higher porosity level. The Low-Density coating shows the lowest thermal conductivity of the coatings evaluated across all exposure times measured. While the porosity level of this coating is lower than the Reference coating at 23.5%, after 400 h exposure it has 12% lower thermal conductivity.
Chi et al. have investigated the thermal properties of various porous TBC systems in their as-produced state, after isothermal heat treatment and most significantly, after thermal cycling [45]. In isothermal exposure for 225 h, a 40%–50% increase in thermal conductivity was observed at 1100 °C for coatings with porosity greater than 20% by volume. In this study, the increase on thermal conductivity at 1200 °C showed a similar level of thermal conductivity increase (20%–50%) after 200 h heat treatment. The absolute level of thermal conductivity, however, were lower than reported by Chi et al.
While the result of changes in microstructure are detected in the form of higher measured thermal diffusivity and, therefore, conductivity, large changes in porosity are more or less undetectable, as observed in the porosity measurements in Figure 6. This suggests that at the temperatures used here, sintering does not result in large scale changes in pore content but microstructural changes that result in increased thermal conductivity. Differences in sintering degree may be partially understood from the amount of impurities within the starting feedstock material. As can be observed in Table 1, the commercially available powder used for both the Reference and Commercial powder coatings contains higher levels of alumina and silica relative to the experimental Low-Density powder. The impact of impurity content on thermal barrier coating performance has been studied by multiple research groups [46,47,48,49,50]. Vassen et al. demonstrated that in particular, silica and alumina are detrimental for accelerating sintering of the microstructure [48]. However, the impact of these purity differences is reported to be relatively small, leading to some increases in coating shrinkage rate or conductivity [48,51]. The Low-Density coating displays a lower thermal conductivity and superior level of sintering resistance over the two other coatings in this study that may be understood to be a combination of lower impurity levels and initial microstructure.
Curry and Donoghue investigated the effect of heat treatment time on the room temperature thermal conductivity of high-porosity TBCs [12]. In this case, the maximum heat treatment time was only to 200 h at 1150 °C, a lower total time and temperature than used in this study. In comparison with that earlier work, the results in this study show the same trend of increasing thermal conductivity with heat treatment time. It can also be noted that coatings with lower initial porosity level experienced the largest increase in thermal conductivity—the same trend observed in this current study. However, the coatings in this study achieve lower absolute room temperature thermal conductivity values, with all coatings below the 1.2 W/m·K level of the 25% porosity coatings investigated by Curry and Donoghue [12]. Differences in these absolute thermal conductivity values, despite similar levels of porosity, may be related to differences in measurement procedures used in each study. While the current study performed measurements on free standing samples, the former study evaluated a multi-layer TBC sample.
The limitation of the Furnace Cycling Fatigue testing is that during engine operation, the TBC does not experience isothermal temperature conditions but rather is subjected to a thermal gradient conditions on a cyclic basis. While such simulated conditions are difficult to achieve in the lab, the furnace cycling fatigue test does allow cyclic exposure at relevant temperatures for constrained coating samples (still attached to the substrate). Figure 11, therefore, shows the thermal conductivity of the coatings after failure in the FCT test. In this case, each coating has experienced a different time at 1121 °C due to the differing time to failure of the coatings in the test (see Figure 7). At the start of each cycle, approximately 7 min are needed for the sample to reach the test temperature, resulting in a dwell time per cycle of 53 min at high temperature. Based on this, the coatings can be understood to have seen 457 h (518 cycles) for the Reference coating, 541 h (613 cycles) for the Commercial powder coating and 630 h (713 cycles) at high temperature for the Low-Density coating. Despite the long exposure times, it can be observed that relative to the long-term isothermal samples in Figure 8, the thermal conductivity is lower for all coatings tested. This can be understood to be due to two factors. Firstly, the exposure temperature is 79 °C lower than that of the long-term heat treatment samples. As sintering is a kinetic process, lower temperature will result in slower sintering rate despite the longer exposure time. Secondly, the thermal cycling of the samples is likely to create cracks in the coating due to the stress imposed during the rapid forced air cooling. This crack generation may undo some of the interface sintering that occurs while the coating is at temperature, thus partially retarding the sintering effect. It should be pointed out that a direct comparison between coatings in Figure 11 should not be made as the samples have seen different exposure times. For example, the Low-Density coating having been exposed for on average 173 additional hours in comparison to the Reference coating.
The thermal conductivity results for cycling exposure samples reported by Chi et al. are arguably more significant as thermal properties are rarely evaluated after such treatments [45]. Cyclic exposure samples displayed a smaller increase in thermal conductivity after exposure compared to samples that were isothermally exposed, having an increase of 15%–20% at 1100 °C. However, cycling exposure was performed for around 10 h total exposure time at 1100 °C and specifically not until coating failure. The time for sintering should, therefore, be limited in comparison to the results provided here, where exposure times were for hundreds of hours. However, the extended times (cycles) do not result in increased thermal conductivity in practice. This may be related to increased cycling damage counteracting the longer thermal exposure time. As a general observation, compared to coatings evaluated for various high-temperature exposures, it can be noted that that as-produced measurements give neither a clear picture of the thermal conductivity after exposure to a relevant service temperature nor the ranking of the coatings after isothermal or cyclic exposure.
As a final observation point, the difference in sintering degree in cycling testing may also be able to say more about the stability of the coatings in the actual operating environment. In the real engine, the TBC would also be subjected to a thermal gradient across the coating thickness that would result in differential sintering rates and thermal cycling that drives damage that may reverse some of the sintering impact [52]. In cyclic laser rig exposure, Lima reported no notable change in temperature differential across tested coatings after 24 h of cyclic thermal gradient exposure, indicating the negligible effect of sintering [3]. While results presented here demonstrate the sintering effect is also reduced with cyclic exposure in comparison with isothermal treatment, its likely any increase in thermal conductivity for FCT samples is masked by cycling damage, as discussed previously. Previous studies by Lima et al. and Lima and Marple demonstrate that longer total exposures in simulated thermal gradient testing are required to induce sintering related effects [53,54].

3.7. Microstructures after Thermal Exposure

Figure 12 displays SEM micrographs at low (left) and high (Right) magnification for the Reference and Commercial coatings after FCT testing and long-term exposure (400 h at 1200 °C). Samples that were previously used for thermal diffusivity testing were utilized for the microstructure evaluation once testing was completed and were prepared using standard metallographic procedures. It can be observed that the coatings have undergone some degree of sintering with smaller cracks and delaminations that were present in the as sprayed microstructure (see Figure 2, Figure 3 and Figure 4) now showing evidence of bridging and healing. Both the Reference coating in Figure 12a and Commercial coating in Figure 12e appear to be more porous after furnace cycling exposure than the long-term heat treatment samples in Figure 12c,g, respectively. This observation correlates to the measured differences in porosity shown in Figure 6 as well as the difference in thermal properties. As discussed previously, cyclic testing may retard or undo the effects of sintering by driving cracking of the coating during each cycles cooling phase. A vertical crack can be observed in the Commercial coating in Figure 12e marked with an arrow. No notable cracking was observed in the other two coatings studied.
It can be observed in the high-magnification images of both the Commercial and Reference coating, the presence of a darker secondary phase within the YSZ matrix highlighted by arrows (Figure 12b,f). EDX evaluation of these zones showed a material that is rich in silica and alumina. In the as-sprayed microstructure, the presence of these secondary oxides was detected; however, in the samples that were thermally cycled at 1121 °C, these oxides appear to have coalesced. For the long-term heat treatment, the presence of these secondary oxides was more difficult to detect, with the oxides distributed along former crack or splat boundaries as seen in Figure 12d. In looking at the impurity levels in the initial powder and the study of Vassen et al. [48], it could be concluded that the content of silica and alumina in the starting powder would lead to a coating that would experience notable sintering at high temperature. As noted by other researchers, the presence of localized impurities can lead to low viscosity glassy phases that accelerate sintering [46,50]. In the coatings presented here, the longer-term heat treatment at 1200 °C is likely to allow the observed oxide phase to disperse within the structure at cracks and delamination boundaries. The outcome of this appears to be localized densification that would account for the larger increase in thermal conductivity of the coatings manufactured from this starting powder.
Figure 13 gives an overview of the microstructures for the Low-Density coatings after FCT testing (Figure 13a,b) and after 400 h heat treatment at 1200 °C (Figure 13c,d). As with the previous microstructures in Figure 12, the coating that has undergone FCT testing in (a) appears to have a higher level of porosity to the sample exposed for long term heat treatment in (c). Comparing the high-magnification images in Figure 13b,d, it is clear that the fine-scale porosity generated by the initial spray powder is still present in both cases. In Figure 13b the pores have become rounded but remain small. However, in the long-term heat treatment sample the pores have coalesced to a greater extent. Neither coating shows the presence of any secondary phases that may further accelerate sintering, though this could be expected due to low levels of alumina and silica contaminants in the starting powder. The thermal conductivity results seen in Figure 10 may be understood from the microstructural changes observed in Figure 12 and Figure 13. The Low-Density coating shows a lower impact of sintering on the coating microstructure relative to the other two coating types. As sintering proceeds more slowly in the case of the Low-Density coating, a greater proportion of the initial microstructural features are retained with heat treatment time, helping to maintain a low thermal conductivity.

3.8. Coating Economics

For the use of a coating on a real component, the economics of the process must be considered along with the coating performance requirements. Feuerstein et al. provided a normalized cost comparison between various TBC coating types [2]. A previous coating economics evaluation was made by Lima et al. using the same low density powder as used in this study [22]. The previously published work will act as a guideline for coating economics evaluation. The focus in this case will be more specifically directed at a combustor liner thermal barrier coating as the Reference industrial coating evaluated is utilized on an IGT combustion liner currently in production. In order to compare the coatings in this study, an idealized case of coating a large industrial gas turbine component can be utilized. The assumption is that the component to be coated is a large annular combustor liner for an industrial gas turbine that has a diameter of 2 m and a height of 1 m, giving an area to be coated of approximately 6.284 m2. The coating is required to be approximately 800 µm thick.
As discussed by Feuerstein et al., the costs for serial production can be broken down into process costs, materials, labor, indirect costs and machine amortization [2]. Some simplifications can be made at this stage as the comparison is between thermal spray equipment that could be assumed to have roughly the same investment costs, therefore for simplicity, amortization will be neglected. Similarly, the indirect costs (tooling, masking, etc.) will be ignored since this can be assumed identical for the same component being coated. Gas costs are somewhat difficult to compare as there is a significant cost reduction when gas is provided in large tank installations in comparison to single bottle packs. Furthermore, the 100HE plasma system is able to operate on standard industrial quality gasses rather than high purity gasses often recommended for legacy plasma systems. For the sake of this comparison, it will be assumed that the cascade system used to produce the reference coating can also operate on the same gas quality.
Table 4 displays the comparison of calculated manufacturing costs for one large annular combustor liner for the three coatings investigated in this study. It can be observed that the coatings manufactured using the commercial YSZ powder with either the cascade plasma system (reference) and 100HE are comparable in total cost. The commercial type coating from the 100HE has a slight advantage in lower time to completion and lower powder usage. The costs are higher for electricity and gas usage owing to the higher operating power level (95 kW versus ~50 kW) and higher gas flow rates inherent to the torch design. With the Low-Density powder, a larger advantage is generated relative to the Reference coating process where there is a 20% processing time saving, 17% less powder used and an overall cost reduction of 16%. What is notable in all cases presented is that the costs of the YSZ powder used are dominant in the overall processing costs, accounting for over 90% of the total. This fact shows that the focus of Lima et al. on improving the coating process efficiency can bring the largest improvement in environmental impact by reducing waste as well as reduction in overall cost [22].
Conventionally, TBC coating specifications are written to address specific thickness and porosity level requirements [14,15]. These factors essentially set the desired thermal resistance of the coating system. It also allows the coating to be manufactured based on initial microstructural condition, using methods that are relatively easy to use and available in a coating shop. However, the conventional approach does not consider the differences in coating performance when exposed to high temperature for longer timeframes, as demonstrated in this and other studies. An alternative approach to specify a TBC would be to set the coating requirements according to coating thermal properties after high-temperature exposure and allow other variables like coating thickness and porosity to vary in order to meet these goals. This approach requires that the baseline coating performance is known. In the absence of original design data, this can be achieved using industrial benchmark data, in this case with the Reference coating system. Using the formula of Helminiak et al., specific thermal resistance needed in a reference system can be calculated utilizing coating thickness and thermal conductivity [4]. For this evaluation, the thickness of the reference system is set at 800 µm. Coating thermal conductivity is a variable that depends on time and temperature of exposure. For the purpose of evaluation, the thermal conductivity at 1200 °C after 400 h exposure will be used as a worst-case situation since the component is expected to operate many thousands of hours. Based on this calculation, a revised coating thickness can, therefore, be calculated for the two experimental coatings assuming the same target thermal resistance as the industrial reference coating must be achieved. The results of this evaluation are presented in Table 5.
Under these revised coating requirements, the Commercial powder coating would need to be approximately 8% thicker than the reference coating to account for that coating’s lower porosity and higher conductivity. This would somewhat increase the time, materials consumption and cost for this coating system. The Low-Density coating, by contrast, could be made approximately 85% the thickness of the reference coating (~675 µm versus 800 µm) due to its low thermal conductivity. The 4th column in Table 4 summarizes the cost calculation for this thermal resistance optimized case with a lower required thickness of the Low-Density coating. In this case, there are substantial potential improvements in efficiency when considering lower waste generation (lower powder usage), reduced time and resources to complete the required coating. Furthermore, a lower thickness coating is predicted to have longer lifetime, potentially improving lifetime further [4]
The current evaluation covers only a single component; it can be envisaged how these differences would grow with serial manufacturing of components. Furthermore, the coating manufacturing rate should be taken in context with a conventional TBC coating manufactured with a legacy plasma system. If a F4-MB plasma system and similar YSZ A & S powder is utilized at 90g/min to produce a conventional porous TBC [12]; the manufacturing time for an 800-µm-thick coating would be approximately 11.5 h. This does not include the fact that a conventional coating would have a higher thermal conductivity and would, therefore, require an even greater thickness to achieve the required coating thermal resistance for the industrial application.
As discussed previously, high-porosity thermal barrier coatings are not investigated as extensively as conventional TBC coatings. This, in turn, makes comparisons with previously published studies more complicated. From the perspective of spray processing, the authors can find no direct reference to powder feeding rates in the same range (270–280 g/min) as used in this study. The measured deposition efficiency levels are comparable to those reported in literature. However, the effective spray rates (feeding rate x deposition efficiency) of 110–144 g/min that equates to the material deposited on the component, is several times greater than for conventional TBC spraying and far better suited to coating large area components such as IGT combustor liners.

4. Conclusions

The goal of this study was to elaborate on the performance of high-porosity thermal barrier coatings that are relatively little studied in literature. Furthermore, the performance of conventional and engineered powder sprayed with a high-power plasma system would be compared with an industrial reference.
The use of a high-energy plasma system allows the processing of high amounts of spray powder to generate high-porosity coatings that perform as well as or better than the current reference high-porosity thermal barrier coating used on an industrial gas turbine component. However, attaining the best coating structure at high feed rates, with high process efficiency can best be achieved by the use of a powder engineered specifically for the goal. In this case, the Low-Density powder achieves the stated goals of high-porosity transfer to the final coating at very high feeding rates while achieving a deposition efficiency similar to a conventional coating process for TBC manufacturing. Such an improvement in efficiency can not only reduce environmental impact through reduced waste generation but lower use of other resources such as electricity and process gasses as well as reduced costs for the coating manufacturer.
This work suggests a potential way forward in further improving the coating economy in the longer term, utilizing the advantages of a more stable material and high-porosity microstructure to lower the overall coating thickness requirement to achieve the desired degree of thermal insulation on the component. This approach would require a more advanced way to set TBC specifications based on more detailed performance evaluation rather than initial conditions such as porosity level and thickness. Currently this would require more in-depth work to characterize coatings before service but would allow for lowering the environmental impact of the coating process though reduced use of energy and materials.
There is scope for further investigation to be done on the high-porosity coatings in general terms and on those evaluated here. A next step in the evaluation would be to produce coating test samples where the specific thermal resistance is used as the design criteria rather than coating thickness and porosity. The coatings could then be evaluated if the optimization based on thermal resistance principles, allows the coatings to achieve the same or improved performance versus the industrial benchmark.
The current study was also limited by the need to use powders of comparable particle size distribution to that used for the benchmark industrial reference coating. However, if the particle size distribution could be freely chosen, the use of a coarser powder with a d10 approximately 45 microns and d90 approximately 110 µm would lead to increased porosity level. In preliminary testing, this powder fraction has been seen to be better suited to processing with the high-energy plasma system, allowing higher porosity levels to be achieved at higher efficiency levels relative to the current powder size distribution.
The impact of the type of high-temperature exposure on coating thermal properties was also notable in the results seen in this study. There is scope for greater understanding of the behavior of these high-porosity coatings that show relatively low influence of high-temperature sintering in comparison to conventional porosity TBCs. It would be of interest to perform further thermal property evaluations on furnace cycled samples after several intervals before coating failure. The influence of sintering versus cyclic damage accumulation on the thermal properties of the TBCs could then be compared with simple isothermal exposure. Furthermore, repeating such exposure tests with a thermal gradient experiment such as a laser rig may allow the influence of thermal gradient to be understood in combination with thermal cycling and high-temperature exposure.

Supplementary Materials

The following are available online at https://www.mdpi.com/2079-6412/10/10/957/s1, Figure S1: Thermal conductivity of the Reference industrial coating heat treated for different exposure times at 1200 °C, Figure S2: Thermal conductivity of the Commercial powder coating heat treated for different exposure times at 1200 °C, Figure S3: Thermal conductivity of the Low-Density powder coating heat treated for different exposure times at 1200 °C.

Author Contributions

N.C. conceived and designed the experiments, supervised the coating manufacturing, analyzed the data, and co-wrote the article; K.K. manufactured the coatings, performed the experiments, discussed the results and co-wrote the article. M.L. manufactured the powder, prepared coatings for evaluation, analyzed the data, discussed the results and co-wrote the article. All authors have read and agreed to the published version of the manuscript.

Funding

This research received no external funding.

Acknowledgments

Thanks go to Kent Van Every and Todd Snyder of Progressive Surface for valuable discussions on set-up of the initial spray experiments. Thanks to Rogerio Lima for his helpful discussions. Thanks to the support of the colleagues at Treibacher Industrie AG.

Conflicts of Interest

The authors declare no conflict of interest.

References

  1. Boissonnet, G.; Bonnet, G.; Pasquet, A.; Bourhila, N.; Pedraza, F. Evolution of thermal insulation of plasma-sprayed thermal barrier coating systems with exposure to high temperature. J. Eur. Ceram. Soc. 2019, 39, 2111–2121. [Google Scholar] [CrossRef]
  2. Feuerstein, A.; Knapp, J.; Taylor, T.; Ashary, A.; Bolcavage, A.; Hitchman, N. Technical and economical aspects of current thermal barrier coating systems for gas turbine engines by thermal spray and EBPVD: A review. J. Therm. Spray Technol. 2008, 17, 199–213. [Google Scholar] [CrossRef]
  3. Lima, R.S. Perspectives on thermal gradients in porous ZrO2-7–8 wt.% Y2O3 (YSZ) thermal barrier coatings (TBCs) manufactured by air plasma spray (APS). Coatings 2020, 10, 812. [Google Scholar] [CrossRef]
  4. Helminiak, M.A.; Yanar, N.M.; Pettit, F.; Taylor, T.; Meier, G.H. The behavior of high-purity, low-density air plasma sprayed thermal barrier coatings. Surf. Coat. Technol. 2009, 204, 793–796. [Google Scholar] [CrossRef]
  5. Bengtsson, P.; Ericsson, T.; Wigren, J. Thermal shock testing of burner cans coated with a thick thermal barrier coating. J. Therm. Spray Technol. 1998, 7, 340–348. [Google Scholar] [CrossRef]
  6. Steffens, H.D.; Babiak, Z.; Gramlich, M. Some aspects of thick thermal barrier coating lifetime prolongation. J. Therm. Spray Technol. 1999, 8, 517–522. [Google Scholar] [CrossRef]
  7. Taylor, T.A. Thermal Barrier Coating for Substrates and Process for Producing It. U.S. Patent 5073433A, 17 December 1991. [Google Scholar]
  8. Schwingel, D.; Taylor, R.; Haubold, T.; Wigren, J.; Gualco, C. Mechanical and thermophysical properties of thick PYSZ thermal barrier coatings: Correlation with microstructure and spraying parameters. Surf. Coatings Technol. 1998, 108, 99–106. [Google Scholar] [CrossRef] [Green Version]
  9. Guo, H.; Vaßen, R.; Stöver, D. Thermophysical properties and thermal cycling behavior of plasma sprayed thick thermal barrier coatings. Surf. Coatings Technol. 2005, 192, 48–56. [Google Scholar] [CrossRef]
  10. Curry, N.; VanEvery, K.; Snyder, T.; Markocsan, N. Thermal conductivity analysis and lifetime testing of suspension plasma-sprayed thermal barrier coatings. Coatings 2014, 4, 630–650. [Google Scholar] [CrossRef]
  11. Scrivani, A.; Rizzi, G.; Bardi, U.; Giolli, C.; Miranda, M.M.; Ciattini, S.; Fossati, A.; Borgioli, F. Thermal fatigue behavior of thick and porous thermal barrier coatings systems. J. Therm. Spray Technol. 2007, 16, 816–821. [Google Scholar] [CrossRef]
  12. Curry, N.; Donoghue, J. Evolution of thermal conductivity of dysprosia stabilised thermal barrier coating systems during heat treatment. Surf. Coat. Technol. 2012, 209, 38–43. [Google Scholar] [CrossRef]
  13. Golosnoy, I.O.; Cipitria, A.; Clyne, T. Heat transfer through plasma-sprayed thermal barrier coatings in gas turbines: A review of recent work. J. Therm. Spray Technol. 2009, 18, 809–821. [Google Scholar] [CrossRef] [Green Version]
  14. Smith, J.; Scheibel, J.; Classen, D.; Paschke, S.; Elbel, S.; Fick, K.; Carlson, D. Thermal barrier coating validation testing for industrial gas turbine combustion hardware. J. Eng. Gas. Turbines Power 2015, 138, 031508. [Google Scholar] [CrossRef]
  15. Scheibel, J.; Smith, J.S. Gas Turbine Low Conductivity Thermal Barrier Coating Validation and Demonstration; European Turbine Network: Brussels, Belgium, 2016; p. 10. [Google Scholar]
  16. Giolli, C.; Scrivani, A.; Rizzi, G.; Borgioli, F.; Bolelli, G.; Lusvarghi, L. Failure mechanism for thermal fatigue of thermal barrier coating systems. J. Therm. Spray Technol. 2009, 18, 223–230. [Google Scholar] [CrossRef]
  17. Nelson, W.A.; Orenstein, R.M. TBC experience in land-based gas turbines. J. Therm. Spray Technol. 1997, 6, 176–180. [Google Scholar] [CrossRef] [Green Version]
  18. Bolelli, G.; Righi, M.G.; Mughal, M.Z.; Moscatelli, R.; Ligabue, O.; Antolotti, N.; Sebastiani, M.; Lusvarghi, L.; Bemporad, E. Damage progression in thermal barrier coating systems during thermal cycling: A nano-mechanical assessment. Mater. Des. 2019, 166, 107615. [Google Scholar] [CrossRef]
  19. Mauer, G.; Vaßen, R.; Stöver, D. Preliminary study on the TriplexPro™-200 gun for atmospheric plasma spraying of yttria-stabilized zirconia. Surf. Coat. Technol. 2008, 202, 4374–4381. [Google Scholar] [CrossRef]
  20. Vaidya, A.; Srinivasan, V.; Streibl, T.; Friis, M.; Chi, W.; Sampath, S. Process maps for plasma spraying of yttria-stabilized zirconia: An integrated approach to design, optimization and reliability. Mater. Sci. Eng. A 2008, 497, 239–253. [Google Scholar] [CrossRef]
  21. Seshadri, R.C.; Sampath, S. Characteristics of conventional and cascaded arc plasma spray-deposited ceramic under standard and high-throughput conditions. J. Therm. Spray Technol. 2019, 28, 690–705. [Google Scholar] [CrossRef]
  22. Lima, R.S.; Guerreiro, B.M.H.; Curry, N.; Leitner, M.; Körner, K. Environmental, economical, and performance impacts of Ar-H2 and N2-H2 plasma-sprayed YSZ TBCs. J. Therm. Spray Technol. 2019, 29, 74–89. [Google Scholar] [CrossRef]
  23. Marple, B.; Lima, R.; Moreau, C.; Kruger, S.; Xie, L.; Dorfman, M.R. Yttria-stabilized zirconia thermal barriers sprayed using N2-H2 and Ar-H2 plasmas: Influence of processing and heat treatment on coating properties. J. Therm. Spray Technol. 2007, 16, 791–797. [Google Scholar] [CrossRef]
  24. Solonenko, O.P.; Smirnov, A.V. Advanced oxide powders processing based on cascade plasma. J. Phys. Conf. Ser. 2014, 550, 012017. [Google Scholar] [CrossRef]
  25. Bobzin, K.; Ernst, F.B.G.; Zwick, J.B.; Richardt, K.R.M.; Sporer, D.; Molz, R. Triplex Pro 200: Potentials and advanced applications. In Global Coating Solutions; ASM International: Beijing, China, 2007. [Google Scholar]
  26. Mohanty, P.; George, A.; Pollard, L.; Snyder, D. A Novel single cathode plasma column design for process stability and long component life. J. Therm. Spray Technol. 2009, 19, 448–458. [Google Scholar] [CrossRef]
  27. Bisson, J.F.; Moreau, C.; Dorfman, M.; Dambra, C.; Mallon, J. Influence of hydrogen on the microstructure of plasma-sprayed yttria-stabilized zirconia coatings. J. Therm. Spray Technol. 2005, 14, 85–90. [Google Scholar] [CrossRef]
  28. Kucuk, A.; Lima, R.S.; Berndt, C. Influence of plasma spray parameters on formation and morphology of ZrO2−8 wt% Y2O3 deposits. J. Am. Ceram. Soc. 2001, 84, 693–700. [Google Scholar] [CrossRef]
  29. ImageJ. Available online: http://imagej.nih.gov/ij/ (accessed on 18 March 2009).
  30. ISO Standard 18754. Fine Ceramics (Advanced Ceramics, Advanced Technical Ceramics)—Determination of Density and Apparent Porosity; International Organization for Standardization: Geneva, Switzerland, 2003. [Google Scholar]
  31. Wang, Z.; Kulkarni, A.; Deshpande, S.; Nakamura, T.; Herman, H. Effects of pores and interfaces on effective properties of plasma sprayed zirconia coatings. Acta Mater. 2003, 51, 5319–5334. [Google Scholar] [CrossRef]
  32. Tan, Y.; Longtin, J.P.; Sampath, S.; Wang, H. Effect of the starting microstructure on the thermal properties of as-sprayed and thermally exposed plasma-sprayed YSZ coatings. J. Am. Ceram. Soc. 2009, 92, 710–716. [Google Scholar] [CrossRef]
  33. Bacciochini, A.; Ilavsky, J.; Montavon, G.; Denoirjean, A.; Ben-Ettouil, F.; Valette, S.; Fauchais, P.; Wittmann-Teneze, K. Quantification of void network architectures of suspension plasma-sprayed (SPS) yttria-stabilized zirconia (YSZ) coatings using Ultra-small-angle X-ray scattering (USAXS). Mater. Sci. Eng. A 2010, 528, 91–102. [Google Scholar] [CrossRef]
  34. Ekberg, J.; Ganvir, A.; Klement, U.; Creci, S.; Nordstierna, L. The influence of heat treatments on the porosity of suspension plasma-sprayed yttria-stabilized zirconia coatings. J. Therm. Spray Technol. 2018, 27, 391–401. [Google Scholar] [CrossRef] [Green Version]
  35. ASTM C633. B08 committee test method for adhesion or cohesion strength of thermal spray coatings. ASTM Int. 2017. [Google Scholar] [CrossRef]
  36. Cernuschi, F.; Lorenzoni, L.; Ahmaniemi, S.; Vuoristo, P.; Mäntylä, T. Studies of the sintering kinetics of thick thermal barrier coatings by thermal diffusivity measurements. J. Eur. Ceram. Soc. 2005, 25, 393–400. [Google Scholar] [CrossRef]
  37. Shinoda, K.; Angulo, J.C.; Valarezo, A.; Sampath, S. Effect of deposition rate on the stress evolution of plasma-sprayed yttria-stabilized zirconia. J. Therm. Spray Technol. 2012, 21, 1224–1233. [Google Scholar] [CrossRef]
  38. Matsumoto, K.; Itoh, Y.; Kameda, T. EB-PVD process and thermal properties of hafnia-based thermal barrier coating. Sci. Technol. Adv. Mater. 2003, 4, 153–158. [Google Scholar] [CrossRef]
  39. Lee, P.H.; Lee, S.Y.; Kwon, J.Y.; Myoung, S.W.; Lee, J.H.; Jung, Y.G.; Cho, H.; Paik, U. Thermal cycling behavior and interfacial stability in thick thermal barrier coatings. Surf. Coatings Technol. 2010, 205, 1250–1255. [Google Scholar] [CrossRef]
  40. Lima, R.S.; Nagy, D.; Marple, B.R. Bond coat engineering influence on the evolution of the microstructure, bond strength, and failure of TBCS subjected to thermal cycling. J. Therm. Spray Technol. 2014. [Google Scholar] [CrossRef] [Green Version]
  41. Bolcavage, A.; Feuerstein, A.; Foster, J.; Moore, P. Thermal shock testing of thermal barrier coating/bondcoat systems. J. Mater. Eng. Perform. 2004, 13, 389–397. [Google Scholar] [CrossRef]
  42. Curry, N.; Markocsan, N.; Östergren, L.; Li, X.H.; Dorfman, M. Evaluation of the lifetime and thermal conductivity of dysprosia-stabilized thermal barrier coating systems. J. Therm. Spray Technol. 2013, 22, 864–872. [Google Scholar] [CrossRef]
  43. Patterson, T.; Leon, A.; Jayaraj, B.; Liu, J.; Sohn, Y.H. Thermal cyclic lifetime and oxidation behavior of air plasma sprayed CoNiCrAlY bond coats for thermal barrier coatings. Surf. Coat. Technol. 2008, 203, 437–441. [Google Scholar] [CrossRef]
  44. Cipitria, A.; Golosnoy, I.; Clyne, T. A sintering model for plasma-sprayed zirconia thermal barrier coatings. Part II: Coatings bonded to a rigid substrate. Acta Mater. 2009, 57, 993–1003. [Google Scholar] [CrossRef] [Green Version]
  45. Chi, W.; Sampath, S.; Wang, H. Microstructure-thermal conductivity relationships for plasma-sprayed yttria-stabilized zirconia coatings. J. Am. Ceram. Soc. 2008, 91, 2636–2645. [Google Scholar] [CrossRef]
  46. Eaton, H.; Novak, R. Sintering studies of plasma-sprayed zirconia. Surf. Coat. Technol. 1987, 32, 227–236. [Google Scholar] [CrossRef]
  47. Arfelli, M.; Ingo, G.M.; Mattogno, G. XPS investigation of impurity phase segregation in 25.5 wt.% CeO2−2.5 Y2O3−72 ZrO2 plasma-sprayed thermal barrier coatings. Surf. Interface Anal. 1990, 16, 452–456. [Google Scholar] [CrossRef]
  48. Vaßen, R.; Czech, N.; Malléner, W.; Stamm, W.; Stöver, D. Influence of impurity content and porosity of plasma-sprayed yttria-stabilized zirconia layers on the sintering behaviour. Surf. Coat. Technol. 2001, 141, 135–140. [Google Scholar] [CrossRef]
  49. Paul, S.; Cipitria, A.; Golosnoy, I.; Xie, L.; Dorfman, M.; Clyne, T. Effects of impurity content on the sintering characteristics of plasma-sprayed zirconia. J. Therm. Spray Technol. 2007, 16, 798–803. [Google Scholar] [CrossRef] [Green Version]
  50. Xie, L.; Dorfman, M.; Cipitria, A.; Paul, S.; Golosnoy, I.; Clyne, T. Properties and performance of high-purity thermal barrier coatings. J. Therm. Spray Technol. 2007, 16, 804–808. [Google Scholar] [CrossRef] [Green Version]
  51. Curry, N.; Janikowski, W.; Pala, Z.; Vilémová, M.; Markocsan, N. Impact of impurity content on the sintering resistance and phase stability of dysprosia- and yttria-stabilized zirconia thermal barrier coatings. J. Therm. Spray Technol. 2014, 23, 160–169. [Google Scholar] [CrossRef]
  52. Tsipas, S.; Golosnoy, I.O.; Damani, R.; Clyne, T. The effect of a high thermal gradient on sintering and stiffening in the top coat of a thermal barrier coating system. J. Therm. Spray Technol. 2004, 13, 370–376. [Google Scholar] [CrossRef]
  53. Lima, R.S.; Marple, B.R.; Marcoux, P. Thermal gradient behavior of TBCS subjected to a laser gradient test rig: Simulating an air-to-air combat flight. J. Therm. Spray Technol. 2016, 25, 282–290. [Google Scholar] [CrossRef]
  54. Lima, R.S.; Marple, B.R. Insights on the high-temperature operational limits of ZrO2-Y2O3 TBCs manufactured via air plasma spray. J. Mater. Eng. Perform. 2017, 26, 1272–1282. [Google Scholar] [CrossRef]
Figure 1. (a) SEM image of the commercial A & S spray powder; (b) SEM image of the experimental Low-Density A & S powder.
Coatings 10 00957 g001
Figure 2. Microstructure cross-section of the reference coating produced with commercial powder and cascaded plasma system. Overall coating (a) and high-magnification images (b).
Coatings 10 00957 g002
Figure 3. Microstructure cross-section of the coating produced with commercial powder and 100HE plasma system. Overall coating (a) and high-magnification images (b).
Coatings 10 00957 g003
Figure 4. Microstructure cross-section of the coating produced with experimental Low-Density powder. Overall coating (a) and high-magnification images (b).
Coatings 10 00957 g004
Figure 5. Comparison of porosity measurements performed by water infiltration and image analysis.
Coatings 10 00957 g005
Figure 6. Total porosity for coatings in the as-produced, isothermally heat treated and thermally cycled states, evaluated by water infiltration.
Coatings 10 00957 g006
Figure 7. Furnace Cyclic fatigue lifetime results.
Coatings 10 00957 g007
Figure 8. As-produced coating thermal conductivity versus measurement temperature.
Coatings 10 00957 g008
Figure 9. Thermal conductivity versus temperature for coatings heat treated for 10 h at 1200 °C.
Coatings 10 00957 g009
Figure 10. Thermal conductivity measured at 1200 °C for coatings isothermally heat treated at various time intervals.
Coatings 10 00957 g010
Figure 11. Thermal conductivity of coatings after furnace cyclic fatigue failure.
Coatings 10 00957 g011
Figure 12. SEM Micrographs, Reference coating after FCT (a,b) and 400 h heat treatment (c,d), Commercial coating after FCT (e,f) and 400 hours heat treatment (g,h).
Coatings 10 00957 g012
Figure 13. SEM micrographs, Low Density coating after FCT testing (a,b) and 400 h heat treatment (c,d).
Coatings 10 00957 g013
Table 1. Summary of powder physical and chemical properties for commercial and experimental Low-Density powders.
ParametersPowder
CommercialLow Density
Particle Size (µm)D101621
D505054
D909597
Specific Densityg/cc2.31.6
Chemical Composition--
ZrO2wt.%BalanceBalance
Y2O37.137.6
HfO21.571.86
SiO20.059<0.01
Al2O30.045<0.01
CaO0.0350.04
TiO20.0940.045
Fe2O30.011<0.01
Table 2. Summary of plasma spray conditions.
CoatingArgon (SLM)Nitrogen (SLM)Hydrogen (SLM)Current (A)Voltage (V)Power (kW)Carrier Flow (SLM)
Commercial854771397239.694.922
Low Density3982399518
Table 3. Summary of investigated coatings.
Coating IDSpray SystemCoating Thickness (µm)Powder Feeding Rate (g/min)Deposition Efficiency (%)
ReferenceCascade779 ± 10270~38
Commercial100HE789 ± 828039.4
Low Density100HE816 ± 828051.6
Table 4. Comparison of coatings manufacturing costs for a single idealized component.
Cascade100HE
Coating SystemReferenceCommercialLow DensityLow Density Optimised
Deposition Efficiency38%39.4%51.6%
Coating thickness800 µm800 µm800 µm675 µm
Gas CostEUR 6.01EUR 14.00EUR 12.44EUR 10.54
YSZ powder cost
(@ EUR 35 per kg)
EUR 2475.49EUR 2322.55 EUR 2058.76EUR 1737.08
Powder saved (kg)-4.411.921.1
Electricity CostEUR 72.08EUR 87.12EUR 77.43EUR 65.61
Labour Cost
(@ €30 per hour)
EUR 139.98EUR 127.50EUR 114.04EUR 97.63
Time (minutes)262237210177
Time Saving-10%20%32%
Processing CostEUR 2693.55EUR 2551.16EUR 2262.66EUR 1910.85
Cost Saving-5%16%29%
Table 5. Comparison of coating thermal resistance and target coating thickness.
Coating IDSpray SystemThermal Conductivity @ 1200 °C (W·m/K)Thermal Resistance (m2·K/W) (10−4)Target Coating Thickness (µm)Difference in Coating Thickness (%)
ReferenceCascade1.1067.25 ± 0.26800-
Commercial100HE1.2256.68 ± 0.16866+8.3%
Low Density100HE0.9788.59 ± 0.31674−15.8%

