Abstract
The effect of TiB2 particles content (10–40 wt.%) on the microstructure, mechanical properties and tribological properties of TiB2-reinforced Inconel 718 alloy composite coatings by laser cladding was investigated. From the perspective of solidification thermodynamics and dynamics, when the TiB2 particles content increases from 10 to 30 wt.%, the cooling rate increases for the increase in thermal conductivity and thermal diffusion coefficient, leading to the decrease in dendrite size, and the uniformity of TiB2 particles becomes better for the decrease in the critical capture speed of the solid–liquid interface, causing the improvement of microhardness and tribological properties. However, when the TiB2 particles content is too high (40 wt.%), the cooling rate decreases for the increase in heat released by solidification, so the dendrite size increases, and the Marangoni convection is too weak to drive the rearrangement of TiB2 particles, leading to the heterogeneous microstructure, large fluctuation of microhardness and the deterioration of tribological properties. When the TiB2 particles content is 30 wt.%, the composite coating has the finest and densest dendrites and evenly distributed TiB2 particles, the bonding strength is as high as 1.714 GPa, the microhardness is up to 844.33 HV0.2, which is 2.98 times that of Inconel 718 alloy coating, and the friction coefficient and the wear rate are 0.355 and 9.12 × 10⁻⁷ g/(N·m), which are 22.99% and 83.86% lower than those of the Inconel 718 alloy coating.
1. Introduction
With the continuous improvement of the technological level and the rapid development of productivity, the work performance, service life and safety reliability of mechanical components have put forward higher requirements [1,2]. However, for the limitation of surface microhardness, strength and wear resistance, severe wear, fatigue and oxidation will inevitably occur on the components under severe service conditions, which seriously affects the surface performance of the components and reduces work efficiency and service life [3,4,5]. Therefore, how to solve the above problems of components is an urgent problem to be solved in modern industry. Without changing the basic properties of components, surface strengthening technology can impart various surface properties to components, such as wear resistance, corrosion resistance, high temperature resistance and fatigue resistance, which has now been attracting tremendous attention in recent years. As a promising surface strengthening technology, laser cladding has been a research hotspot for the advantages of refined grains, goof metallurgical bonding with substrate, low dilution rate and small heat-affected zone, which can meet the modern industry requirements for the surface properties of components [6,7,8,9].
In order to effectively improve the comprehensive performance of laser cladding coating, ceramic particles of excellent resistance against with wear, corrosion and high temperature are the first options for the reinforcement materials that scholars considered, such as TiN [10], SiC [11] and WC [12]. However, for the huge difference in the thermophysical and chemical characteristics between ceramic particles and substrates, the defects such as weak bonding with the substrate, cracks and pores are prone to occur in pure ceramic coatings [13]. Therefore, in order to avoid the above defects, ceramic particles are usually mixed with alloys owning great self-fusibility, showing a combination of excellent plasticity for alloys and high hardness for ceramics [14]. Self-fluxing alloys manly include Fe-based, Ni-based and Co-based alloys, of which Ni-based alloys are the most widely studied and applied materials in laser cladding, for their excellent strength, wear resistance, corrosion resistance and high temperature resistance, as well as the better ductility and plasticity than Fe-based alloys and the lower price than Co-based alloys [15].
Inconel 718 alloy, as a precipitated strengthened Ni-based alloy, has great wettability, plasticity, welding performance and high strength at medium temperature, which gradually becomes the promising material in laser cladding [16]. In practical applications, it is usually necessary to add ceramic particles to the Inconel 718 alloy coating to further enhance its wear resistance. Gopinath et al. [17] fabricated TiC/Inconel 718 alloy composite coatings on the surface of AISI 304 austenitic steel by laser cladding. The results show that as the content of TiC increases from 10 to 70 wt.%, the highest temperature in the molten pool increases, and the morphology of TiC gradually changes from granular to dendritic, and when the content of TiC is 30 wt.%, the microhardness is as high as 810 HV0.05 and the wear rate is as low as 7.4 × 10⁻⁵ mg/min at a rotating speed of 300 rpm. Moreover, 30 wt.% WC + Inconel 718 alloy composite coatings are also successfully prepared by laser cladding, indicating that when the molten pool life is greater than 0.68 s, the WC particles are properly wetted by the matrix [18]. From the results of the fracture surfaces of composite coatings, the WC particles in the composite coating with a relatively high cooling rate are easily separated from the matrix under tensile load, so a proper decrease in the cooling rate can ensure the good bonding interface between the WC particles and the matrix, thereby improving the tribological properties. However, the WC particles are prone to settle at the bottom of the composite coating under a too low cooling rate, and the tribological properties deteriorate instead.
TiB2 particles have high hardness, and excellent resistance to wear, oxidation and corrosion, which also have the linear expansion coefficient (8.1 × 10⁻⁶/°C) similar to that of Inconel 718 alloy (7.7 × 10⁻⁶/°C). Besides, their higher melting point (2980 °C) than that of Inconel 718 alloy (1320 °C) can ensure the chemical stability in composite coatings, and their small wetting angle (23°) with the Ni-based alloy can ensure the good reinforcement effect of TiB2 particles, which meets the principle of the compatibility of physical and chemical properties of ceramic particles and alloys in laser cladding [19,20]. He et al. [21] prepared TiB2 particles-reinforced Ni60 alloy composite coatings on the surface of Al alloy by laser cladding. It was found that when the TiB2 content was 20 vol.%, the phases consisted of NiAl, Ni3Al, Al3Ni2, TiB2, TiB, TiC, CrB and Cr23C6, and the microhardness was 855.8 HV0.5, which was 4.5 times that of the substrate; as the load increased from 3 to 12 N, the friction coefficient and wear loss of the coating both showed the increase tendency, but they still were at a low level, which were reduced by 13.2–32.4% and 16.5–32.7%, respectively, compared with the substrate, and the wear mechanism gradually changed from micro-cutting wear at low load to multiple-plastic wear at high load.
Nowadays, many scholars have successfully fabricated WC-, TiC-, TiN-, B4C- and other ceramic particles-reinforced Ni-based alloy composite coatings by laser cladding, and the influence mechanism of the ceramic particles on the properties of the composite coating is also specific. However, few studies have explained the influence mechanism of ceramic particles on the microstructure evolution and size of the composite coating from the perspective of the kinetics and thermodynamics in laser cladding, as well as the movement and distribution of ceramic particles in the molten pool. In addition, there are some studies about TiC-, WC-, SiC- and other ceramic particle-reinforced Inconel 718 alloy composite coatings, but the studies about TiB2 particle-reinforced Inconel 718 alloy composite coatings are quite rare. Hence, this paper utilizes laser cladding to deposit TiB2-enhanced Inconel 718 alloy composite coatings on the surface of 45# steel, and the effects of the content of TiB2 particles on the macro-morphology, dilution rate, microstructure, bonding strength, microhardness and tribological properties of the composite coating are studied, and the dendrite size, TiB2 particle distribution and wear mechanism of composite coatings with different TiB2 particle content are discussed in detail.
2. Materials and Methods
In this paper, the substrate material employed in laser cladding was 45# steel with the dimension of 60 mm × 60 mm × 10 mm The composite powder of Inconel 718 alloy powder (99.5% purity, 53–150 μm) and TiB2 powder (99.5% purity, 1–10 μm) were used as the cladding materials. The chemical composition of Inconel 718 alloy powder is listed in Table 1. Inconel 718 alloy powder and TiB2 particles were preliminarily mixed according to the composition ratio in Table 2, in order to fully mix the powder with the ball mill subsequently. The SEM morphologies of Inconel 718 alloy powder and TiB2 particles are shown in Figure 1a,b.

Table 1.
Chemical composition of Inconel 718 alloy powder.
Table 2.
Composition ratio of mixed powder (wt.%).
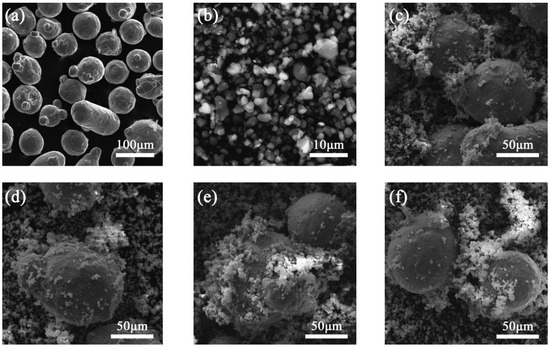
Figure 1.
SEM morphologies of (a) Inconel 718 alloy powder, (b) TiB2 particles and mixed powder: (c) TB10, (d) TB20, (e) TB30, (f) TB40.
Figure 2 is the schematic diagram of the preparation process of LC of the Inconel 718/TiB2 composite coating. Before the LC, there are two aspects to be prepared. Firstly, Inconel 718 alloy powder and TiB2 powder were placed into the grinding cylinder according to the composition ratio of Table 2; in the meantime, an appropriate amount of absolute ethanol and grinding balls with the powder to ball mass ratio of 1:4 should also be put in the grinding cylinder. Put the grinding cylinder into the QM1SP4 planetary ball mill (Nanda Instrument Plant, Nanjing, China) for mixing for 4 h at a speed of 340 rpm, and then the mixed powder is dried in an oven; the SEM morphologies of the mixed powder are shown in Figure 1c–f. Secondly, use an angle grinder to remove the rough oxides on the surface of the substrate, treat the surface with 180#, 280#, 500# and 600# sandpaper, which is beneficial to the adhesion between the cladding material and surface of the substrate, then put the substrate into the ultrasonic vibration washing machine filled with acetone solution to further remove the oil and other impurities on the surface, and finally take out the substrate to dry naturally. During the LC, the YLS-6000-KC fiber laser (IPG Photonics, Beijing, China) was used as the heat source (parameters: laser power 1600 W, scanning speed 12 mm/s, spot diameter 3 mm) to realize the “Z” scanning of the laser beam on the surface of the cladding material (overlap rate is 50%), which was equipped with a Kawasaki R series six-axis high-speed RS050N robot arm (Walton, Shenzhen, China, position accuracy ± 0.06 mm) and protective gas nozzle (Ar gas, flow rate is 25 L/min). After the LC, the specimens were cooled at room temperature.
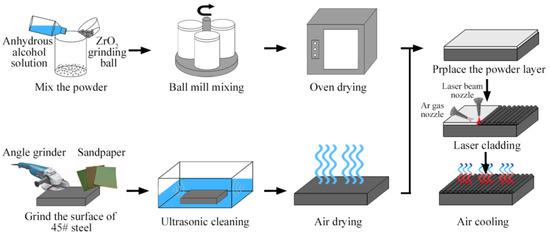
Figure 2.
Schematic diagram of the preparation process of laser cladding the Inconel 718/TiB2 composite coating.
The surface and cross-section morphologies of composite coatings were observed by Stemi-2000C optical microscopy. An X’TRA X-ray diffractometer (ThermoFisher, Shanghai, China) with Cu Kα radiation was used to get the phase composition, the scanning range is from 20° to 90°, and the step size is 0.02°/s. The microstructure of composite coatings was observed by DM4M optical microscopy and Hitachi S-4800 scanning electron microscopy which was equipped with an X-ray energy-dispersive spectrometer (EDS, Bruker, Karlsruhe, Germany). A DHV-1000 microhardness tester (Shangcai Testermachine, Shanghai, China) was used to reveal the microhardness distribution, where the load and the dwelling time are 200 g and 10 s. A WS-2005 scratch tester (Zhongke Kaihua Technology, Lanzhou, China) was utilized to measure the bonding strength between the composite coating and substrate, where the scratch speed, the loading speed and the maximum load were 1 mm/min, 25 N/min and 200 N, respectively. The tribological tests were carried out by an HT-500 ball-on-disk tribometer (Zhongke Kaihua Technology, Lanzhou, China). The specimens slid against a GCr15 steel ball (Φ = 4 mm) under the load of 12 N and the speed of 840 rpm for 30 min at 20 °C, and the radius of the wear scar is about 4 mm. Wear losses were measured by the ATB 120-4 M electric analytical balance with precision of 0.1 mg, and the wear rate can be calculated by Equation (1).
where w is the wear rate, n is the rotating speed, Δm is the wear loss, r is the radius of the worn scar, t is the sliding time, and L is the load.
3. Results and Discussion
3.1. Macro-Observation and Dilution Rate
Figure 3 shows the surface morphologies of coatings with different TiB2 particles content. When the content of TiB2 particles is 0 wt.%, the TB0 coating presents a continuous, uniform and smooth surface morphology, without the macro-defects such as cracks, holes and spheroidization, and the lap interface between single tracks is quite good (Figure 3a). When the TiB2 particles were added into coatings, the composite coatings show darker surface morphologies for the presence of dark gray TiB2 particles, and they become darker as there is an increase in the content of TiB2 particles. Besides, at the same laser parameters, the laser energy absorbed by the Inconel 718 alloy inside coatings decreases as there is an increase in the content of TiB2 particles, resulting in the poor continuity, large roughness and weak lap interface on the surface of the composite coatings. When the content of TiB2 particles is between 10 and 30 wt.%, the surface of the composite coatings is relatively flat, with only a few defects such as spheroidization and pits (Figure 3b–d). However, when the content of TiB2 particles is 40 wt.%, more unmelted particles exist in the molten pool, which cause the increase in the huge surface tension of the liquid phase during solidification, so the surface of the TB40 coating displays serious spheroidization and large roughness (Figure 3e).
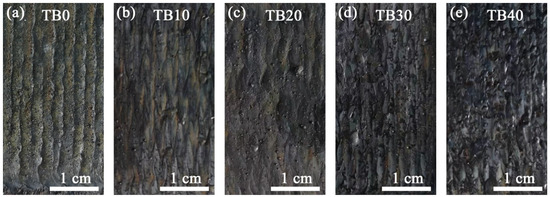
Figure 3.
Surface morphologies of coatings with different TiB2 particles content: (a) TB0, (b) TB10, (c) TB20, (d) TB30 and (e) TB40.
Figure 4 displays the cross-sectional morphologies of coatings with different TiB2 particles content. It can be found that the interfaces between coatings TB0–TB30 and substrates have a good bonding condition, and there are no pores and cracks in coatings TB0–TB30, while coating TB40 shows a weak bonding interface where cracks exist with the substrate, and there are also some pores in coating TB40, indicating poor compactness. Besides, it can also be observed that the TiB2 particles have great influence on the height, depth and dilution rate of the coating. We measured the average height H and depth D of the above coatings (Figure 4b), utilized ζ = D/(D + H) to calculate the dilution rate ζ, and the results are as shown in Table 3. As the TiB2 particles content increases from 0 to 40 wt.%, the height H and depth D of the coating decrease from 841.27 and 253.97 to 626.98 and 64.92 μm, respectively. In turn, the dilution rate decreased from 23.19% to 9.38%.
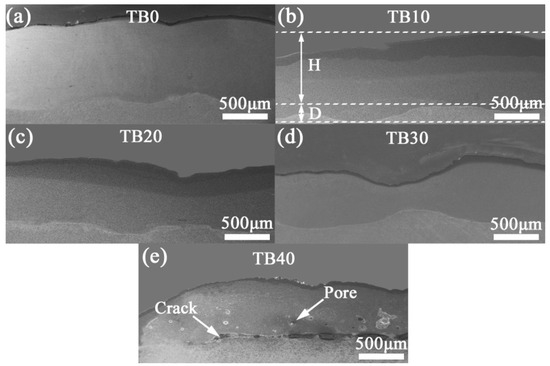
Figure 4.
Cross-sectional morphologies of coatings with different TiB2 particles content: (a) TB0, (b) TB10, (c) TB20, (d) TB30 and (e) TB40.
Table 3.
Height, depth and dilution rate of coatings with different TiB2 particles content.
The reason for the above phenomenon is related to the movement state of the molten pool during the LC. Due to the fact that the laser energy density irradiated on the cladding material surface obeys Gaussian distribution, the laser energy has the characteristics of gradually weakening from the center of the laser spot to the edge, and this uneven distribution will cause the temperature gradient, tension gradient and composition concentration gradient in the molten pool, promoting the liquid to flow from the edge to the center of the molten pool, where the convection driving this phenomenon is Marangoni convection [22]. According to Limmaneevichitr’s definition of Marangoni convection intensity, it is found that Marangoni convection intensity is negatively related to the viscosity of the liquid phase in the molten pool [23]. The relationship between the viscosity of the molten pool and the volume fraction of TiB2 particles can be described by the following formula [24]:
where and are the viscosity of the molten pool when the TiB2 particles exist and the TiB2 particles do not exist, is the volume fraction of the TiB2 particles, and and are the equivalent diameters of the TiB2 particle and base fluid molecule.
Obviously, the increase in the content of TiB2 particles from 0 to 40 wt.% will lead to the increase in the viscosity of the molten pool and the decrease in the Marangoni convection intensity, which indicates the weakening of the mass and energy transfer function in the molten pool. Therefore, the liquid phase and TiB2 particles will not get enough movement, resulting in the decrease in the molten pool volume, which is reflected in the decrease in H and D. For the reason of heat transfer, the surface of the substrate will inevitably undergo a different degree of melting, and the melted substrate will participate in the liquid phase flow in the molten pool, resulting in the dilution of the coating. Further, the increase in TiB2 particles content will cause the heat absorbed by the Inconel 718 alloy to decrease, which also leads to the decrease in the heat transferred to the substrate and the molten degree of the substrate, together with the decrease in the Marangoni convection intensity, so the dilution rate decreases. In addition, due to the inadequate movement of the molten pool under the high TiB2 particles content, the gas remaining in coating TB40 cannot be released in time, which inevitably causes the formation of pores. At the same time, the difference in the elastic modulus and thermal expansion coefficient between the coating and substrate will increase for the increase in TiB2 particles content, resulting in greater thermal stress and sever cracks at the interface.
3.2. Microstructure Characteristics and Dendrite Size
Figure 5a shows the X-ray diffraction (XRD) patterns of coatings with different TiB2 particles content. It can be seen that when there are no TiB2 particles in the coating, the phases in the TB0 coating mainly include γ-(Ni, Fe), Cr23C6 and Laves, where γ-(Ni, Fe) is the matrix phase and Laves is the harmful non-equilibrium phase for it consumes Nb, Mo and other alloy elements which are beneficial to γ-(Ni, Fe). When the TiB2 particles are added into the coating, it is inevitable for TiB2 particles to partially melt for the effect of the high-energy laser beam, so the elements Ti and B will be released into the molten pool, which is conducive to the generation of TiB, TiC, Ni3B and CrB4. It can be found from Figure 5b that the diffraction peak of γ-(Ni, Fe) decreases as the TiB2 particles content increases from 0 to 40 wt.%, and it also accompanies the increase in the diffraction peak of TiB2, which is obviously caused by the content change of the Inconel 718 alloy and TiB2 particles. In addition, it is worth noting that the diffraction peak of the Laves phase in the TB0 coating is higher than that of the TB10, TB20, TB30 and TB40 coatings, indicating that the addition of TiB2 particles helps to reduce the precipitation of the Laves phase.
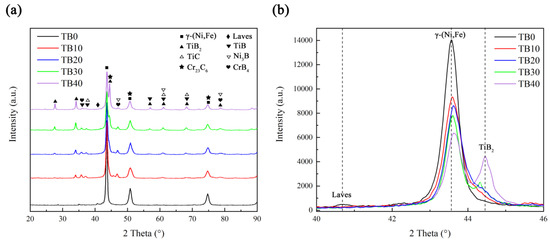
Figure 5.
XRD patterns of coatings with different TiB2 particles content when the diffraction angle is between (a) 20°–90° and (b) 40°–46°.
Figure 6 shows the OM images of the cross-section microstructure of coatings with different TiB2 particles. It can be found that the microstructure of coating TB0 is mainly columnar crystal (Figure 6a), and when the TiB2 particles are added, the solute concentration gradient and temperature gradient at the front of the solid–liquid interface are increased compared to the coating TB0, leading to the increase in the crystallization temperature range and constitutional undercooling degree of γ-(Ni, Fe), which helps the transformation of columnar crystals to equiaxed crystals [25]. Hence, there are equiaxed crystals with good isotropic properties in coatings TB10–TB40 (Figure 6b–e). Moreover, as the content of TiB2 particles increases from 10 to 40 wt.%, it can be seen that the number of TiB2 particles increases and the size of TiB2 particles becomes larger, and the TiB2 particle agglomeration can be observed in coating TB40, which is explained in detail in the next section. In addition, compared with coating TB0, coatings TB10–TB40 show more dendrite boundaries and a smaller dendrite size, indicating that TiB2 particles have the effect of dendrite refining strengthening. From the perspective of solidification thermodynamics, there are two types of reasons for the fine dendrite strengthening: First, the ceramic particles can be fully wetted by the liquid phase, so the nucleation rate of dendrites will increase for the heterogeneous nucleation of ceramic particles, which causes the insufficient growth of dendrites and the dendrite refinement; second, the wetting property between the ceramic particles and the liquid phase is too poor to form effective heterogeneous nucleation, so the movement of the solid–liquid interface will be hindered by ceramic particles, which leads to the inhibiting effect for dendrites growth and can also play the role of dendrite refinement.
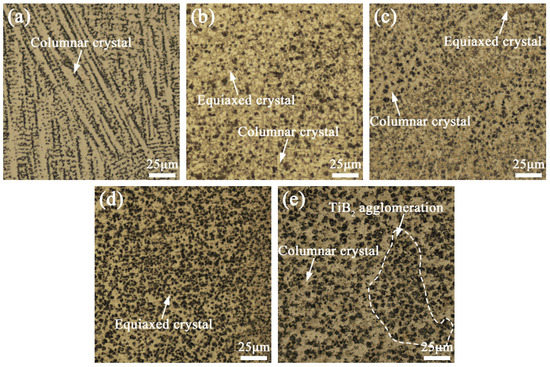
Figure 6.
OM (optical microscope) images of the microstructure of coatings (a) TB0, (b) TB10, (c) TB20, (d) TB30 and (e) TB40.
Therefore, the reasons for the microstructure refinement of TiB2/Inconel 718 alloy composite coatings can be explained by the wettability between the TiB2 particles and the liquid base phase γ-(Ni, Fe), which needs a low level of interface energy in the interface between the TiB2 particles and the liquid γ-(Ni, Fe) to maintain great wettability [26]. The interface energy can be judged by the type of solid–liquid crystal plane, which can be determined by lattice mismatch, and the lattice mismatch can be calculated by Equation (3) [27]:
where is the lattice mismatch, aγ is the lattice constant of γ-(Ni, Fe) (0.356–0.368 nm), and aT is the lattice constant of the TiB2 particle (0.303 nm) [28,29].
According to the calculation, the lattice mismatch between TiB2 and γ-(Ni, Fe) is between 14.89 and 17.66%, indicating that the crystal plane belongs to the semi-eutectic plane (5% < < 25%), of which the interface energy is relatively low (200–500 mJ/m2). Therefore, the wettability between TiB2 particles and γ-(Ni, Fe) is good enough to promote the heterogeneous nucleation of TiB2 particles. In addition, compare the thermal conductivity λ and the thermal diffusivity α () of Inconel 718 alloy and TiB2 particles form the thermal properties in Table 4: λ(TiB2) = 25 W/(m·K) > λ(γ-(Ni, Fe)) = 11.4 W/(m·K), α(TiB2) = 5.98 × 10⁻⁶ m2/s > α(γ-(Ni, Fe)) = 2.08 × 10⁻⁶ m2/s. It can be found that the TiB2 particles have higher thermal diffusivity and thermal conductivity than γ-(Ni, Fe), indicating that TiB2 particles have a higher cooling rate during solidification, and it results in the temperature of TiB2 particles being lower than that of the surrounding liquid phase, which provides favorable thermal conditions for the heterogeneous nucleation on TiB2 particles. Therefore, it is the effect of heterogeneous nucleation on TiB2 particles that promotes the dendrite refinement of TiB2/Inconel 718 alloy composite coatings.
Table 4.
Thermal properties of Inconel 718 alloy and TiB2 particles [30,31].
In order to illustrate the influence of TiB2 particles on the dendrite size in composite coatings, at least 60 primary dendrite arm spacings (PDAS) of dendrites in each coating were measured, and the results are shown in Figure 7a. It can be noted that the PDAS decreases from 8.99 to 4.28 μm as the content of TiB2 particles increases from 0 to 30 wt.%, but as the content of TiB2 particles increases to 40 wt.%, the PDAS increases to 5.54 μm instead with large deviation (±2.66 μm), indicating the uneven microstructure in coating TB40. Due to the negative correlation between dendrite size and cooling rate [32], the influence of TiB2 particles content on the PDAS may be related to the change in the cooling rate, which is affected by the comprehensive effect of the following two factors [33]. Factor 1: Compared with the Inconel 718 alloy coating, the TiB2/Inconel 718 alloy composite coating has higher thermal conductivity and thermal diffusion coefficient, resulting in a shorter solidification time and larger cooling rate; factor 2: The addition of TiB2 particles will lead to the decrease in the Inconel 718 alloy content, causing the increase in the heat released during solidification, which in turn leads to a longer solidification time and lower cooling rate.
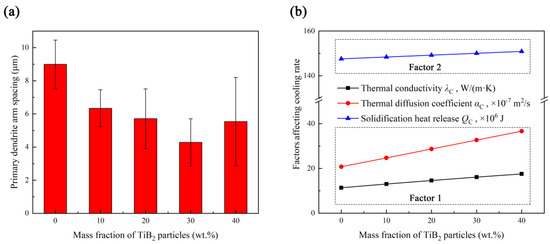
Figure 7.
(a) Primary dendrite arm spacing distribution and (b) cooling rate influence factors of coatings with different TiB2 particles content.
In order to determine the effect of TiB2 particles content on the cooling rate, it is necessary to quantitatively calculate the following influencing factors. The thermal conductivity and thermal diffusion coefficient of the TiB2/Inconel 718 alloy composite coating can be calculated by the following formulas [34]:
where and are the volume fraction and mass fraction of TiB2 particles, and , , and are thermal conductivity, density, specific heat and thermal diffusion coefficient, respectively (the subscripts C, M and P represent composite coating, Inconel 718 alloy and TiB2 particles).
Taking 1 kg of Inconel 718 alloy and 1 kg of TiB2 particles as an example, of which the heat released during solidification can be calculated by and , respectively, when the temperature decreases from 2980 (the melting point of TiB2 particles) to 1340 °C (the crystallization temperature of Inconel 718 alloy), it turns out that and are 1475.8 and 1558 kJ. Hence, the heat released during the solidification of coatings with different TiB2 particles content can be calculated by Equation (9):
The calculated cooling rate influence factors are as shown in Figure 7b. As the content of TiB2 particles increases from 10 to 40 wt.%, , and increase from 13.05 W/(m·K), 24.73 × 10⁻⁷ m2/s and 148.41 × 10⁶ J to 17.55 W/(m·K), 36.67 × 10⁻⁷ m2/s and 150.87 × 10⁶ J. When the content of TiB2 particles is at a low level (10 and 20 wt.%), factor 1 plays a dominant role in decreasing the PDAS, indicating the increase in TiB2 particles content is conducive to the increase in the thermal conductivity and thermal diffusion coefficient of the coating, which can effectively reduce the solidification time and increase the cooling rate. When the content of TiB2 particles increases to 30 wt.%, the PDAS will still decrease for the positive effect of factor 1, but the trend of decrease is slower than that of a low TiB2 particles content, which can be related to the negative effect of factor 2 for the heat released during solidification is up to 150.05 × 10⁶ J. However, the PDAS increases when the TiB2 particles content increases to 40 wt.%, indicating factor 2 has taken the dominant role in influencing the cooling rate, of which the heat released during solidification further increases to 150.87 × 10⁶ J.
3.3. TiB2 Particles Distribution
Figure 8a shows the SEM image of the microstructure of coating TB0. It can be observed that coating TB0 contains the gray matrix phases and white precipitate phases which are distributed in chains at the dendrite gaps. Figure 8b is the high magnification of the microstructure of coating TB0; the EDS line scan was carried out on the white precipitate phases, and the results are shown in Figure 8e. It can be found that Nb and Mo are segregated toward the dendrite boundary areas and highly enriched in white precipitate phases, and Ni, Fe and Cr are segregated to the gray matrix phases and relatively depleted in white precipitated phases. The EDS analysis was carried out on white precipitate phase and gray matrix phase, and the results are as shown in Figure 8f,g. It displays that the content of Nb and Mo in the white precipitated phase is as high as 22.31 and 7.39 wt.%, which is higher than that of the gray matrix phase of 2.92 and 1.74 wt.%, while the content of Ni, Fe and Cr in the white precipitated phase is 42.36, 10.24 and 9.57 wt.%, respectively, which is lower than that of the gray matrix phase. For elements such as Nb and Mo with the solute partition coefficient of less than 1, their content in the liquid phase is higher than that in the solid phase, they will gradually enrich at the dendrite boundaries as the solidification process progresses and at the end of solidification, the eutectic reaction of L → γ + Laves occurs, leading to the precipitation of the Laves phase enriched in elements such as Nb and Mo [35]. Therefore, the white precipitated phases and the dark grey area should be Laves phases and γ-(Ni, Fe) phases, respectively. Since the Laves phase consumes a large amount of alloying elements that are beneficial to γ-(Ni, Fe), it has high hardness and brittleness, and it also is prone to become the place where crack initiation and expansion occur, which seriously affects the mechanical properties of coating TB0.
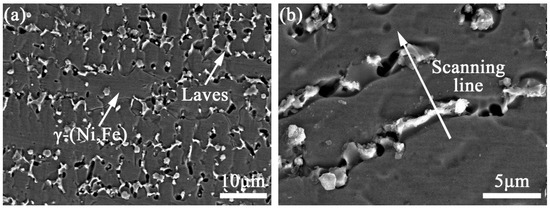
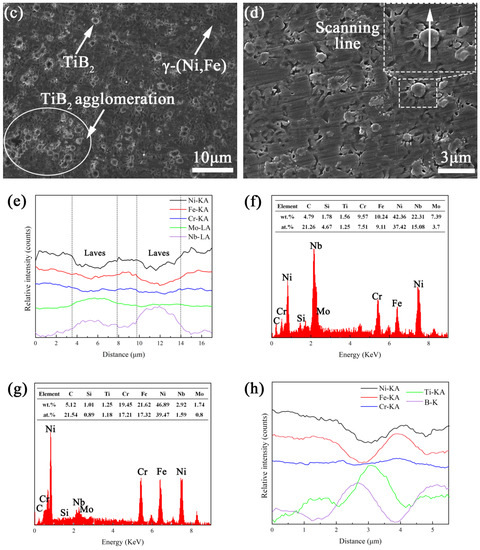
Figure 8.
SEM images of the microstructure of coatings (a,b) TB0 and (c,d) TB10, (e) EDS line scan of Laves and, EDS energy spectra of (f) Laves and (g) γ-(Ni, Fe), (h) EDS line scan of TiB2 particle
Figure 8c shows the SEM image of the microstructure of coating TB10. Compared with coating TB0, due to the addition of TiB2 particles, the constitutional undercooling and cooling rate of coating TB10 increases, so the microstructure is mainly equiaxed crystals and the dendrite size is significantly decreased, and the Laves phases are hardly observed along the dendrite boundaries. For the increase in the cooling rate, the dendrite spacing decreases, and the narrow dendrite boundaries are not conducive to the segregation of the Laves phase, resulting in the decrease in the segregation rate of elements such as Nb and Mo. At the same time, due to the reduction in the alloy element diffusion coefficient affected by the increase in the cooling rate, Nb, Mo and other elements are difficult to diffuse from the dendrite to the dendrite boundary at the end of solidification, resulting in the Laves phase not being able to be supplemented by elements, which is not conducive to its growth at the dendrite boundary [36,37]. In addition, it can also be seen that there is a rich area of dark gray particles in coating TB10, and the dark gray particles are mainly distributed along the dendrite boundaries from Figure 8d. The EDS line scan is carried out on the dark gray particle (Figure 8h), and the results show that Ti and B are highly enriched in the particle where Ni, Fe and Cr are relatively depleted, indicating the dark gray particle is a TiB2 particle.
Figure 9a,b are the SEM images of the microstructure of coatings TB20 and TB30. It can be noted that the dendrite size of coatings TB20 and TB30 is decreased compared with coating TB10, and the area of the TiB2 particles is significantly increased and exhibits a better dispersion effect, larger size and darker color. As the content of TiB2 particles increases to 40 wt.%, there are an obvious rich TiB2 particles zone and poor TiB2 particles zone (Figure 9c,d), indicating the heterogeneous microstructure where the dendrite size in the former is smaller than that of the latter. Moreover, the TiB2 particles present a larger size and more obvious edges compared with others. From the perspective of solidification kinetics, the above phenomenon is related to the critical capture speed of the solid–liquid interface and Marangoni convection intensity. When the speed of the solid–liquid interface is less than the critical value, the TiB2 particles are prone to be pushed by the solid–liquid interface, which causes the TiB2 particles to be mechanically embedded near the dendrite boundary. When the speed of the solid–liquid interface exceeds the critical value, the TiB2 particles will be engulfed by the solid–liquid interface easily and then exist in the dendrite. Shangguan defined the critical value of the solid–liquid interface speed , which can be described by the following formula [38]:
where is the atomic distance, and are the thermal conductivity of Inconel 718 alloy and TiB2 particles, is the interfacial energy difference, is the liquid phase viscosity, and is the shape constant related to the TiB2 particles.
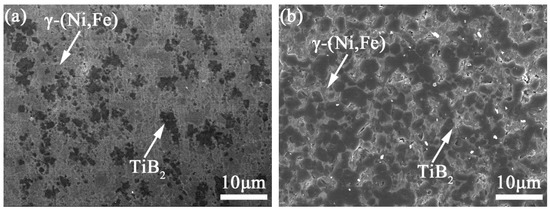
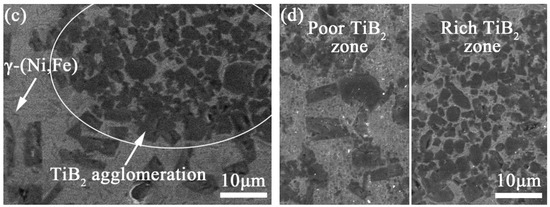
Figure 9.
SEM images of the microstructure of coatings (a) TB20, (b) TB30 and (c,d) TB40.
From the above analysis, the viscosity of the liquid phase will increase for the increase in the TiB2 particles content, resulting in the decrease in , which promotes the increase in the possibility of TiB2 particles being captured and the decrease in the pushing distance of the TiB2 particles. Therefore, when the TiB2 particles content is relatively low (10 wt.%), the TiB2 particles are not easily captured by the solid–liquid interface for the high , so the distance at which TiB2 particles are pushed by solid–liquid interface is relatively long, causing most TiB2 particles to exist near the dendrite boundary unevenly. Meanwhile, the above phenomenon conduces the heterogeneous nucleation effect of TiB2 particles, and the broken dendrite arms under strong Marangoni convection can also provide favorable conditions for heterogeneous nucleation, which is helpful to increase the nucleation rate. However, the dendrite refinement effect is relatively weak for the low content of TiB2 particles. When the TiB2 particles content is increased (20, 30 wt.%), the possibility of TiB2 particles being captured by the solid–liquid interface becomes bigger for the increase in the low , and due to the increase in the TiB2 particles content, the heterogeneous nucleation effect of TiB2 particles and broken dendrite arms is not significantly affected by the weaker Marangoni convection. Besides, the TiB2 particles are prone to be distributed homogeneously for the short distance at which the TiB2 particles are pushed and the adequate Marangoni convection. However, when the TiB2 particles content increases to 40 wt.%, the Marangoni convection is too weak to drive the rearrangement of TiB2 particles, leading to the uneven distribution of TiB2 particles in the molten pool, which is also not helpful for the formation of broken dendrite arms and their heterogeneous nucleation effect. Due to the uneven distribution, the TiB2 particles are prone to be in the dendrite in which the TiB2 particles are enriched for the high liquid phase viscosity, and the TiB2 particles are prone to exist along the dendrite boundary in which the TiB2 particles content is low for the low liquid phase viscosity.
3.4. Microhardness
Figure 10 displays the microhardness distributions of coatings with different TiB2 particles contents. Due to the existence of TiB2 particles with high hardness and elastic modulus, there are stress field and lattice distortion at the interface between the Inconel 718 alloy matrix and TiB2 particles, which can effectively hinder the dislocation slippage and improve the microhardness macroscopically. Therefore, coatings TB10–TB40 show higher microhardness than that of the substrate and coating TB0. Besides, the density of TiB2 particles (4.52 g/cm3) is less than that of Inconel 718 alloy (8.24 g/cm3), so the TiB2 particles are prone to be present at the top of the coating, resulting in the microhardness at the top being higher than that at the middle and bottom. In addition, for the dilution effect, there is a certain content of γ-(Ni, Fe) solid solution in the heat-affected zone which has experienced rapid thermal quenching during the laser cladding, so the microhardness of the heat-affected zone is between that of the coating and the substrate.
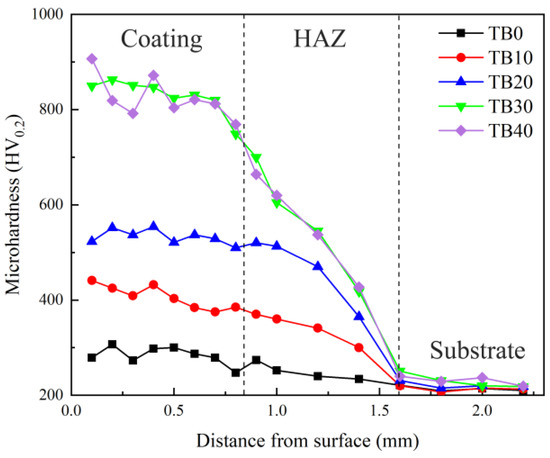
Figure 10.
Microhardness distributions of coatings with different TiB2 particles content.
When the TiB2 particles content is relatively low (10 wt.%, 20 wt.%), the average microhardness of coatings TB10 and TB20 is 402.67 and 531.44 HV0.2, respectively, which is 44.02% and 90.07% higher than coating TB0. As the TiB2 particles content increases to 30 wt.%, coating TB30 shows a smaller dendrite size and more dendrite boundaries, which are beneficial to the increase in the dislocation density and the enhancement of impediment to dislocation slippage. According to the Orowan mechanism of hard particles hindering the dislocation movement [39], the decrease in the average spacing among hard particles is beneficial to the increase in the external force required for the dislocation motion to bypass the hard particles, indicating the strong ability to hinder the dislocation movement. Hence, due to the great fine dendrite strengthening and dispersion strengthening in coating TB30, the average microhardness is as high as 844.33 HV0.2, which is 3.02 times that of coating TB0. However, as the TiB2 particles content continues to increase to 40 wt.%, the cooling rate of coating TB40 decreases instead, resulting in the increase in the dendrite size and the increase in the garin boundary numbers t, which is not conducive to the fine dendrite strengthening, and the dispersion strengthening also becomes weak for the uneven distribution of TiB2 particles, leading to the formation of a heterogeneous microstructure. Therefore, compared with coating TB30, coating TB40 shows larger microhardness fluctuation (792 HV0.2–907 HV0.2) and smaller average microhardness (832.43 HV0.2) which is 2.98 times that of coating TB0.
3.5. Bonding Strength
As the load applied by the scratch tester on the coating through the diamond indenter gradually increases, the degree of plastic deformation increases, resulting in the scratches becoming wider and deeper, which is shown in Figure 11a. We measured the average width of the scratch of each coating, and the results are shown in Table 5. It can be found that as the TiB2 particles content increases from 0 to 40 wt.%, the scratch width experiences a process of decreasing from 365.89 to 287.21 μm and then increasing to 300.87 μm, and it reaches the minimum value when the TiB2 particles content is 30 wt.%. The reason for the above change can be related to the microhardness at the bottom of the coating, which means the greater the microhardness at the bottom of the coating, the stronger the ability to resist plastic deformation, and the smaller the scratch width. The bottom microhardness of coatings TB0–TB40 is 252, 360, 513, 820 and 812 HV0.2, and it is obvious that the bottom microhardness of coatings TB30 and TB40 is relatively high, which leads to the small scratch width. From the acoustic emission signal diagram (Figure 11b), it can be seen that the acoustic emission signals of coatings all change suddenly under a certain load, which can be attributed to the change in the material to which the diamond head is in contact (Figure 11a), then the scratcher will detect a continuous and strong acoustic emission signal, and the load causing this phenomenon can be defined as the critical bonding load. According to the ASTM G171-03 norm, the bonding strength can be calculated by the following formula [40]:
where HSL is the bonding strength, LC is the critical bonding load, and dS is the scratch width.
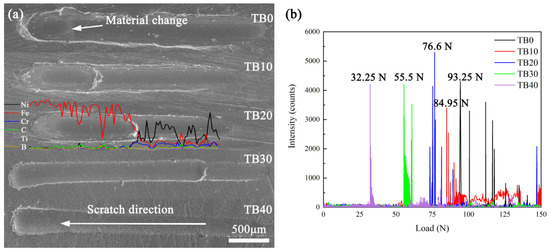
Figure 11.
(a) Scratch morphologies and (b) acoustic emission signals of coatings with different TiB2 particles content.
Table 5.
Results of the scratch test of coatings with different TiB2 particles content.
Table 5 displays the results of the scratch test of coatings with different TiB2 particles content. It can be seen that the bonding strength decreases from 1.785 to 0.908 GPa as the TiB2 particles content increases from 0 to 40 wt.%, which is similar to the effect of the TiB2 particles content on the dilution rate in the above analysis. Figure 12a is the element distribution of coating TB0 near the coating/substrate interface, where it can be found that Ni, Fe and Cr are the dominant elements at the bottom of coating TB0, and Fe is the dominant element in the substrate. As the scanning line crosses the interface, a notable content decrease in Ni, Fe and Cr and a notable content increase in Fe can be observed for the dilution. Since the solid solution strengthening which is caused by γ-(Ni, Fe) plays an important role in the bonding at the interface, the high content of γ-(Ni, Fe) is conducive to the increase in bonding strength. From the Ni and Fe content of coatings near the coating/substrate interface, it can be seen that as the TiB2 particles content increases from 0 to 40 wt.%, the content of Fe and Ni changes from 44.61 and 27.21 to 21.04 and 11.78 wt.% for the decrease in the dilution rate, and the decrease in their contents sum from 71.82 to 32.82 wt.% can also be observed. According to the Ni-Fe binary phase diagram, the solubility of Fe in γ-Ni is infinite [41], so the γ-(Ni, Fe) content will decrease with the increase in the TiB2 particles content, which is not conducive to the solid solution strengthening near the interface and harmful to the bonding strength. In addition, the good metallurgical bonding cannot be guaranteed in coating TB40 for the obvious cracks at the interface, which also helps the decrease in the bonding strength of coating TB40.
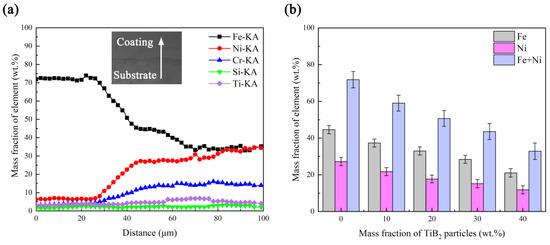
Figure 12.
(a) Element distribution of coating TB0 and (b) partial element distribution of coatings with different TiB2 particles contents near the coating/substrate interface.
3.6. Tribological Properties
Figure 13a is the friction coefficient curves of coatings with different TiB2 particles contents. It can be observed that all friction coefficients of coatings TB0–TB40 have undergone two stages of change, namely the running-in stage (Figure 13a-I) and the stable stage (Figure 13b-II). Due to the low surface microhardness of coating TB0, where the wear occurs quickly under the grinding ball, the running-in stage ends within only 0.8 s, and the friction coefficient in the stable stage fluctuates very sharply for the poor ability to coordinate the dislocation of coating TB0 with a coarse microstructure. For the existence of TiB2 particles, coatings TB10–TB40 show longer running-in stages, which are 1.6, 1.5, 2.6 and 2.9 min, respectively, and the friction coefficient in the stable stage tends to change steadily when the TiB2 particles content increases from 10 to 30 wt.%, which can be attributed to the finer and denser microstructure and more homogeneous distribution of TiB2 particles. However, when the TiB2 particles content increases to 40 wt.%, the non-uniform distribution of TiB2 particles leads to the poor uniformity of the microstructure, resulting in the significant fluctuations in the friction coefficient during the stable stage. Figure 13b shows the friction coefficients and wear rates of coatings with different TiB2 particles contents. As the TiB2 particles content increases from 0 to 30 wt.%, the friction coefficient and wear rate decrease from 0.461 and 5.65 × 10⁻⁶ g/(N·m) to 0.355 and 9.12 × 10⁻⁷ g/(N·m), but they increase to 0.389 and 1.39 × 10⁻⁶ g/(N·m) instead as the TiB2 particles content continues to increase to 40 wt.%.
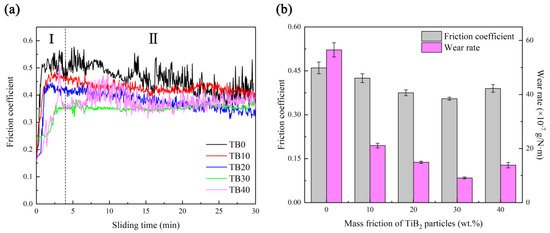
Figure 13.
(a) Fiction rate curves and (b) friction coefficients and wear rates of coatings.
Figure 14a shows the worn surface of coating TB0. Due to the fact that there are no TiB2 particles in coating TB0, of which the microhardness is relatively low and the resistance ability against the micro-cutting of the GCr15 steel ball is relatively poor, there are severe plastic deformation, obvious grooves and delamination on the worn surface. The crack sensitivity increases for the positive effect of the nucleation and expansion of the cracks which cannot be suppressed by the coarse dendrites, where the high-content Laves phases with the form of continuous long chains exist in coating TB0, resulting in the presence of micro-tearing and formation of abrasive debris, so the wear is aggravated, and there are obvious grooves for the plastic deformation. In addition, some of the debris that has been peeled off will adhere to the surface of the wear scar for the frictional heat during the friction process, causing the formation of a layered structure, which is characteristic of typical adhesive wear. The EDS analysis was carried out on the worn surface of coating TB0, and the results show that the contents of O and Fe are 20.69 and 24.43 wt.% respectively, indicating the worn surface was oxidized for the friction heat. Therefore, the wear mechanism of coating TB0 is multiple-plastic wear, adhesive wear and oxidative wear. Compared with coating TB0, the resistance ability of coating TB10 and TB20 against plastic deformation is enhanced for the improvement of microhardness, decrease in dendrite size and support of TiB2 particles, showing a better wear-resistant strengthening effect, and there is no layered structure, only micro-tearing, grooves and cracks on the worn surface (Figure 14b,c). The reason for the above phenomenon is that the TiB2 particles content of coatings TB10 an TB20 is relatively low, and the reinforcing effect of the TiB2 particles is not enough to prevent the nucleation and propagation of the cracks for the alternating load caused by the multiple squeezing of GCr15 grinding balls, and micro-tearing is prone to exist, leading to the peeling off of worn debris and aggravation of groove formation. Hence, the multiple-plastic wear and abrasive wear are the main wear mechanisms of coatings TB10 and TB20.
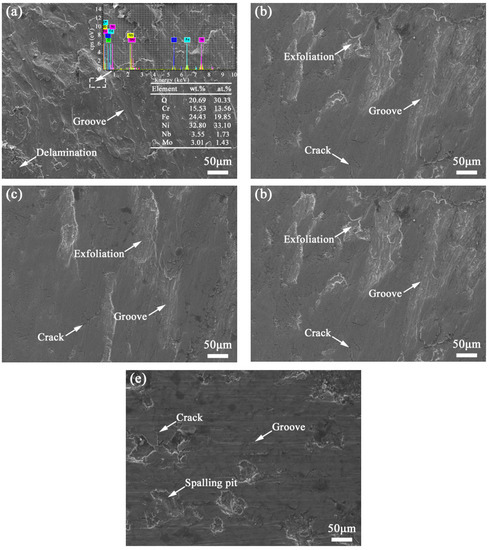
Figure 14.
SEM images of the worn surface of coatings (a) TB0, (b) TB10, (c) TB20, (d) TB30 and (e) TB40.
When the TiB2 particles content is increased to 30 wt.%, the microhardness of coating TB30 is further improved, and the uniform distribution of TiB2 particles helps to form wear-resistant fulcrums, which effectively resist the micro-cutting effect of GCr15 grinding balls. Besides, the uniform and dense dendrites in coating TB30 can effectively coordinate the alternating stress to prevent the nucleation and propagation of cracks, so there are almost no obvious plastic deformation, micro-tearing and layered structure on the worn surface, where only a few cracks exist (Figure 14d). The above phenomenon indicates the main wear mechanism of coating TB30 is micro-cutting wear, accompanied by abrasive wear. As the TiB2 particles content increases further, compared with coating TB30, the wear resistance of coating TB40 is reduced, and there are obvious peeling pits, cracks and furrows on the worn surface (Figure 14e). Although the surface of coating TB40 can effectively avoid plastic deformation for the high microhardness, due to the high hardness and brittleness of the region which is rich in TiB2 particles for the uneven distribution of TiB2 particles and the large residual stress in the weak bonding interface between the TiB2 particle and Inconel 718 matrix for the difference in the thermal expansion coefficients, the TiB2 particles are easily detached from coating TB40 during the friction process, aggravating wear and forming deep grooves. Therefore, micro-cutting is prone to occur on the worn surface, which leads to the formation of peeling pits. The wear mechanism of coating TB40 includes micro-brittle fracture wear and abrasive wear.
Figure 15 shows the SEM images of wear debris of coatings with different TiB2 particles content. It can be seen that the wear debris of coating TB0 exhibits typical large-scale lamellar characteristics, indicating severe plastic deformation (Figure 15a). When the TiB2 particles content increases from 10 to 30 wt.%, the number of large-sized lamellar debris is gradually reduced, and the number of dense and fine granular debris is increased, of which the wear debris of coatings TB20 and TB30 shows a relatively small average size, indicating the wear resistance is enhanced and the wear mechanism is changed from multiple-plastic deformation wear to abrasive wear and micro-cutting wear (Figure 15b,c,e). When the TiB2 particles content increases to 40 wt.%, the number of large-sized lamellar debris increases for the micro-brittle fracture wear is dominant in the wear mechanism, of which abrasive wear also exists for the small amount of granular debris (Figure 15f). The EDS surface scanning analysis was carried out for region D in the wear debris of coating TB40, and the results are as shown in Figure 15d. It can be found that the wear debris is mainly composed of elements Ni and Fe, and there are also certain contents of elements O, Ti, B, Nb and Mo, indicating the formation of oxides and the detachment of TiB2 particles.
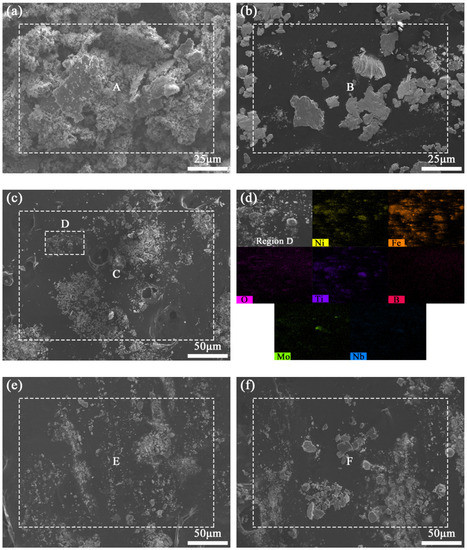
Figure 15.
SEM images of the wear debris of coatings (a) TB0, (b) TB10 and (c) TB20, (d) EDS surface scanning analysis of region D, SEM images of the wear debris of coatings (e) TB30 and (f) TB40.
The EDS analyses of wear debris above were carried out, and the results are shown in Table 6. It can be seen that the content of element O in the wear debris of coating TB0 is as high as 38.23 wt.%, indicating the presence of oxidative wear. Besides, due to the high content of the chain Laves phase, the micro-tearing is prone to happen, resulting in there being a certain content of elements Nb (1.73 wt.%) and Mo (1.43 wt.%) in the wear debris. As the TiB2 particles content increases from 10 to 40 wt.%, the resistance ability of plastic deformation against the GCr15 grinding ball is enhanced for the increase in the surface microhardness, while there is also debris from the GCr15 grinding ball during the friction process. Therefore, compared with the wear debris of coating TB0, the content of element Fe in the wear debris of coatings TB10–TB30 is higher, increasing from 31.63 to 42.75 wt.%. In addition, the surface microstructure of the coating becomes fine and dense, causing the oxygen to be difficult to penetrate into the coating and form the oxidation, so it can be found that the content of element O in coatings TB30 and TB40 is relatively low, which is 25.82 and 26.76 wt.%, respectively. In addition, the contents of elements Ti and B in the wear debris also increase for the increase in the TiB2 particles content, which is especially obvious in the wear debris of coating TB40 for the high possibility to detach from the coating, where the content of elements Ti and B in the wear debris are as high as 6.15 and 7.55 wt.%.
Table 6.
Chemical composition of materials in different regions (wt.%).
4. Conclusions
In this article, TiB2-reinforced Inconel 718 alloy composite coatings were prepared on carbon steel by laser cladding. The effects of the content of TiB2 particles on the macro-morphology, dilution rate, microstructure, bonding strength, microhardness and tribological properties of the composite coating were studied. The conclusions are as follows:
- 1)
- Inconel 718 alloy coating exhibits a continuous, uniform and flat surface morphology, the lap interface between single cladding layers is good, the coating and substrate are metallurgically bonded with a high bonding strength (1.785 GPa), and the dilution rate is as high as 23.19%. As the content of TiB2 particles increases from 10 to 40 wt.%, the composite coating shows darker, more discontinues and rough surface morphology, where the overlapping interface becomes worse, and the dilution rate and bonding strength are decreased from 20.77% and 1.753 to 9.38% and 0.908 GPa, respectively.
- 2)
- TiB2/Inconel 718 alloy composite coatings are consisted of a γ-(Ni,Fe) matrix phase, reinforced-phase TiB2, hard phases such as TiB, TiC, Ni3B, CrB4 and Cr23C6 produced by the reaction and a small amount of precipitation Laves. Compared with the Inconel 718 alloy coating, TiB2/Inconel 718 alloy composite coatings show more equiaxed crystals for the increase in constitutional undercooling. From the perspective of solidification thermodynamics, as the content of TiB2 particles is increased from 10 to 30 wt.%, the cooling rate increases for the increase in thermal conductivity and thermal diffusion coefficient, leading to the decrease in the dendrite size, and the primary dendrite arm spacing decreases from 6.47 to 4.28 μm. However, as the content of TiB2 particles increases to 40 wt.%, the cooling rate decreases for the increase in heat released by solidification, so the dendrite size increases, and the primary dendrite arm spacing increases to 5.54 μm.
- 3)
- Compared with the Inconel 718 alloy coating, TiB2/Inconel 718 alloy composite coatings have almost no Laves phase due to the high cooling rate. From the perspective of solidification dynamics, the uniformity of TiB2 particles becomes better for the decrease in the critical capture speed of the solid–liquid interface which indicates that the distance at which TiB2 particles are pushed becomes shorter. However, as the content of TiB2 particles increases to 40 wt.%, the Marangoni convection is too weak to drive the rearrangement of TiB2 particles, so TiB2 particles agglomeration can be observed in the composite coating, leading to the heterogeneous microstructure.
- 4)
- Compared with the Inconel 718 alloy coating, due to the addition of TiB2 particles, the decrease in the dendrite size and the content of the Laves phase, the effects of dispersion strengthening, fine dendrite strengthening and solid solution strengthening in TiB2/Inconel 718 alloy composite coatings are stronger, resulting in the microhardness and tribological properties being significantly improved. As the content of TiB2 particles increases from 10 to 30 wt.%, the average microhardness increases from 402.67 to 844.33 HV0.2, the friction coefficient and wear rate decrease from 0.461 and 5.65 × 10⁻⁶ g/(N·m) to 0.355 and 9.12 × 10⁻⁷ g/(N·m) and the wear mechanism is changed from severe multi-plastic wear and abrasive wear to micro-cutting wear and a certain degree of abrasive wear. However, when the content of TiB2 particles is as high as 40 wt.%, due to the uneven distribution of TiB2 particles, the microhardness fluctuates greatly from 792 to 907 HV0.2, and the average microhardness is 832.43 HV0.2, leading to the increase in the friction coefficient and wear rate, which are 0.389 and 1.39 × 10⁻⁶ g/(N·m), respectively, and the wear mechanism changes to micro-brittle fracture wear and abrasive wear.
Author Contributions
Conceptualization, B.T. and Y.T.; methodology, B.T.; software, B.T.; validation, B.T. and Y.T.; formal analysis, B.T.; investigation, T.X. and Z.S.; resources, Y.T. and Z.S.; data curation, T.X., Z.S., and X.L.; writing—original draft preparation, B.T., Y.T., and T.X.; writing—review and editing, Y.T., T.X., and X.L.; visualization, B.T., Y.T., and T.X.; supervision, Y.T., T.X., and T.X.; project administration, Y.T. All authors have read and agreed to the published version of the manuscript.
Funding
This research was funded by Nature Science Foundation of China, grant number No. 51708553.
Conflicts of Interest
The authors declare no conflict of interest.
References
- Liu, H.X.; Wang, C.Q.; Zhang, X.W.; Jiang, Y.H.; Cai, C.X.; Tang, S.J. Improving the corrosion resistance and mechanical property of 45 steel surface by laser cladding with Ni60CuMoW alloy powder. Surf. Coat. Technol. 2013, 228, 296–300. [Google Scholar] [CrossRef]
- Huang, G.K.; Qu, L.D.; Lu, Y.Z.; Li, H.G.; Qin, Z.X.; Lu, X. Corrosion resistance improvement of 45 steel by Fe-based amorphous coating. Vacuum 2018, 153, 39–42. [Google Scholar] [CrossRef]
- Zhu, C.; Zhang, B.; Zheng, S. Laser cladding nickel-titanium carbide composite coating on a 45carbon steel: Preparation, microstructure and wear behavior. Mater. Werkst. 2020, 51, 247–256. [Google Scholar] [CrossRef]
- Cai, W.; Meng, F.N.; Gao, X.Y.; Hu, J. Effect of QPQ nitriding time on wear and corrosion behavior of 45 carbon steel. Appl. Surf. Sci. 2012, 261, 411–414. [Google Scholar] [CrossRef]
- Luo, X.X.; Yao, Z.J.; Zhang, P.J.; Chen, Y.; Yang, H.Q.; Wu, X.F.; Zhang, Z.L.; Lin, Y.H.; Xu, S.J. Tribological behaviors of Fe–Al–Cr–Nb alloyed layer deposited on 45 steel via double glow plasma surface metallurgy technique. Trans. Nonferr. Met. Soc. China 2015, 25, 3694–3699. [Google Scholar] [CrossRef]
- William, E.F. Metal additive manufacturing: A review. Mater. Eng. Perform. 2014, 23, 1917–1928. [Google Scholar]
- Weng, F.; Chen, C.Z.; Yu, H.J. Research status of laser cladding on titanium and its alloys: A review. Mater. Des. 2014, 58, 412–425. [Google Scholar] [CrossRef]
- Su, X.; Tao, W.; Chen, Y.B.; Chen, X.; Tian, Z. Microstructural characteristics and formation mechanism of laser cladding of titanium alloys on carbon fiber reinforced thermoplastics. Mater. Lett. 2017, 195, 228–231. [Google Scholar] [CrossRef]
- Shu, D.; Li, Z.G.; Zhang, K.; Yao, C.W.; Li, D.Y.; Dai, Z.B. In Situ synthesized high volume fraction WC reinforced Ni-based coating by laser cladding. Mater. Lett. 2017, 195, 178–181. [Google Scholar] [CrossRef]
- Sun, R.L.; Lei, Y.W. Microstructure and wear resistance of laser clad layer of TiN on TC4 alloy. Tianjin Polytech. Univ. 2007, 26, 57–59. [Google Scholar]
- Selamat, M.S.; Watson, L.M.; Baker, T.N. XRD and XPS studies on surface MMC layer of SiC reinforced Ti–6Al–4V alloy. Mater. Process. Technol. 2003, 142, 725–737. [Google Scholar] [CrossRef]
- Vreeling, J.A.; Ocelik, V.; De Hosson, J.T.M. Ti–6Al–4V strengthened by laser melt injection of WCp particles. Acta Mater. 2002, 50, 4913–4924. [Google Scholar] [CrossRef]
- Chi, Y.M.; Gu, G.C.; Yu, H.J.; Chen, C.Z. Laser surface alloying on aluminum and its alloys: A review. Opt. Lasers Eng. 2018, 100, 23–27. [Google Scholar] [CrossRef]
- Liu, J.L.; Yu, H.J.; Chen, C.Z.; Dai, J.J. Research and development status of laser cladding on magnesium alloys: A review. Opt. Lasers Eng. 2017, 93, 195–210. [Google Scholar] [CrossRef]
- Awasthi, R.; Limaye, P.K.; Kumar, S.; Kushwaha, R.P.; Viswanadham, C.S.; Srivastava, D. Wear characteristics of Ni-based hardfacing alloy deposited on stainless substrate by laser cladding. Metall. Mater. Trans. A 2015, 46, 1237–1252. [Google Scholar] [CrossRef]
- Zhang, Y.; Wu, L.M.; Guo, X.Y.; Kane, S. Additive manufacturing of metallic materials: A review. Mater. Eng. Perform. 2018, 27, 1–13. [Google Scholar] [CrossRef]
- Gopinath, M.; Karmakar, D.P.; Nath, A.K. In-process detection of microstructural changes in laser cladding of in-situ Inconel 718/TiC metal matrix composite coating. J. Alloy. Compd. 2018, 740, 545–558. [Google Scholar]
- Gopinath, M.; Karmakar, D.P.; Nath, A.K. Monitoring and assessment of tungsten carbide wettability in laser cladded metal matrix composite coating using an IR pyrometer. J. Alloy. Compd. 2017, 714, 514–521. [Google Scholar]
- Xu, B.S. Physics and Chemistry of Material Interface; Chemical Industry Press: Beijing, China, 2006. [Google Scholar]
- Cai, Z.Q.; Wang, L.; Yang, G. Ceramic Materials Dictionary; Chemical Industry Press: Beijing, China, 2002. [Google Scholar]
- He, L.; Tan, Y.F.; Wang, X.L.; Jing, Q.F.; Hong, X. Tribological properties of laser cladding TiB2 particles reinforced Ni-base alloy composite coatings on aluminum alloy. Rare Met. 2014, 34, 789–796. [Google Scholar] [CrossRef]
- Heiple, C.R.; Rooper, J.R. Mechanism for Minor Element Effect on GTA Fusion Zone Geometry. Weld. J. 1982, 61, 97–102. [Google Scholar]
- Limmaneevichitr, C.; Kou, S. Experiments to Simulate Effect of Marangoni Convection on Weld Pool Shape. Weld. J. N. Y. 2000, 78, 231–237. [Google Scholar]
- Corcione, M. Empirical correlating equations for predicting the effective thermal conductivity and dynamic viscosity of nanofluids. Energy Convers. Manag. 2011, 52, 789–793. [Google Scholar] [CrossRef]
- Lei, J.B.; Shi, C.; Zhou, S.F.; Gu, Z.J.; Zhang, L.C. Enhanced corrosion and wear resistance properties of carbon fiber reinforced Ni-based composite coating by laser cladding. Surf. Coat. Technol. 2018, 334, 274–285. [Google Scholar] [CrossRef]
- Schrader, M.E. Young-Dupre Revisited. Langmuir 1995, 11, 3585–3589. [Google Scholar] [CrossRef]
- Xu, H.J. Material Science Foundation; Beijing University of Technology Press: Beijing, China, 2001. [Google Scholar]
- Yoshizawa, I.; Urao, R.; Hori, Y.; Akaishi, K. Characterization of TiB2 coated layer by X-ray lattice constant measurement. J. Nucl. Mater. 1981, 103, 267–272. [Google Scholar] [CrossRef]
- Guenzburger, D.; Ellis, D.E. Magnetic and electronic properties of γ-Fe and γ-Fe/Al particles in copper. Phys. Rev. B 1995, 52, 13390–13398. [Google Scholar] [CrossRef]
- Nie, P.L.; Ojo, O.A.; Li, Z.G. Numerical modeling of microstructure evolution during laser additive manufacturing of a nickel-based superalloy. Acta Mater. 2014, 77, 85–95. [Google Scholar] [CrossRef]
- Li, H.P. The numerical simulation of the heterogeneous composition effect on the combustion synthesis of TiB2 compound. Acta Mater. 2003, 51, 3213–3224. [Google Scholar] [CrossRef]
- Huang, Y.J.; Zeng, X.Y.; Hu, Q.W.; Zhou, S.F. Microstructure and interface interaction in laser induction hybrid cladding of Ni-based coating. Appl. Surf. Sci. 2009, 255, 3940–3945. [Google Scholar] [CrossRef]
- Wang, Y. Investigation on Fabrication and Solidification Behavior of TiB2 Particulate Reinforced Magnesium Matrix Composites. Master’s Thesis, Jilin University, Changchun, China, 2007. [Google Scholar]
- Mortensen, A.; Michaud, V. Infiltration of fiber preforms by a binary alloy: Part I Theory. Metall. Mater. Trans. 1990, 21, 205–207. [Google Scholar] [CrossRef]
- Antonsson, T.; Fredriksson, H. The effect of cooling rate on the solidification of INCONEL 718. Metall. Mater. Trans. B 2005, 36, 85–96. [Google Scholar] [CrossRef]
- Sgk, M.D.; Sivakumar, K.; Prasad, R.K.; Kamaraj, M. Effect of weld cooling rate on laves phase formation in Inconel 718 fusion zone. J. Mater. Process. Technol. 2014, 214, 358–364. [Google Scholar]
- Yang, Q.Q.; Liu, Y.; Li, Y.X. Hydrogen diffusion coefficient in liquid metals evaluated by solid−gas eutectic unidirectional solidification. Trans. Nonferr. Met. Soc. China 2014, 24, 4030–4037. [Google Scholar] [CrossRef]
- Shangguan, D.; Ahuja, S.; Stefanescu, D.M. An analytical model for the interaction between an insoluble particle and an advancing solid/liquid interface. Metall. Trans. A 1992, 23, 669–680. [Google Scholar] [CrossRef]
- Zhang, Z.; Chen, D.L. Contribution of Orowan strengthening effect in particulate-reinforced metal matrix nanocomposites. Mater. Sci. Eng. A 2008, 483, 148–152. [Google Scholar] [CrossRef]
- Wang, B.C.; Chang, E.; Lee, T.M.; Yang, C.Y. Changes in phases and crystallinity of plasma-sprayed hydroxyapatite coatings under heat treatment: A quantitative study. Biomed. Mater. Res. 1995, 29, 1483–1492. [Google Scholar] [CrossRef]
- Swartzendruber, L.J.; Itkin, V.P.; Alcock, C.B. The Fe–Ni (iron–nickel) system. J. Phase Equilibria 1991, 12, 288–312. [Google Scholar] [CrossRef]
© 2020 by the authors. Licensee MDPI, Basel, Switzerland. This article is an open access article distributed under the terms and conditions of the Creative Commons Attribution (CC BY) license (http://creativecommons.org/licenses/by/4.0/).