Article

Softening Behaviors of Severely Deformed Zn Alloy Studied by the Nanoindentation

1
College of Mechanical Engineering, Zhejiang University of Technology, Hangzhou 310014, China
2
Key Laboratory of Automobile Materials, Ministry of Education, College of Materials Science and Engineering, Jilin University, Changchun 130025, China
3
Advanced Materials Research Center, Northwest Institute for Non-Ferrous Metal Research, Xi’an 710049, China
4
Datang Northeast Electric Power Test and Research Institute Co., Ltd., Changchun 130000, China
5
Institute of Solid Mechanics, Beihang University, Beijing 100191, China
*
Author to whom correspondence should be addressed.
Coatings 2020, 10(9), 803; https://doi.org/10.3390/coatings10090803
Submission received: 27 April 2020 / Revised: 23 June 2020 / Accepted: 26 June 2020 / Published: 20 August 2020
(This article belongs to the Section Tribology)

Abstract

:
Zamak 3 alloy treatment by sliding-friction treatment (SFT) was investigated by nanoindentation to explore the influence of microstructure and strain rate on nanoscale deformation at room temperature. The results show that obvious material softening occurs in the ultrafine-grained (UFG) Zn alloy and strain-hardening happens in the twinning-deformed layer, respectively. It can be concluded that almost constant values of V in the UFG Zn alloy contribute to the dislocations moving along the grain boundary (GB) not cross the grain interior. In the twinning-deformed layer, the highly frequent dislocation–twinning boundary (TB) interactions are responsible for subsequent inverse Cottrell–Stokes at lower stress, which is quite different from dislocation–dislocation reaction inside the grain in their coarse-grained (CG) counterpart.

1. Introduction

Grain size (d) refinement is a well-known strengthening mechanism for improving the mechanical properties of metallic materials [1,2,3,4,5,6,7]. In particular, materials with ultrafine/nano grain size often possess a higher strength compared with their coarse-grained (CG) counterparts. Nevertheless, some researchers have reported that grain refinement produced by severe plastic deformation (SPD) would give rise to the material softening in some metals after serious work hardening [8,9]. This means that traditional grain refinement strengthening mechanism such as grain boundaries (GBs) act as strong barriers to dislocation slipping would be in failure in these materials. Some other deformation modes would dominate the plastic strain, which need to be further understood.
Currently, there exists some distinct statements explaining the softening phenomena in these refined materials. For example, Mazilkin et al. have found the pronounced softening in the binary Al–Zn alloys produced by the SPD, due to the almost full decomposition of the supersaturated solid solution [9]. Choi et al. reported the decreased hardness in the Zn–22Al after high-pressure torsion (HPT), causing by the different contributions of GBs to the plastic deformation on the different interfaces [10]. Feldner et al. have observed a weaken hardness tendency in the Zn–20Al alloy after grain refinement, attributing to the superplasticity occurred in the local deformation [11]. To explore this issue, more studies are necessary to explore its underlying deformation mechanisms and here we chosen the Zamak 3 alloy, which is located in the eutectic composition of the binary Zn–Al alloy system. Two reasons for selecting this material: one is that the grain in these alloys is readily refined to the submicrometer or nanometer via SPD, the other is that softening can occur easily in the Zn–Al alloy.
For the Zn alloys, the relatively low inherent melting temperature provides a high driving force for dynamic recovery during its plastic deformation, which prevents the dislocation density from increasing and causes a lower rate of dislocation accumulation [12]. This means that conventional transmission electron microscopy (TEM) observation of the deformed materials can hardly capture available microstructures evolution related with deformation mechanisms. To date, there have been few efforts to monitor the variation of kinetic and thermodynamic characteristics such as activation volume (V) in the Zn alloys, which have been widely used to uncover the deformation mechanisms of metals. Our recent studies have plotted the curves of continuous variation V versus stress in the nanoindentation creep, to explore more detailed deformation mechanisms such as dislocation slip, the variation length of dislocation segment and dislocation pinning/depinning in the plasticity of the nanocrystalline metals [13]. Therefore, analysis on the continuous variation V versus stress of the nanoindentation tests is an excellent method to explore the deformation processes from the initial unstable to final steady creep behavior in the Zn alloys.
The objective of this study was first, to provide the detailed information on the microstructure evolution of Zn alloy after processing by sliding-friction treatment (SFT), then to evaluate the influence of these different microstructures on the hardness and nanoindentation creep behaviors at room temperature, and finally to understand the occurrence of softening and deformation mechanisms of creep behaviors.

2. Experimental Procedures

Commercial alloy Zamak 3 is chosen to characterize the detailed chemical compositions by the scanning electron microscopy (SEM, Zeiss 500, Oberkochen, Germany) with linked energy dispersive spectrometers (EDS) analysis. Zamak 3 is a chemical composition of Zn–4.1Al–0.028Mg–0.003Cu (wt.%). Before the SFT, the plates were annealed in vacuum (0.1 Pa) at 350 °C for 12 h and cooled down to room temperature in furnace, in order to obtain homogeneous microstructure in the coarse grains. Then, a plate with a size of 100 mm × 200 mm × 3 mm were processed by the SFT under liquid nitrogen and the procedures were similar to those used for producing gradient nanostructure materials in our previous reports [14,15]. To remove residual stresses within the deformed samples, the as-received samples were annealed at temperature of 40 °C for 7 days in a furnace with flowing argon atmosphere. Sulfate and sodium chromate are used to produce corrosive Zn alloy samples. The corrosive Zn alloy sample was firstly characterized by the optical microscope (OM, Leica MPS 30, Wetzlar, Germany) and laser confocal microscopy (LCM, OLS4500, Olympus, Tokyo, Japan) and then the microstructures of the SFTed Zn–Al alloy were investigated by TEM (FEI Tecnai F30, Hillsboro, OR, USA) with an accelerating voltage of 200 keV. The cross-sectional slices cutting from the deformed samples (7 mm × 4 mm × 1 mm) were thinned down to ~25 μm by mechanical grinding using the SiC papers. Two sheets posed surface to surface were bonded onto a copper ring using glue and finally were cut, polished and dimpled by argon-ion milling (EMRES101, Leica, Wetzlar, Germany) at 5 kV. The detailed of the TEM samples preparation procedures can be seen in the ref. [16].
Nanoindentation specimens were ground with a series of SiC sandpaper and then polished with colloidal silica slurry. Commercial nanoindenter (KLA G200, Milpitas, CA, USA) equipped with a Berkovich diamond indenter used to conduct the nanoindentation creep behaviors at room temperature. Calibration for machine stiffness and tip contact area were performed on the standard fused silica. Elastic modulus (E) and hardness (H) as a function of indenter displacement are derived from the continuous stiffness measurement (CSM) mode with a harmonic amplitude of 2 nm and a frequency of 45 Hz. Nanoindentation creep tests were performed via loading strain rate ( ε ˙ L ) from 0.004/s to 0.4/s to depth of 2000 nm with a holding time of 500 s at the maximum load. The indenter was unloaded to 10% of the maximum load and held for 200 s for thermal drift correction to obtain the actual thermal drift rate and then used to correct the total measured displacement. Besides that, the thermal drift rate was limited below 0.02 nm/s prior to testing and a minimum of 10 indentation tests were repeated in each condition.

3. Results

3.1. Microstructural Observation

Figure 1 gives the OM image of cross profile in the deformed sample after SFT. The material can be simple divided into three different regions: top region, middle region and matrix. Top and middle regions are seriously deformed areas, which is in the depth of ~0–40 μm and ~40–500 μm. Clearly, the d is evidently refined to smaller size as the deformed strain is larger nearby the treated surface compared with that in the matrix. Besides that, it can be found that many lamellas are produced in the middle region, which are probably twinning structures.
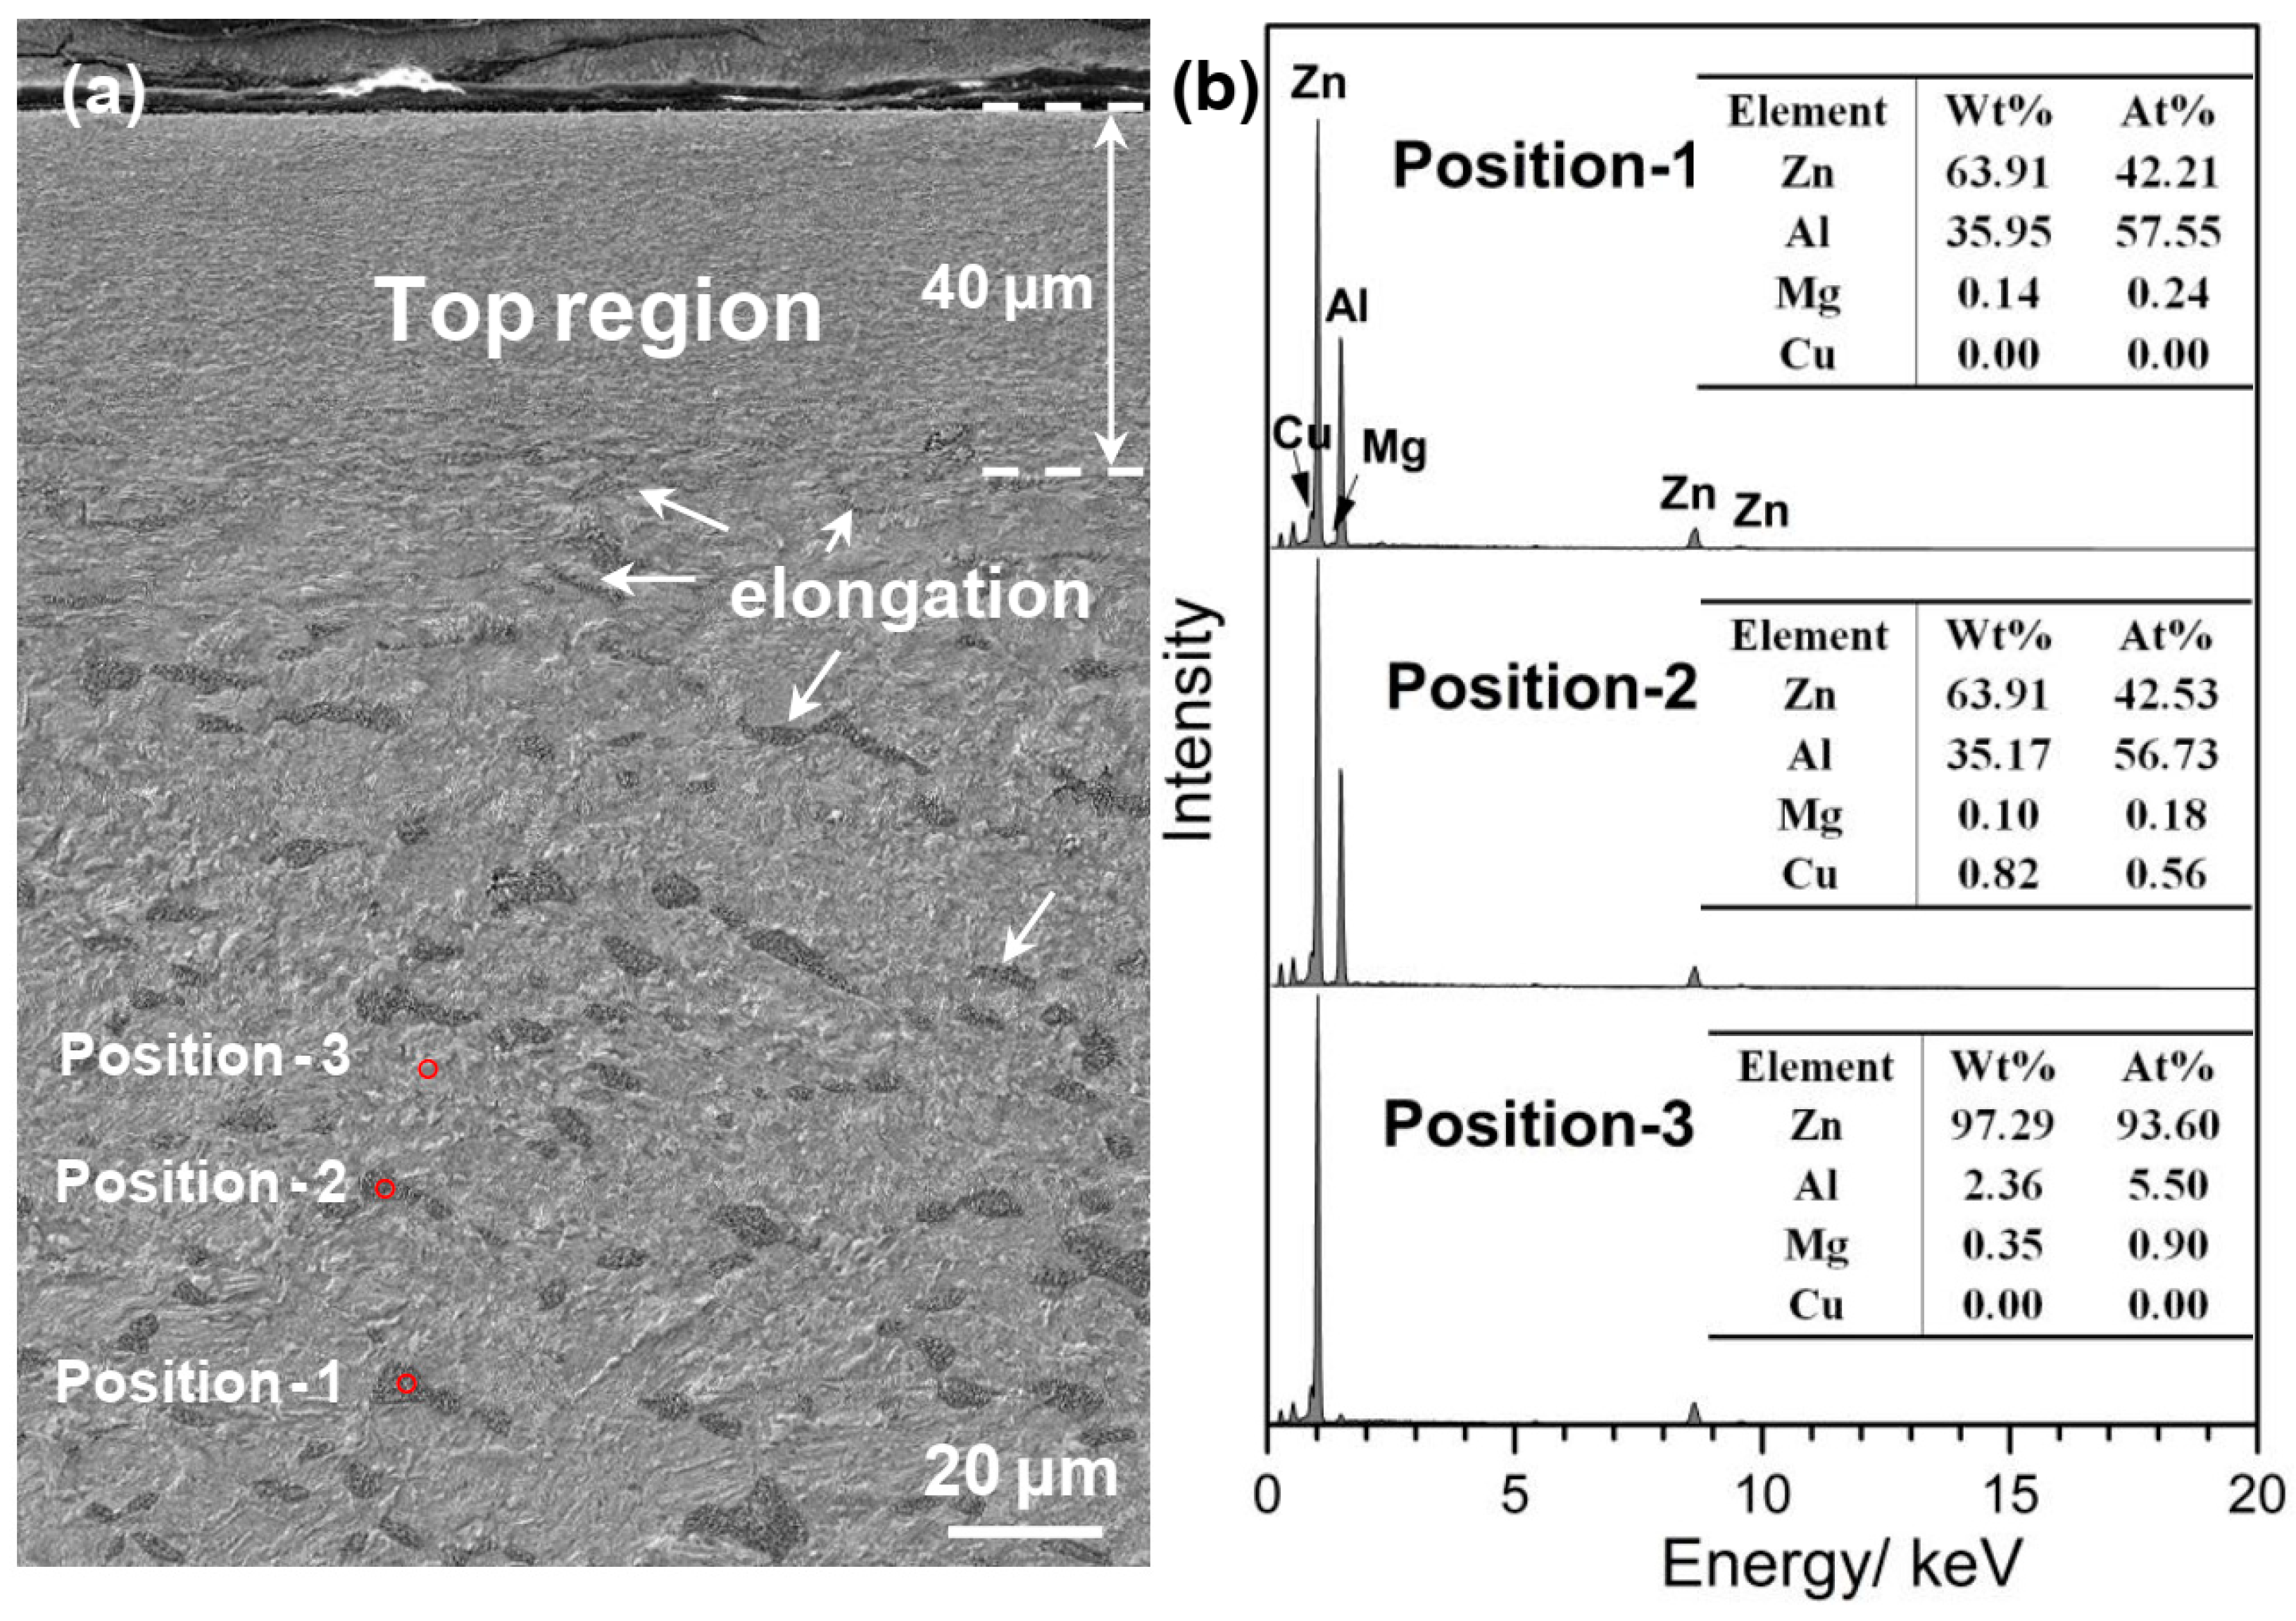
Figure 2a,b give SEM micrograph of the top region in the SFT sample (a) and the corresponding EDS analysis results (b). In the Figure 2a, the region away from the top ~40-μm-thickness has many dark gray structures with size 10~20 µm distributing uniformly in the matrix and they are obviously elongated as these structures are close to the top surface. Figure 2b supplies the corresponding component alloying elements at three different regions. Regions 1–2 and region 3 are the areas from the dark gray structures and alloy matrix, respectively. The corresponding atom percentage of Zn and Al are ~43 and ~57 at.% and ~93.60 and ~5.50 at.%. Therefore, the dark gray structures can be called as eutectic phase.
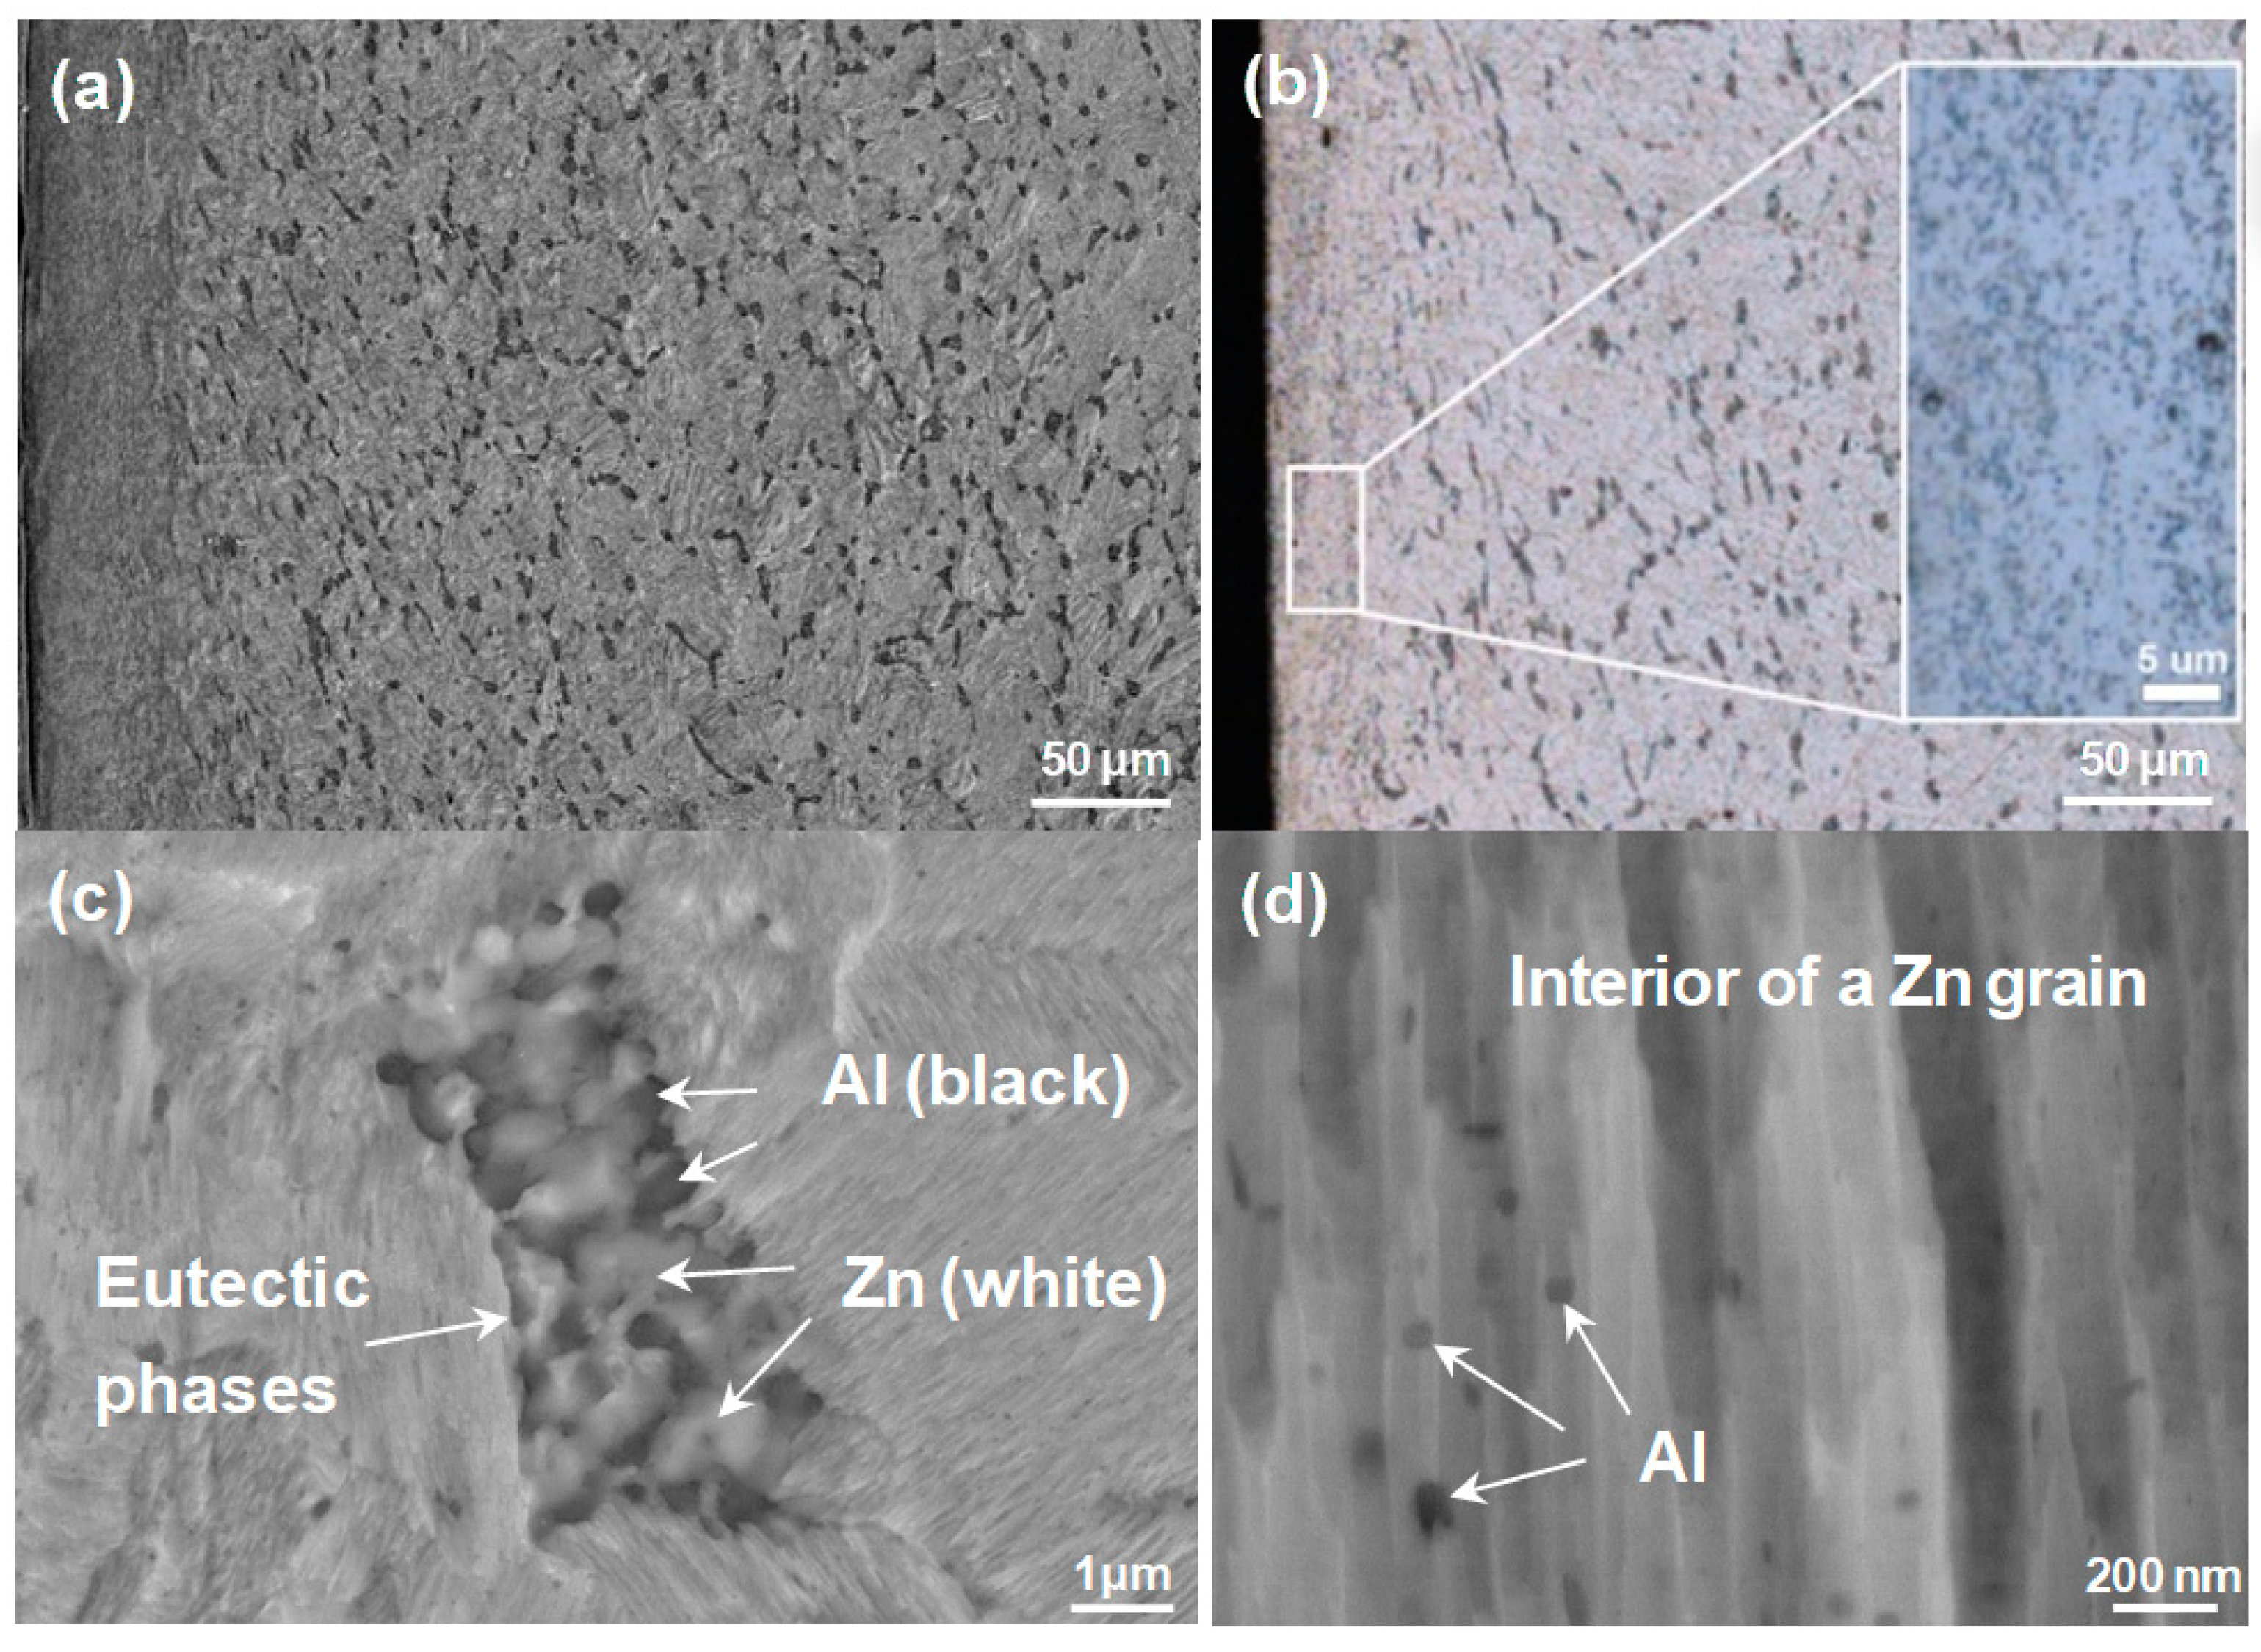
To obtain more information of eutectic phase distribution, Figure 3a,b give SEM and LCM cross sectional images. The right inset in Figure 3b provides the amplifying graph taken at the treated surface, which can be found that the eutectic phase is broken into small particles on the top surface. Figure 3c shows the further amplifying graph of the eutectic phase, which are agglomerates of Zn-rich (the white) and Al-rich (the black) grains. Additionally, careful microstructural observation provides direct evidence for the existence of ultrafine Al grains (several nanometers) in the Zn matrix as shown in Figure 3d.
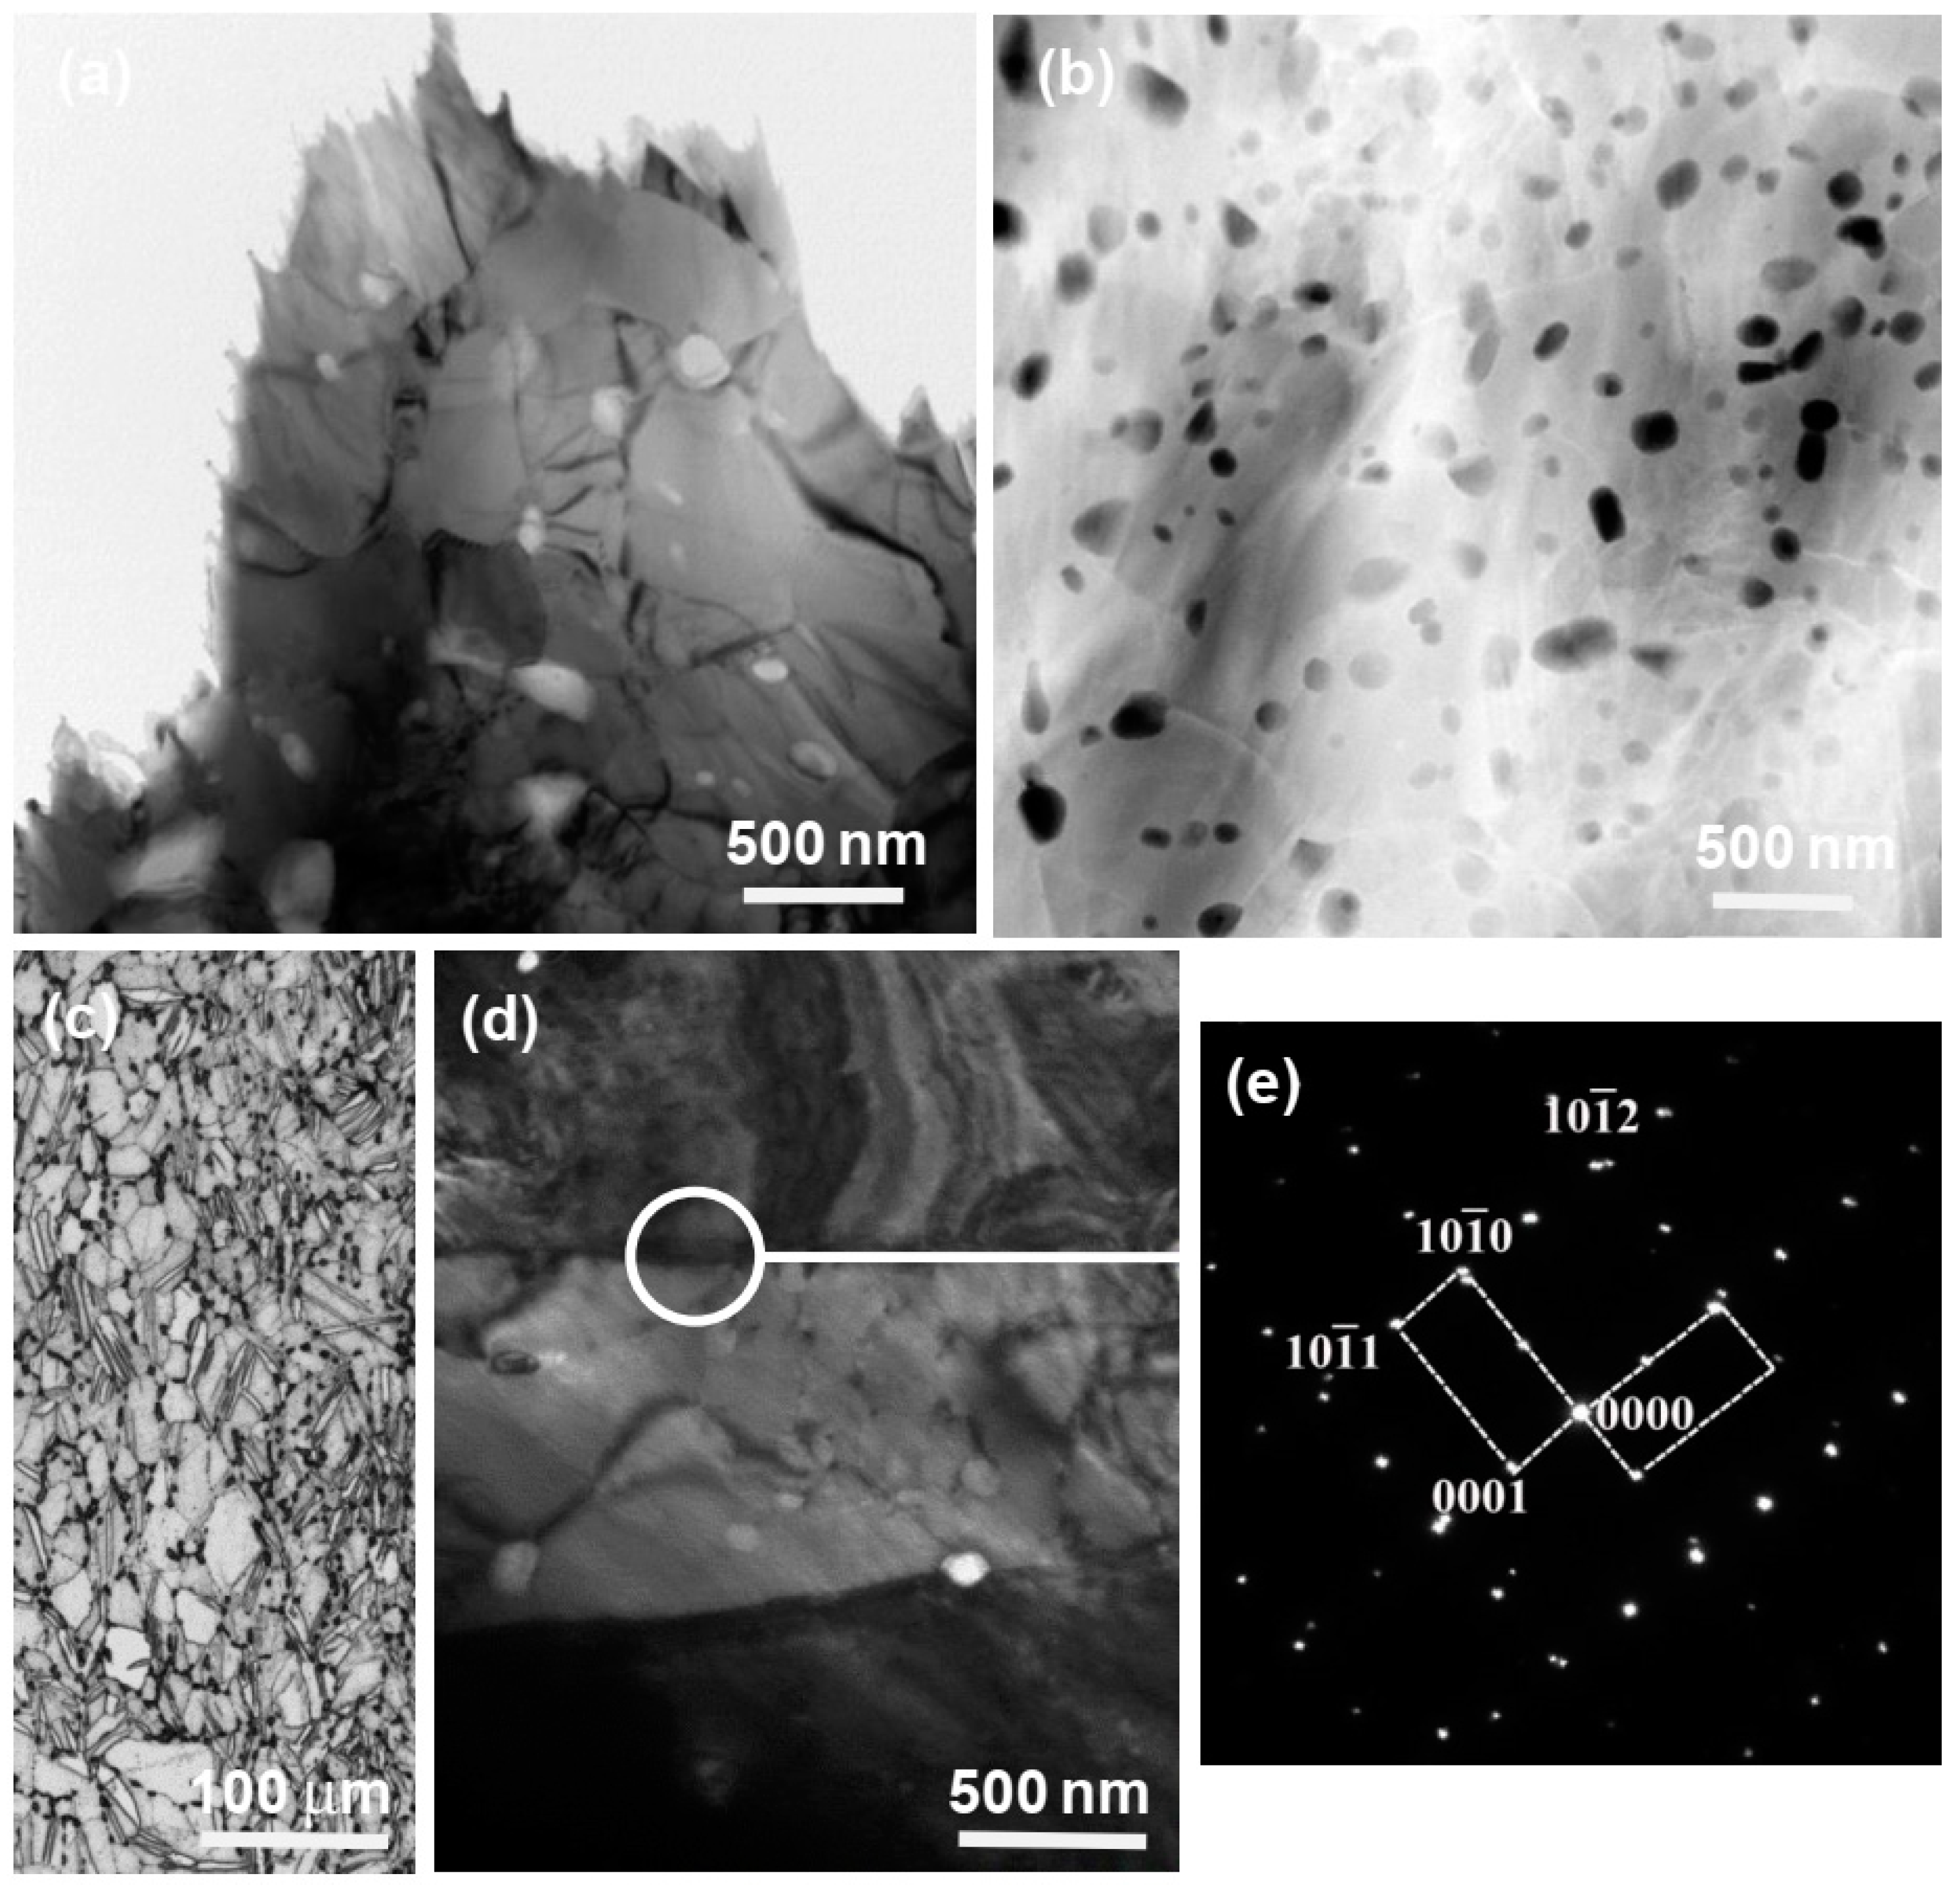
Figure 4a,b shows the bright and dark-field TEM images on the top surface that many dark particles with size of several nanometers are embedded dispersedly in the Zn matrix. The microstructure of this sample consists of the mostly equiaxed grains (extremely tiny particles are not considered) with a narrow size distribution and the average d of Zn is ~1 µm according to the statistical results. To confirm the phase in the different regions, our previous studies have provided the corresponding selected area diffraction patterns (SADP) of larger grain Zn and the tiny particle Al [17].
As describe before, many lamellas are produced in the middle region. To confirm the structures, we chosen some regions in the matrix containing this lamella from the corrosion sample in Figure 4c and explore the microstructures in Figure 4d. The SADP in Figure 4e indicates that the twin system is { 10 1 ¯ 2 } < 10 1 ¯ 1 > in the Zn. Hence, the above three regions can be defined as ultrafine grain (UFG) (top) region, CG+twinning (middle) region and CG region.

3.2. Hardness Evolution through SFT

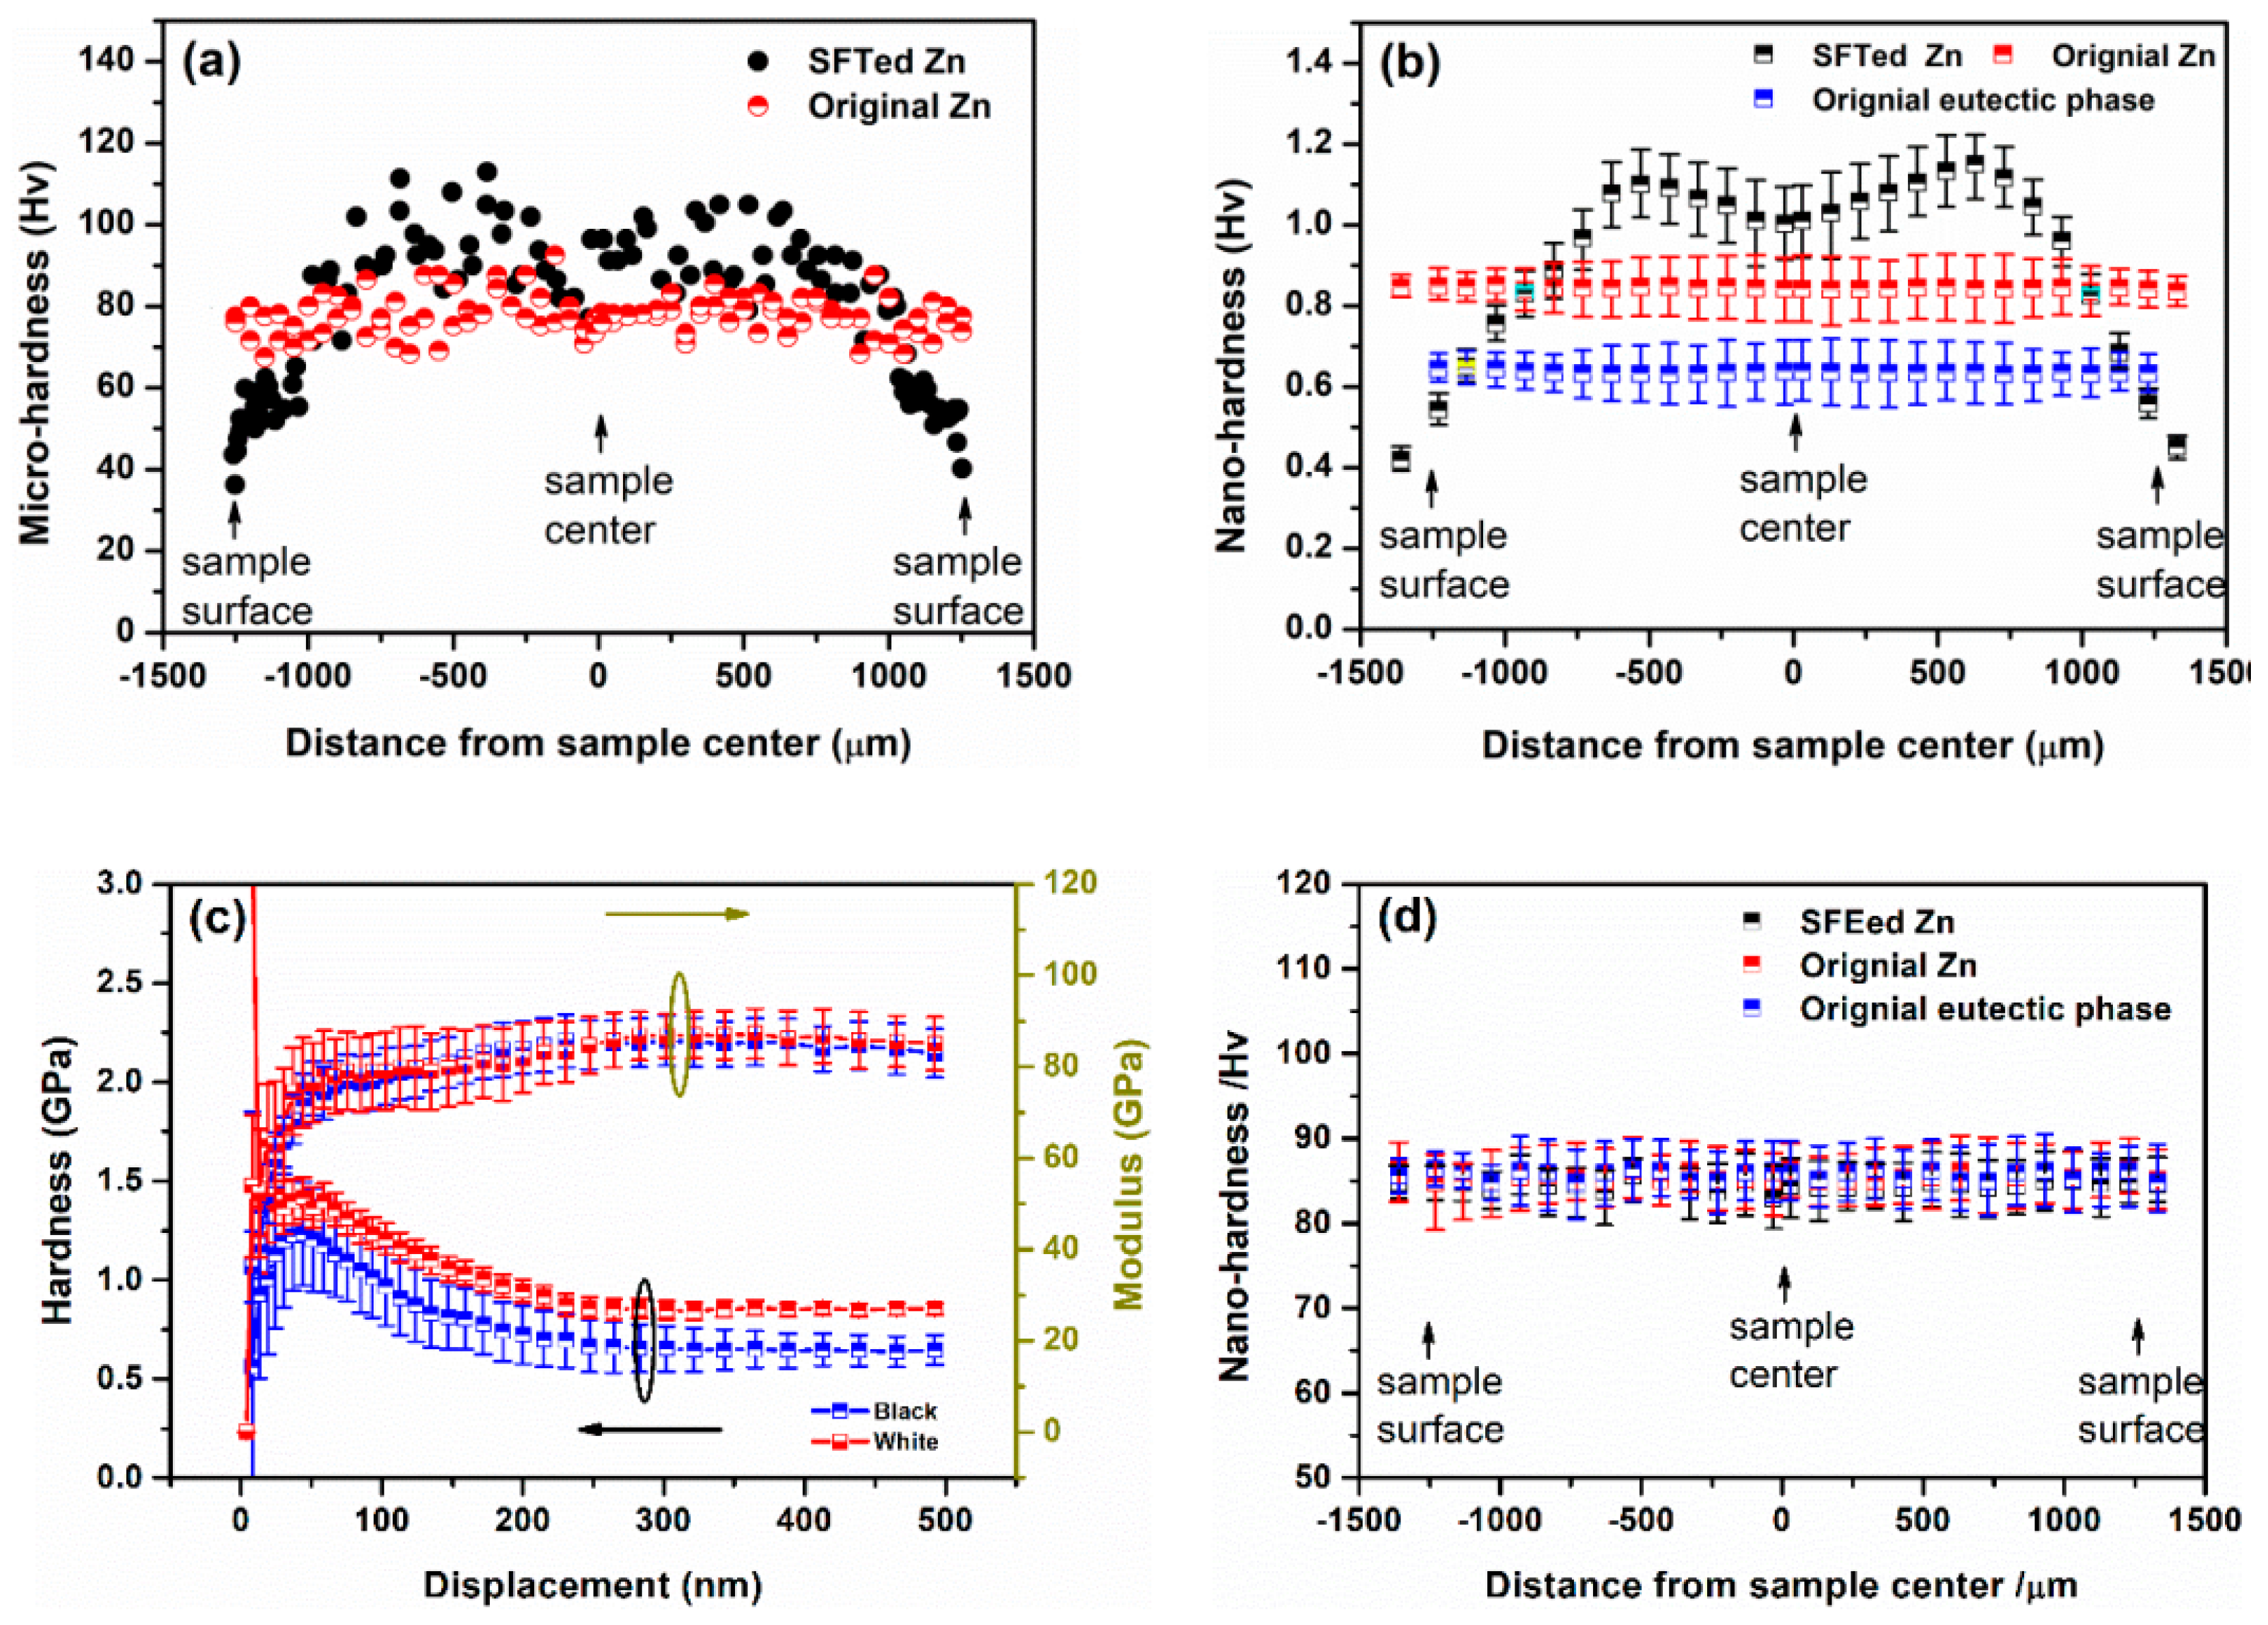
Figure 5a,b reveal the micro- and nano- hardness measurement of the cross profile in the different regions on the SFT-treated Zn alloy. Figure 5a shows the microhardness as a function of the distance from the center of as-annealed and SFT samples. It can be seen that the most of the regions in the SFT-treated Zn alloy become harder compared with that in the as-annealed sample. The H reaches the maximum value in the middle region and becomes softening on the deformed surface after severe deformation. To compare with the mechanical properties of eutectic phase, all the nano-hardnesses are measured at indentation depth of 500 nm. Figure 5c gives the continuous E and H of original Zn and eutectic phase at depth of 500 nm using CSM mode. As the indenting depth is larger than 300 nm, both of the E are 85 Gpa and the H are 0.85 and 0.65 GPa, respectively. Figure 5d exhibits the corresponding E values in Figure 5b that all the values are almost 85 GPa, which illustrates the measured H is reliable. The variation tendencies of the nanohardness in the as-annealed and SFT samples are similar with the microhardness and both of them exhibit “M”-shaped hardness curves. Interestingly, it can be found that the hardness of the eutectic phase is apparently larger than the hardness obtained on the surface. The volume percentage of Al phases is statistically calculated to be 4.85% in the surface layer, which is obviously less than that in the eutectic phase. Thus, it can be concluded that the material softening cannot be attribute to the distribution of Al phase in the top layer.

3.3. Nanoindentation Creep Behavior

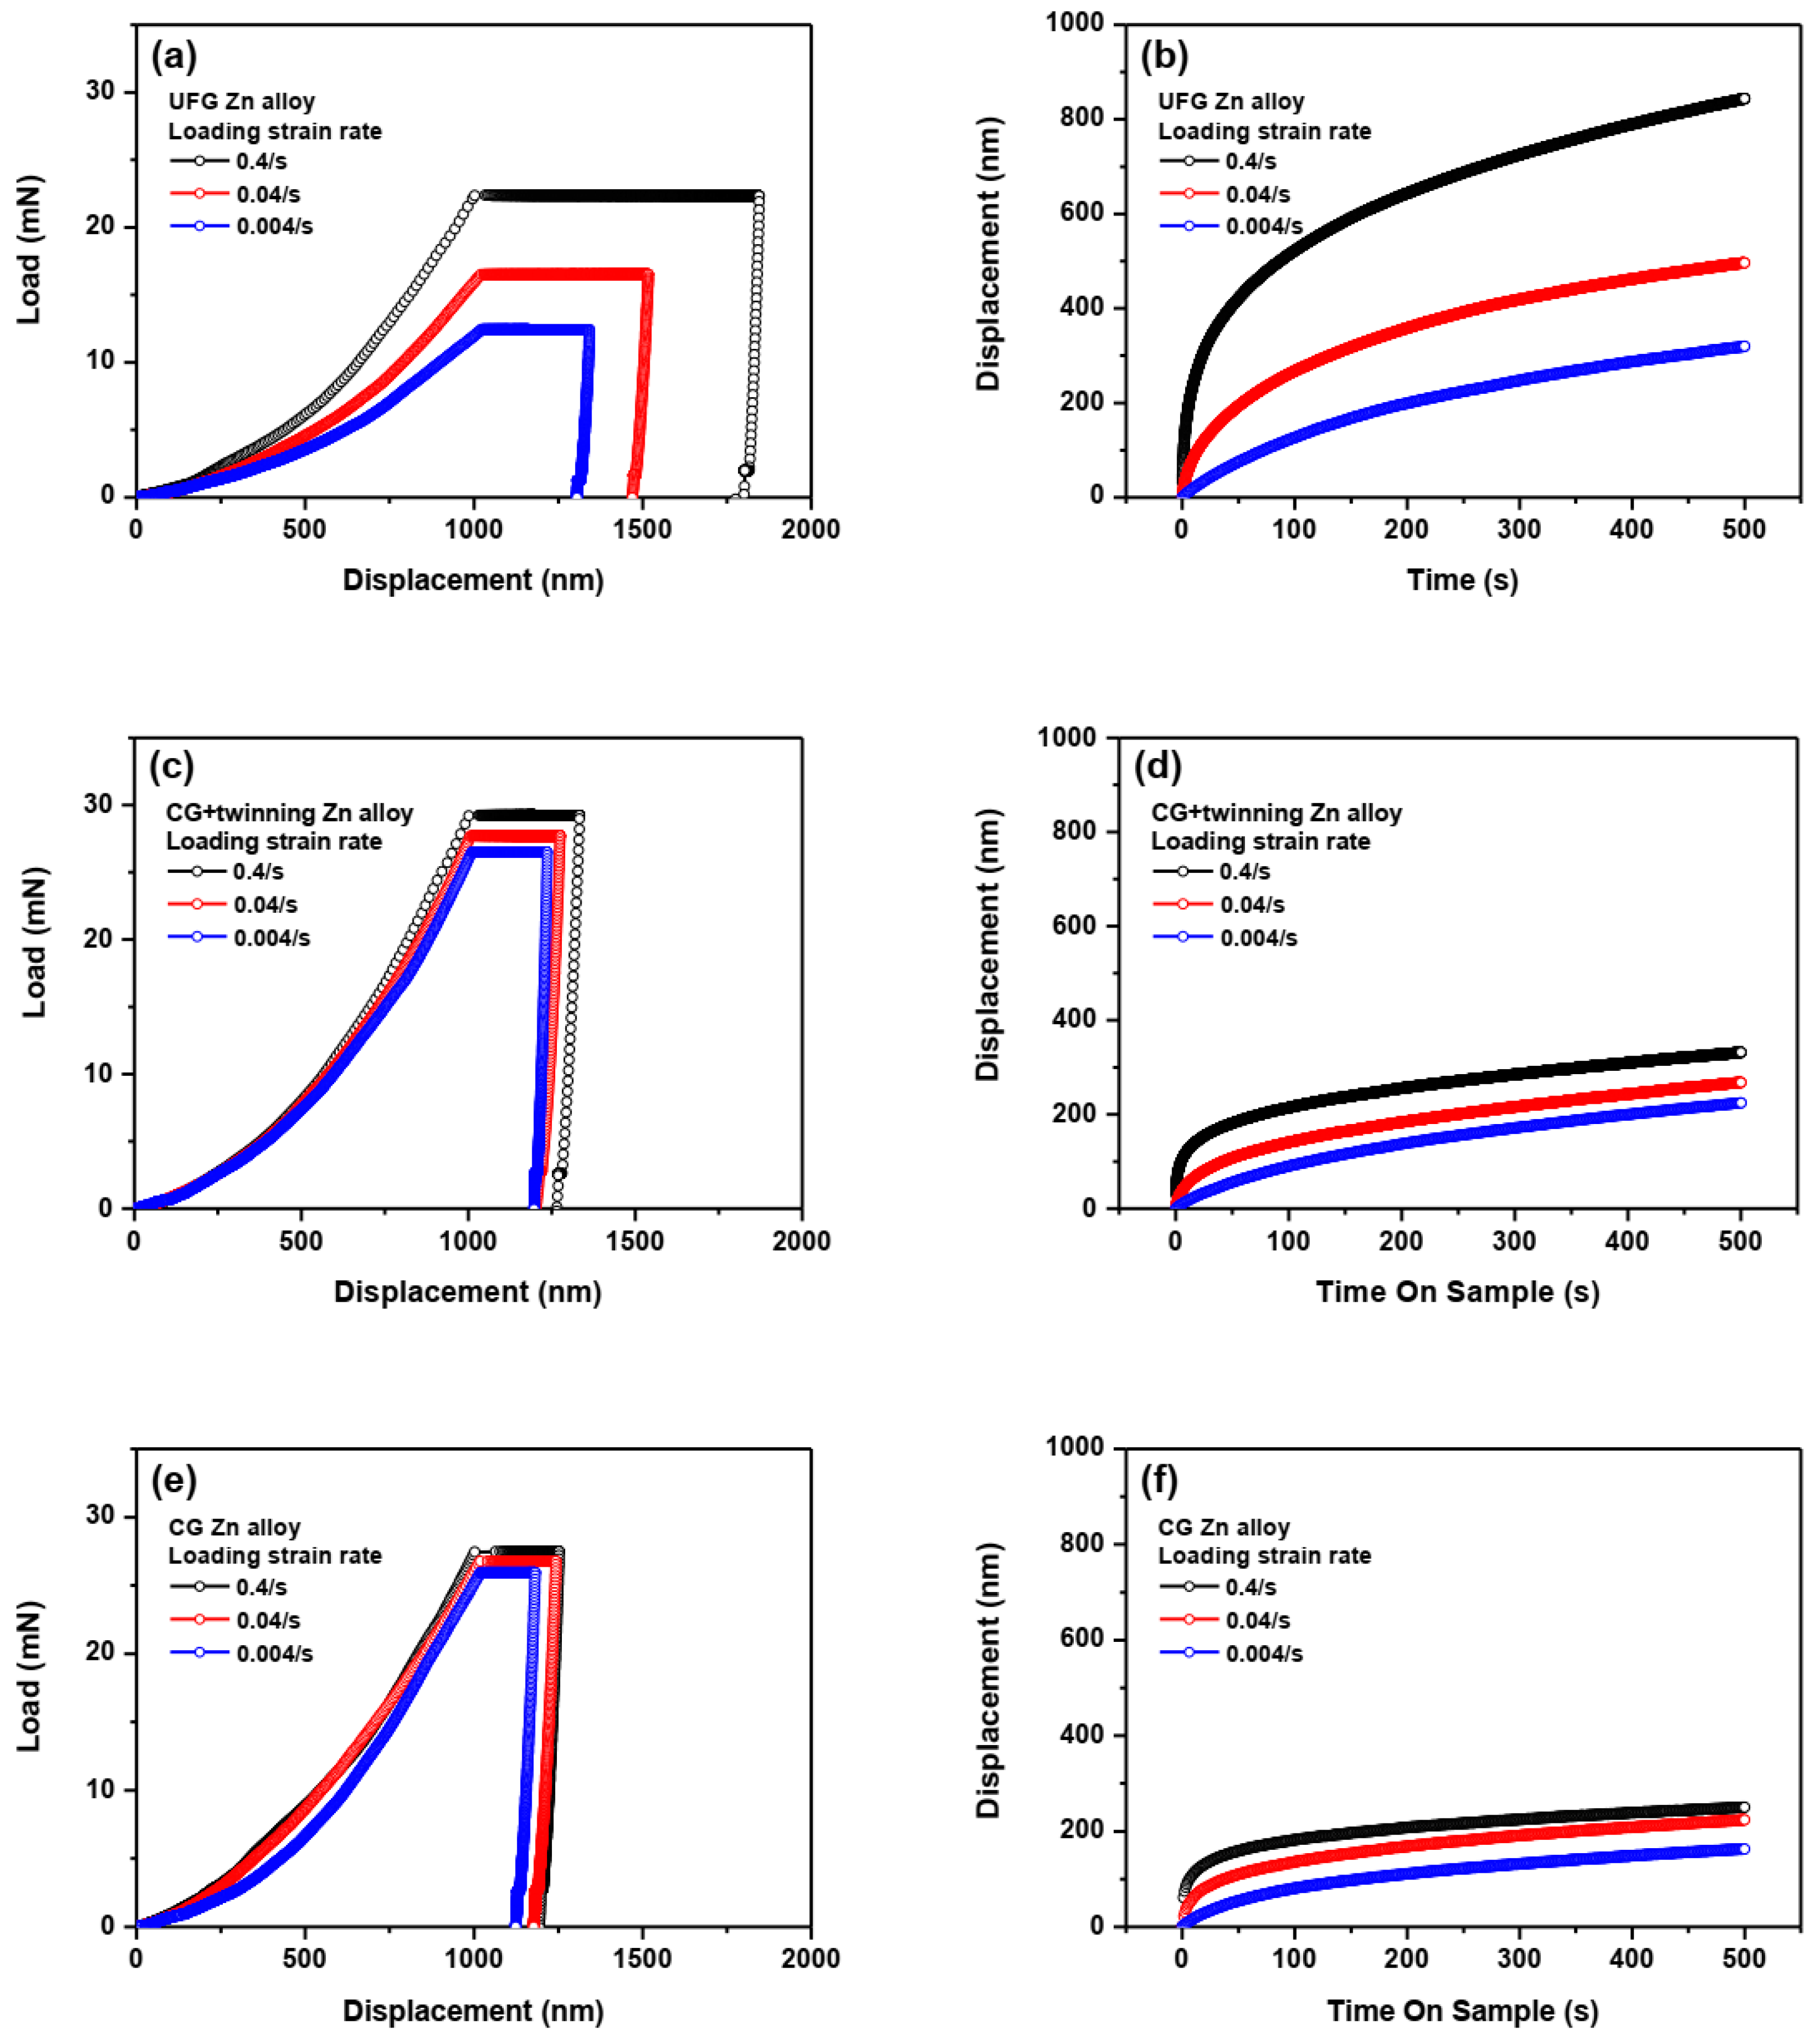
Figure 6a–f presents the typical P-h curves of the above three regions in the Zn alloy, obtained at ε ˙ L of 0.004/s to 0.4/s the indentation depth of 2000 nm with holding time of 500 s at maximum load. The load plateau/creep behavior becomes smaller as the regions are far away the surface and the load acquired at given depth increases rapidly with increasing ε ˙ L . In the loading regime, the load at given ε ˙ L is apparently smallest, medium and largest in the UFG/CG/CG+twinning Zn alloy, respectively. In the holding regime, the creep strain rate and stress can be obtained by the following equations [18,19]
ε ˙ H = ( d h / d t ) / h )
σ H = P / 3 A c
A c = C 0 h c 2 + C 1 h c + C 2 h c 1 / 2 + C 3 h c 1 / 4
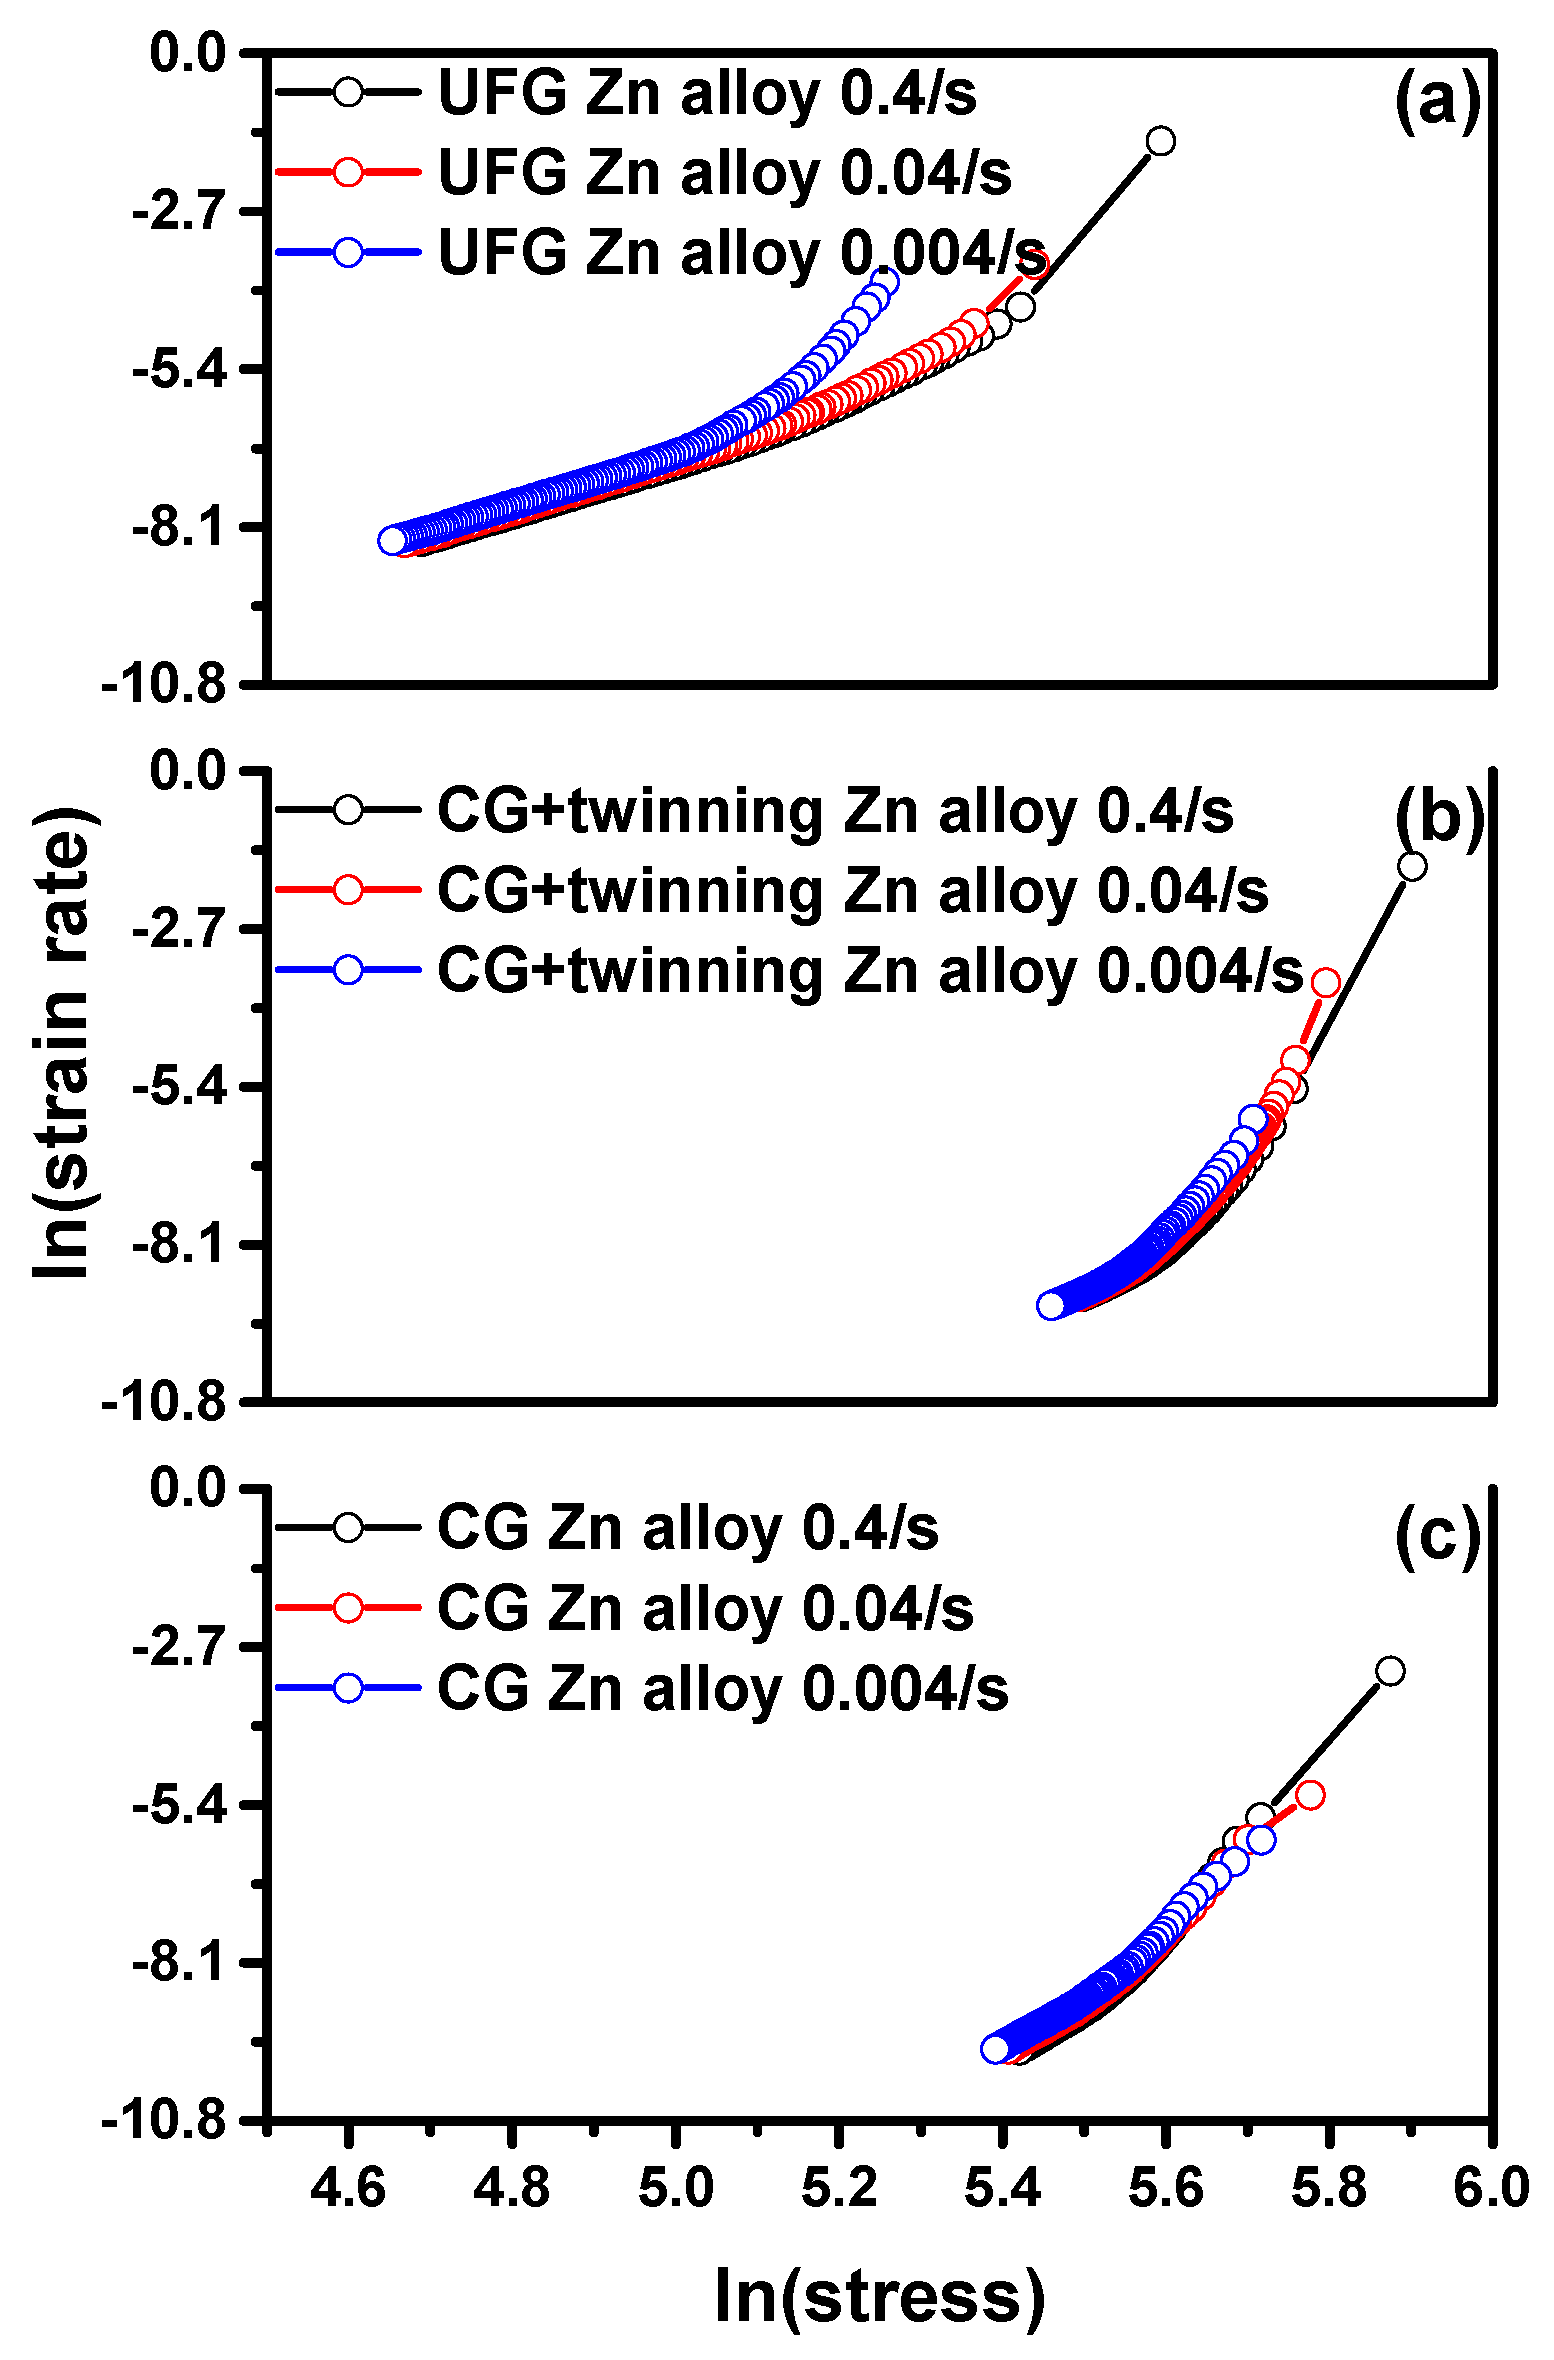
Where ε ˙ H and σ H are the creep strain rate and creep stress, respectively. A c is the contact area, h c = h ε P / S is the contact depth, C 0 = 24.32 , C 1 = 2152.7 , C 2 = 2713.6 and C 3 = 7724.7 were measured by the area function calibration procedure and ε = 0.75 is a constant for Berkovich indenter and S is the stiffness [20]. The dates of S-h curves in the holding regime can be measured in advance by the CSM mode and the corresponding details can be seen in the ref. [13]. Figure 7a–c gives the ln ε ˙ H ln σ H curves of UFG/CG+twinning/CG Zn alloy and the stress exponent (n) value of the final steady-state creep can be deduced by the equation of n = d ln ε ˙ H / d ln σ H . Table 1 summarizes the n of these three materials obtained at three different regions. Clearly, the value of n is apparently smallest, medium and largest in the UFG/CG+twinning/CG Zn alloy, respectively. At ε ˙ L of 0.004/s to 0.4/s, n in the UFG Zn alloy are 3.71, 3.93 and 4.03, which are apparently smaller than the values in the 5.08, 6.66 and 7.15 in the CG+twinning Zn alloy and 8.66, 10.97 and 12.88 in the CG Zn alloy.
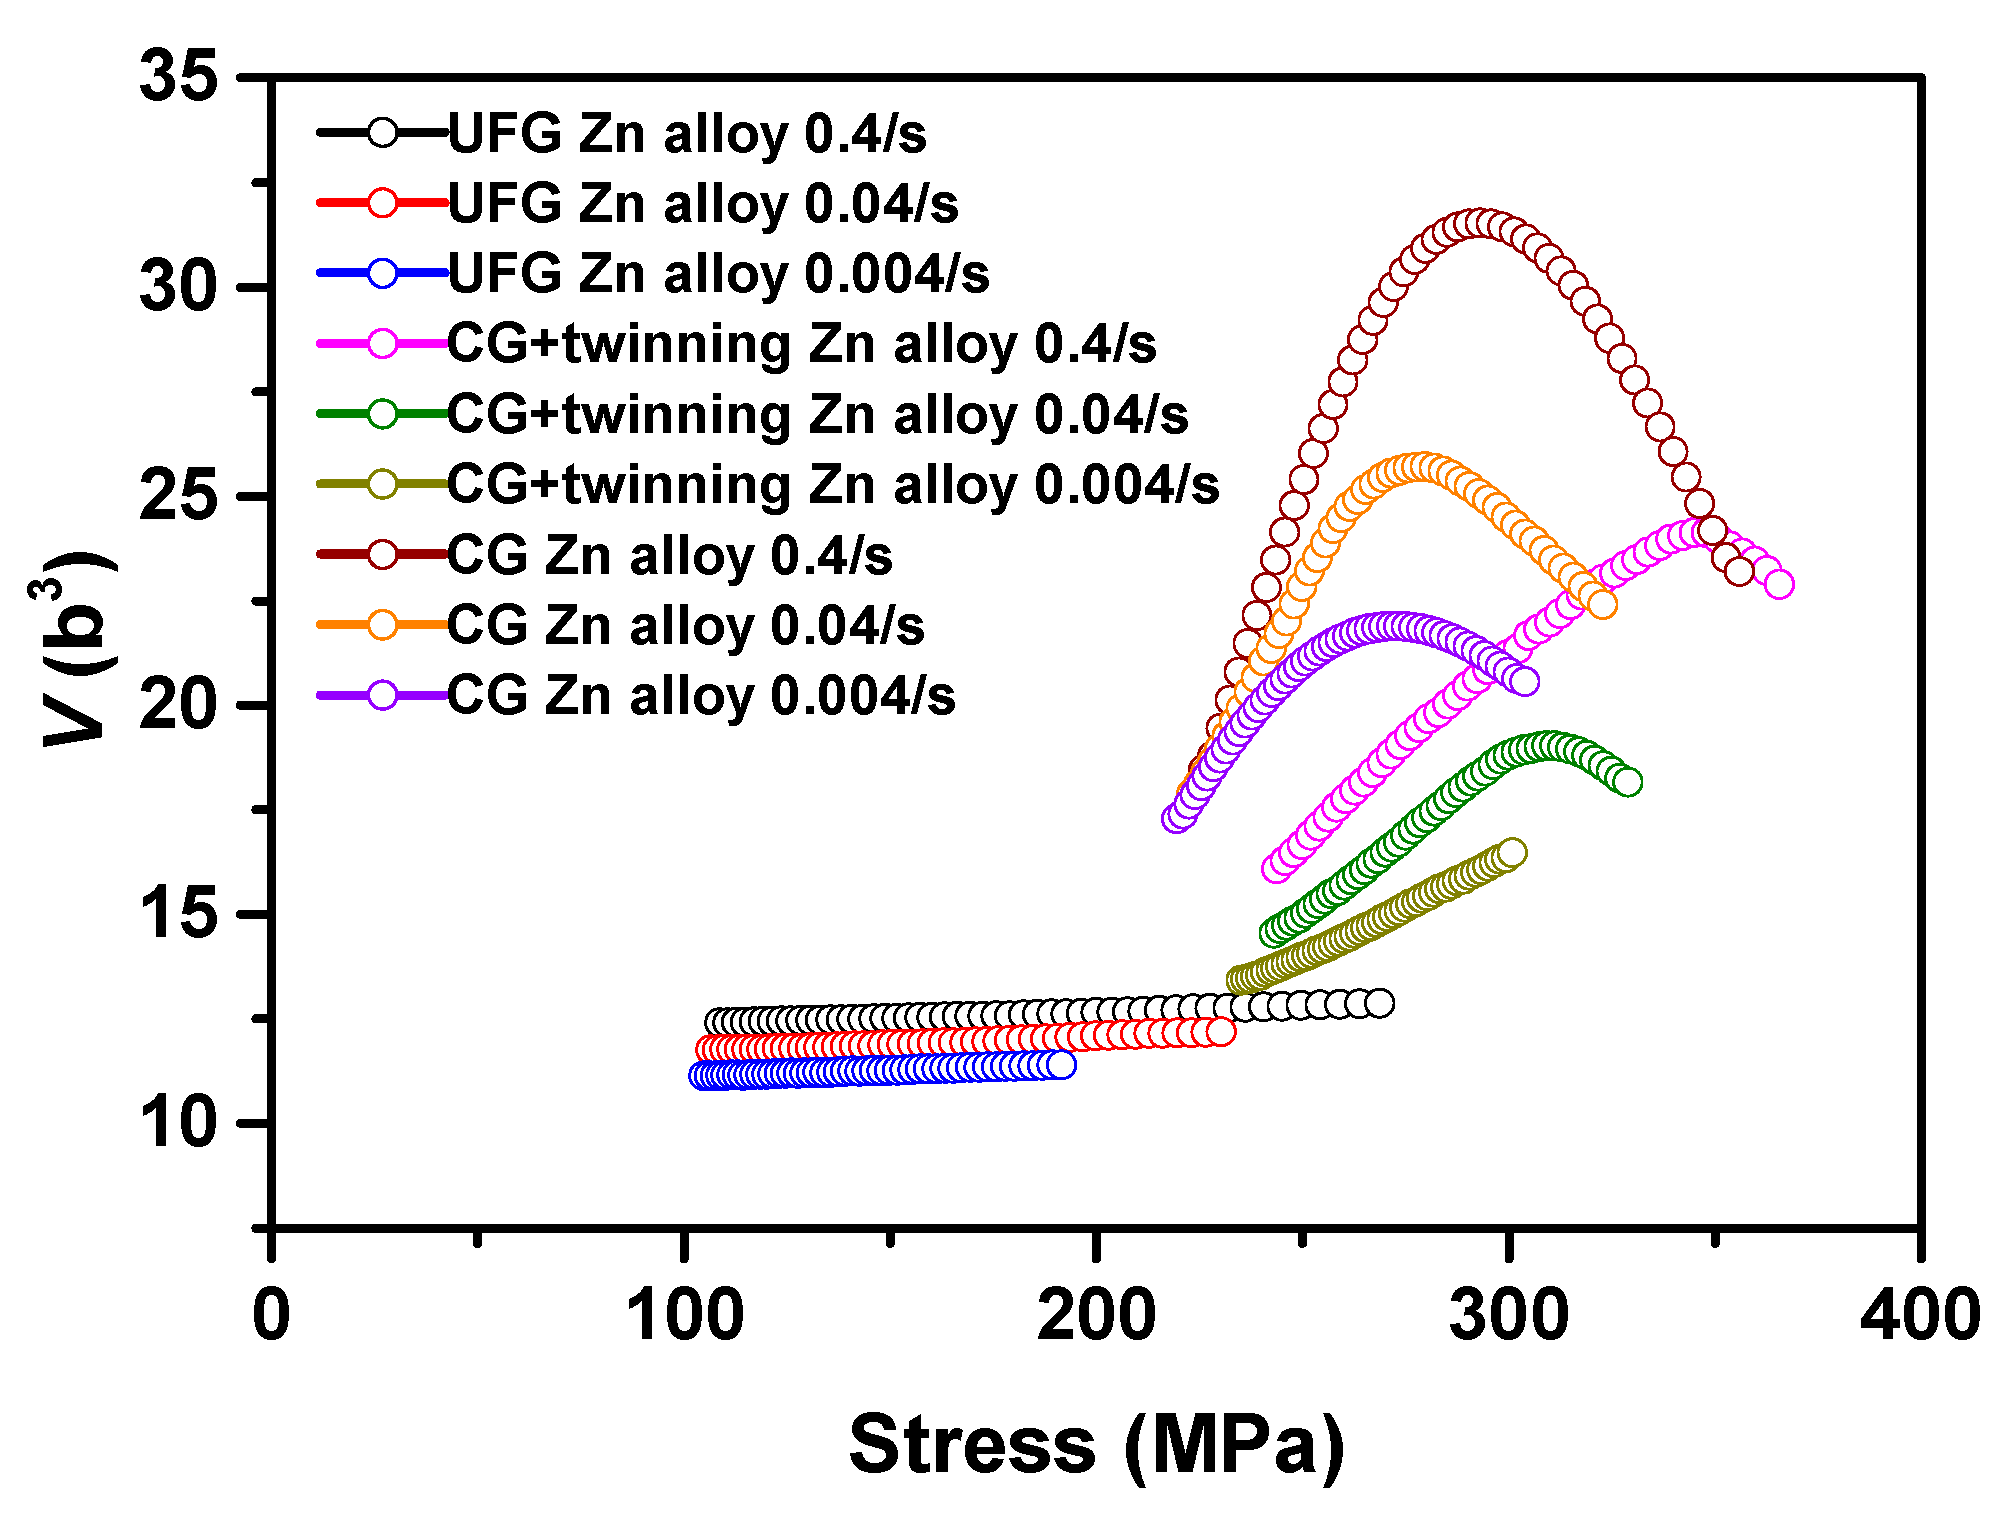
Based on ε ˙ H σ H data, Figure 8 gives the corresponding continuous activation volume-stress ( V σ H ) curves of UFG/CG+twinning/CG Zn alloy during holding time and V can be expressed as [2]
V = 3 k T ( ln ε ˙ H / σ H )
where k = 1.38 × 10 23 J / K is the Boltzmann constant, Τ = 298 K is the absolute temperature. The values of V increases as d and/or ε ˙ L become larger. As σ H decreases, in the UFG Zn alloy all the V exhibit almost constant values, while in the CG Zn alloy they show first, increased and then decreased vaulted curves. For the CG+twinning Zn alloy, the V presents a little increase and then decreases constantly at higher ε ˙ L . While at lower ε ˙ L , the V decreases constantly.

4. Discussion

There are two experimental evidences that support the materials softening: one is inverse Hall–Petch effect and the other is superplasticity. The former often occurs in the nanocrystalline materials as d is below a critical value (usually several nanometers). For example, Conrad and coworkers have concluded that grain boundary (GB) shear mechanism have been proposed for the observed softening or “inverse Hall–Petch effect” in the Zn when d ≤ 7.6 nm [21]. Evidently, the UFG Zn alloy in this study does not satisfy this condition. Hence, superplastic behavior is spontaneously used to explain this material softening. Generally, there are two fundamental requirements for superplasticity. First, the d must be very smaller than ∼10 μm. Second, the testing temperature must be within the diffusion-controlled process whereas those fine-grained materials should deform at relatively higher temperature at ∼0.4–0.5 Tm, where Tm is the absolute melting temperature. Since SFT-treated surface region has d of ~1 µm and testing temperature is at room temperature which corresponds to ~0.44 Tm of Zn alloys [10,22], the top region with finer grains are more likely to be ruled by superplastic deformation leading to materials softening.
Due to the lower melting point and stacking fault energy of Zn alloys, the high density of defects such as point defects, dislocations, GBs and their reaction products provides a high driving force for dynamic recovery, which tends to promote subsequent recrystallization [12]. Additionally, dislocations in the Zn need to travel a very short distance of the order of 1 μm and would be lost at nearby GBs during unloading [23]. Therefore, it can be expected that the traditional TEM observation hardly capture available deformed structure information. Figure 9a,b give two typical bright-field images of top layer after SFT treated and it can be seen that their grain is extremely clear. Nevertheless, some studies have found that the presence of second-phase in the Zn–Al alloy can provide effective barriers to the movement of dislocation [23]. To date, there are two principles of models for dislocation sliding in the superplasticity (Figure 10). One is the model that dislocations move along the GB (Figure 10a) and the other is the dislocations are produced and move inside the grain (Figure 10b). For example, T.G. Langdon et al. provide one principle of the GB sliding in the superplastic materials: dislocations move along the GB and pileup at the triple junction and then climb into the adjacent GB following the previous steps [24]. Even so, some authors have described that dislocation sweep across the grain interior and then climb along the GB [23,25]. Apparently, such a contradiction between these two views needs more understanding.
Because of extremely low Al content in the Zamak 3, few residual dislocations can be found in the grain interior during our subsequent TEM detection. Using indicators of the thermally activated plastic deformation such as n and V could be a reasonable method to analysis the underlying deformation mechanisms in the Zn alloy. Noted that although Zn alloy exists appreciable quality of the eutectoid phase, these refined dispersion particles in the SFT-treated surface do not effect on the mechanical properties in the superplastic region. This result can be proven by the hardness measurement in the nanoindentation testing, which is also demonstrated by Xun’s reports [23]. Hence, our analysis on this Zn alloy do not consider the influence of Al-related phase on the plastic deformation in the next discussion.
The deformation mechanism of the steady-state creep in these three regions can be roughly distinguished by evaluating the n. Xun et al. [23] have described that as the n is larger than 3, the apparent activation energy is higher than that for GB diffusion. As the n is 1.5–2.5, the apparent activation energy is close to that for GB diffusion. All the n values in these three regions obviously larger than 3 have suggested that the dislocation movement mechanism is one of the deformation mechanism in the steady-state creep behaviors. It can be found that the n decreases as the d become smaller, suggesting that more GB activities participate in their creep behaviors. Based on the different microstructures in these three materials, it can be predicted that in the UFG Zn alloys GB activities accommodated by dislocation motion rule the plastic deformation. In the CG+twinning Zn alloy, dislocations interacting with twinning boundaries would dominate the plasticity, while in the CG Zn–Al alloy intragranular dislocation motion involved few low-angle GBs would be the main deformation mode.
To analyze creep behaviors in more detail, continuous variation of V as function of the flow stress is used to assess the average volume of dislocation structure involved in the deformation. The results of V in these three materials exhibit three entirely different tendencies. Unlike the variation of V in our previous Mg alloy [5], their descent velocities and declining quantities do not exhibit continuous decrement as the d or as ε ˙ L changes, illustrating that these materials probably have some special deformation mechanisms. According to the work of Becker [26,27,28], V can be written as V = b × ξ × l , where ξ is the distance swept out by the mobile dislocation during an activation event, which can be considered as a constant of b [28,29] and l is the length of dislocation segment or the distance between two pinning sites on GBs. Hence, V can also be expressed as V   =   l b 2 , that is closely related with the dislocation spacing and therefore to the flow stress, which could facilitate us to understand the amount of matters involved in the thermally activated events of the deformation process.
For the extremely smaller d (several nanometers), one can expect that the dislocation velocity is dominated by the emission time not flight time. Since dislocation emission involves local atomic rearrangements in the areas of high-angle GBs, GB activities either their ability to emit dislocations or their ability to undergo GB sliding must influence the deformation process [13]. In this case, the probability to find a dislocation inside the grain is very small and the dislocation density does not vary with the shear stress [30], which results in V to be some constant values. This result indicates that even GB activities controls the plasticity, the generated highly unstable perfect/partial dislocations would likely choose to slide around the GBs to accommodate the intergranular plasticity, not slip across the grain interior. For the UFG metals, a larger number of GB mediated deformation would be effectively activated under the conditions of high temperature and/or low applied stress, which could also induce a constant value of V. Duhamel et al. [30] have already observed that V would be ~17b3 in the UFG Cu as its deformation under the above condition. For the UFG Zn alloy, two fundamental requirements for superplasticity are well satisfied which indicate that GB-related activities dominate the plastic behavior. Our results have shown that all the V exhibit a slightly decrement that can be treated as a constant value, which implies that dislocations probably move along the GB not crossing the grain interior. As expected, the interactions between dislocation and high-angle GBs restricted around the GB promote the process of generation and recovery of dislocations or other defects, which contribute to the final superplastic strain.
For the larger d such as CG+twinning Zn alloy, the time of a dislocation across the grain interior is much larger than that of this dislocation nucleation and dislocations slide inside the grains would dominate the plastic flow. As the holding time goes on, the pre-existing twinning boundaries (TBs) inside the large grains of CG+twinning Zn alloy would hinder the further dislocation motion. The highly frequent dislocation–TB interactions make the depinning sites on GBs become harder and L would be smaller [13], inducing V decreases with deceasing σ H (inverse Cottrell–Stokes). Duhamel et al. [30] have used a model to predict a transition from the inverse Cottrell–Stokes to a Cottrell–Stokes behavior would occur in the V σ H curves at relatively larger strain rate. Because of preferentially initiated dislocation–TB interaction at lower stress in the CG+twinning Zn alloy, it can only observe the inverse Cottrell–Stokes behavior at lower ε ˙ L .
For the CG Zn alloy, due to few slip systems in the hexagonal close-packed (HCP) metals, deformation twinning usually plays a more important role than dislocation slipping in its plastic flow. As to the Zn with c/a of 1.856 (larger than 1.63), twinning { 10 1 ¯ 2 } < 10 1 ¯ 1 > tends to be effectively formed under compressive plasticity because deformation twinning requires a lower applied stress compared with that for slip deformation [31]. Unlike Mg alloys, no obvious pop-in effect in the loading curves can be found to verify this deformation mode, which is probably ascribed to strong dynamic recovery in the deformation process. Li et al. have found that as the compressive strain increasing to 16%, deformation twinning and slip bands on the basal system are the main plastic deformation mechanisms in the pure Zn [31]. For the nanoindentation tests, the Berkovich indenter would produce a characteristic strain of ~8% that means the main deformation mechanisms in our CG Zn alloy are basically similar with the above ones [32]. In the incipient creep behavior, the generated dislocations in the {1012} twins or basal plane have not yet formed complex defect structures that would facilitate dislocations move forward [5]. Therefore, dislocations can move easily inside the grains and the corresponding V follows Cottrell–Stokes law [30]: V is inversely proportional to σ H . As the creep behavior goes on, the formed dislocation networks/cell/wall/arrays inside the grains make its strain hardening ability become saturated, that would make dislocations move harder, leading to the inverse Cottrell–Stokes.

5. Conclusions

Nanoindentation tests of the refined Zn alloy were investigated on three different deformed regions at room temperature: UFG/CG+twinning/CG Zn alloy. One interesting phenomena can be found that the UFG Zn alloy on the top surface exhibits materials softening compared with other regions. Analysis on the continuous V versus stress during the nanoindentation creep in these three materials, two main conclusions can be obtained:
  • For UFG Zn alloy, the almost constant values of V in the UFG Zn implies that its superplasticity is ruled by the dislocations moving along the GB not crossing the grain interior;
  • For the CG+twinning/CG Zn alloy, the highly frequent dislocation–TB and dislocation–dislocation interactions intergranular are responsible for subsequent inverse Cottrell–Stokes at lower stress, respectively.

Author Contributions

Conceptualization, J.H. and S.S.; methodology, W.Z.; software, S.H. and X.S.; validation, G.P., Y.Z. and T.Z.; formal analysis, J.H.; investigation, J.H.; resources, J.H.; data curation, J.H.; writing—original draft preparation, J.H.; writing—review and editing, Y.Z.; visualization, J.H.; supervision, T.Z.; project administration, T.Z.; funding acquisition, J.H., G.P. and T.Z. All authors have read and agreed to the published version of the manuscript.

Funding

The National Natural Science Foundation of China (Grant Nos. 51801184, 11772302, 11727803, 11672356).

Acknowledgments

In this section you can acknowledge any support given which is not covered by the author contribution or funding sections. This may include administrative and technical support, or donations in kind (e.g., materials used for experiments).

Conflicts of Interest

The authors declare no conflict of interest.

References

  1. Hu, J.J.; Han, S.; Sun, G.X.; Sun, S.C.; Jiang, Z.H.; Wang, G.Y.; Lian, J.S. Effect of strain rate on tensile properties of electric brush-plated nanocrystalline copper. Mater. Sci. Eng. A 2014, 618, 621–628. [Google Scholar] [CrossRef]
  2. Hu, J.J.; Sun, G.X.; Zhang, X.P.; Wang, G.Y.; Jiang, Z.H.; Han, S.; Zhang, J.Y.; Lian, J.S. Effects of loading strain rate and stacking fault energy on nanoindentation creep behaviors of nanocrystalline Cu, Ni-20 wt.%Fe and Ni. J. Alloy. Compd. 2015, 647, 670–680. [Google Scholar] [CrossRef]
  3. Hu, J.J.; Sun, W.M.; Jiang, Z.H.; Zhang, W.; Lu, J.W.; Huo, W.T.; Zhang, Y.S.; Zhang, P.X. Indentation size effect on hardness in the body-centered cubic coarse-grained and nanocrystalline tantalum. Mater. Sci. Eng. A 2017, 686, 19–25. [Google Scholar] [CrossRef]
  4. Hu, J.J.; Zhang, W.; Bi, G.L.; Lu, J.W.; Huo, W.T.; Zhang, Y.S. Nanoindentation creep behavior of coarse-grained and ultrafine-grained pure magnesium and AZ31 alloy. Mater. Sci. Eng. A 2017, 698, 348–355. [Google Scholar] [CrossRef]
  5. Hu, J.J.; Zhang, W.; Peng, G.J.; Zhang, T.H.; Zhang, Y.S. Nanoindentation deformation of refine-grained AZ31 magnesium alloy: Indentation size effect, pop-in effect and creep behavior. Mater. Sci. Eng. A 2018, 725, 522–529. [Google Scholar] [CrossRef]
  6. Zhang, W.; Huo, W.T.; Lu, J.W.; Hu, J.J.; Wei, Q.; Zhang, Y.S. Gradient shear banding in a magnesium alloy induced by sliding friction treatment. Vacuum 2017, 143, 95–97. [Google Scholar] [CrossRef]
  7. Ma, Y.; Huang, X.W.; Hang, W.; Liu, M.; Song, Y.X.; Yuan, L.; Zhang, T.H. Nanoindentation size effect on stochastic behavior of incipient plasticity in a LiTaO3 single crystal. Eng. Fract. Mech. 2020, 226, 106877. [Google Scholar] [CrossRef]
  8. Cho, T.-S.; Lee, H.-J.; Ahn, B.; Kawasaki, M.; Langdon, T.G. Microstructural evolution and mechanical properties in a Zn–Al eutectoid alloy processed by high-pressure torsion. Acta Mater. 2014, 72, 67–79. [Google Scholar] [CrossRef]
  9. Mazilkin, A.; Straumal, B.; Rabkin, E.; Baretzky, B.; Enders, S.; Protasova, S.; Kogtenkova, O.; Valiev, R. Softening of nanostructured Al–Zn and Al–Mg alloys after severe plastic deformation. Acta Mater. 2006, 54, 3933–3939. [Google Scholar] [CrossRef]
  10. Choi, I.-C.; Kim, Y.-J.; Ahn, B.; Kawasaki, M.; Langdon, T.G.; Jang, J.-I. Evolution of plasticity, strain-rate sensitivity and the underlying deformation mechanism in Zn–22% Al during high-pressure torsion. Scr. Mater. 2014, 75, 102–105. [Google Scholar] [CrossRef]
  11. Feldner, P.; Merle, B.; Göken, M. Superplastic deformation behavior of Zn-22% Al alloy investigated by nanoindentation at elevated temperatures. Mater. Des. 2018, 153, 71–79. [Google Scholar] [CrossRef]
  12. Sun, Z.; Van Petegem, S.; Cervellino, A.; Durst, K.; Blum, W.; Van Swygenhoven, H. Dynamic recovery in nanocrystalline Ni. Acta Mater. 2015, 91, 91–100. [Google Scholar] [CrossRef]
  13. Sun, W.M.; Jiang, Y.; Sun, G.X.; Hu, J.J.; Zhou, T.Y.; Jiang, Z.H.; Lian, J.S. Nanoindentation creep behavior and its relation to activation volume and strain rate sensitivity of nanocrystalline Cu. Mater. Sci. Eng. A 2019, 751, 35–41. [Google Scholar] [CrossRef]
  14. Zhang, Y.S.; Wei, Q.M.; Niu, H.Z.; Li, Y.S.; Chen, C.; Yu, Z.T.; Bai, X.F.; Zhang, P.X. Formation of nanocrystalline structure in tantalum by sliding-friction treatment. Int. J. Refract. Met. H. 2014, 45, 71–75. [Google Scholar] [CrossRef]
  15. Zhang, Y.S.; Zhang, P.X.; Niu, H.Z.; Chen, C.; Wang, G.; Xiao, D.H.; Chen, X.H.; Yu, Z.T.; Yuan, S.B.; Bai, X.F. Surface nanocrystallization of Cu and Ta by sliding friction. Mater. Sci. Eng. A 2014, 607, 351–355. [Google Scholar] [CrossRef] [Green Version]
  16. Zhang, W.; Lu, J.W.; Huo, W.T.; Zhang, Y.S.; Wei, Q.M. Microstructural evolution of AZ31 magnesium alloy subjected to sliding-friction treatment. Philos. Mag. 2018, 98, 1576–1593. [Google Scholar] [CrossRef]
  17. Zhang, W.; Du, Y.; Huo, W.T.; Hu, J.J.; Lu, J.W.; Zhao, X.; Zhang, L.C.; Zhang, Y.S. Microstructure and mechanical properties of Zamak 3 alloy subjected to sliding-friction treatment. Metall. Mater. Trans. A 2019, accepted. [Google Scholar] [CrossRef]
  18. Lucas, B.N.; Oliver, W.C. Indentation Power-Law Creep of High-Purity Indium. Metall. Mater. Trans. A 1999, 30, 601–610. [Google Scholar] [CrossRef]
  19. Peng, G.J.; Xu, F.L.; Chen, J.F.; Hu, Y.H.; Wang, H.D.; Zhang, T.H. A cost-effective voice coil motor-based portable micro-indentation device for in situ testing. Measurement 2020, 165, 108105. [Google Scholar] [CrossRef]
  20. Oliver, W.C.; Pharr, G.M. An improved technique for determining hardness and elastic modulus using load and displacement sensing indentation experiments. J. Mater. Res. 1992, 7, 1564–1583. [Google Scholar] [CrossRef]
  21. Conrad, H.; Narayan, J. Mechanisms for grain size hardening and softening in Zn. Acta Mater. 2002, 50, 5067–5078. [Google Scholar] [CrossRef]
  22. Figueiredo, R.B.; Langdon, T.G. Developing superplasticity in a magnesium AZ31 alloy by ECAP. J. Mater. Sci. 2008, 43, 7366–7371. [Google Scholar] [CrossRef]
  23. Xun, Y.; Mohamed, F.A. Slip-accommodated superplastic flow in Zn-22 wt%Al. Philos. Mag. 2010, 83, 2247–2266. [Google Scholar] [CrossRef]
  24. Figueiredo, R.B.; Langdon, T.G. Principles of grain refinement and superplastic flow in magnesium alloys processed by ECAP. Mater. Sci. Eng. A 2009, 501, 105–114. [Google Scholar] [CrossRef]
  25. Park, K.-T.; Lee, H.-J.; Lee, C.S.; Nam, W.J.; Shin, D.H. Enhancement of high strain rate superplastic elongation of a modified 5154 Al by subsequent rolling after equal channel angular pressing. Scr. Mater. 2004, 51, 479–483. [Google Scholar] [CrossRef]
  26. Conrad, H. Thermally activated deformation of metals. J. Miner. Met. Mater. Soc. 1964, 16, 582–588. [Google Scholar] [CrossRef]
  27. Cahn, J.; Nabarro, F. Thermal activation under shear. Philos. Mag. A 2001, 81, 1409–1426. [Google Scholar] [CrossRef]
  28. Wei, Q.; Cheng, S.; Ramesh, K.T.; Ma, E. Effect of nanocrystalline and ultrafine grain sizes on the strain rate sensitivity and activation volume: Fcc versus bcc metals. Mater. Sci. Eng. A 2004, 381, 71–79. [Google Scholar] [CrossRef]
  29. Kobrinsky, M.J.; Thompson, C.V. Activation volume for inelastic deformation in polycrystalline Ag thin films. Acta Mater. 2000, 48, 625–633. [Google Scholar] [CrossRef]
  30. Duhamel, C.; Brechet, Y.; Champion, Y. Activation volume and deviation from Cottrell–Stokes law at small grain size. Int. J. Plast. 2010, 26, 747–757. [Google Scholar] [CrossRef]
  31. Li, H.; Duan, Q.Q.; Li, X.W.; Zhang, Z.F. Compressive and fatigue damage behavior of commercially pure zinc. Mater. Sci. Eng. A 2007, 466, 38–46. [Google Scholar] [CrossRef]
  32. Phani, P.S.; Oliver, W.C. A direct comparison of high temperature nanoindentation creep and uniaxial creep measurements for commercial purity aluminum. Acta Mater. 2016, 111, 31–38. [Google Scholar] [CrossRef]
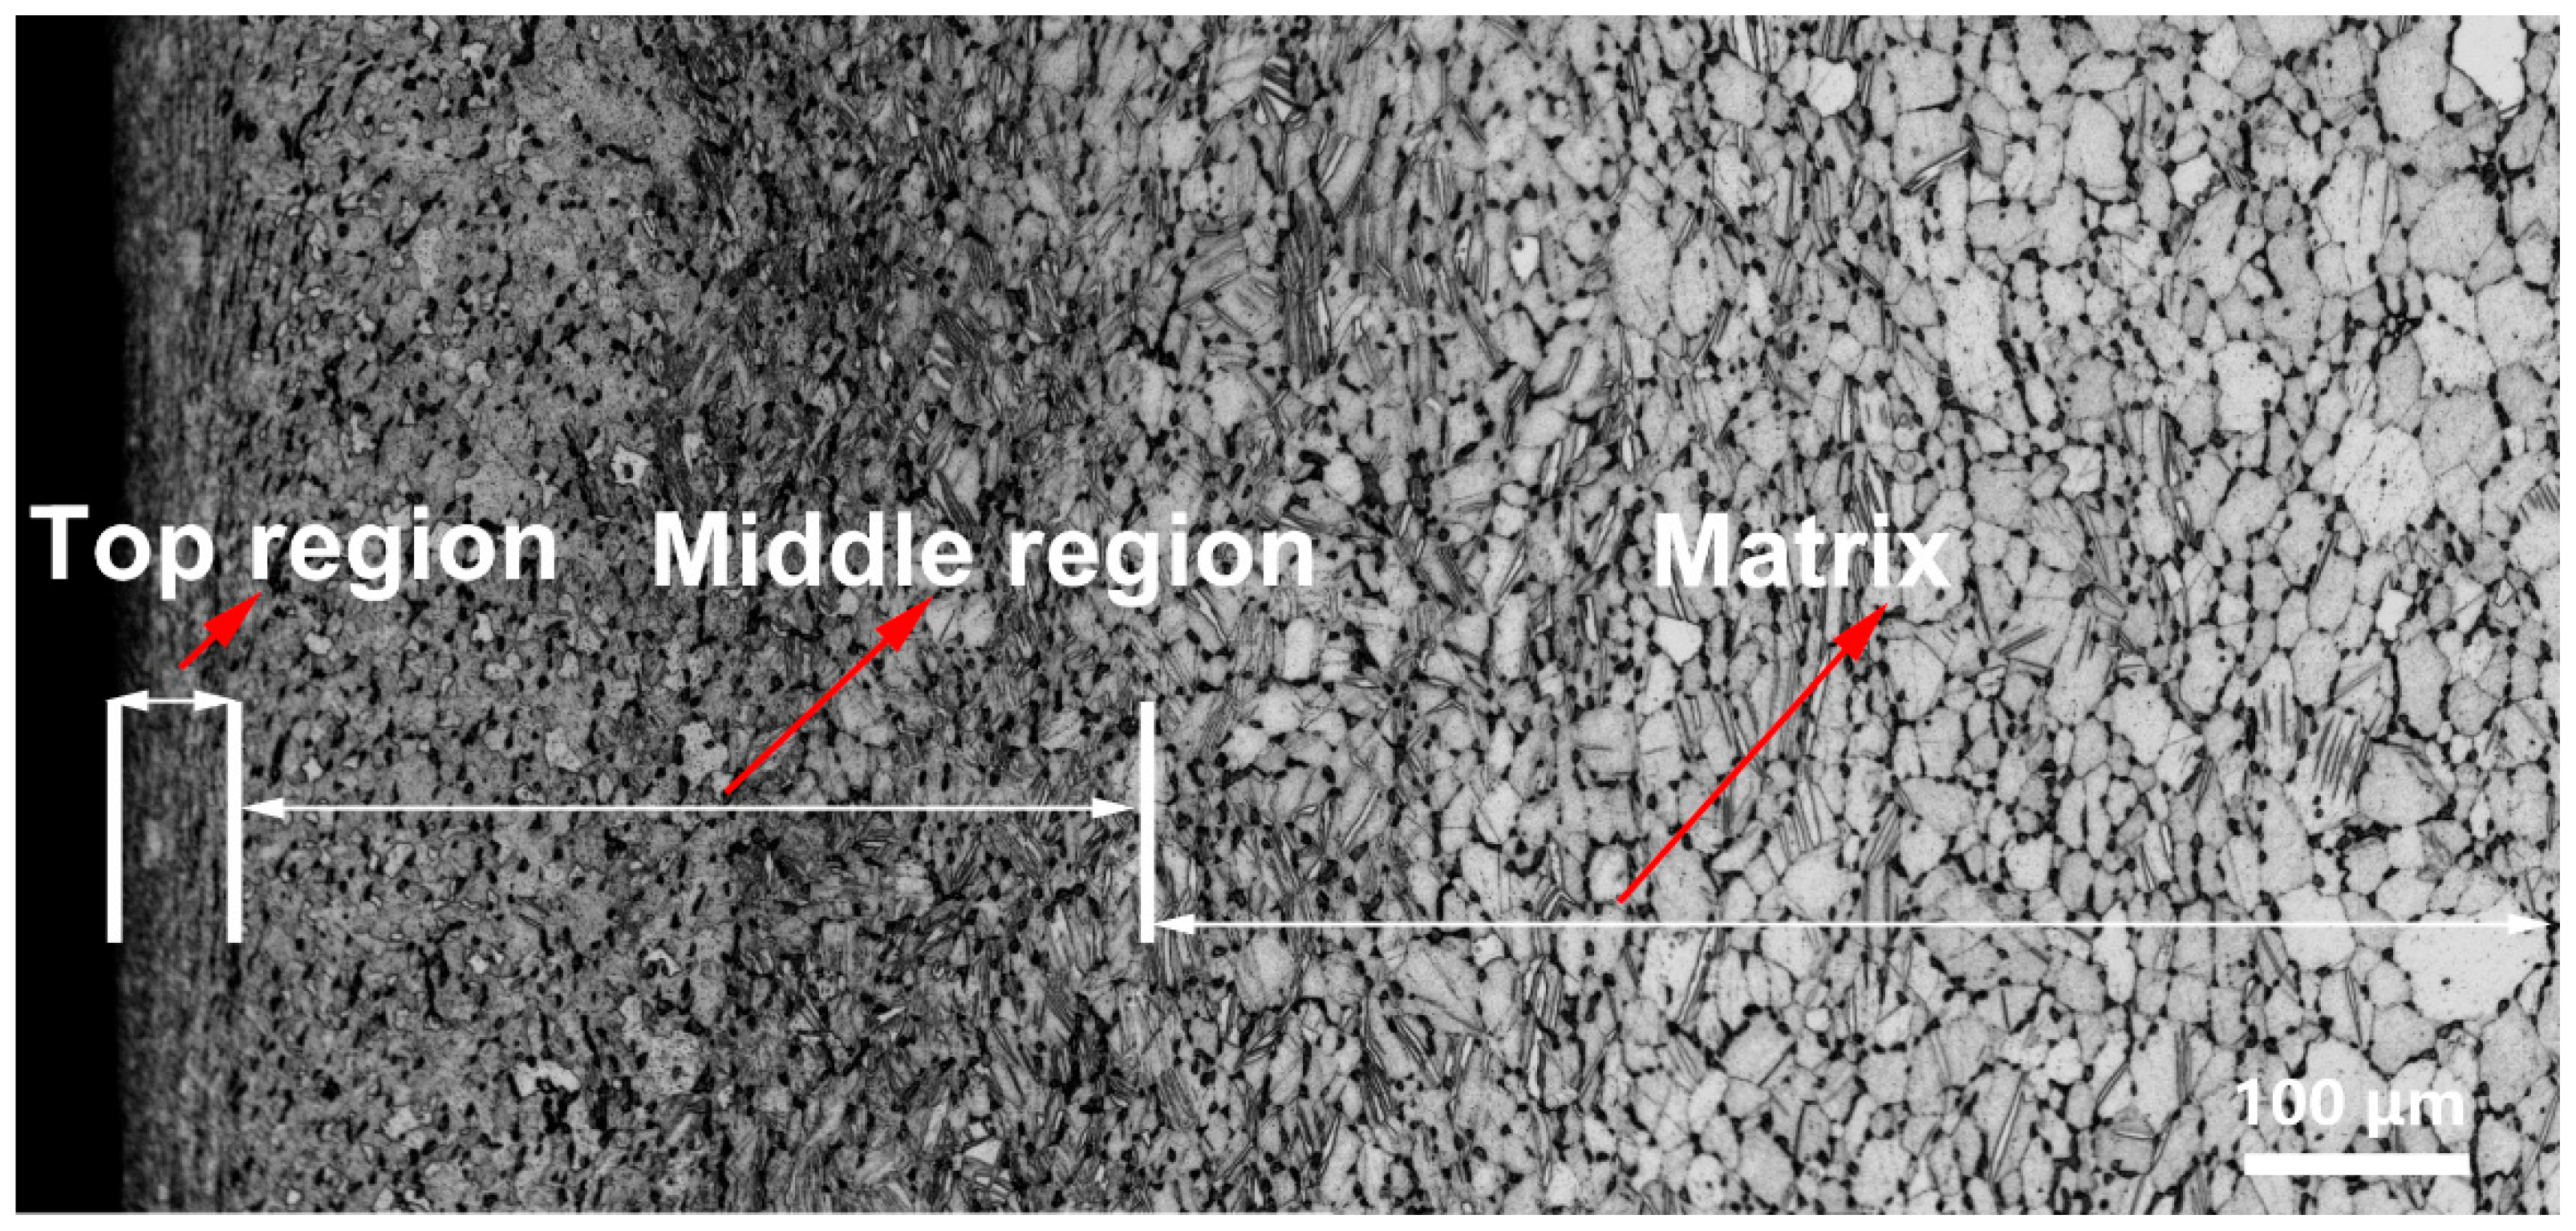
Figure 1. Optical micrograph (OM) image of the cross sectional in the sliding-friction treatment (SFT)-treated Zn alloy.
Coatings 10 00803 g001
Figure 2. SEM micrograph of the top region in the SFT sample (a) and EDS analysis results (b).
Coatings 10 00803 g002
Figure 3. SEM (a) and laser confocal microscopy (LCM) (b) of the cross profile micrographs in the SFT samples. Magnified images of the eutectic phase (c) and the interior of Zn grain (d).
Coatings 10 00803 g003
Figure 4. (a) Bright and (b) dark field images of top layer; (c) microstructures of OM and (d) TEM micrographs of bottom layer, (e) the selected area diffraction patterns at twinning in the selected area of (d).
Coatings 10 00803 g004
Figure 5. (a) Micro- and (b) nano-hardness distribution of the cross sectional in the Zn alloy before and after SFT-treatment; (c) continuous E and H of original Zn and eutectic phase at depth of 500 nm using CSM mode. The corresponding E values (d) in the (b).
Coatings 10 00803 g005
Figure 6. (a,c,e) Load–displacement and (b,d,f) creep displacement–time curves obtained at loading strain rate of 0.4, 0.04 and 0.004/s with holding time of 500 s in the UFG/CG+twinning/CG Zn alloy.
Coatings 10 00803 g006
Figure 7. ln ε ˙ H ln σ H curves obtained at loading strain rate of 0.4/s (a), 0.04/s (b) and 0.004/s (c) with holding time of 500 s in the UFG/CG+twinning/CG Zn alloy.
Coatings 10 00803 g007
Figure 8. V σ H curves of UFG/CG+twinning/CG Zn alloys during holding time.
Coatings 10 00803 g008
Figure 9. (a,b) Two typical bright field images of top layer after serious deformation.
Coatings 10 00803 g009
Figure 10. Principles of two models for dislocation sliding in superplasticity: (a) Dislocations move along the grain boundary; (b) dislocations are produced and move in the blocking grain. Arrows in the graphs presents the grain boundaries (GBs) actives.
Coatings 10 00803 g010
Table 1. Creep stress exponent (n) of UFG/CG+twinning/CG Zn alloy at ε ˙ L of 0.4/s, 0.04/s and 0.004/s.
Materialsn (0.004/s)n (0.04/s)n (0.4/s)
UFG Zn alloy3.713.934.03
CG+twinning Zn alloy5.086.667.15
CG Zn alloy8.6610.9712.88