Article

Nanowire Aptamer-Sensitized Biosensor Chips with Gas Plasma-Treated Surface for the Detection of Hepatitis C Virus Core Antigen

1
Institute of Biomedical Chemistry, 119121 Moscow, Russia
2
Rzhanov Institute of Semiconductor Physics, Siberian Branch of Russian Academy of Sciences, 630090 Novosibirsk, Russia
3
JSC Novosibirsk Plant of Semiconductor Devices with OKB, 630082 Novosibirsk, Russia
4
Department of Infectious Diseases in Children, Faculty of Pediatrics, Pirogov Russian National Research Medical University, 117997 Moscow, Russia
*
Author to whom correspondence should be addressed.
Coatings 2020, 10(8), 753; https://doi.org/10.3390/coatings10080753
Submission received: 30 June 2020 / Revised: 20 July 2020 / Accepted: 22 July 2020 / Published: 1 August 2020
(This article belongs to the Section Surface Coatings for Biomedicine and Bioengineering)

Abstract

:
Herein, we have demonstrated highly sensitive real-time biospecific detection of a protein marker of hepatitis C—the core antigen of hepatitis C virus (HCVcoreAg)—using a nanowire (NW) biosensor. The primary element of the NW-biosensor is a chip with p-type conductance, bearing silicon-on-insulator (SOI) nanowire structures on its surface. The nanowire structures are fabricated by gas-plasma treatment and electron beam lithography. The detection specificity was provided by sensitization of the sensor surface with aptamers against HCVcoreAg. The influence of buffer pH on the sensor response signal was studied. The effect of reverse polarity of the biosensor response signal with change from the acidic buffer pH to the neutral one was found. The lowest detectable HCVcoreAg concentration was determined to be 2.0 × 10⁻¹⁵ M in both acidic (pH 5.1) and neutral (pH 7.4) buffer solution. The proposed aptamer-sensitized sensor was also successfully applied to detect HCVcoreAg in serum samples of hepatitis C patients.

1. Introduction

Hepatitis C virus (HCV) causes either acute or chronic disease of the liver, which can lead to decompensated cirrhosis and hepatocellular carcinoma [1]. Unlike other types of hepatitis viruses, HCV is able to cause the development of chronic infection after the acute one, and this is what leads to cirrhosis and liver cancer in 50% to 90% of cases [2,3]. In 2017, the World Health Organization (WHO) reported 71 million of people worldwide to have diagnosed HCV infection [4]. In contrast, the cumulative 2015–2016 HCV treatment number reached 3 million [5]. The latter unfortunately indicates that the current rate of hepatitis C treatment is very low [6]. For these reasons, HCV represents an acute problem of public health. In this connection, it is to be noted that the effectiveness of anti-HCV therapy upon timely diagnosis reaches 98% [7]. Thus, early diagnosis of HCV represents a key task that must be solved to provide the correct choice of HCV treatment strategy and tactics and to determine the possible prognosis of the outcome of the disease. The development of novel highly sensitive methods of HCV screening is also important for molecular epidemiological surveillance [8].
The core antigen of hepatitis C virus (HCVcoreAg) is HCV nucleocapsid protein. Of all HCV proteins, HCVcoreAg is possessed of the most conservative primary sequence; this feature allows one to consider HCVcoreAg as a versatile protein marker of HCV [9,10]. HCVcoreAg appears in blood 10 to 15 days after infection—that is, only 3 to 5 days later than HCV RNA. Moreover, in a number of studies, the level of HCV RNA was reported to have a significant correlation (with a correlation coefficient from 0.73 to 0.98) with that of HCVcoreAg [11,12,13,14]. Thus, HCVcoreAg represents an attractive protein marker for early diagnosis of HCV. For these reasons, tests for the presence of HCVcoreAg are considered by the WHO as an alternative to the revelation of HCV RNA [15,16]. Moreover, as regards screening studies, when there is no possibility to perform the marker detection test immediately after obtaining the sample from a patient, the use of HCVcoreAg instead of HCV RNA as HCV marker has an additional advantage, since protein molecules can appear to have better time stability than the nucleic acid ones [17]. Furthermore, it is to be noted that nucleic acid detection procedures generally utilize polymerase chain reaction (PCR), which is known to be extremely sensitive to sample contamination; accordingly, protein detection protocols are devoid of such a PCR-related disadvantage.
In modern test systems for HCVcoreAg detection, enzyme-linked immunosorbent assay (ELISA) employing chemiluminescence (CL) reaction (such as in ARCHITECT HCV Ag, Abbott Diagnostics, Wiesbaden, Germany) is commonly employed [8]. As is known, the sensitivity of ELISA-based test systems is, as a rule, limited to the value of 10−14 M [18]. Furthermore, ELISA-based techniques require introduction of additional labels into the analysis [18], which apparently leads to its complication and additional time costs. In [19] it was reported that HCV antigens can circulate in blood at ultra-low concentrations. Thus, the development of novel highly sensitive and highly informative diagnostic approaches with 10−13 M or lower detection limit is required.
New-generation analytical systems for the detection of HCVcoreAg must, in addition to the high sensitivity, should have high operation speed and be easy to use. Recently, nanotechnology-based methods for the revelation of diseases are discussed. In this way, in [20], Xu et al. considered the use of methods, based on nanoparticles and carbon nanomaterials in electrochemical (voltamperometric, electrochemiluminescent, electrical etc.) cytosensors, intended for the detection of cancer cells. Despite these methods being sufficiently sensitive, they register large objects (cells), whose size is of the order of several microns. Although these methods can be employed for the detection of proteins, this requires the development of specialized approaches involving the use of additional labels and/or specialized chemistry. As regards the use of graphene and carbon nanotubes, their application can be promising owing to their very interesting unique conductance characteristics; to date, however, there is no standardized production of these materials, what hinders their use in the development of diagnostic systems. That is, protocols employed in such systems must be devoid of additional labels or amplification of the target molecules, while the fabrication of their sensitive elements must be compatible with standard technologies.
Nanowire biosensors (NW biosensors), whose sensitive element is a nanowire (NW), pertain to label-free real-time detection systems [21,22,23]. Moreover, the use of NW biosensor for the detection of a number protein markers associated with various diseases with a single sensor chip containing an array of NW structures was demonstrated [23]. To provide biospecific detection of marker biomolecules, the NW sensor surface is, as a rule, sensitized with probe molecules, whose ability to form biospecific complexes with these target marker molecules is known. Antibodies against the target molecules are commonly employed as probe molecules. The silicon-on-insulator (SOI) structure-based chips for the biosensor were fabricated using a technology, compatible with the standard complementary metal-oxide-semiconductor (CMOS) technology; electron beam lithography and gas-plasma treatment were employed. With the use of antibodies and/or aptamers as probe molecules, we demonstrated the application of an NW biosensor based on silicon-on-insulator nanowire structures (SOI-NW) for the detection of various protein and nucleic acid marker biomolecules associated with various diseases in human [23,24,25,26,27].
Antibodies are known to have a number of disadvantages—namely, high cost and lack of time and chemical stability. The latter issue, with respect to biosensor applications, limits the functionality of biosensors with antibody-sensitized sensor surfaces, as one is forced to avoid stringent wash conditions often required for the regeneration of the sensor surface upon its repeated use. As regards nanowire biosensors, one should additionally note that their sensitivity decreases with the increase of the distance between the sensor surface and the target molecule due to the Debye screening effect. Therefore, the characteristic Debye screening length in 1 mM potassium phosphate buffer makes up ~5 nm [28], which is non-optimal for the detection of relatively large protein complexes formed on the SOI-NW sensor surface. This problem can be solved by using smaller probe molecules—for instance, aptamers instead of relatively large antibodies, as was demonstrated in a number of studies [24,29,30,31]. NW biosensors with aptamer-sensitized sensor surfaces are called NW aptasensors [25].
It is known that the acidity (i.e., pH) of the medium in the biosensor’s measuring cell can significantly influence the response of a biosensor upon the detection of a target protein [23]. Previously, employing antibody-sensitized NW sensor chips, we studied the influence of the acidity (i.e., pH) of the medium in the biosensor’s measuring cell on the detection of hepatitis B virus surface antigen protein and alpha-fetoprotein [23].
In the present study, a method of detection of hepatitis C protein marker—HCVcoreAg—with a NW aptasensor based on SOI-NW structures with p-type conductivity in buffer solutions with various pH and in real human serum samples has been developed. Biospecificity of the detection has been provided by sensitizing the sensor surface with aptamers against HCVcoreAg.
The lowest HCVcoreAg concentration detectable with the SOI-NW-based aptasensor in buffer was detection limit ~10−15 M at both acidic and neutral pH. As regards the influence of buffer pH on the detection of the target protein, the effect of reverse polarity of the signal has been observed with change from the acidic buffer pH to the neutral one. Moreover, good reproducibility has been demonstrated upon the repeated detection of HCVcoreAg in both buffer solutions and real serum.

2. Materials and Methods

2.1. Chemicals

3,3′-Dithiobis (sulfosuccinimidyl propionate) (DTSSP cross-linker) was purchased from Pierce (Waltham, MA, USA). Potassium phosphate monobasic (KH2PO4) and 3-aminopropyltriethoxysilane (APTES) were purchased from Sigma-Aldrich (St.-Louis, MO, USA). Potassium hydrogen phthalate (C6H5KO4) was purchased from Scharlau (Scharlab S.L., Sentmenat, Spain). Methanol (CH3OH) was from Sigma (St.-Louis, MO, USA). Hydrogen peroxide (H2O2) and hydrofluoric acid (HF) were from Reakhim (Moscow, Russia). Deionized water was obtained using the Milli-Q system (Millipore, Bedford, MA, USA).

2.2. Proteins and Aptamers

An aptamer against HCVcoreAg was selected according to the reasons discussed in our previous paper [26] and had the following sequence listed in the paper by Shi et al. [32]: 5′-NH2-(T)10-ACGCTCGGATGCCACTACAGGCACGCCAGACCAGCCGTCCTCTCTTCATCCGAGCCTTCACCGAGCCTATGGACGTGCTGGTGA-3′ (purchased from Evrogen, Moscow, Russia). Recombinant hepatitis C virus capsid protein HCVcoreAg (22 kDa), modified with β-galactosidase (114 kDa) at N-terminal end, was from ViroGen (Watertown, MA, USA). According to the data provided by the manufacturer, the HCVcoreAg used in our study has an isoelectric point (pI) of 8.9.

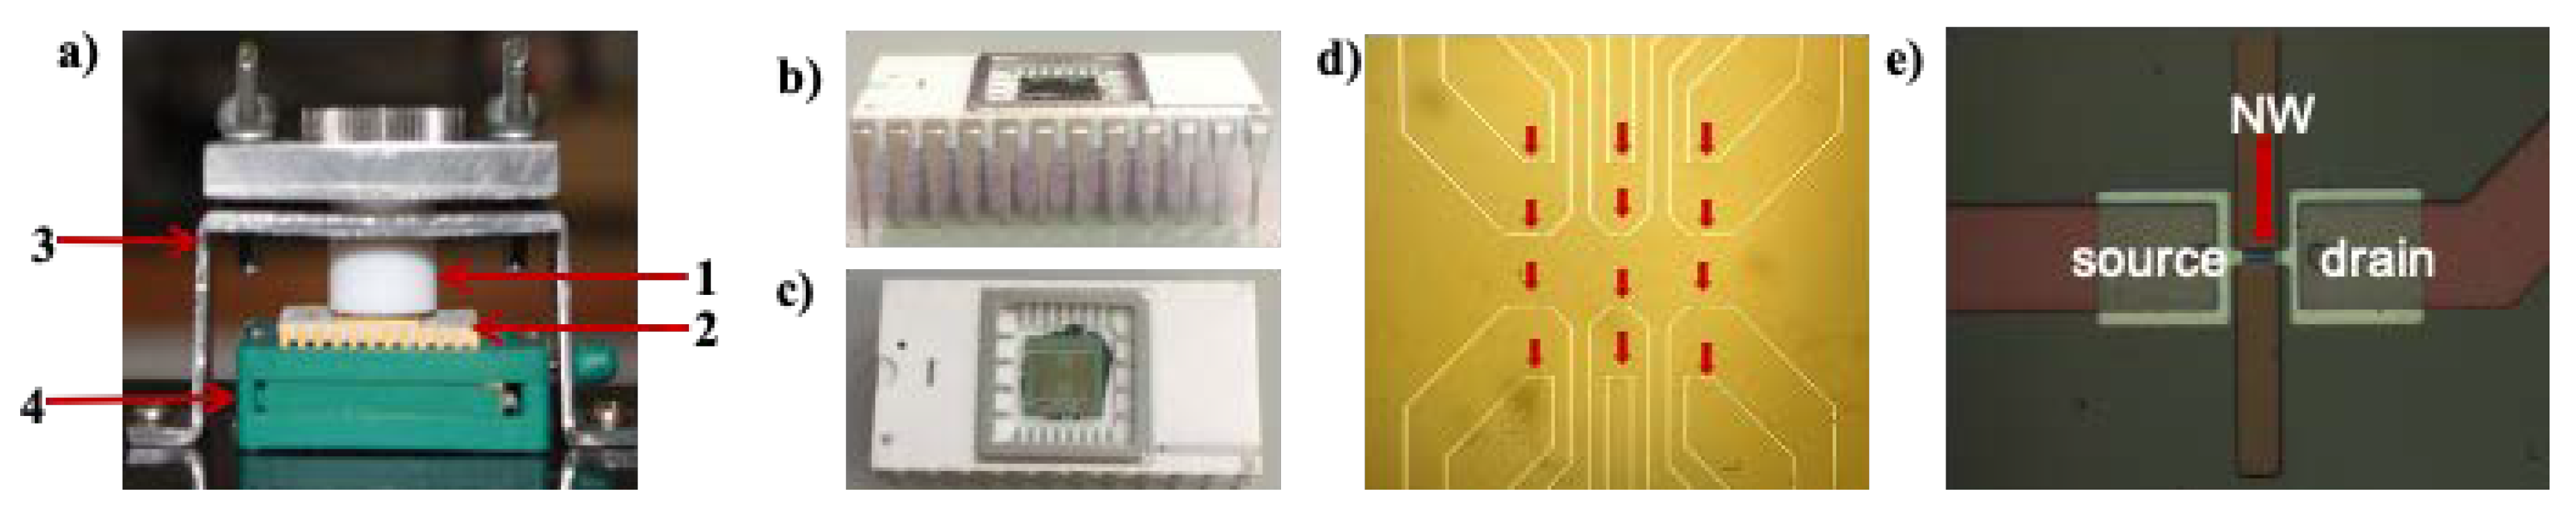
2.3. Silicon-on-Insulator Nanowire (SOI-NW) Sensor Chips

Each of the sensor chips employed in our present study was bearing 12 3-μm-wide SOI-NW structures of p-type conductance.
The SOI structures were obtained using a technology similar to SmartCut®; but, unlike the latter, our technology consisted in transferring only silicon layers onto preliminary oxidized silicon (Si) wafers under the action of hydrogen [33].
The total initial thickness of Si layers was 500 nm, and the thickness of buried oxide was 300 nm. The thickness of the upper Si layer was reduced to the value of 10 to 30 nm by repeated thermal oxidation. The oxide layer on the surface of the Si wafers was removed after each oxidation step using a dilute (1:100) solution of hydrofluoric acid. After that, the resulting nanometer-sized SOI structures were subjected to optical lithography to produce mesostructures in the form of 3 µm-wide Si bands. Then, aluminum metallization, electron lithography, and gas etching with XeF2 were sequentially used to reduce the width of the nanowire sensors in the central area of the structure to 300 nm. In addition, plasma-enhanced chemical etching in a SF6:CFCl3 gas mixture was used. Finally, to form nanowires’ contacts on the SOI structures, post-metallization annealing in a forming gas at 420 °C was performed.
The analytical module of the NW biosensor includes a 500 µL measuring cell, whose bottom is represented by the SOI-NW chip with 12 nanowires, arranged in pairs; the chip is framed into a standard micro-circuit body (Figure 1). The setup of the NW biosensor is described in detail elsewhere [23,25].
The diameter of the chip surface area directly contacting with the liquid in the cell was 2 mm. During the biosensor experiments, the liquid in the cell was stirred at 3000 rpm.
The electronic measuring module of the NW biosensor is intended for the simultaneous registration of a signal from five nanowires, formed on the SOI-NW chip, and for the real-time visualization of the sensor signal on a personal computer during the measurements. The sensor signal is presented graphically in the form of sensogram curves.

2.4. Sensitization of Sensor Surface

The procedure used for SOI-NW surface functionalization is described in detail in our previous papers [23,24,25,26,27]. Briefly, the chip surface of the SOI-NW structures was treated with HF solution in methanol to remove organic contaminants and then incubated in an ozonator to form hydroxyl groups on the sensor surface. After that, the chip surface was silanized with APTES. To provide biospecific functionality of the surface, aptamers against HCVcoreAg were covalently immobilized on the surface of individual SOI-NW structures via DTSSP chemistry employing a Piezorray low-volume high-accuracy dispenser system (Perkin Elmer, Inc., Waltham, MA, USA) as described in our previous papers [26,27]. After the immobilization of aptamers, the SOI-NW chip was washed in deionized water for 30 min.

2.5. Preparation of the Core Antigen of Hepatitis C Virus (HCVcoreAg) Solutions in Buffer

Buffered solutions of HCVcoreAg with concentrations from 10−16 to 10−13 M were prepared from the initial 2 μM solution of this protein in 50 mM potassium phosphate buffer (pH 7.4) by serial ten-fold dilution with the measurement buffer—either 1 mM potassium phosphate buffer (with a pH of 7.4) or 1 mM phthalate buffer (with a pH of 5.1). During the dilution procedure, the solution at each dilution step was kept in a shaker for 30 min at 10 °C. The protein solutions were prepared immediately before measurements.

2.6. Serum Samples

The serum samples used in this study were provided by State Budgetary Institution of Health of Moscow Research Institute of First Aid named after N.V. Sklifosovsky of the Health Department of Moscow (Russia) and State Research Center Burnasyan Federal Medical Biophysical Center of Federal Medical Biological Agency (Moscow, Russia). Conducting this study was approved by independent ethical committees organized on the basis of the organizations that provided the samples. Written informed consents were obtained from the patients and from healthy volunteers authorizing the participation in the study and the use of the biological material. All the samples were deactivated prior to their use in the study to provide biological safety.
Prior to the use in biosensor experiments, the serum samples were depleted from 14 major proteins with a Hu-14 Multiple Affinity Removal Column (4.6 mm × 50 mm, Agilent, Santa Clara, CA, USA) according to manufacturer’s instructions [34]. The depleted serum samples were then 2000-fold diluted with 1 mM phthalate buffer with pH 5.1.

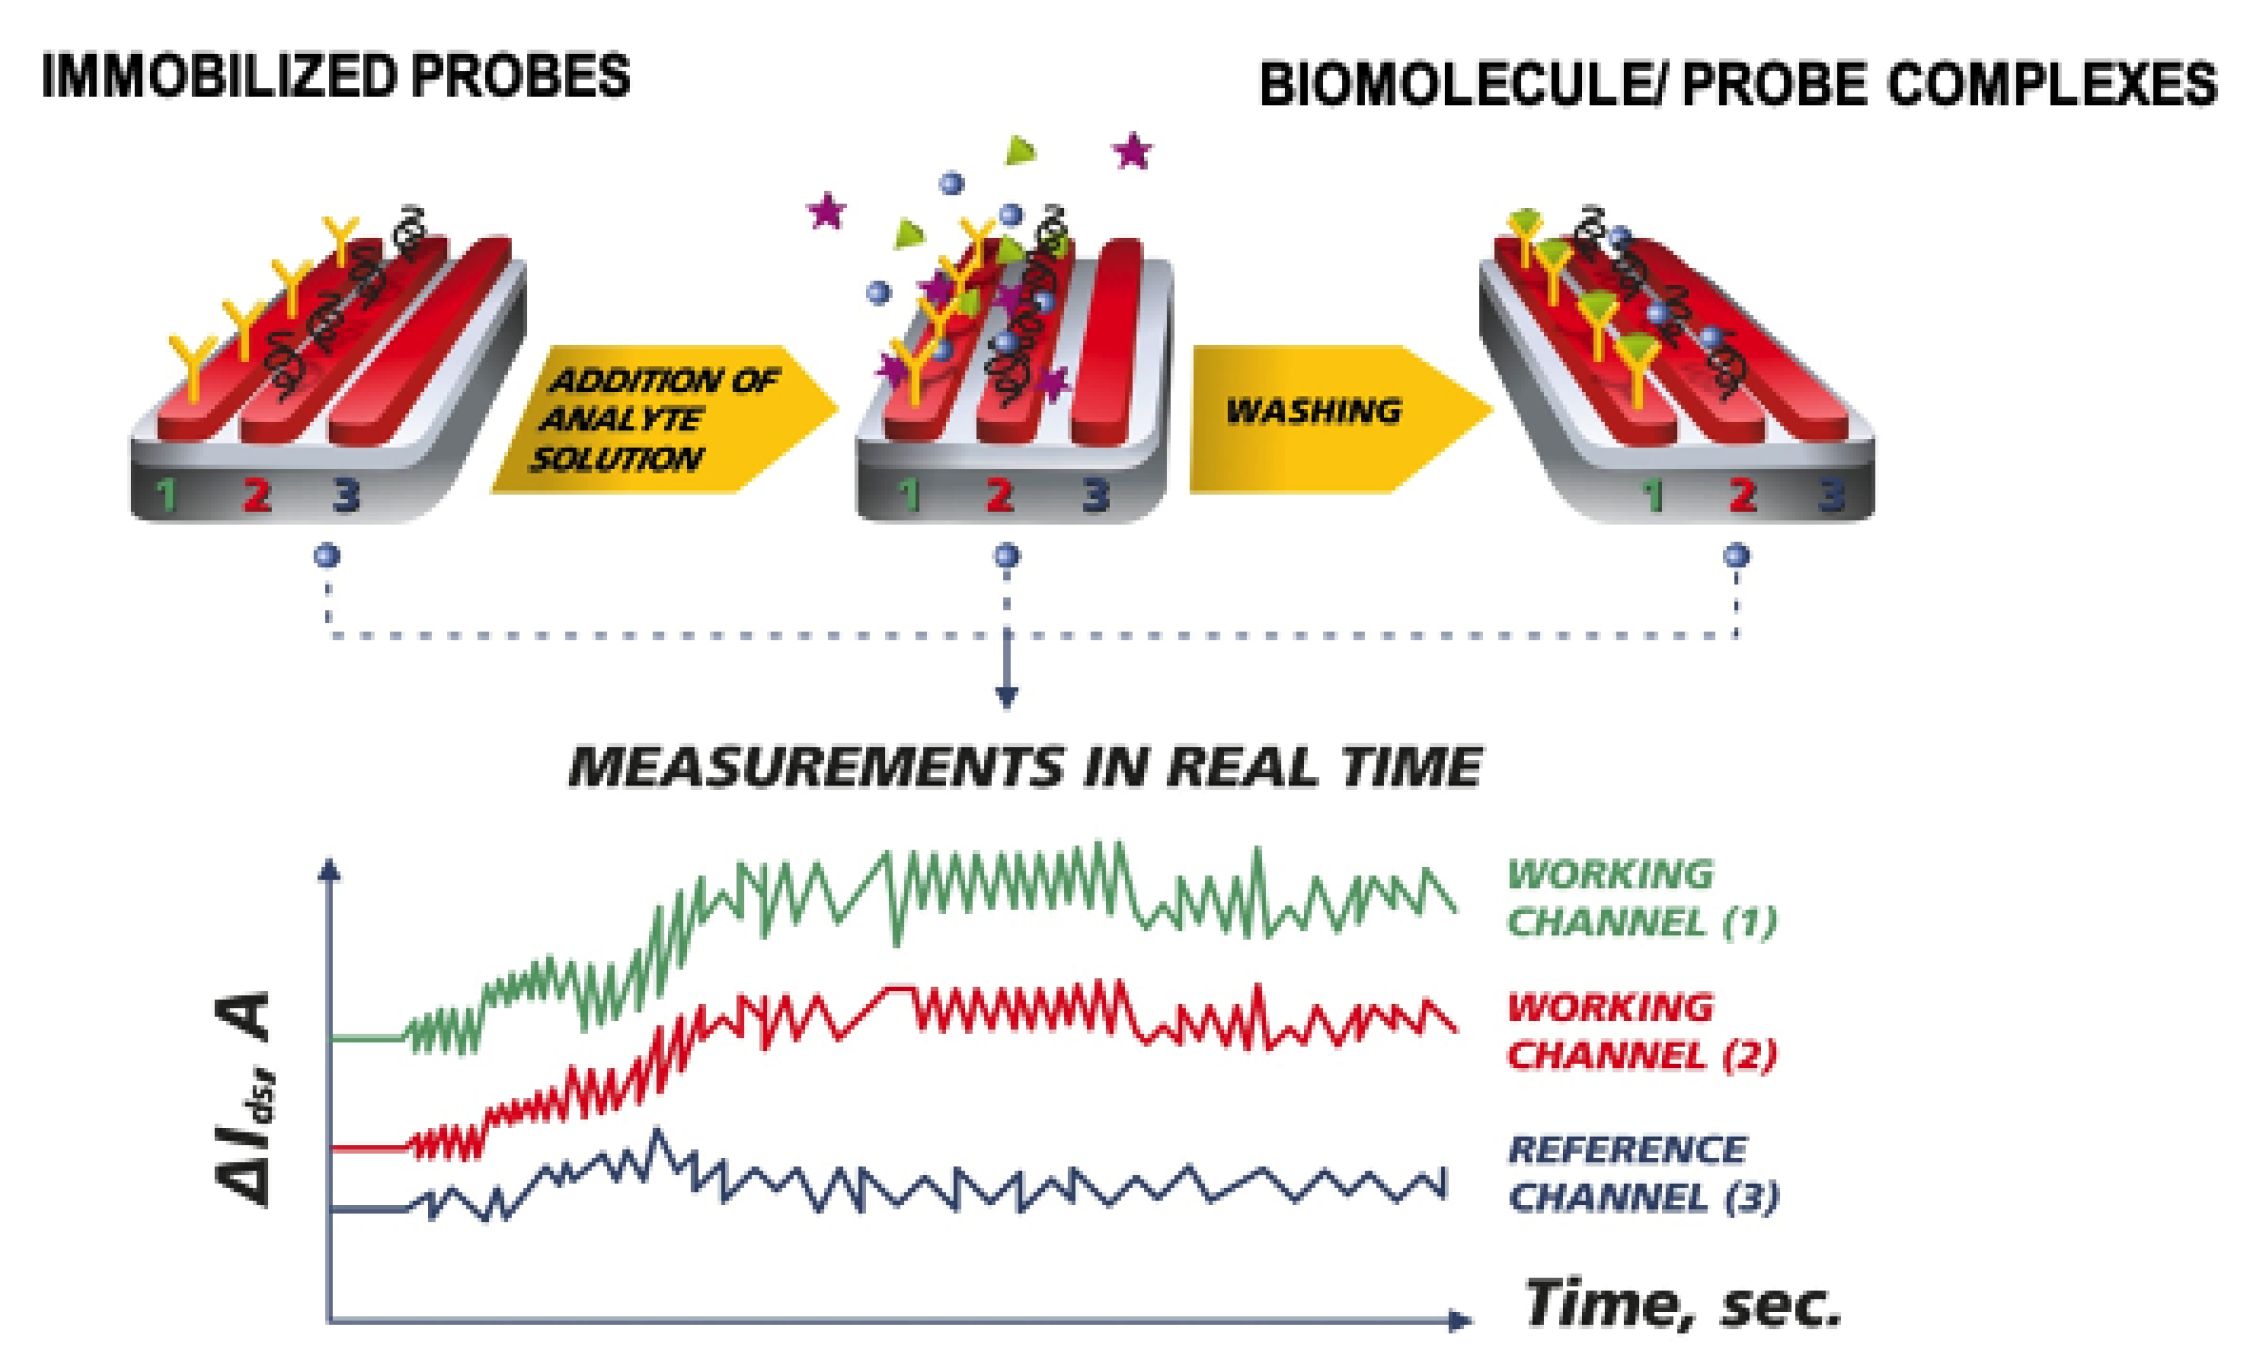
2.7. Electrical Measurements

The principle of the NW biosensor operation is based on the registration of changes in the conductance of sensor elements (nanowires) during the adsorption of charged protein molecules on to their surface (Figure 1d,e). The current (Ids, A) through a nanowire is set by a fixed source-drain voltage (Vds, V) (Figure 1e).
In case of adsorption of charged molecules on to the sensor surface of the nanowire, sensitized with molecular probes (antibodies or aptamers), a change in the nanowire’s conductance is observed (Figure 2). In our study, the analyzed sample, containing HCVcoreAg, was added into the measuring cell of the NW biosensor. At that, the adsorption of charged analyte molecules onto the aptamer-sensitized nanowire surface caused a change in the current flowing through the nanowire.
Electrical measurements were performed employing a Keithley 6487 picoampermeter (Keithley, Solon, OH, USA) as described in our previous paper [26]. Monitoring of the time dependencies of the current ΔIds(t) for the SOI-NW transistor was carried out at a fixed voltage on the second gate (the substrate of the SOI structures) Vg in real time. For protein registration with the NW aptasensor in pure buffer solution, HCVcoreAg solution (150 μL) in buffer was added into the measuring cell containing 300 μL of the same buffer. In the case of the analysis of serum samples, 5 µL of serum samples (treated as described in the previous section) was added into the measuring cell containing 100 µL of phthalate buffer. The time dependencies of the current ΔIds(t) were measured at Vg = (−45) V and Vds = (−0.2) V. To account for non-specific adsorption of HCVcoreAg, the NW chip contained a pair of control SOI-NWs without immobilized probe molecules (apart from working SOI-NWs, whose surface was functionalized with aptamers against HCVcoreAg). An additional Pt electrode was immersed into the solution in the measuring cell [24] to avoid possible induced charge upon the solution input into the measuring cell, as such a charge can influence the character of initial parts of binding curves before it drains to the ground. The induction of charge upon the solution input into the measuring cell is discussed elsewhere [35].

2.8. Data Representation

The data obtained during the measurements were processed as described elsewhere [26]. Briefly, the registered changes in the level of current signal (Ids) were normalized to 1 by division by the initial value of the current (Ids0); then, a differential signal between the normalized signal from the working NW (whose surface was sensitized with aptamers against HCVcoreAg) and that from control NW (without immobilized probe molecules) was calculated. The resulting time dependencies of the current signal ΔIds(t) were presented in the form of sensogram curves displaying differential signal, which was calculated by subtracting the signal from control SOI-NW from that of working SOI-NW, similar to [26].

3. Results

Using a NW aptasensor with p-type SOI-NWs, obtained using electron beam lithography with subsequent gas-plasma etching, a biospecific detection of HCVcoreAg protein has been carried out in two types of buffer with either neutral (1 mM potassium phosphate buffer, pH 7.4) or acidic pH (1 mM potassium phthalate buffer, pH 5.1). The data obtained in the course of the real-time biosensor measurements were collected, then processed as described above and presented in the form of sensogram curves.

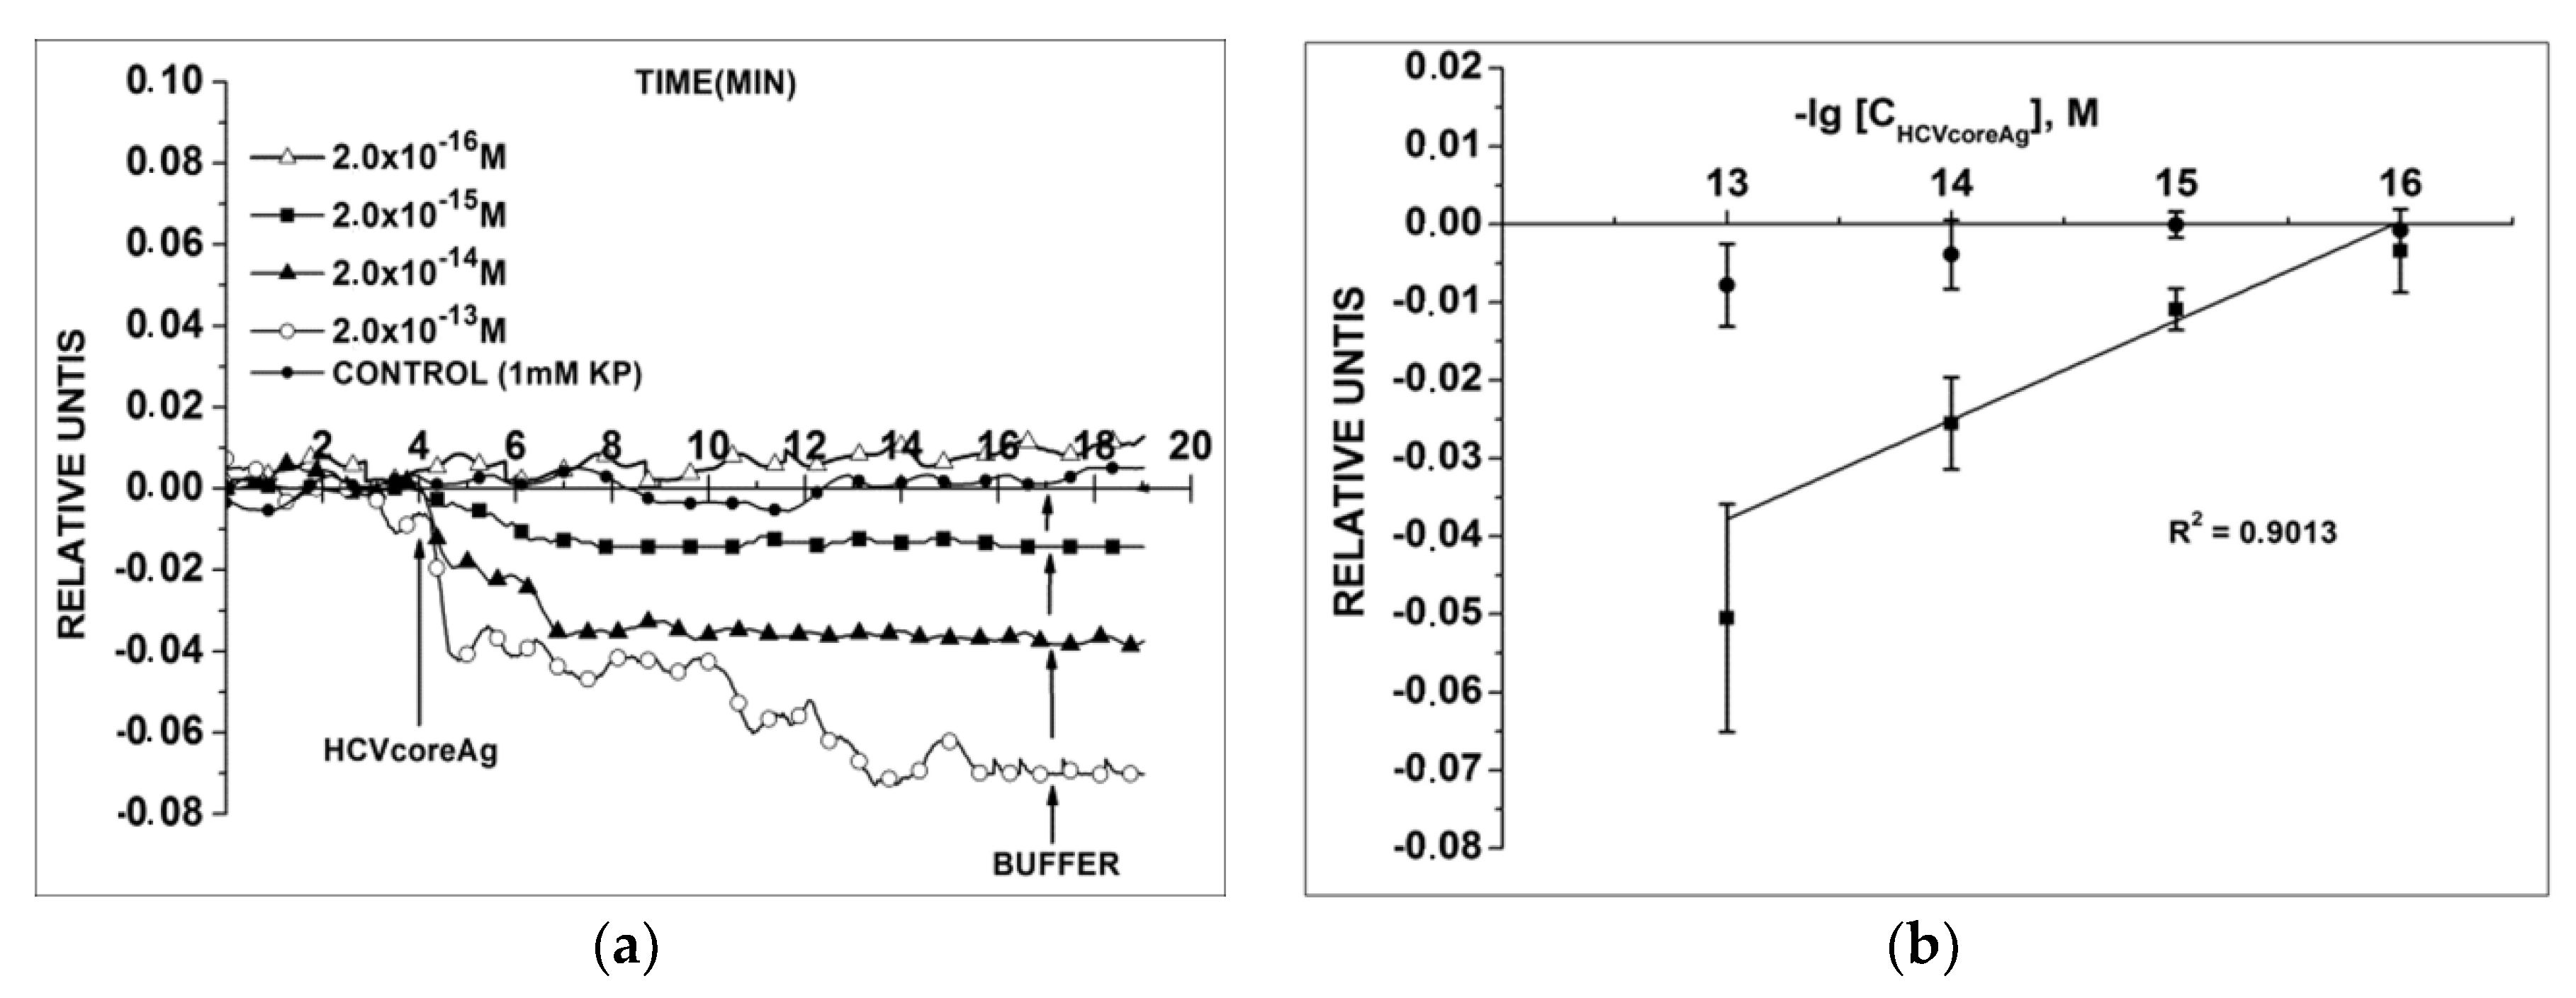
3.1. Detection of HCVcoreAg in Acidic Buffer

Typical ΔIds(t) dependencies obtained upon HCVcoreAg detection at concentrations from 2.0 × 10⁻¹⁶ to 2.0 × 10⁻¹³ M in 1 mM phthalate buffer with acidic pH 5.1 are presented in Figure 3. The curves shown in Figure 3 indicate that, at acidic pH of 5.1, the addition of HCVcoreAg into the measuring cell caused a decrease in SOI-NW conductivity, what is obviously caused by adsorption of HCVcoreAg target molecules onto the sensor surface. An expected decrease in the signal level with decreasing the target protein concentration from 10−13 to 10−16 M was observed.
At that, the lowest detectable concentration of HCVcoreAg was 10−15 M. This value was determined as the concentration, at which the signal was still clearly distinguishable from that obtained upon addition of protein-free buffer instead of target protein solution (see “control” curve in Figure 3a). So, the sensogram curves obtained at pH 5.1 clearly indicate a biospecific interaction between the SOI-NW-immobilized probe molecules and target HCVcoreAg molecules.

3.2. Detection of HCVcoreAg in Neutral Buffer

Typical ΔIds(t) dependencies obtained upon the detection of HCVcoreAg at concentrations from 2.0 × 10⁻¹⁶ to 2.0 × 10⁻¹³ M in 1 mM potassium phosphate buffer with neutral pH of 7.4 are displayed in Figure 4.
The curves shown in Figure 4 indicate that the addition of HCVcoreAg into the measuring cell at neutral pH causes an increase in SOI-NW conductivity—as opposed to the case with the acidic buffer. Moreover, from this figure one can also see that a decrease in the signal level with decreasing the target protein concentration from 10−13 to 10−16 M was observed in these conditions.
Control experiments were conducted using pure protein-free potassium phosphate buffer (pH 7.4) instead of HCVcoreAg solution («control» curve in Figure 4a). At that, the response from the sensor was virtually indistinguishable. This confirms that, at neutral pH of 7.4, the response signal observed in experiments with HCVcoreAg solution is indeed caused by biospecific interaction between the sensor-immobilized aptamer probe molecules and target molecules. The lowest detectable HCVcoreAg concentration was 10−15 M; this value is equal to that obtained at acidic pH of 5.1.

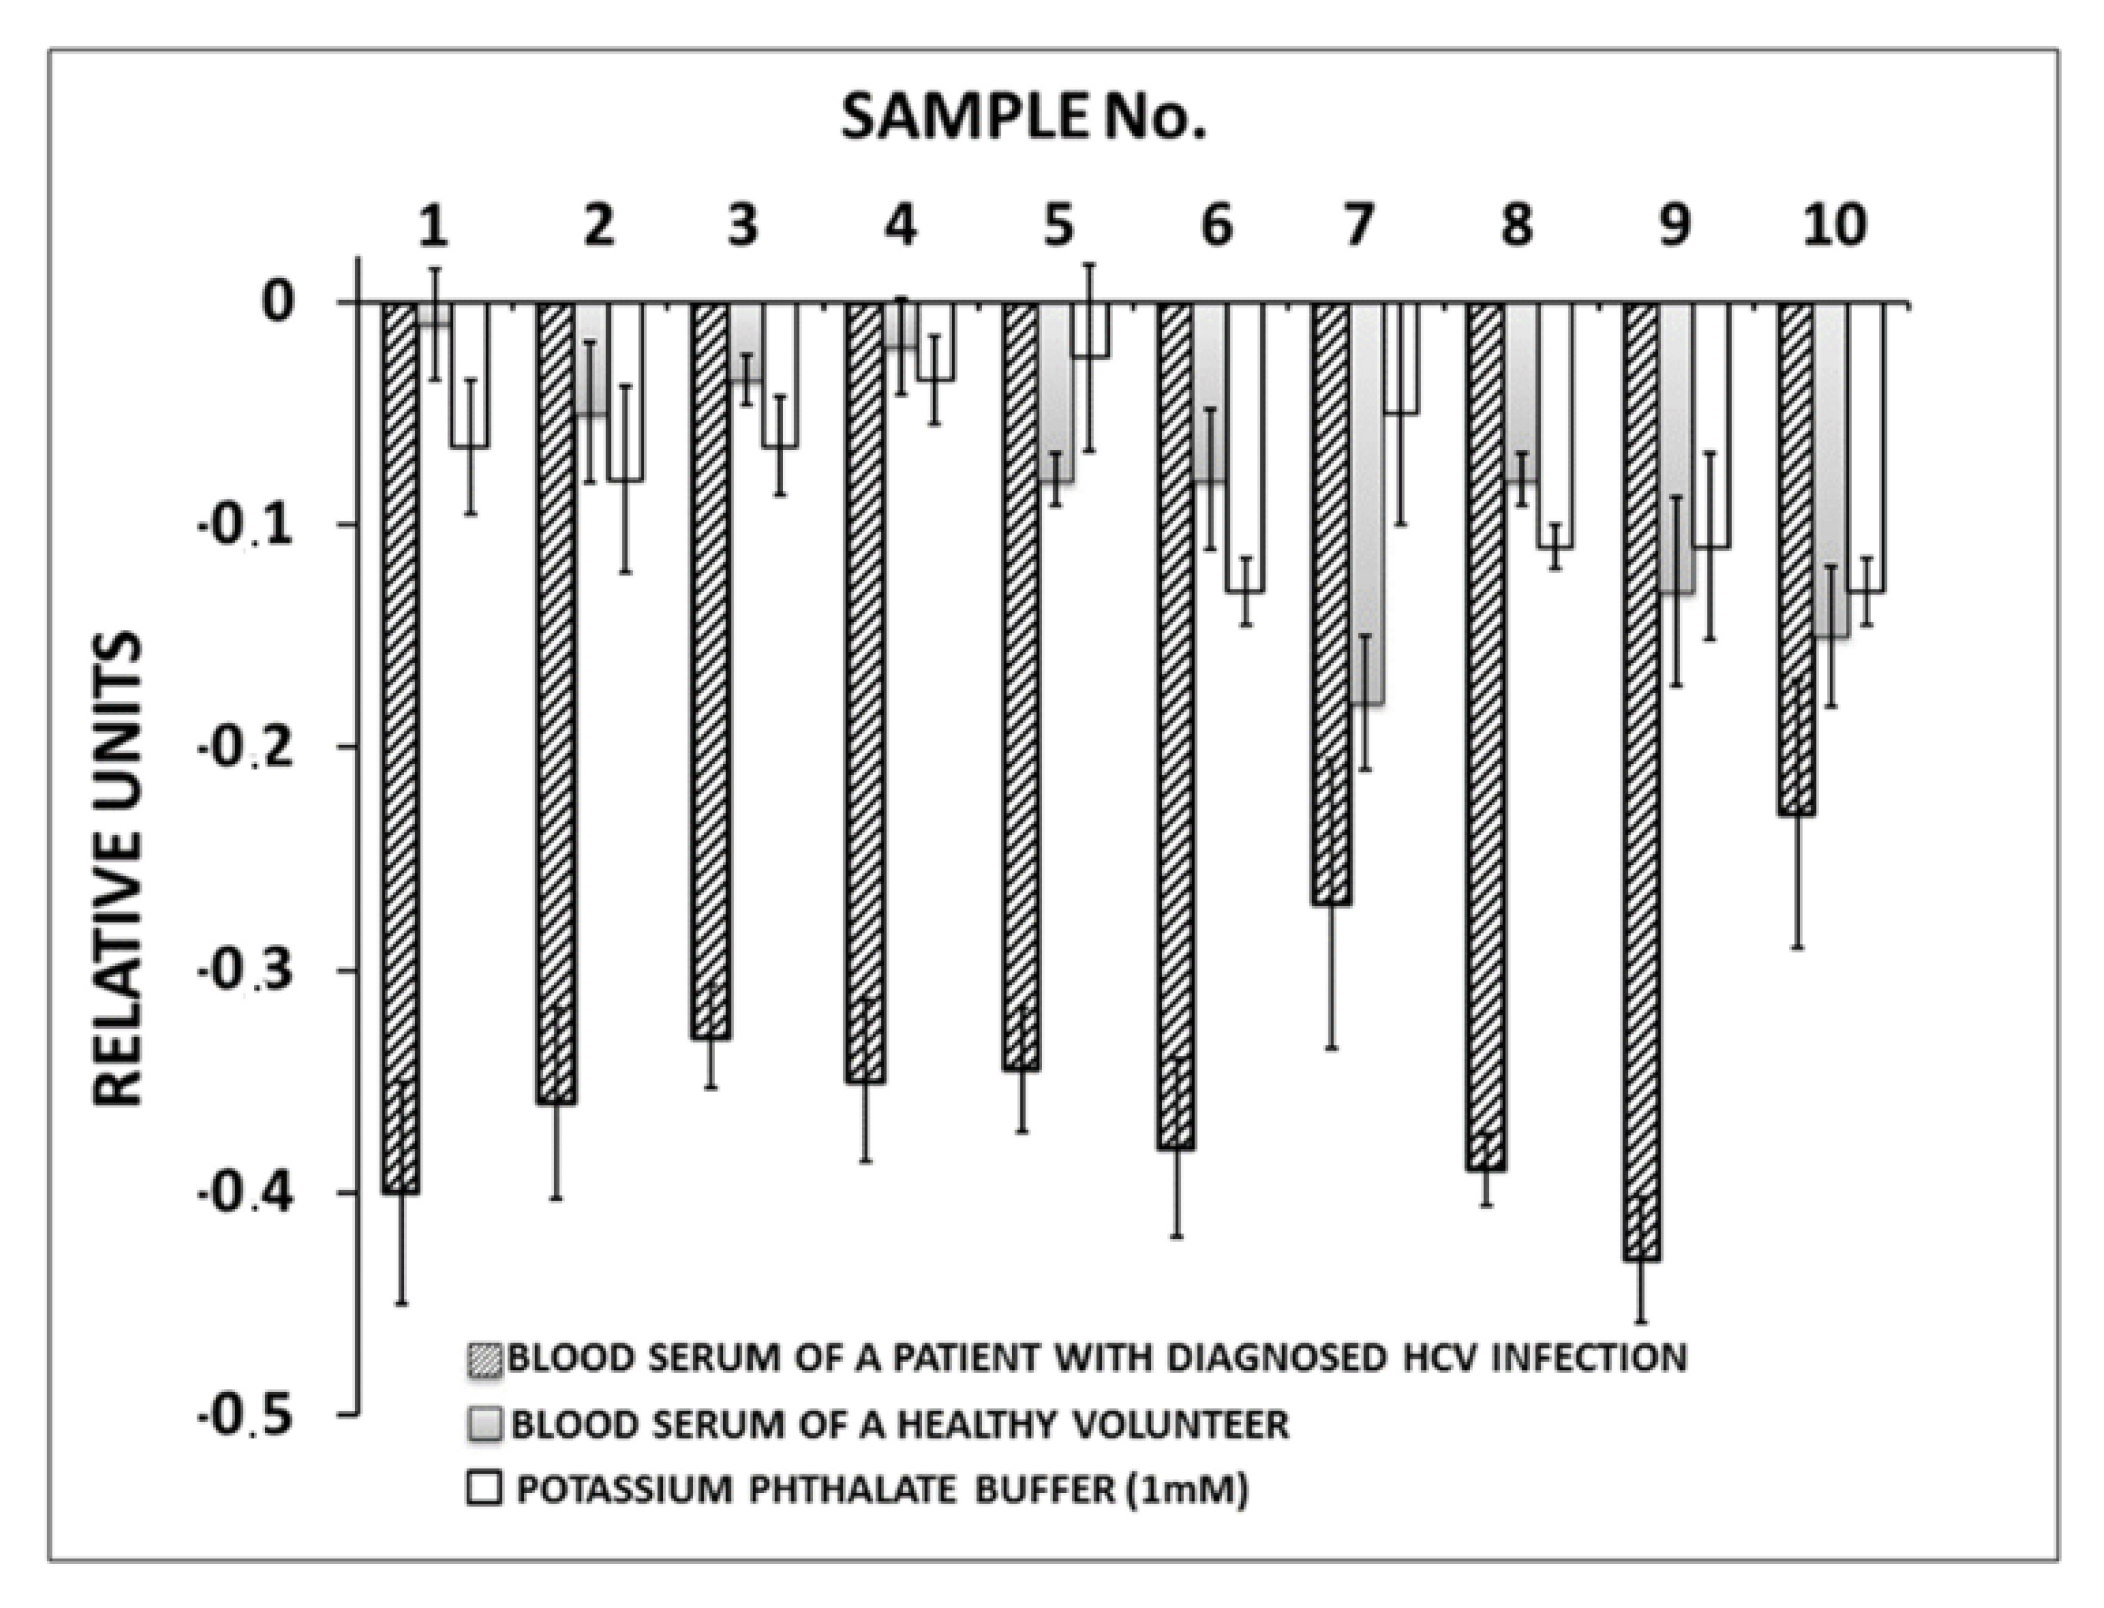
3.3. HCVcoreAg Detection in Human Serum Samples

The selectivity of biosensor-based detection of a target protein is an important factor determining its applicability in practice. The selectivity of our NW-based aptamer-sensitized sensor towards the target HCVcoreAg molecules has been estimated by comparing the level of the sensor signal observed upon the analysis of samples of hepatitis C patients with that obtained with the samples of healthy volunteers. Figure 5 shows the results examples of sensogram curves obtained upon the analysis of ten serum samples for the presence of HCVcoreAg.
After addition of serum samples nos. 1 to 6, 8, and 9, obtained from hepatitis C patients, into the NW aptasensor measuring cell, an increase in the signal level was observed (Figure 5, hatched bars). Upon analysis of hepatitis C patients’ sera nos. 7 and 10, the signal level differed insignificantly from that observed after addition of sera of healthy volunteers or pure buffer solution. In control experiments with sera of healthy volunteers, either no change in the signal was observed, or this change was much less pronounced (Figure 5, grey bars) than that in experiments with sera of hepatitis C patients.
Figure 6 illustrates the reproducibility of the results obtained and the efficiency of regeneration of the sensor surface with the example of sensogram curves obtained upon the analysis of one and the same serum sample of a hepatitis C patient.
The serum sample #1 was added into the measuring cell of the NW aptasensor three times. Between the additions, the sensor surface of the SOI-NW chip was washed with sodium dodecyl sulfate (SDS) solution according to the technique described elsewhere [24]. The analysis of the data obtained has indicated that, upon repeated additions of the analyzed sample into a measuring cell, the change in the signal makes up (~35 ± 5)% in comparison with the signal level registered after the first introduction of this sample. The observed reproducibility of the signal has been obtained owing to the use of an SDS-containing solution for regeneration of the sensor surface. Thus, the previously developed technique of regeneration of the sensor surface of the SOI-NW chip allows its repeated use upon analysis of biological fluids.

4. Discussion

It has been found that using the aptamer-sensitized NW sensors with p-type conductivity, the signal from the sensor increased upon the addition of HCVcoreAg at neutral pH (7.4) and decreased at acidic pH (5.1). That is, the reverse polarity of the signal has been observed with change from the acidic buffer pH to the neutral one. Previously, we reported occurrence of this phenomenon upon the application of a high frequency electric field during the detection of HCVcoreAg in potassium phosphate buffer (pH 7.4) [26]. Herein, we have observed the same effect for the same target protein upon the change of pH of the medium. In the latter case, the occurrence of reverse polarity can be explained in the following way.
We assume that, apart from biospecific “probe/target” interaction (which determines the occurrence of the sensor response signal), the NW surface also interacts with other part of the target molecule (which exists in the form of a conjugate with β-galactosidase); the latter determines the occurrence of the reverse polarity of the sensor response signal. According to the information provided by the manufacturer of the HCVcoreAg preparation employed in our study, this HCVcoreAg protein contains β-galactosidase fragment and has a basic pI of 8.9; the molecular weight of the β-galactosidase fragment itself is 114 kDa (http://www.virogen.com/). In our previous paper, the size of this molecule was estimated to be in the range from 6 to 12 nm [26]. That is, the size of β-galactosidase molecule exceeds the length of the NW sensor element’s sensitivity zone, which is <4 nm [26]. The latter leads to the fact that only a part of β-galactosidase-conjugated HCVcoreAg molecule can enter the sensitivity zone. Accordingly, only this part of the target molecule, which enters the sensitivity zone—but not the entire molecule—influences the SOI-NW conductivity upon the detection of the target protein.
For simplicity, let us consider the target molecule of β-galactosidase-conjugated HCVcoreAg as a dipole, which contains negatively and positively charged areas. In this way, in the neutral buffer the sensor-immobilized oligonucleotide probes probably interact with a negatively charged fragment of the dipole, which is located near the NW surface, while its positively charged fragment locates further away from the sensor surface. An increase in the signal from p-type SOI-NW upon the detection of β-galactosidase-conjugated HCVcoreAg solution can be explained by the fact that in this case, oligonucleotide probe molecules interact with only negatively charged part of the dipole.
At acidic pH, the sensor-immobilized aptamer probes more readily interact with a positively charged fragment of the dipole instead of the negatively charged one. This leads to an increase in the sensor conductivity instead of its decrease observed at neutral pH.
In the case of serum samples, the interaction of sensor immobilized probe molecules with serological HCVcoreAg, which does not contain the β-galactosidase fragment, is registered. It should be noted that only acidic buffer (pH 5.1) was used throughout the experiments with sera. Upon the addition of analyzed serum sample into the measuring cell, the sensor conductivity increased—as opposed to the case with detection of purified β-galactosidase-conjugated HCVcoreAg in the same acidic buffer. This phenomenon can be explained analogously to that reported in our previous paper [26], where the effect of high frequency electric field on the detection of HCVcoreAg in serum was studied. Despite serological HCVcoreAg does not contain the β-galactosidase fragment, it can exist in the form of complicated protein complexes. In a multicomponent matrix like serum, such protein complexes have complicated structure; in the first approximation, they can be modeled by a dipole with a non-uniform charge distribution. The increase in conductivity of the NW sensor upon the addition of analyzed serum of a hepatitis C patient occurs apparently due to the fact that this macromolecular dipolar protein complex interacts with the oligonucleotide in such a way that the negative part of this dipole locates near the sensor surface.
In our present study, the lowest detectable HCVcoreAg concentration has been determined to be 2.0 × 10⁻¹⁵ M at both neutral (7.4) and acidic pH (5.1). Thus, a p-type SOI-NW-based biosensor with 3 μm-wide aptamer-sensitized sensor elements can well be employed for the revelation of hepatitis C protein marker with femtomolar concentration sensitivity.
Such a high sensitivity of the NW aptasensor proposed herein is either comparable with that of currently developed systems for the revelation of HCV, or is several orders of magnitude higher (as compared in Table 1 with the data obtained by other authors [36,37,38,39,40]).
Moreover, it should be emphasized that currently used highly sensitive methods for the revelation of HCV infection (whose detection limit is ~0.06 pg/mL or greater) require introduction of additional labels for signal enhancement (Table 1).
The detection sensitivity attained in our present study is lower than that attained in [36], and is comparable with the sensitivity attained in [40]. At the same time, it should be emphasized that our NW biosensor, employed herein, has several important advantages over the methods described in [36,40]: namely, our biosensor allows for real-time detection, while not requiring amplification and use of additional labels. Moreover, the time, required for the detection of HCV coreAg molecules, makes up 15 to 17 min—as opposed to the chemiluminescence immunoassay and reduced graphene oxide nanosheets with hybridization chain reaction amplification technique, which require several hours detection time [36,40]. At the same time, after optimization of the fabrication of the SOI-NW chips for their use in neutral buffer, the detection sensitivity can be improved to attain the 10−17 M value, as was noted in [26].
By contrast, herein we have demonstrated that SOI-NW aptamer-sensitized biosensor allows one to perform label-free real-time detection of hepatitis C protein marker (HCVcoreAg) in buffer solution at 2.0 × 10⁻¹⁵ M (what is equal to 0.3 pg/mL).

5. Conclusions

Herein, it has been demonstrated that the use of electron beam lithography with subsequent gas-plasma etching allows one to obtain structures that form the basis of nanometer-size sensor elements for biosensors intended for protein detection at ultra-low concentrations.
The application of the NW aptasensor for the revelation of hepatitis C marker in buffer solutions of various acidity and in real serum samples of hepatitis C patients has been demonstrated. The effect of reverse polarity of the aptasensor response signal with change from the acidic buffer pH to the neutral one has been found. We assume that, apart from biospecific “probe/target” interaction (which determines the occurrence of the sensor response signal), the NW surface also interacts with other parts of the target molecule (which exists in the form of a conjugate with β-galactosidase); the latter determines the occurrence of the reverse polarity phenomenon. The high sensitivity, selectivity, good reproducibility and the possibility to detect target proteins in the serum are the key advantages of the SOI-NW aptasensor, which significantly expand the capabilities of immunoaffinity-based analysis and make it a promising tool for rapid inexpensive diagnosis of HCVcoreAg and other protein markers of diseases in humans. The p-type SOI-NW-based aptasensor proposed herein is a suitable platform for the development of novel highly sensitive diagnostic devices.

Author Contributions

Conceptualization, Y.D.I. and V.P.P.; methodology, T.O.P.; software, R.A.G.; validation, T.O.P.; formal analysis, K.A.M. and A.V.G.; investigation, K.A.M., A.F.K., R.A.G. and T.S.R.; resources, V.P.P., A.V.G. and V.A.K.; visualization, K.A.M.; data curation, Y.D.I. and T.O.P.; writing—original draft preparation, K.A.M. and I.D.S.; writing—review and editing, Y.D.I.; project administration, Y.D.I.; supervision, A.I.A. All authors have read and agreed to the published version of the manuscript.

Funding

This study was performed in the framework of the Program for Basic Research of State Academies of Sciences for 2013–2020.

Acknowledgments

The study has been performed in accordance with the work plan for the Consortium Agreement concluded with the aim of the development of a world-class scientific center “Digital Biodesign and Personalized Health Care” (27 April 2020). The biosensor measurements were performed employing a nanowire detector, which pertains to “Avogadro” large-scale research facilities.

Conflicts of Interest

The authors declare no conflict of interest.

References

  1. Alavi, M.; Law, M.G.; Grebely, J.; Amin, J.; Hajarizadeh, B.; George, J.; Dore, G.J. Time to decompensated cirrhosis and hepatocellular carcinoma after an HBV or HCV notification: A population-based study. J. Hepatol. 2016, 65, 879–887. [Google Scholar] [CrossRef] [PubMed]
  2. Santantonio, T.; Wiegand, J.; Gerlach, J.T. Acute hepatitis C: Current status and remaining challenges. J. Hepatol. 2008, 49, 625–633. [Google Scholar] [CrossRef] [PubMed] [Green Version]
  3. Maasouny, B.; Wedemeyer, H. Natural history of acute and chronic hepatitis. Best. Pract. Res. Clin. Gastroenterol. 2012, 26, 401–412. [Google Scholar] [CrossRef] [PubMed]
  4. Global Hepatitis Report 2017. Available online: https://www.who.int/hepatitis/publications/global-hepatitis-report2017/en/ (accessed on 12 May 2020).
  5. World Health Organization. Progress Report on Access to Hepatitis C Treatment, Focus on Overcoming Barriers in Low and Middle Income Countries. Available online: http://apps.who.int/iris/bitstream/10665/260445/1/WHO-CDS-HIV-18.4-eng.pdf?ua=1 (accessed on 12 May 2020).
  6. Waheed, Y.; Siddiq, M.; Jamil, Z.; Najmi, M.H. Hepatitis elimination by 2030: Progress and challenges. World J. Gastroenterol. 2018, 24, 4959–4961. [Google Scholar] [CrossRef]
  7. de Lemos, A.S.; Chung, R.T. Hepatitis C treatment: An incipient therapeutic revolution. Trends Mol. Med. 2014, 20, 315–321. [Google Scholar] [CrossRef]
  8. Ross, R.S.; Viazov, S.; Salloum, S.; Hilgard, P.; Gerken, G.; Roggendorf, M. Analytical performance characteristics and clinical utility of a novel assay for total hepatitis c virus core antigen quantification. J. Clin. Microbiol. 2010, 48, 1161–1168. [Google Scholar] [CrossRef] [Green Version]
  9. Hadziyannis, E.; Minopetrou, M.; Georgiou, A.; Spanou, F.; Koskinas, J. Is HCV core antigen a reliable marker of viral load? An evaluation of HCV core antigen automated immunoassay. Ann. Gastroenterol. 2013, 26, 146–149. [Google Scholar] [PubMed]
  10. Wasitthankasem, R.; Vichaiwattana, P.; Auphimai, C.; Siripon, N.; Klinfueng, S.; Tangkijvanich, P.; Vongpunsawad, S.; Poovorawan, Y. HCV core antigen is an alternative marker to HCV RNA for evaluating active HCV infection: Implications for improved diagnostic option in an era of affordable DAAs. Peer J. 2017, 5, e4008. [Google Scholar] [CrossRef] [Green Version]
  11. Soliman, H.; Hozayen, W.; Mahmoud, A.; Abo-Seif, M.; Fayede, N.A. Significance of the hepatitis C virus core antigen testing as an alternative marker for hepatitis diagnosis in Egyptian patients. Eur. Rev. Med. Pharmacol. Sci. 2015, 19, 2240–2245. [Google Scholar] [PubMed]
  12. Buket, C.; Ayşe, A.; Selçuk, K.; Süleyman, Ö.; Emel, S. Comparison of HCV core antigen and anti-HCV with HCV RNA results. Afr. Health Sci. 2014, 14, 816–820. [Google Scholar] [CrossRef] [Green Version]
  13. Murayama, A.; Sugiyama, N.; Watashi, K.; eMasaki, T.; Suzuki, R.; Alizaki, H.; Mizuochi, T.; Wakita, T.; Kato, T. Japanese reference panel of blood specimens for evaluation of hepatitis C virus RNA and core antigen quantitative assays. J. Clin. Microbiol. 2012, 50, 1943–1949. [Google Scholar] [CrossRef] [PubMed] [Green Version]
  14. Cresswell, F.V.; Fisher, M.; Hughes, D.J.; Shaw, S.G.; Hometr, G.; Halssan-Ibrahim, M.O. Hepatitis C core antigen testing: A reliable, quick, and potentially cost-effective alternative to hepatitis C polymerase chain reaction in diagnosing acute hepatitis C virus infection. Clin. Infect. Dis. 2014, 60, 263–266. [Google Scholar] [CrossRef] [PubMed] [Green Version]
  15. European Association for the Study of the Liver. EASL recommendations on treatment of hepatitis C 2016. J. Hepatol. 2017, 66, 153–194. [Google Scholar]
  16. World Health Organization. WHO Guidelines on Hepatitis B and C Testing; WHO: Geneva, Switzerland, 2017. [Google Scholar]
  17. Miédougé, M.; Sauné, K.; Kamar, N.; Rieu, M.; Rostaing, L.; Izopet, J. Analytical evaluation of HCV core antigen and interest for HCV screening in haemodialysis patients. J. Clin. Virol. 2010, 48, 18–21. [Google Scholar] [CrossRef] [PubMed]
  18. Zhang, S.; Garcia-D’Angeli, A.; Brennan, J.P.; Huo, Q. Predicting detection limits of enzyme-linked immunosorbent assay (ELISA) and bioanalytical techniques in general. Analyst 2014, 139, 439–445. [Google Scholar] [CrossRef] [PubMed]
  19. Kaysheva, A.L.; Ivanov, Y.D.; Zgoda, V.G.; Frantsuzov, P.; Pleshakova, T.O.; Krokhin, N.V.; Ziborov, V.S.; Archakov, A.I. Visualization and identification of hepatitis C viral particles by atomic force microscopy combined with MS/MS analysis. Biochem. (Moscow) Suppl. Ser. B Biomed. Chem. 2010, 4, 15–24. [Google Scholar] [CrossRef]
  20. Xu, J.; Hu, Y.; Wang, S.; Ma, X.; Guo, J. Nanomaterials in electrochemical cytosensors. Analyst 2020, 145, 2058–2069. [Google Scholar] [CrossRef]
  21. Gao, X.P.A.; Zheng, G.; Lieber, C.M. Subthreshold regime has the optimal sensitivity for nanowire FET biosensors. Nano Lett. 2010, 10, 547–552. [Google Scholar] [CrossRef] [Green Version]
  22. Stern, E.; Klemic, J.; Routenberg, D.; Wyrembak, P.; Turner-Evans, D.; Hamilton, A.; LaVan, D.; Fahmy, T.; Reed, M. Label-free immunodetection with CMOS-compatible semiconducting nanowires. Nature 2007, 445, 519–522. [Google Scholar] [CrossRef]
  23. Ivanov, Y.D.; Pleshakova, T.O.; Kozlov, A.F.; Malsagova, K.A.; Krohin, N.V.; Shumyantseva, V.; Shumov, I.D.; Popov, V.; Naumova, O.V.; Fomin, B.; et al. SOI nanowire for the high-sensitive detection of HBsAg and α-fetoprotein. Lab Chip 2012, 12, 5104–5111. [Google Scholar] [CrossRef]
  24. Ivanov, Y.D.; Pleshakova, T.O.; Kozlov, A.F.; Malsagova, K.A.; Krokhin, N.V.; Kaisheva, A.L.; Shumov, I.D.; Archakov, A.; Popov, V.P.; Naumova, O.V.; et al. SOI nanowire transistor for detection of D-NFATc1 molecules. Optoelectron. Instrum. Data Process. 2013, 49, 520–525. [Google Scholar] [CrossRef]
  25. Malsagova, K.A.; Ivanov, Y.D.; Pleshakova, T.O.; Kaysheva, A.L.; Shumov, I.D.; Kozlov, A.; Archakov, A.I.; Popov, V.; Fomin, B.I.; Latyshev, A.V. A SOI-nanowire biosensor for the multiple detection of D-NFATc1 protein in the serum. Anal. Methods. 2015, 7, 8078–8085. [Google Scholar] [CrossRef]
  26. Malsagova, K.A.; Pleshakova, T.O.; Galiullin, R.A.; Kaysheva, A.L.; Shumov, I.D.; Ilnitskii, M.A.; Popov, V.P.; Glukhov, A.V.; Archakov, A.I.; Ivanov, Y.D. Ultrasensitive nanowire-based detection of HCVcoreAg in the serum using a microwave generator. Anal. Meth. 2018, 2740–2749. [Google Scholar] [CrossRef]
  27. Ivanov, Y.D.; Pleshakova, T.; Malsagova, K.; Kozlov, A.L.; Kaysheva, A.; Shumov, I.; Galiullin, R.; Kurbatov, L.; Popov, V.; Naumova, O.; et al. Detection of marker miRNAs in plasma using SOI-NW biosensor. Sens. Actuators B Chem. 2018, 261, 566–571. [Google Scholar] [CrossRef]
  28. Laborde, C.; Pittino, F.; Verhoeven, H.A.; Lemay, S.G.; Selmi, L.; Jongsma, M.A.; Widdershoven, F.P. Real-time imaging of microparticles and living cells with CMOS nanocapacitor arrays. Nat. Nanotechnol. 2015, 10, 791–795. [Google Scholar] [CrossRef] [PubMed] [Green Version]
  29. Kim, K.; Lee, H.; Yang, J.; Jo, M.; Hahn, S. The fabrication, characterization and application of aptamer-functionalized Si-nanowire FET biosensors. J. Nanotechnol. 2009, 20, 235501. [Google Scholar] [CrossRef]
  30. Savory, N.; Abe, K.; Sode, K.; Ikebukuro, K. Selection of DNA aptamer against prostate specific antigen using a genetic algorithm and application to sensing. Biosens. Bioelectron. 2010, 26, 1386–1391. [Google Scholar] [CrossRef]
  31. Kaysheva, A.L.; Ivanov, Y.D.; Bukharina, N.S.; Pleshakova, T.; Frantsuzov, P.; Andreeva, E.; Kaysheva, A.; Zgoda, V.; Izotov, A.; Pavlova, T.; et al. Atomic force microscopy fishing and mass spectrometry identification of gp120 on immobilized aptamers. Int. J. Nanomed. 2014, 9, 4659–4670. [Google Scholar] [CrossRef] [Green Version]
  32. Shi, S.; Yu, X.; Gao, Y.; Xue, B.; Wu, X.; Wang, X.; Yang, D.; Zhu, H. Inhibition of hepatitis C virus production by aptamers against the core protein. J. Virol. 2014, 88, 1990–1999. [Google Scholar] [CrossRef] [Green Version]
  33. Tyschenko, I.E.; Popov, V.P. Silicon-on-insulator structures produced by ion-beam synthesis and hydrogen transfer. In Advances in Semiconductor Nanostructures; Alexander, V., Latyshev, A.V., Dvurechenskii, A.L.A., Eds.; Elsevier BV: Amsterdam, The Netherlands, 2017; Volume 552, pp. 409–433. ISBN 978-0-12-810512-2. [Google Scholar]
  34. Available online: http://www.chem.agilent.com/Library/applications/5991-3207EN.pdf (accessed on 5 March 2020).
  35. Ivanov, Y.D.; Kozlov, A.; Galiullin, R.; Kanashenko, S.; Usanov, S.; Ivanova, N.; Ziborov, V.; Pleshakova, T. Spontaneous generation of charge in the flow-based AFM fishing system. J. Electrost. 2018, 91, 16–20. [Google Scholar] [CrossRef]
  36. Morota, K.; Fujinami, R.; Kinukawa, H.; Machida, T.; Ohno, K.; Saegusa, H.; Takeda, K. A new sensitive and automated chemiluminescent microparticle immunoassay for quantitative determination of hepatitis C virus core antigen. J. Virol. Meth. 2009, 157, 8–14. [Google Scholar] [CrossRef] [PubMed]
  37. Ma, C.; Liang, M.; Wang, L.; Xiang, H.; Jiang, Y.; Li, Y.; Xie, G. MultisHRP-DNA-coated CMWNTs as signal labels for an ultrasensitive hepatitis C virus core antigen electrochemical immunosensor. Biosens. Bioelectron. 2013, 47, 467–474. [Google Scholar] [CrossRef] [PubMed]
  38. Liang, M.; Wang, L.; Ma, C.; Zhang, M.; Xie, G. Sandwich immunoassay for hepatitis C virus non-structural 5A protein using a glassy carbon electrode modified with an Au-MoO3/chitosan nanocomposite. Anal. Lett. 2013, 46, 1241–1254. [Google Scholar] [CrossRef]
  39. Moraes, M.; Lima, L.R.; Da Silva, R.R.; Cavicchioli, M.; Ribeiro, S.J. Immunosensor based on immobilization of antigenic peptide NS5A-1 from HCV and silk fibroin in nanostructured films. Langmuir 2013, 29, 3829–3834. [Google Scholar] [CrossRef] [PubMed]
  40. Fan, J.; Yuan, L.; Liu, Q.; Tong, C.; Wang, W.; Xiao, F.; Liu, B.; Liu, X. An ultrasensitive and simple assay for the Hepatitis C virus using a reduced graphene oxide-assisted hybridization chain reaction. Analyst 2019, 144, 3972–3979. [Google Scholar] [CrossRef] [PubMed]
Figure 1. Photographic images (ac) and optical microscopy (d,e) images of the nanowire (NW) biosensor components. Panel (a) displays the overall image of the assembled analytical module; arrows indicate: the silicon-on-insulator (SOI)-NW chip with an array of nanowires (1); chip holder (2); measuring cell holder (3); measuring cell (4). Panels (b,c) display the images of a framed NWchip (front view and side view). Panel (d) displays the surface of the chip with an array of nanowires. Panel (e) displays the image of a single nanowire (NW) and the ohmic contacts.
Coatings 10 00753 g001
Figure 2. Schematic representation of the nanowire-based detection of protein molecules. Biospecific binding of the analyte molecules with the probe molecules, which are preliminarily immobilized on the nanowire surface (working channel) leads to a change in the nanowire’s conductance. In case of absence of the biospecific binding with the nanowire, whose surface was either not sensitized with the probe molecules, or was sensitized with the probes, which do not interact biospecifically with the analyte molecules, no change in the conductance occurs (control channel).
Coatings 10 00753 g002
Figure 3. Results obtained upon the detection of HCVcoreAg (the core antigen of hepatitis C virus) protein in acidic buffer using p-type SOI-NW chip with covalently immobilized aptamers: (a) typical sensogram curves obtained upon analysis of solutions with various HCVcoreAg concentration. Arrows indicate the addition of HCVcoreAg solution and wash with buffer; (b) dependence of the signal level on HCVcoreAg concentration (three technical replicates, n = 3). Circles (●) and squares (■) indicate average signal level before and after addition of protein solution, respectively. Experimental conditions: protein concentration: 2.0 × 10⁻¹⁶ M; 2.0 × 10⁻¹⁵ M; 2.0 × 10⁻¹⁴ M; 2.0 × 10⁻¹³ M, Vg (−45) V, Vds (−0.2) V. 1 mM potassium phthalate buffer, pH 5.1.
Coatings 10 00753 g003
Figure 4. Results obtained upon the detection of HCVcoreAg protein in neutral buffer using p-type SOI-NW chip with covalently immobilized aptamers: (a) typical sensogram curves obtained upon analysis of solutions with various HCVcoreAg concentrations. Arrows indicate the addition of HCVcoreAg solution and washing with buffer; (b) dependence of the signal level on HCVcoreAg concentration (three technical replicates, n = 3). Circles (●) and squares (■) indicate average signal level before and after addition of protein solution, respectively. Experimental conditions: protein concentration: 2.0 × 10⁻¹⁶ M; 2.0 × 10⁻¹⁵ M; 2.0 × 10⁻¹⁴ M; 2.0 × 10⁻¹³ M, Vg (−45) V, Vds (−0.2) V. 1 mM potassium phosphate buffer, pH 7.4.
Coatings 10 00753 g004
Figure 5. Results obtained upon analysis of ten serum samples of hepatitis C patients with the SOI-NW-based aptasensor upon using p-type SOI-NW chip. Experimental conditions: 1 mM potassium phthalate buffer, pH 5.1, Vg = (−45) V, Vds = (−0.2) V, V = 105 µL. Each experiment was performed in three technical replicates (n = 3).
Coatings 10 00753 g005
Figure 6. Typical sensogram curves obtained upon analysis of serum sample #1 (of hepatitis C patient) using p-type SOI-NW chip with covalently immobilized aptamers. Experimental conditions: 1 mM potassium phthalate buffer, pH 5.1, Vg = (−45) V, Vds = (−0.2) V, V = 105 µL. Each experiment was performed in three technical replicates (n = 3: ▬ 1st replicate, solid line, no marker; ■ 2nd replicate, squares; ● 3rd replicate, circles). Arrows indicate the addition of HCVcoreAg solution and wash with buffer.
Coatings 10 00753 g006
Table 1. Analytical characteristics of different methods for hepatitis C virus (HCV) detection.
Applied MethodTarget ProteinDetection LimitDetection Time
Chemiluminescence immunoassay [36]HCVcoreAg0.06 pg/mL1 h
Glassy carbon electrode modified with a nanocomposite (gold/zirconia/chitosan) [37]HCVcoreAg0.01 pg/mL25 min
Glassy carbon electrode was modified with an Au-MoO3/Chitosan nanocomposite [38]HCV non-structural 5A protein1.0 ng/mL30 min
Silk fibroin nanostructured films on screen-printed carbon electrode [39]HCV non-structural 5A protein28 μA·μg−1·mL10 min
Reduced graphene oxide nanosheets and hybridization chain reaction amplification technique [40]HCV RNA0.3 pg/mL8–10 h
SOI-NW-based aptasensor (this study)HCVcoreAg0.3 pg/mL17 min
HCV—hepatitis C virus; Ag—core antigen; SOI-NW—silicon-on-insulator nanowire.

