1. Introduction
Avoiding distortions is cost-effective for the quality control of chemically treated steel elements. As an example, gears with large distortions can produce more noise and have shorter durability [
1,
2]. Furthermore, the correction of distortions is one of the most expensive processes [
3,
4,
5]. For this reason, despite being inevitable [
6,
7], methods to avoid them as much as possible must be developed and studied.
In the perspective of constructing a new device that gives optimized outcomes in minimizing distortions, this study developed a simulation around Vacuum UniCase Master (UMC
®) Furnace design by SECO/WARWICK (Świebodzin, Poland) that uses low-pressure carburizing (LPC), followed by high-pressure gas quenching (HPGQ) in a 4D chamber (4D Quench
®), all conducted using the single-piece flow method. LPC and HPGQ, when compared with traditional methods, have shown better results [
8,
9,
10,
11]. Moreover, the single-piece flow model takes every single element through the exact same position and process conditions as the others, avoiding variations in the physical and metallurgical characteristics over the placement that the element occupies [
2,
3,
12,
13]. Additionally, in a 4D quenching chamber, the inflow of cooling gas from all sides and the rotation of parts are performed to support a uniform cooling effect [
14,
15]. The more uniform the parameters provided, especially during quenching, the better the expected regarding the distortions.
A numerical simulation to predict distortion during gas quenching is important during the design stage. A proper thermochemical and metallurgical modeling allows a fast, clear, and effective examination of the construction and process parameters. It also replaces the trial and error method, which is costly in terms of time and resources. Therefore, a refined model can significantly improve project furnace construction.
In recent research, including the works developed by MacKenzie et al. [
16], Li et al. [
17], and Habean et al. [
18], DANTE modeling software was used to simulate phase transformations in order to predict stress formation during HPGQ, and the heat transfer coefficient was considered constant. Moreover, more than one modeling program was required. The paper [
19] described a neural network model and its training procedures based on data mining in the application, but only to monitor and control low-pressure nitriding process for the creation of low-frictional coatings. The authors [
20] presented a numerical model based on the finite element method (FEM), which allows the deformations in the input elements to be determined, but with a step change in the material properties and constant cooling rate parameters. In [
21,
22], the authors introduced an algorithm to FEM numerical simulations, which generated the deformations and residual stresses, depending on the nitrogen concentration in the surface layer, however, with constrained parameters of the surface layer. Therefore, all of the mentioned mathematical models were simplified in order to calculate the distortions.
Currently, there is no program able to consider, in the simulation of the distortion formation, the complex fluid flow field and variation of the heat transfer coefficient in a quenching chamber. The variation of the heat transfer coefficient has a significant effect during gas quenching because it influences the distortion, residual stresses, and hardness distribution [
23]. Thermochemical treatments in steel alloys combine many processes and fields of physics. The complexity and high non-linearity of these processes make analysis difficult. For a long time, heat treatment was based on experimental research; however, a steady increase in computational power and the development of numerical methods enabled the analysis of complex physical processes and geometries.
This paper proposes an algorithm scheme that provides accurate simulation results of distortions formed during the quenching process. The algorithm considers complex fluid flow and the heat transfer coefficient as a function of space and time. Thus, it can assist in device project optimization.
2. Materials and Methods
2.1. Experimental Studies
In order to verify the results from simulation, experimental data from parts that went through chemical and heat treatment in a furnace are needed. Reference elements made of 20MnCr5 steel were tested. The external and internal diameters were 90 and 30 mm, and their height was 10 mm, respectively. All the elements were subjected to low-pressure stream carburizing at 980 °C and then gas quenching at 860 °C. A rotary device for HPGQ (4D Quench®) design by SECO/WARWICK was used for hardening. The elements were inserted into the chamber one by one, where the cooling nozzles were arranged all around, and the base with the cooling element was rotated, thus ensuring identical hardening conditions for each element. Before and after the chemical heat treatment, geometrical measurements of the 10 reference elements were taken, and based on these measurements, the size of hardening deformations of their surface flatness parameters was determined.
After the treatment, the carbon concentration, in a layer, was measured with a glow discharge optical emission spectrometer—LECO GDS850A.
The flatness of the top surface of the reference disc was measured on a bench equipped with a DEA Global Performance 5.7.5 coordinate measuring machine and a computer with PC-DEMIS CAD+++ software (2018 R2). For the measurements described, the maximum permissible error for length measurement (according to ISO 10360 [
24]) was ±1.8 µm.
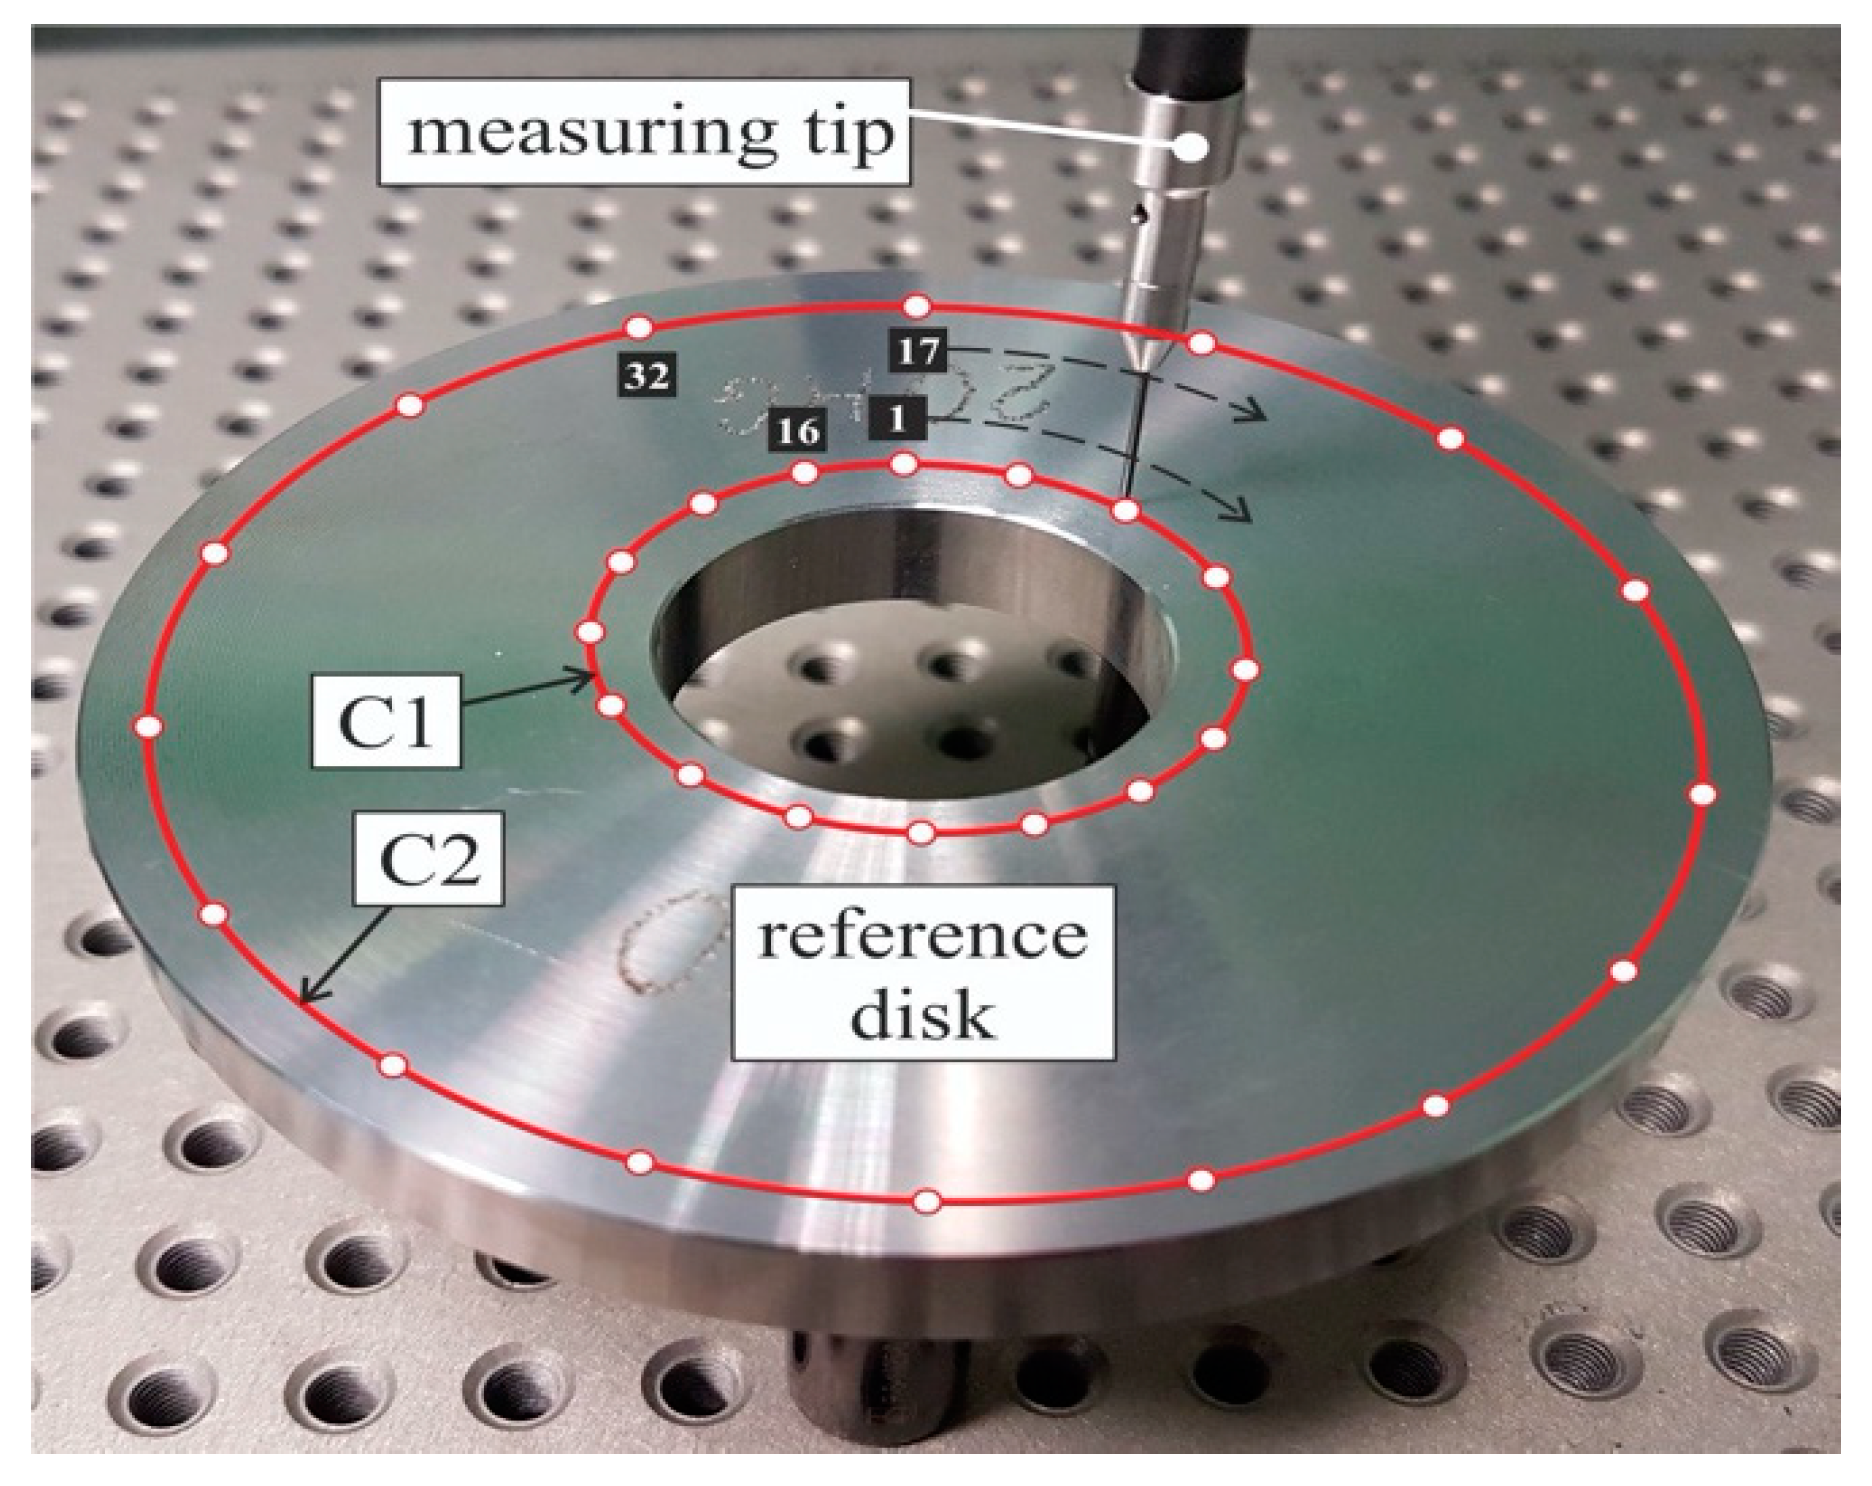
Before the measurements were taken, a coordinate system was built with its midpoint in the center of the reference disc’s insert hole at the height of the upper plane. The value of flatness was determined on the basis of data from 32 measurement points located on the circumference of two circles—inner and outer. The inner circle, with a diameter of ϕ 40 mm, was located on the edge of the bore, while the outer circle—with a diameter of ϕ 80 mm—was located on the edge of the external reference disc. The centers of the imaginary circles coincided with the center of the coordinate system.
Figure 1 shows the position of the inner (C1) and outer (C2) circles in the upper plane of the reference disc, and the arrangement of the measuring points during the measurement to determine flatness. The deformation results for each measurement point were subjected to the 1-factor ANOVA hypothesis, with statistical significance assumed at a level of α = 0.05.
2.2. Numerical Simulation
The simulation was created by implementing and modifying the solvers available in the Ansys package with the use of data generated using the JMatPro
® program.
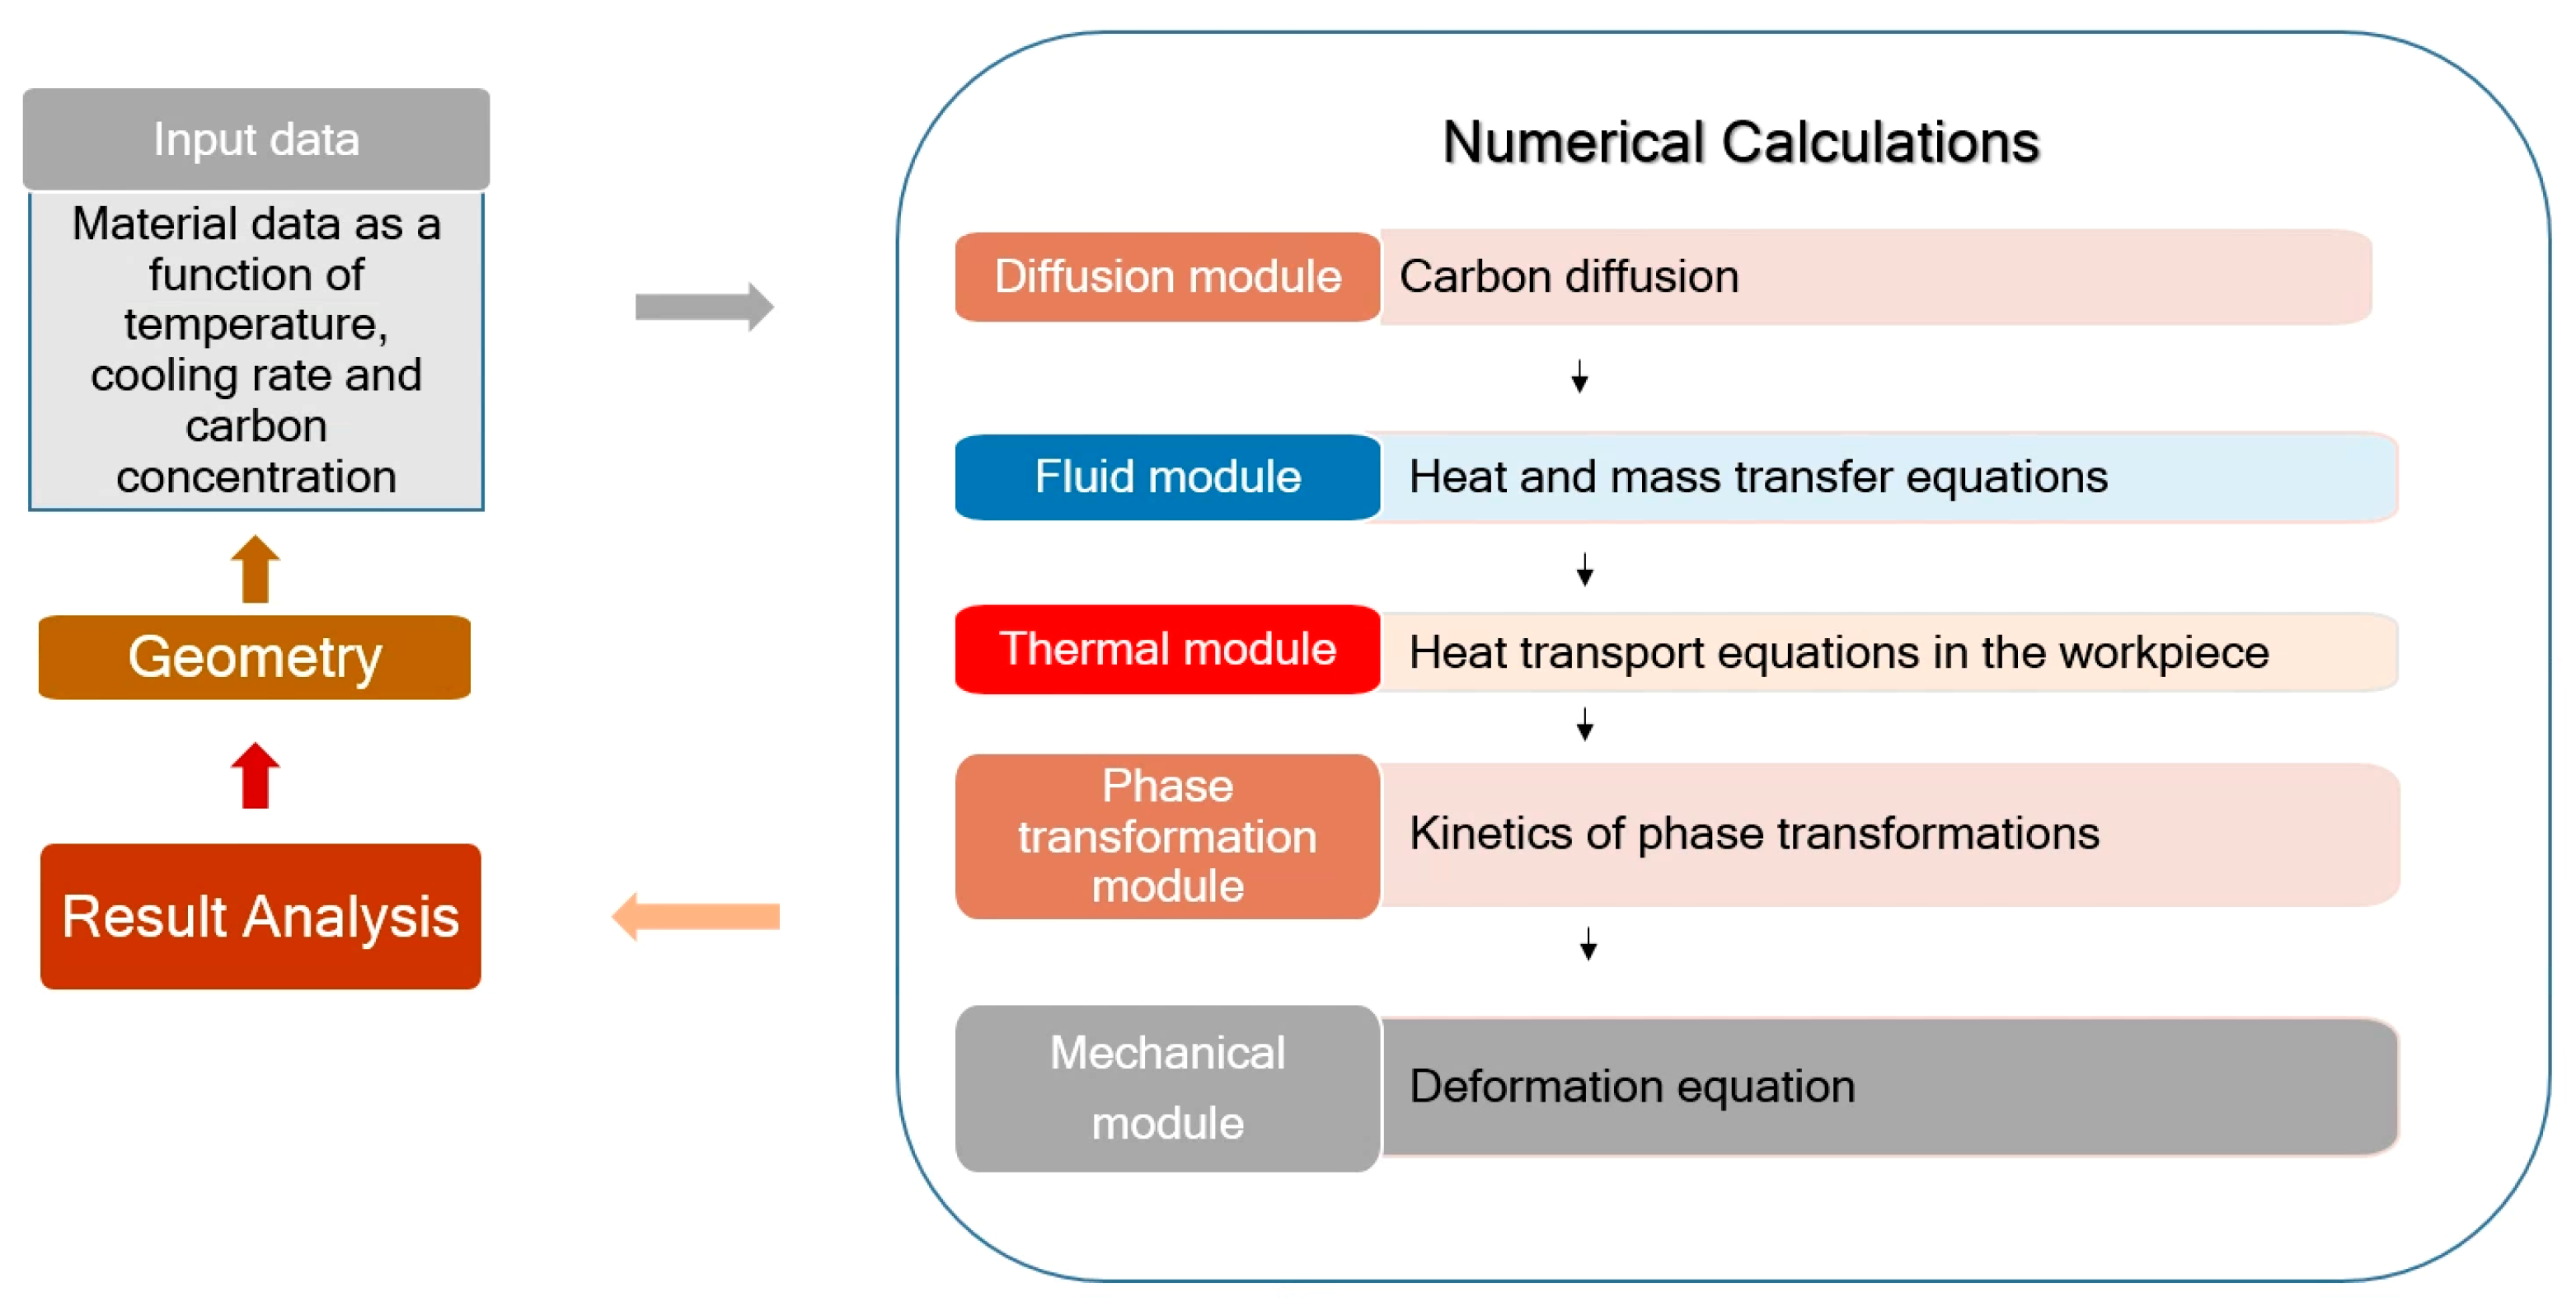
Figure 2 shows a diagram of the numerical simulation algorithm. Basically, the simulation is composed of certain modules for different physical phenomena, which pass the results as a boundary condition for the next module. The numerical scheme follows the order of stages taking place in a real furnace during the treatment.
2.3. Input Data
The first and most important part of numerical scheme is the generation of appropriate tables with input data. For the simulated steel material (20MnCr5), the JMatPro® program generated multidimensional matrices with the material, mechanical and thermal properties as a function of temperature, cooling rate and carbon concentration.
2.4. Computational Grids
Next, based on geometry, computational grids were created using the Ansys CFX software (2019 R1). As mentioned earlier, meshes were created for the flow and solid domains. Due to the occurrence of high speeds and gas pressures in the cooling chamber, as well as the sensitivity of the results of the flow simulations to the quality of the mesh, the hexagonal elements were created and optimized for correct calculations, especially within the boundary layer, in which the heat exchange between fluid and solid domains has a significant impact on distortions.
2.5. Diffusion Module
Following the scheme, firstly, diffusion was calculated on the mesh of the specimen. In these simulations, it was assumed that after the heating stage, the processed elements had an even temperature distribution throughout their volume. The carbon profile was calculated by the diffusion transport equation according to Fick’s law, for which the boundary condition of carbon penetration is set on the outer walls in the form of carbon flux density. In order to simulate the boost and diffusion carburizing technology, the density of the carbon stream is varied over time in accordance with the process parameters in the furnace.
Fick’s law:
where
J is the flux,
D is the diffusion coefficient, ∅ is the carbon concentration, and
t is the time. Equation (1) is used as a boundary condition, and Equation (2) describes the carbon concentration distribution in the element.
2.6. Flow Module
After diffusion, the fluid flow was calculated. The flow field is necessary for obtaining the correct distribution of heat fluxes on the surface during cooling in the chamber. In order to homogenize the distribution of wall heat transfer coefficient over the surface, a rotary system was implemented in the construction of the cooling chamber. The rotation and high-speed cooling force non-stationary numerical calculations. The equations of energy and mass transport in the fluid domain for the ideal compressible gas were solved in the Ansys CFX software (2019 R1) solver with the finite volume method.
Based on previous simulations [
15] of high-pressure gas cooling in a quenching chamber, the mesh size and quality and the flow solver parameters were developed to map all relevant phenomena. In particular, the turbulence and jet impingement regions, which greatly influence heat fluxes over the specimen surface, required careful boundary layer modeling. The distribution of the heat transfer coefficient generated in this simulation was used further for thermal computations.
The flow field is described by the momentum, continuity, and energy equations.
Energy:
where ρ is the specific mass,
h is the enthalpy,
U is the velocity,
T is the temperature,
λ is the conduction coefficient, τ:∆
U is the viscous dissipation, and
SE is the source term.
The applied model equations for turbulence are as follows:
Turbulent kinetic energy,
:
Dissipation of the turbulent kinetic energy,
:
where
The above coefficients are default settings for solving the Shear Stress Transport (SST) model of turbulence, which all have good general application. The user can change them in order to search for the best numerical solution for fluid flow.
The modification of the production term: the SST
k–ω model tends to overproduce turbulence in the pile-up areas because of the high
S values generated in these regions. Kato and Launder propose replacing the tangential stresses
S in the turbulence production equation with rotation Ω, then:
where
Therefore, the model enables to introduce a term that limits over-production of the turbulence kinetic energy in the areas of high-pressure gradients [
18].
2.7. Thermal Module
The flow module provided the boundary condition for thermal calculations inside a workpiece in the form of heat transfer coefficient on its surfaces. The thermal properties—density, heat conduction, and heat capacity—were interpolated into each finite element in every time iteration from the provided data matrices. The aforementioned properties were dependent on temperature, cooling rate, and carbon concentration. Heat transport calculations were conducted in an Ansys thermal solver, which uses the finite element method:
where
2.8. Phase Transformation Module
After calculating the time-varying temperature field in the element during cooling, cooling rate and concentration of carbon, it is possible, based on the read data matrix, to indicate the place of phase transformations during the time. The data generated in the JMatPro® program are determined on the basis of solving the kinetic equations of phase transformations inside this software.
2.9. Mechanical Module
As a result of the previously calculated carbon and temperature distributions over time, the program was able to approximate the appropriate values from the data provided by the JMatPro
® program. To calculate quenching distortions, additional terms were added to the total deformation equation. Those terms are thermal and phase transformation deformations, which are included in the linear expression provided in form of data matrices. The simulation was conducted in the Ansys mechanical interface, which uses the finite element method for structural calculations.
where
—total deformation,
—elastic deformation,
—plastic deformation,
—thermal deformation, and
—phase transformation deformation.
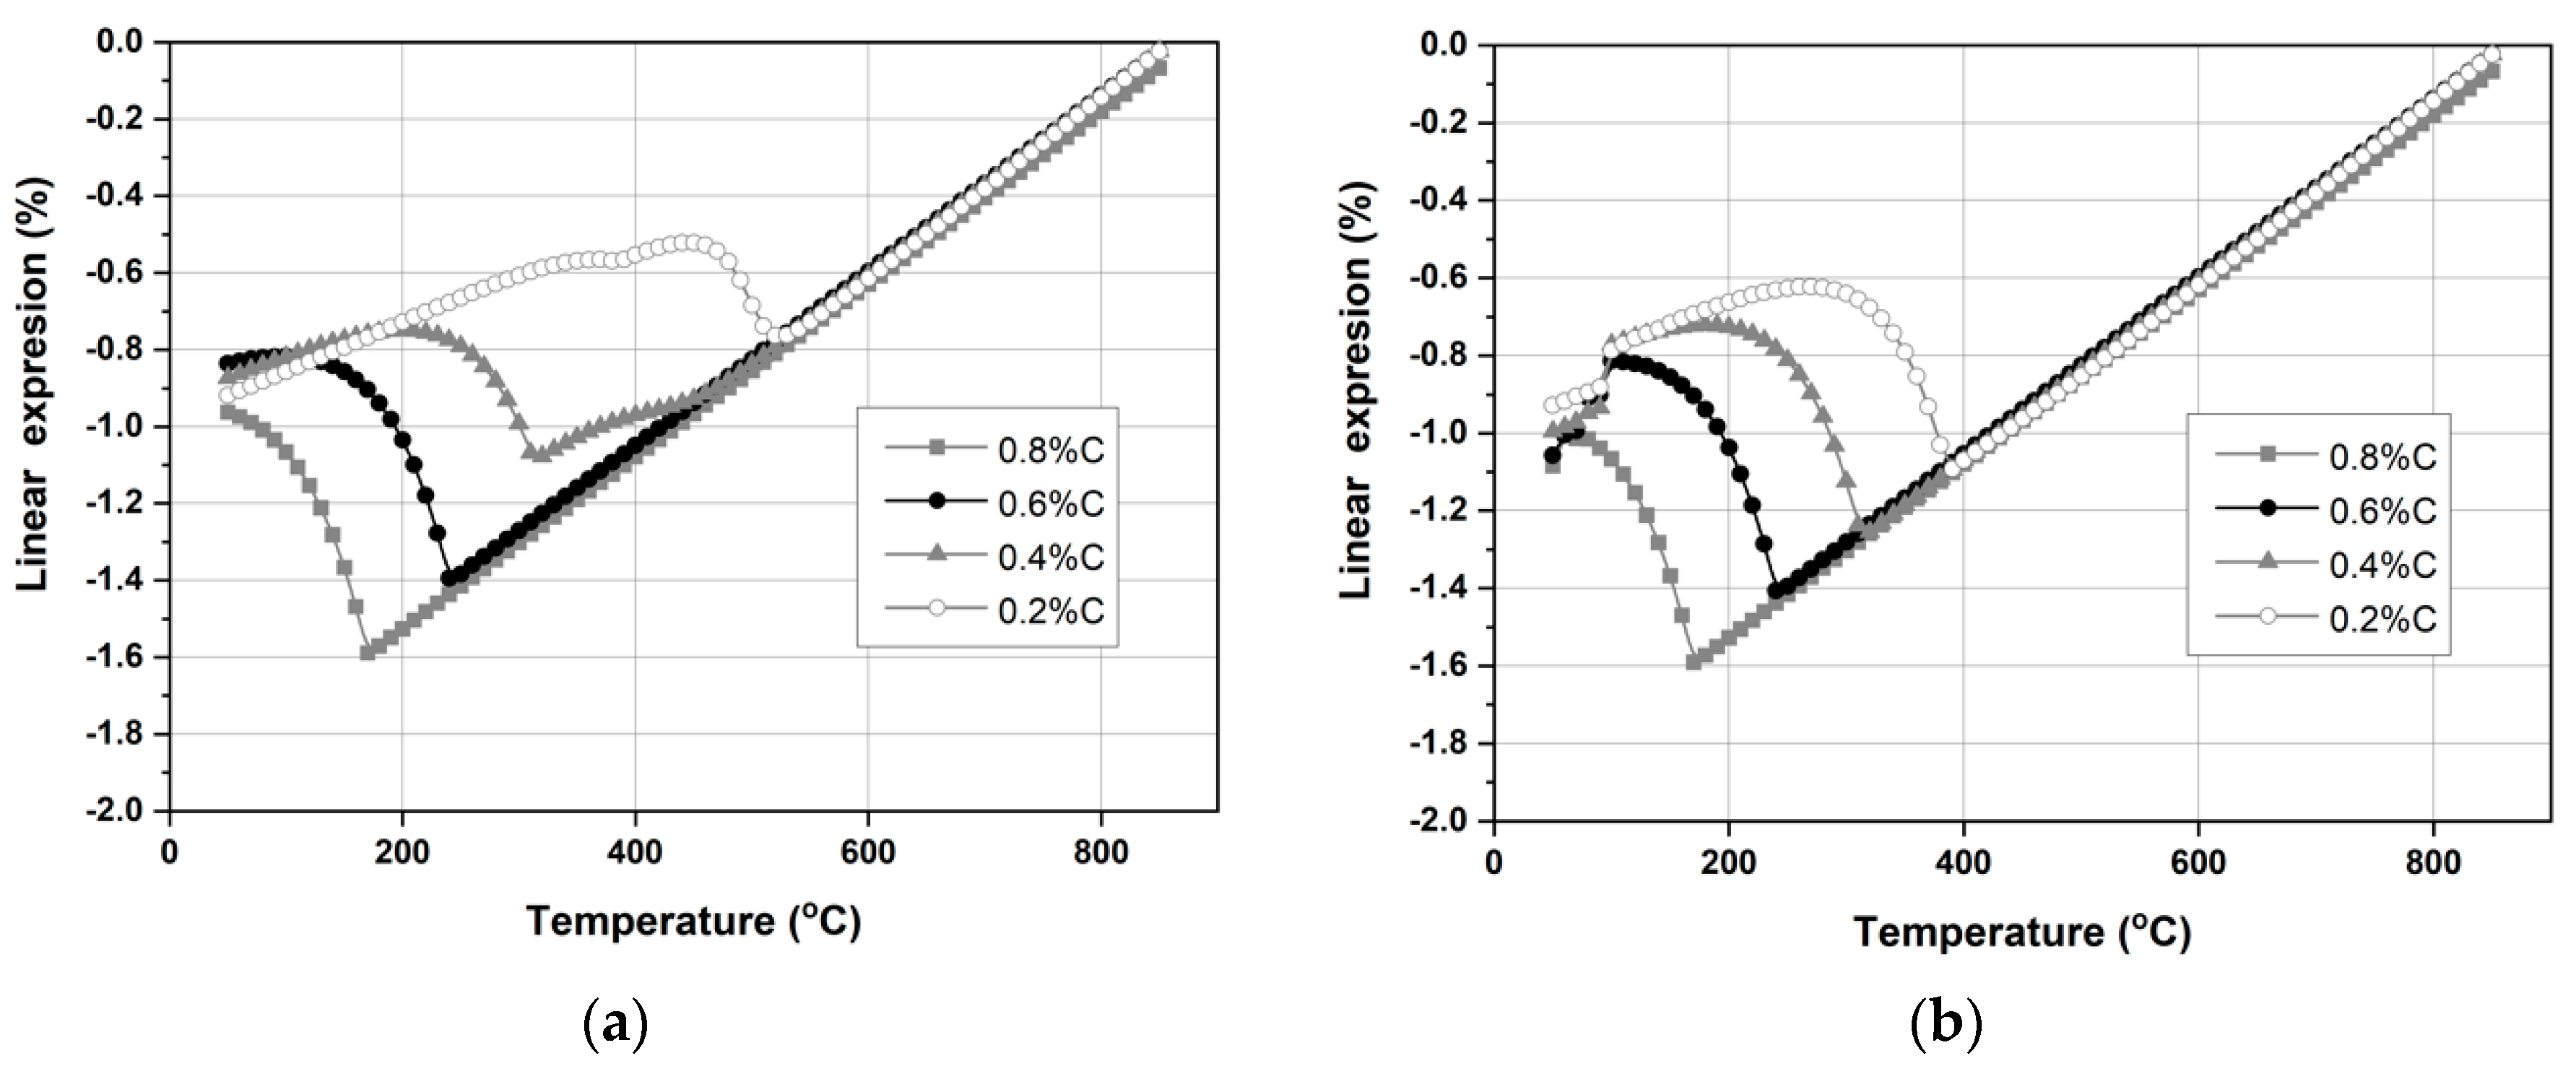
The below charts (
Figure 3) present how linear expression changes with temperature, carbon concentration, and cooling rate for selected values. Thus, only after calculation were the previous stages of the program able to finally obtain quenching deformations.
3. Results and Discussion
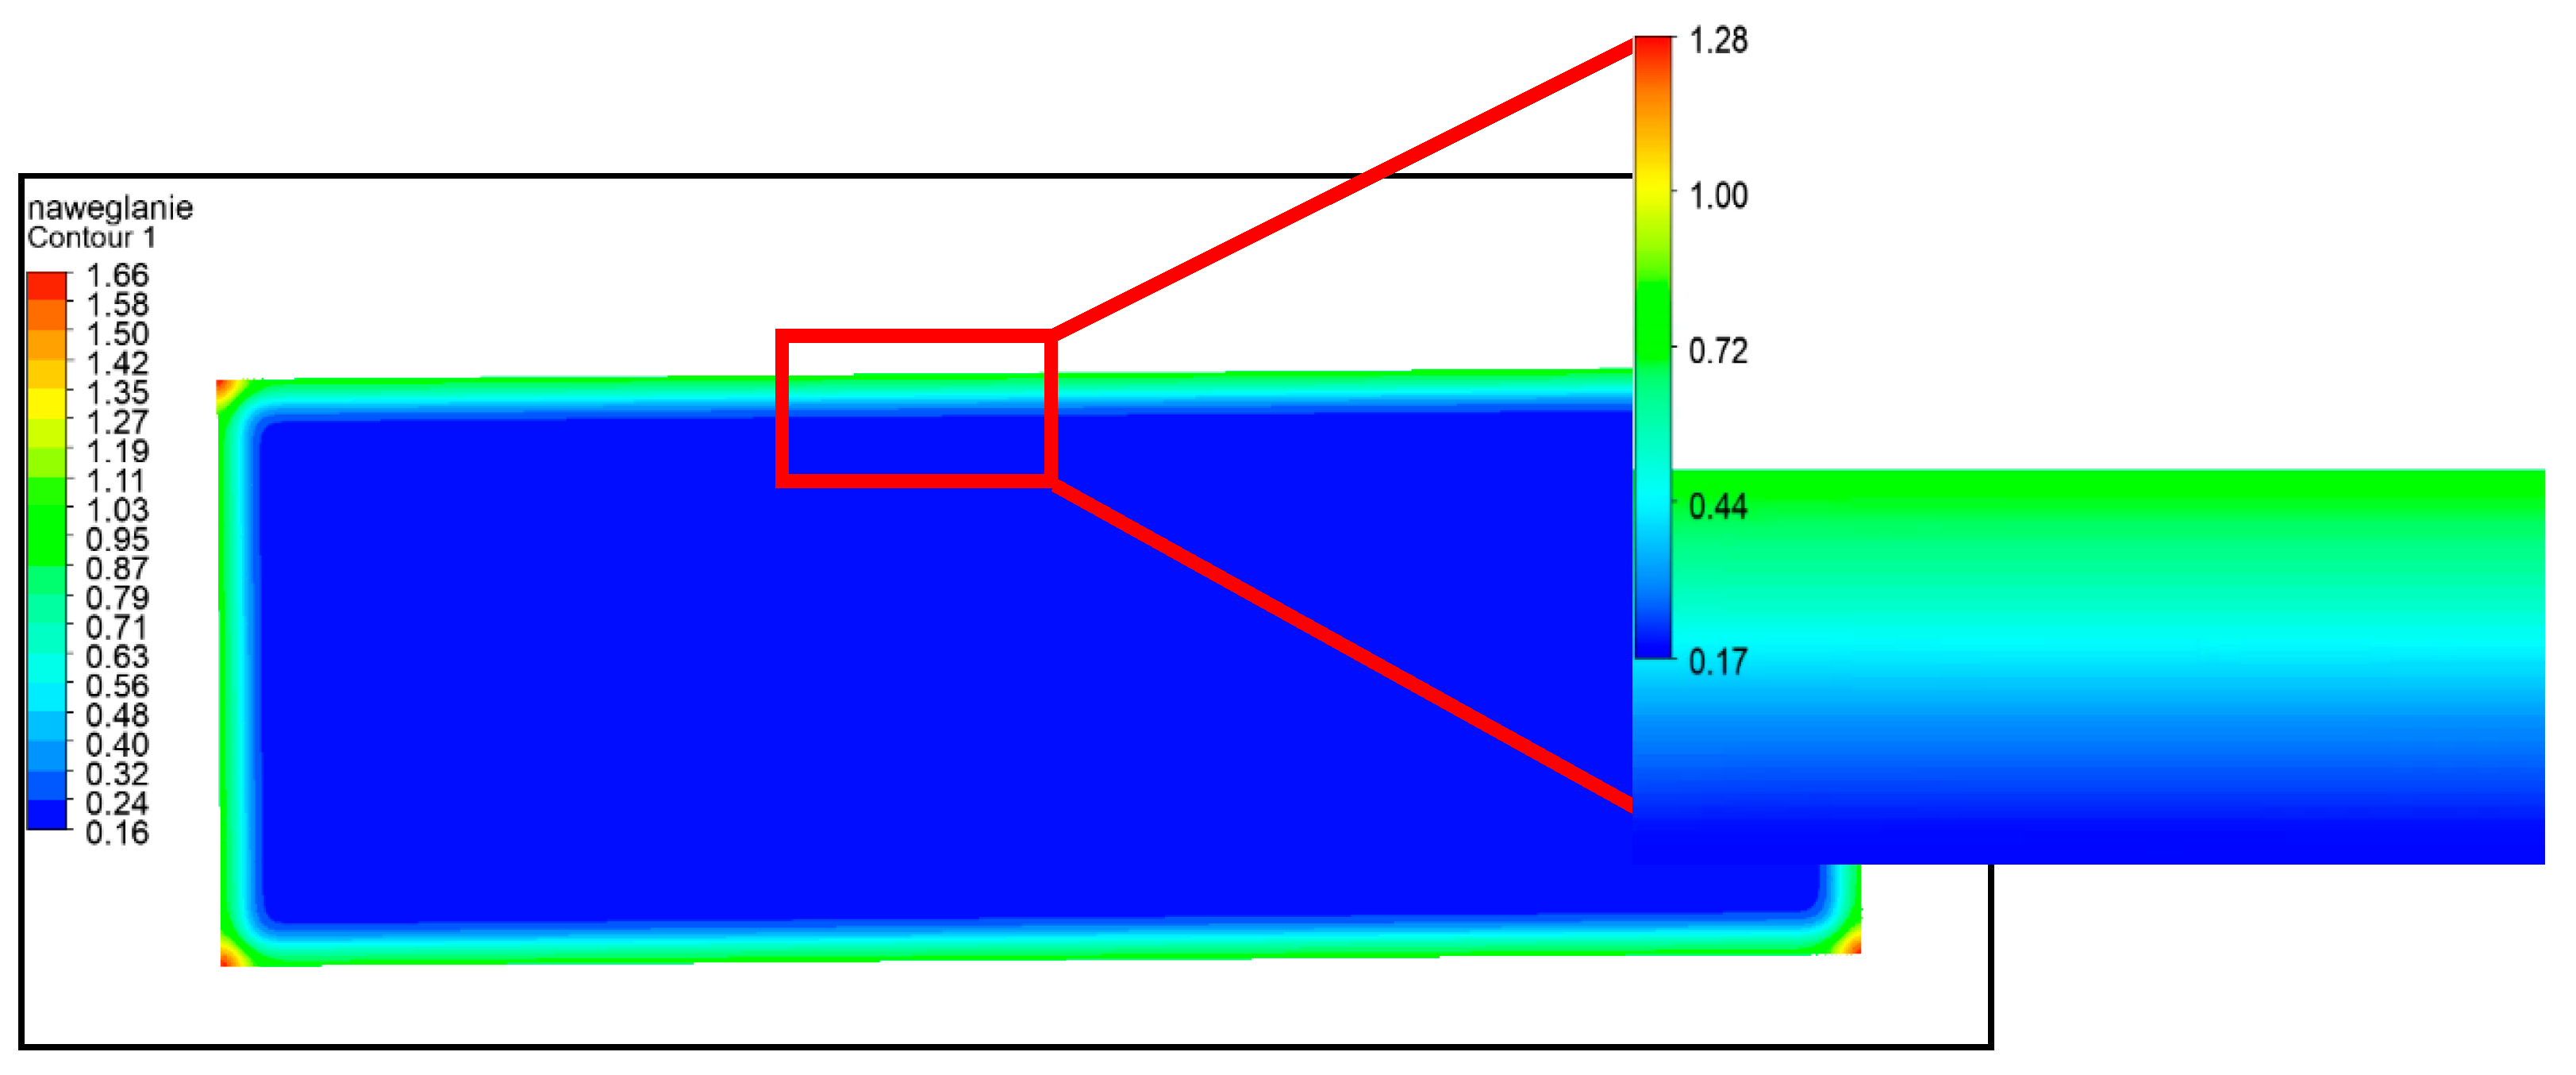
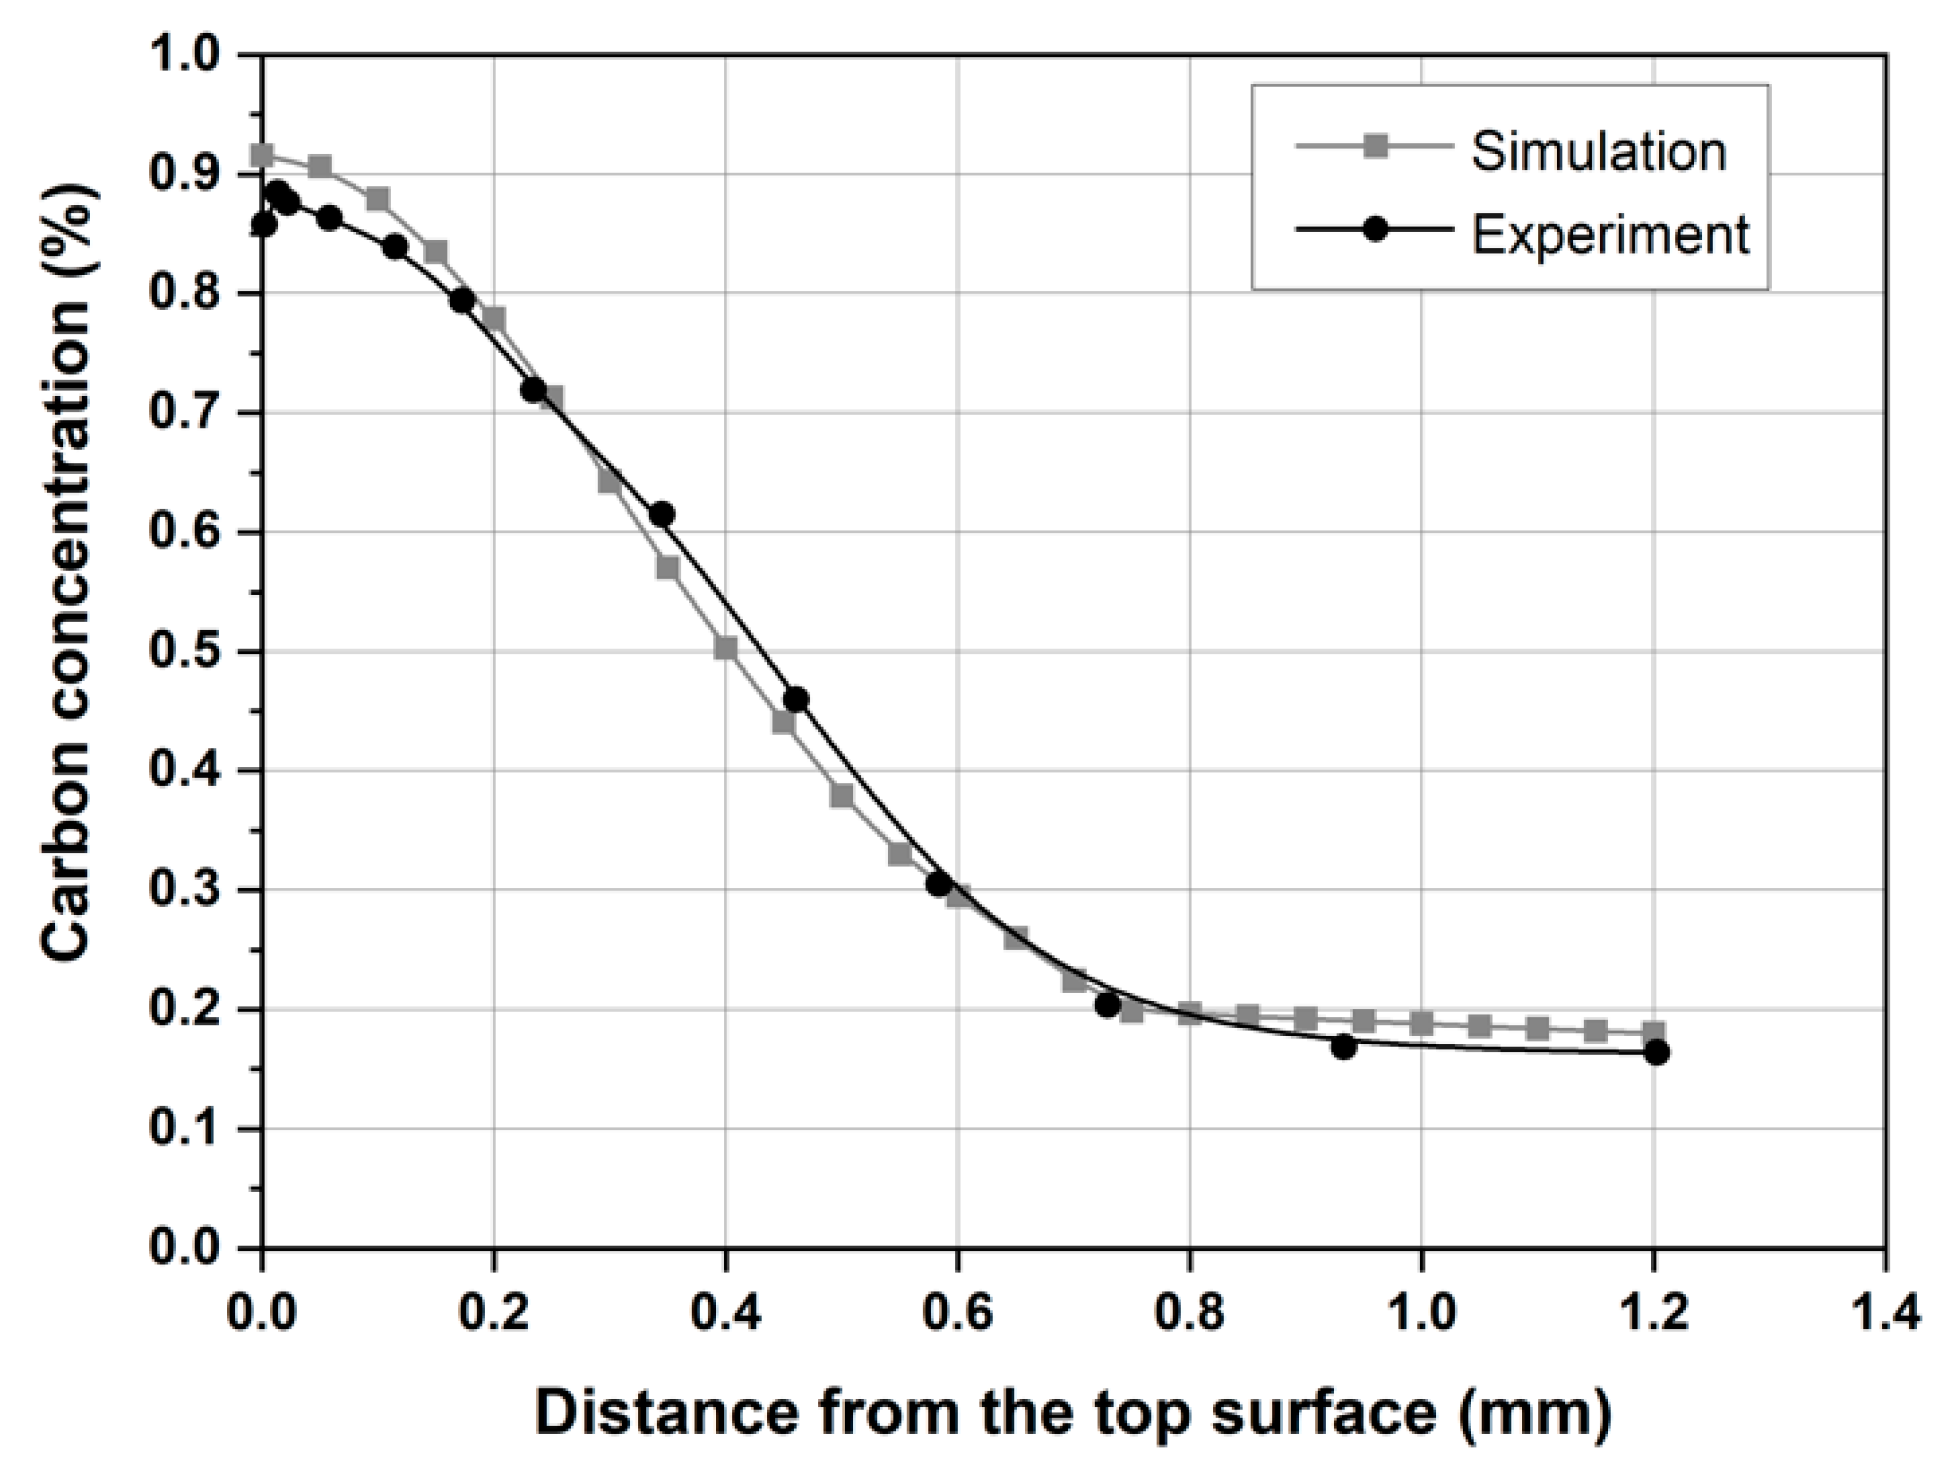
Firstly, the distribution of carbon concentration was obtained. As can be seen in
Figure 4, according to diffusion theory, the maximum concentration and thickness of the carburized layer are found in the corners of the element. The numerical results were compared with experimental data by plotting the value of carbon concentration in the middle of the top surface (
Figure 5).
Gas flow simulations were then performed to calculate the rapid cooling process. In this way, the influence of the construction of the quenching chamber and nozzle collectors on the generated coolant flow field is reflected, which, in turn, translates into the temperature distribution (
Figure 6) of the entire hardening process.
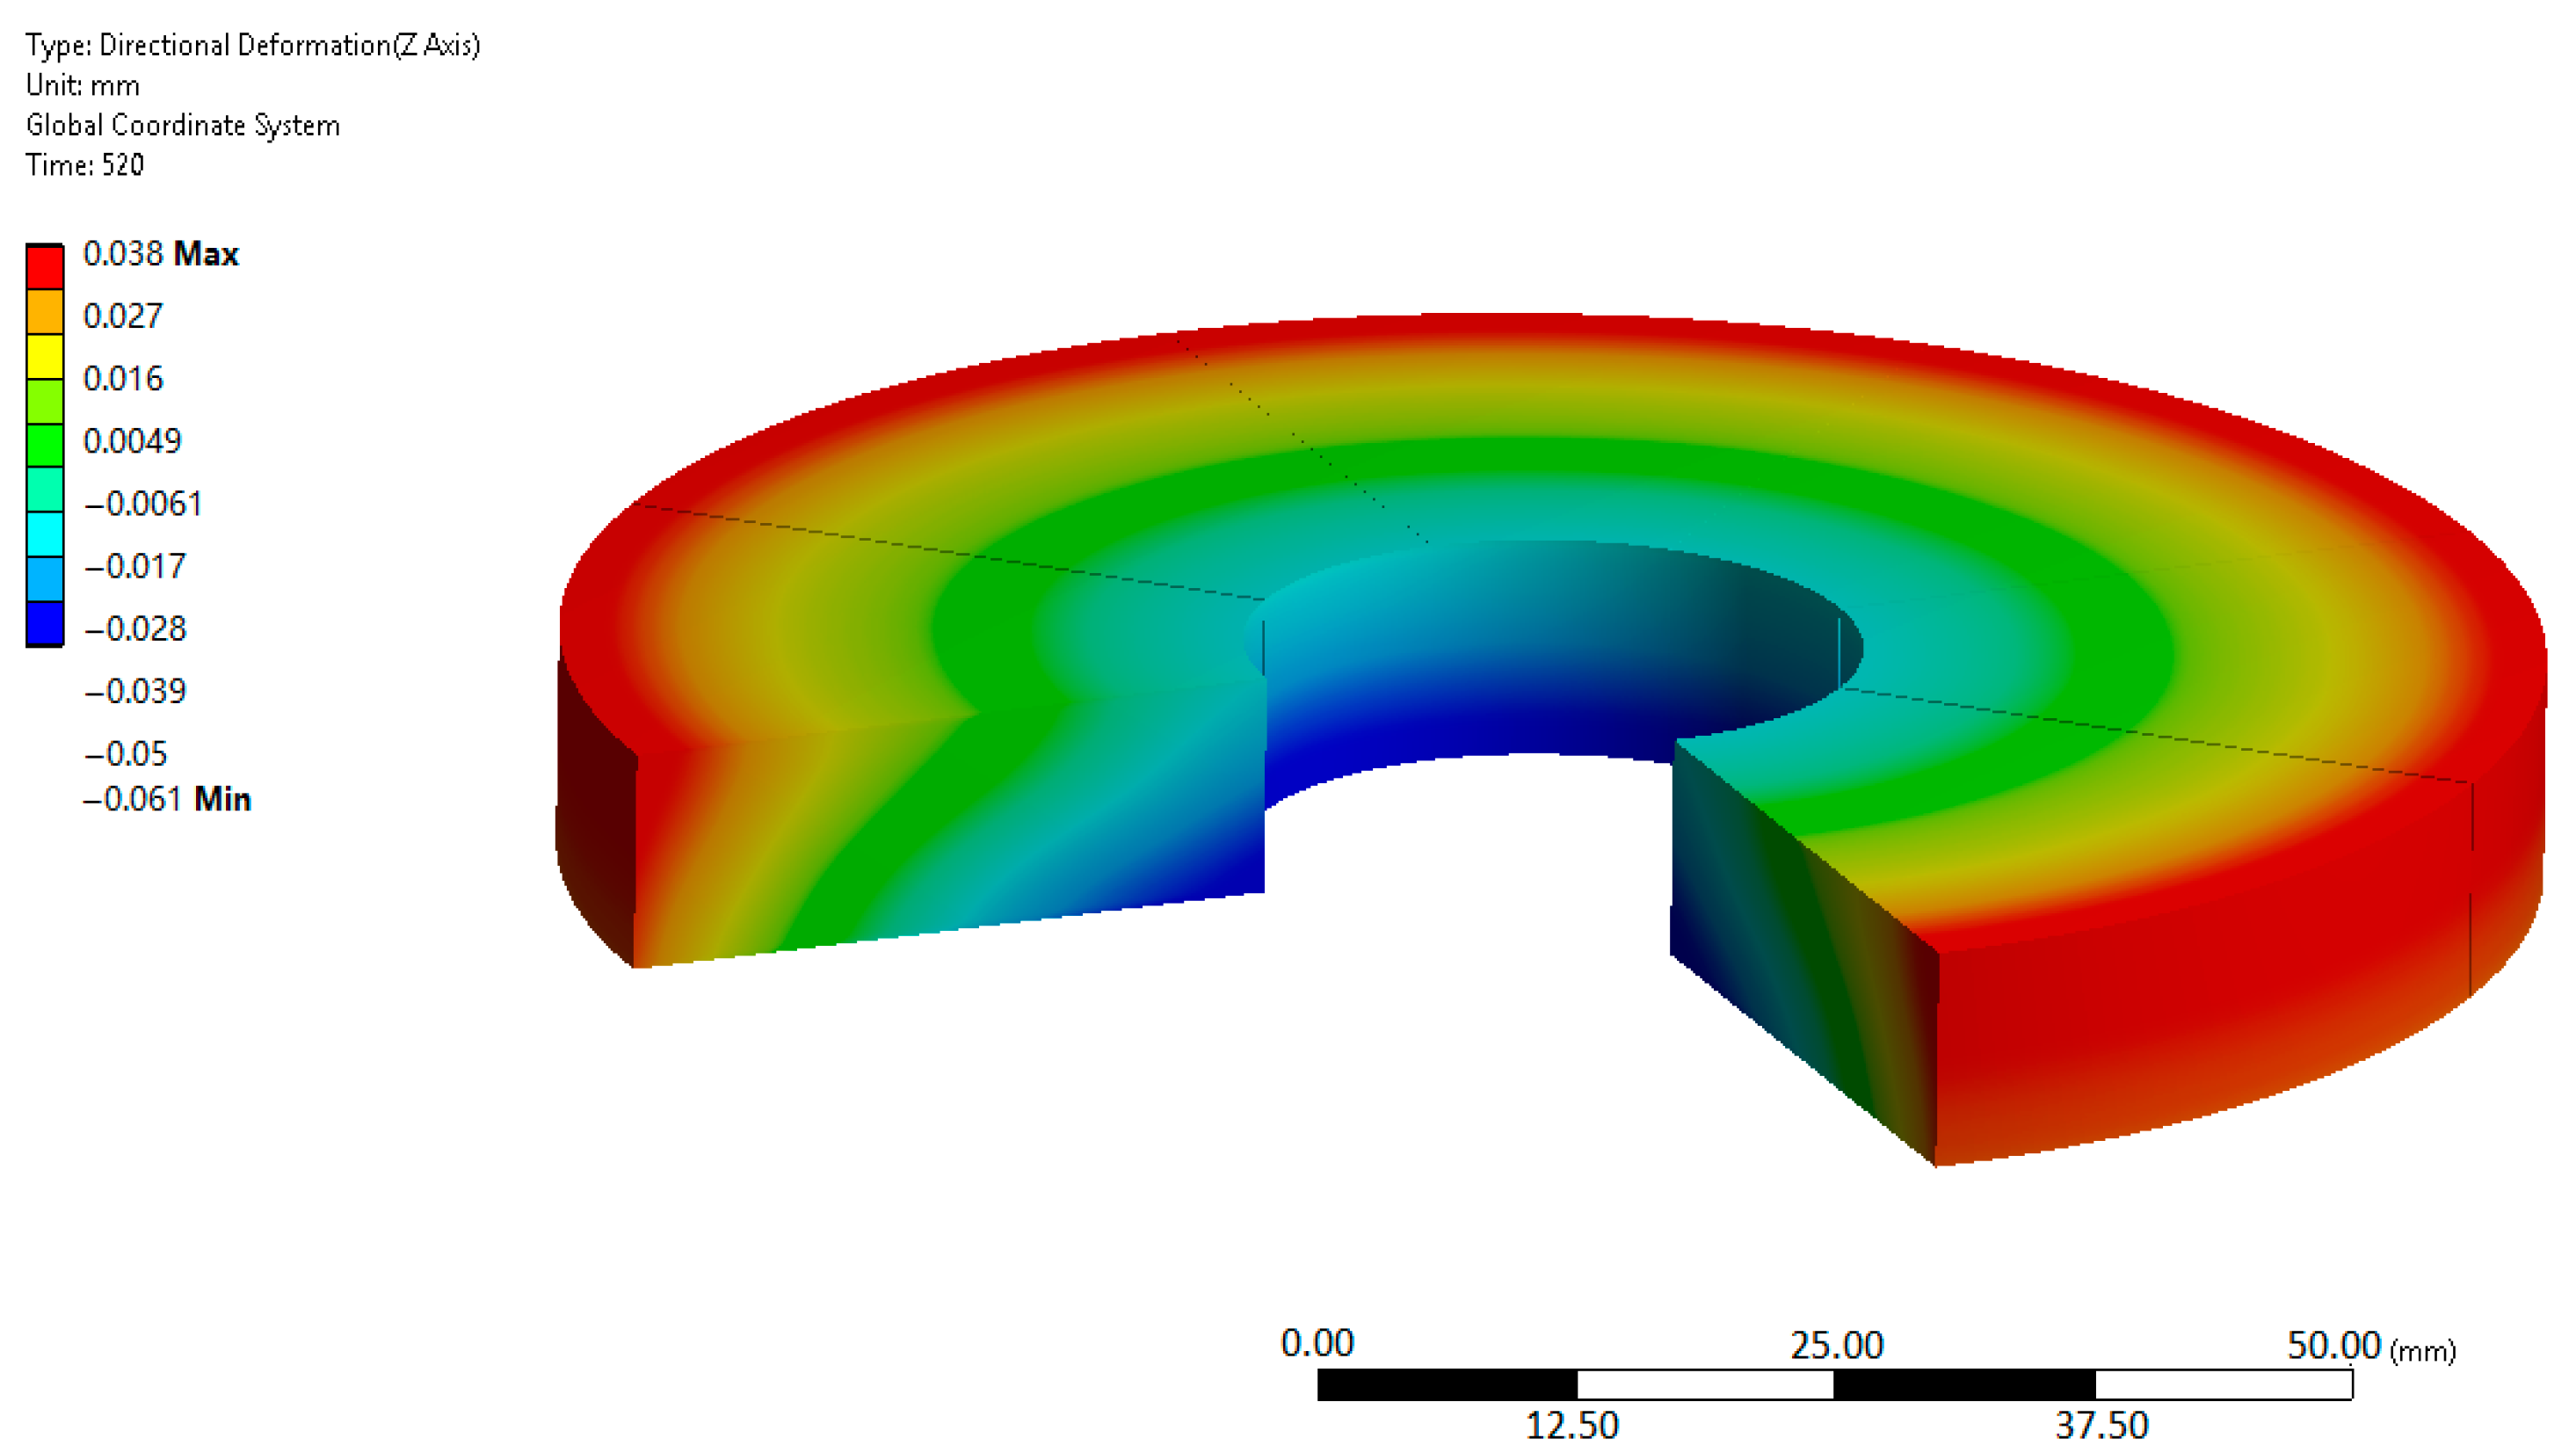
Thereafter, in the mechanical module, based on the results of diffusion and cooling simulations and harnessed material data, the deformations were calculated (
Figure 7) and compared with the experimental results (
Figure 8), where—for the same points as in the experiment—the numerical values of deformations were taken into a 3D comparison, shown below (
Figure 9,
Figure 10,
Figure 11 and
Figure 12).
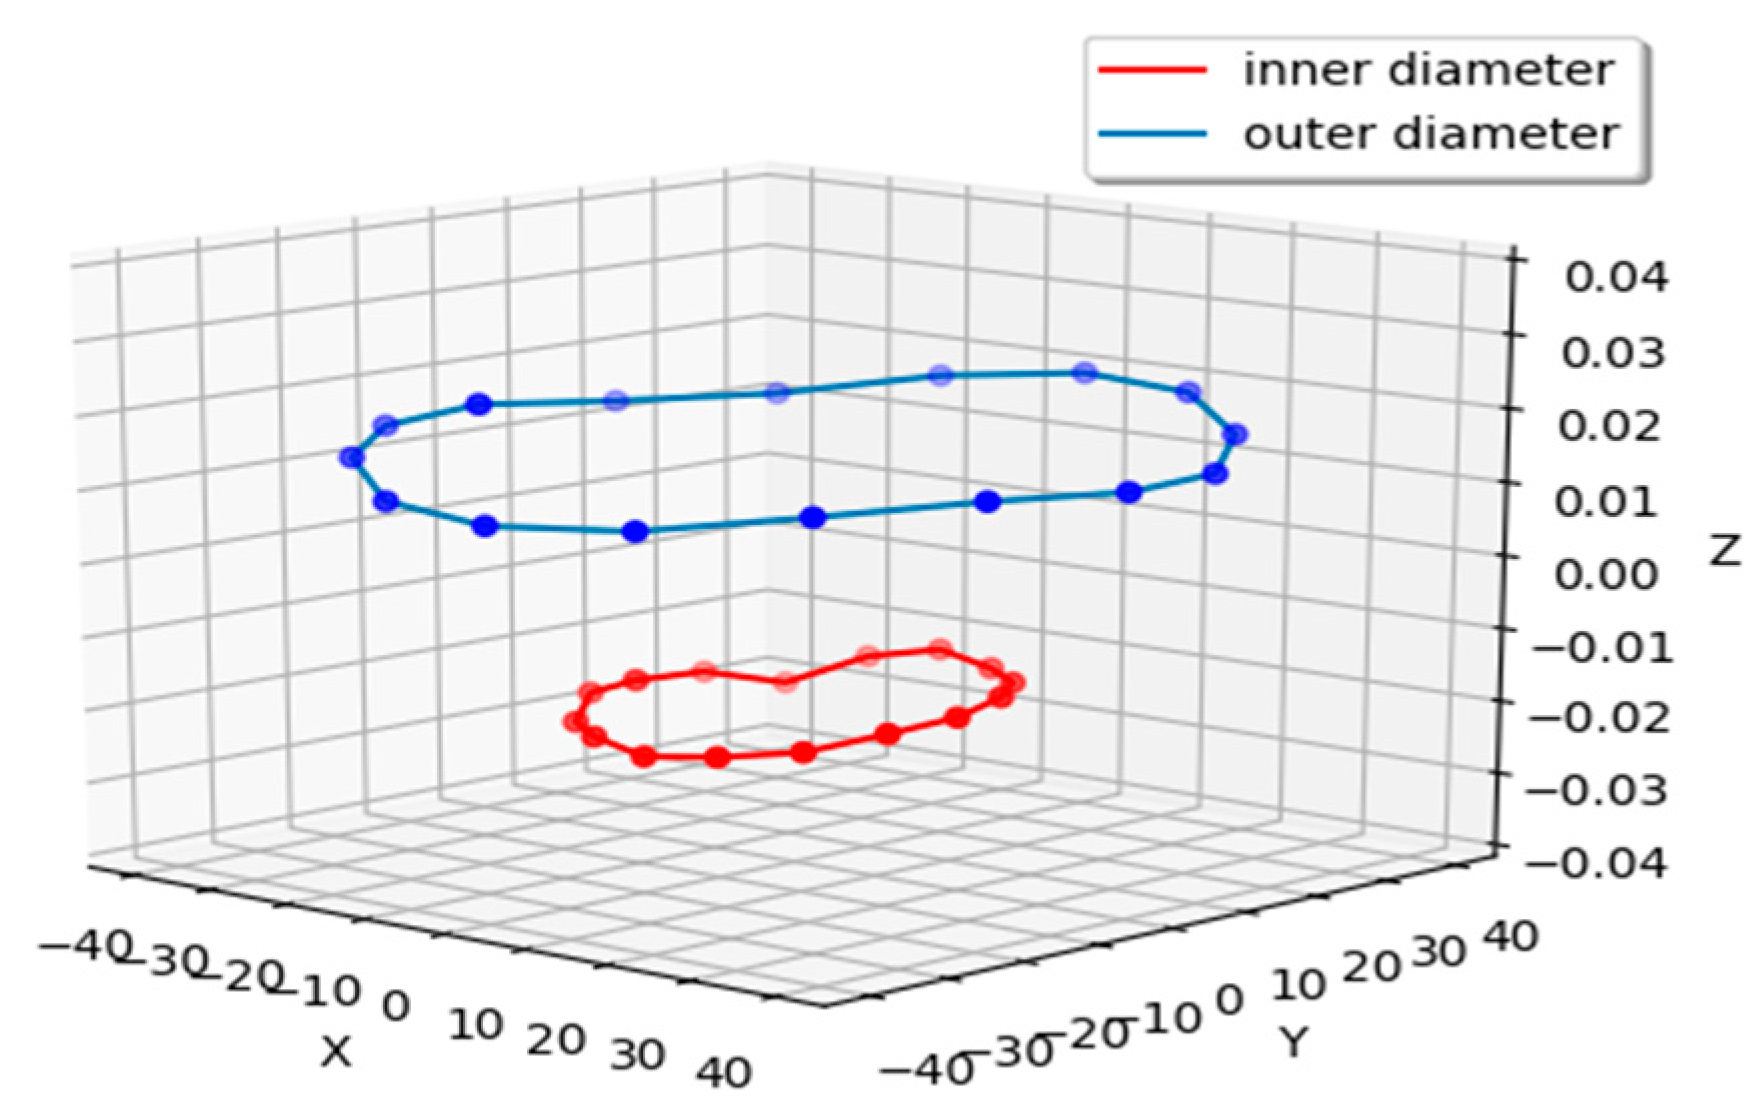
Figure 8 shows the examples of the results obtained from experimental measurements of the surface flatness of reference elements. As can be seen, the biggest difference in measurements occurred for measuring points close to the internal diameter of the reference elements. Analyzing the measurement results for all of the tested reference elements, the average difference in the surface flatness before the heat treatment processing was 0.014 ± 0.004 mm and, after heat treatment, processing was 0.035 ± 0.006 mm. Statistical analysis (ANOVA) for the experimental data performed did not show statistically significant differences between individual measuring points for the surface flatness parameter.
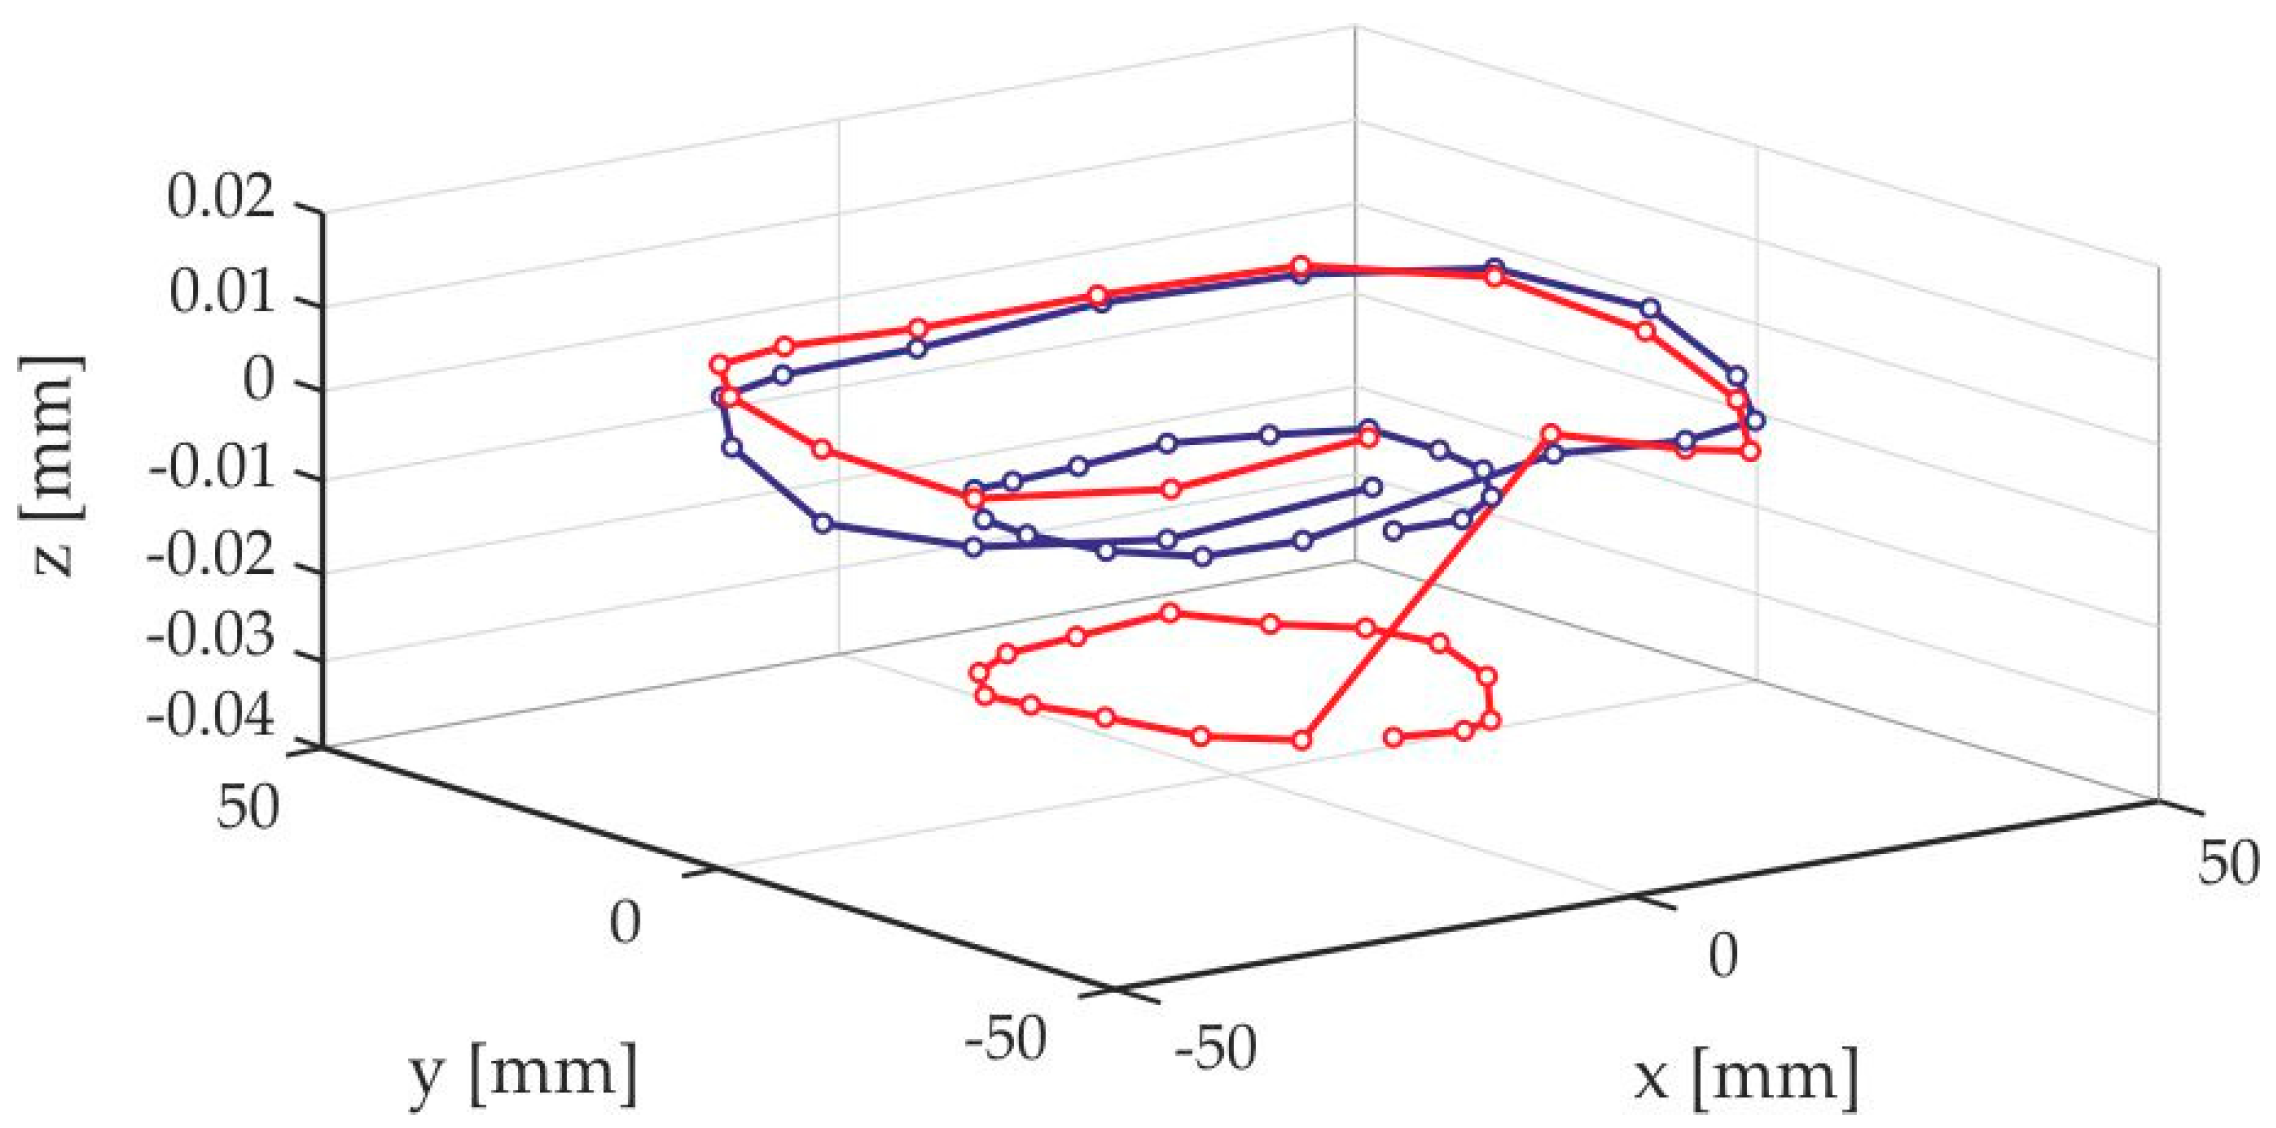
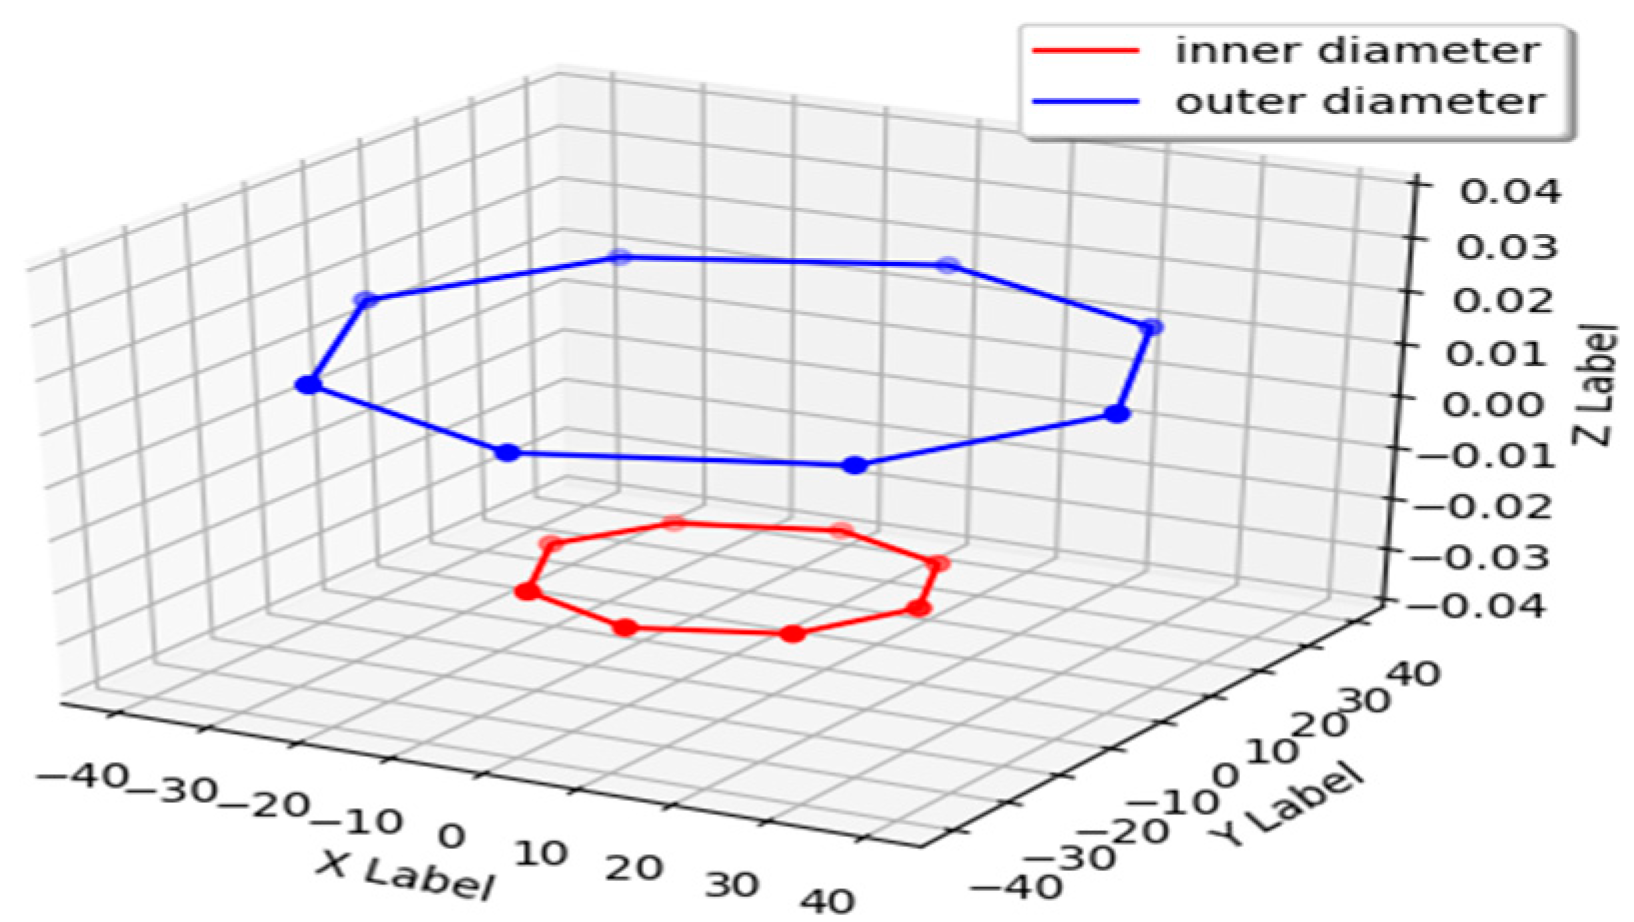
Figure 9 shows the average values of the surface flatness calculated from the measurements of 10 reference elements, and
Figure 10, the values obtained in the numerical simulation. For the final experimental average, the surface flatness (the difference before and after heat treatment) was 0.021 ± 0.002 mm. The difference between the obtained results in terms of surface flatness of the outer and inner circles was the result of sample preparation for testing and, primarily, the quenching process. In the opinion of the authors, quenching from high temperatures results in the immediate occurrence of a martensitic transition and a “freezing” of the geometrical dimensions on the outer side of the element [
10,
14,
15]. Consequently, the “deformation front” is pushed deep inside the element, and the inevitable changes in volume—related to transition of the material from austenite to martensite—take place in the inner parts of the element. This causes distortions in the surface flatness in the reference elements.
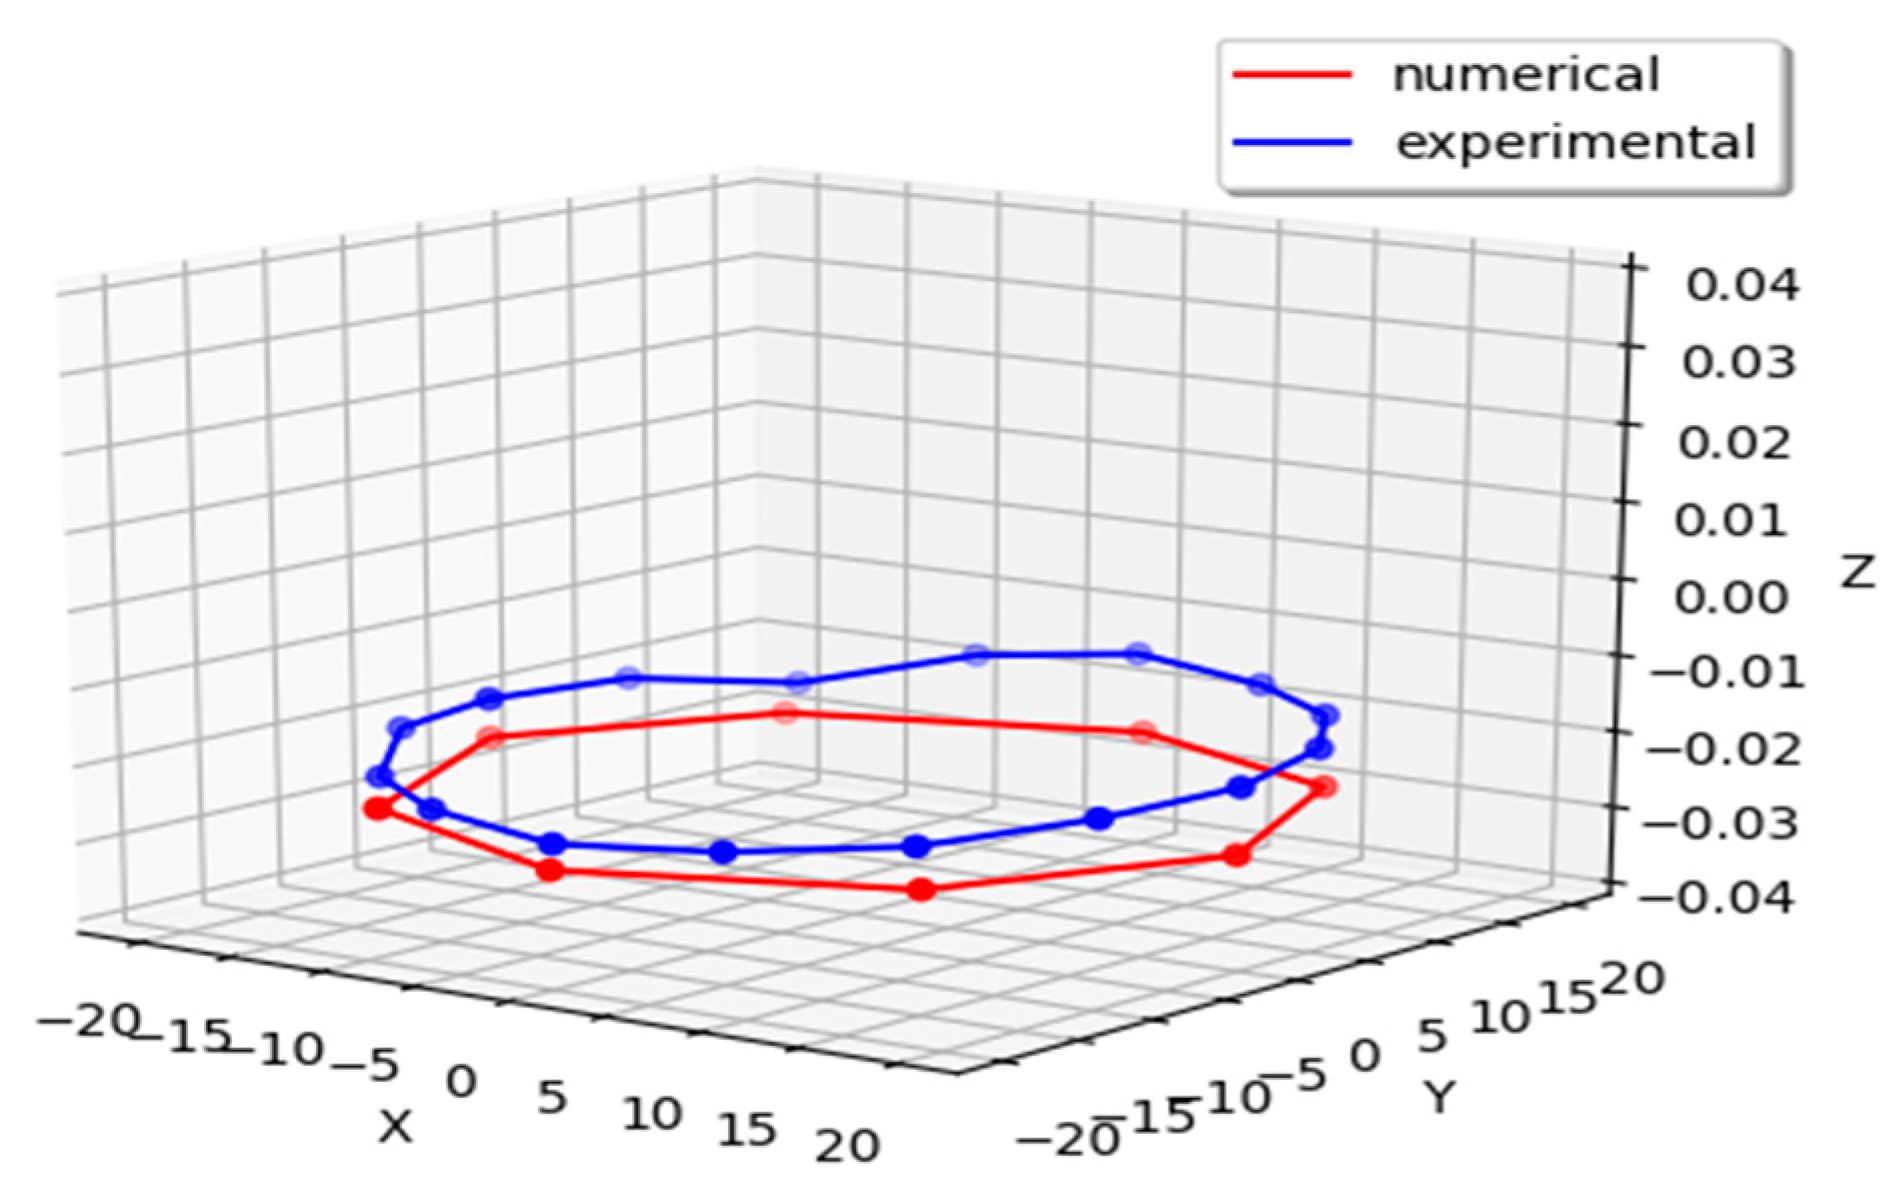
The presented charts (
Figure 11 and
Figure 12) show a fine correlation between experimental results and those obtained in numerical simulation. The numerical simulation also shows the differences between deformations in the inner and outer diameters. The average differences between the numerical and experimental results were 1.7% for the outer circle and 12% for the inner circle. The numerical simulation also shows the differences between deformations in the inner and outer diameters as with the experimental data, which are all the result of the way the elements are cooled and the construction of the chamber of HPGQ (4D Quench
®).


