Abstract
Nitrogen was implanted into 316L stainless steel by plasma immersion ion implantation (PIII) for surface modification. Due to nitrogen implantation, the corrosion resistance and interfacial contact resistance (ICR) were improved compared to the bare 316L stainless steel. The improved corrosion resistance was attributed to the formation of the expanded austenite phase (γN). The phase formation was found to be closely related to the evolution of the (111) plane texture. The formation of γN is strongly related to applied bias voltages. When bias voltages were increased to 15 kV, the γN phase was partially decomposed due to the formation of excessive nitride, including the CrN phase. For the ICR, increased crystallite size is effective in reducing contact resistance, which might arise from a reduced number of the grain boundary with electron scattering. In particular, the applied bias voltage of 10 kV was the most effective to both corrosion resistance and ICR, and its performance satisfies the demand for a bipolar plate in the Polymer Electrolyte Membrane Fuel Cells (PEMFC).
1. Introduction
Polymer Electrolyte Membrane Fuel Cells (PEMFC) possess various advantages compared to other fuel cells. Therefore, they can possibly be applied to a wide range of fields such as automobiles and ultra-small mobile power generation devices. However, since the stack currently being produced is expensive, it is essential to lower the production cost through the development of stack components and materials for commercialization. In particular, the bipolar plate, one of the main parts of the stack, accounts for about 45% of the stack cost and 80% of stack weight. Thus, the technology for lowering the price and the weight of the bipolar plate should be established [1].
The bipolar plate should be capable of serving a variety of purposes. Firstly, it acts as an electrical connector that transfers electrons in close contact with the electrode, and as a separator that separates between unit cells to prevent the binding of fuel and oxidizer. The bipolar plate also acts as a supporter to maintain the position of the Membrane Electrode Assembly (MEA). Therefore, the bipolar plate should possess excellent electrical conductivity, corrosion resistance, low gas permeability, high mechanical properties, and workability [1,2]. The metal-based bipolar plate is a material suitable for commercialized mass-production due to lower material cost, and superior mechanical properties and conductivity than graphite and composite materials [3,4]. However, metals have poor corrosion resistance in the oxidizing atmosphere inside the stack, and the performance of the fuel cell may be reduced due to the contamination of electrodes and electrolytes caused by melted materials during operation of the fuel cell.
316L austenitic stainless steel, with about 2.5% Mo added to 18% Cr-12% Ni steel, is one of the candidate materials that can be applied as a bipolar plate material since it exhibits excellent corrosion resistance and workability [5,6]. However, the electrical conductivity of 316L stainless steel is reduced by the surface oxide layer. Thus, to overcome this shortcoming, much attention has been paid to the surface treatment of 316L stainless steel [4,7,8]. Although austenitic stainless steel has excellent corrosion resistance, the highly oxidizing environment of PEMFC operation conditions mitigates corrosion resistance, and its low wear resistance and hardness needs to be promoted. Therefore, studies on the improvement of corrosion and mechanical properties by various nitriding processes are conducted [9,10,11].
Generally, austenitic stainless steels are known to be difficult to nitride unless high-temperature heat treatment is applied. Besides, CrN is precipitated when the heat treatment is performed at a high temperature of 450 °C or higher, and chromium (Cr) secedes from the solid solution, resulting in poor corrosion resistance of the materials. Therefore, low-temperature plasma nitriding was developed to solve the corrosion resistance reduction caused by CrN precipitation [12]. However, the plasma nitriding method is performed at high temperatures to obtain a treatment depth of several μm since the low diffusion rate and the influence of the surface oxide layer act as a diffusion barrier. Hence, the reduction in corrosion resistance occurs. Therefore, studies on surface treatment without corrosion resistance reduction are necessary. The surface treatments of steels by plasma immersion ion implantation (PIII) are performed at a lower temperature; no Cr diffusion occurs in the parent material to the surface layer. Thus, no Cr depletion layer is formed. Moreover, unlike the general coating methods, the PIII process does not include a distinct interface with the base material, and various products can be controlled by adjusting the implantation amount and heat treatment [13,14,15]. Therefore, the PIII process is considered to be advantageous for improving the surface properties. Recently, several studies reported that a PIII process would modify surface properties by enhancing wear and corrosion resistance [16,17,18,19].
Two variables that significantly affect the physical properties of the material implanted in PIII are the ion dose and the implant ion energy. In the present study, PIII was performed by setting the experimental parameters for the bias voltages, which affect the energy of the implanted ions. Then, the effect of the bias voltage on the structural and electrochemical properties was investigated. Besides, performance consideration was carried out on the PIII processed 316L stainless steel specimens as a bipolar plate for PEMFC.
2. Materials and Methods
In this study, the effect of change in the bias voltages on the structural and electrochemical properties of 316L stainless steel was examined. The STS 316L stainless steel sheet with a thickness of 0.1 mm was used as the base material, and its chemical composition was presented in Table 1. Nitrogen ions were implanted using 60 kV PIII ion implantation equipment (KERI, Changwon, Korea). The vacuum chamber for the ion implantation equipment has a capacity of 100 L, which has a cylindrical shape with a diameter of 500 mm and a height of 510 mm. Besides, a high voltage power supply capable of applying up to 60 kV is connected to the specimen holder that mounts the substrate. Figure 1 shows the schematic illustration of plasma ion implantation equipment, and the experimental conditions for ion implantation are summarized in Table 2, respectively. The chamber was initially vacuumed and stabilized at 1.3 × 10⁻³ Pa. The specimen surface was then cleaned by plasma etching for 30 min at 0.66 Pa.

Table 1.
Chemical composition of 316L stainless steel.
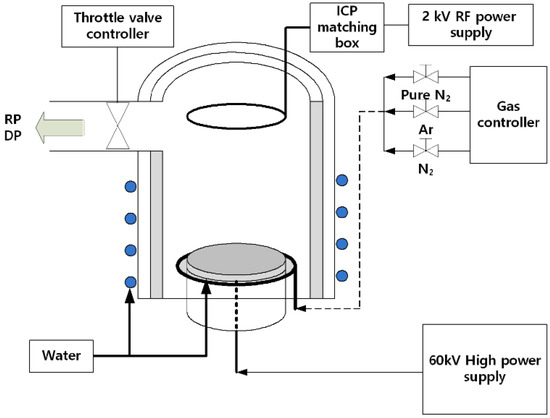
Figure 1.
Schematic illustration of the plasma immersion ion implantation system.
Table 2.
Experimental conditions for N+ implantation.
To investigate implanted ions distribution and range, we made predictions using the Monte Carlo simulation program (TRIM, SRIM-2013.00). The target stainless steel was set 8.0 g/cm3 of density, and total nitrogen ions for calculation were set at 99,999 ions. A secondary ion mass spectrometry (SIMS, IMS-6f, CAMECA, Gennevilliers, France) was used to examine practical ions’ distribution. Impact energy and current were set 15 keV and 34 nA, respectively. A potentiodynamic polarization test was performed to confirm the corrosion behavior of the nitrogen-implanted samples. The polarization tests were carried out using a typical three-electrode system. The corrosion potential and current density were measured by a potentiostat (Wonatech: WPG-100, Seoul, Korea). As a reference electrode, a Saturated Calomel Electrode (SCE) was used, and as a counter electrode, a platinum mesh with an area of 1 cm2 was used. The samples were placed in a 70 °C, 0.5 M sulfuric acid (H2SO4) aqueous solution as an electrolyte, while providing air (cathode condition) and hydrogen (anode condition). The corrosion current density was measured by varying the potential from –1.5 to +1.5 V, with a voltage scan rate of 5 mV/s to simulate the aggressive PEMFC environment. An X-ray diffractometer (Rigaku, D/Max 2500-V/PC, Tokyo, Japan) was used to investigate the phase analysis and changes in the texture of the nitrogen implantation layer. Glancing Angle X-ray Diffraction (GAXRD) was used to minimize the effect of the substrate. 2θ was measured in the range of 30° to 80°. At this time, a continuous scan was performed at a fixed angle of incidence of 2° with a step size of 0.2° and a scan speed of 2°/min. The obtained data were compared with standard JCPDS data files for identification and phase analysis and were calculated to investigate the texture changes. The interfacial contact resistance was measured by a multi resistivity meter (Agilent 34420A, Santa Clara, CA, USA) [11,12]. A pair of gas diffusion layers (TGPH-090, Toray, Tokyo, Japan) sandwiched the samples. A constant current (1A) was applied during measurement, and resistivity was measured as a function of compaction pressure (50–250 N/cm2).
3. Results and Discussion
3.1. Distribution of Implanted Ions
The effect of the bias voltages on the distribution of implanted N+ ions at the surface of the substrate is strongly related to the ion dose and ion implantation energy. A distribution of implanted N+ ions as a function of bias voltages variation is predicted by computational approaches, which are compared with the SIMS analysis results. According to LSS theory (Lindhard, Scharff, and Schiott), implantation depth depends on the ions’ energy, i.e., higher ions’ energy resulting in higher implantation depth [20].
As shown in the calculated ions distribution (Figure 2), implantation depth is increased with increasing applied bias voltages. These calculated results are highly consistent with the LSS theory. In comparison with lower bias voltages, higher bias voltage induces the migration of peak nitrogen concentration into the inside of the substrate. This implies that migration of nitrogen concentration could not effectively modify surface region and suppress nucleation and growth of pitting on the surface. Based on the obtained calculations, we assume that an excessively high bias voltage degrades corrosion resistance. Thus, the experimental parameter (bias voltages) was limited under 20 kV.
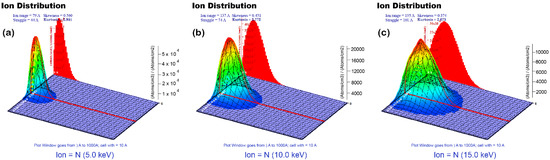
Figure 2.
Monte Carlo simulation program (TRIM) simulations for nitrogen profiles of implanted samples: (a) 5 kV, (b) 10 kV, (c) 15 kV.
An implantation depth profile of the N+ ions-implanted 316L stainless steels is shown in Figure 3. As expected, a variation of peak nitrogen concentration exhibits a similar tendency with the calculation results. The depth profiles are compared in Table 3, which demonstrates that only small differences were observed between TRIM calculation and SIMS analysis. Although total nitrogen contents are the highest at the applied voltage of the 15 kV, peak nitrogen concentration is migrated to inside. Therefore, the influence of these differences on the electrochemical characteristics will be discussed in the next section.
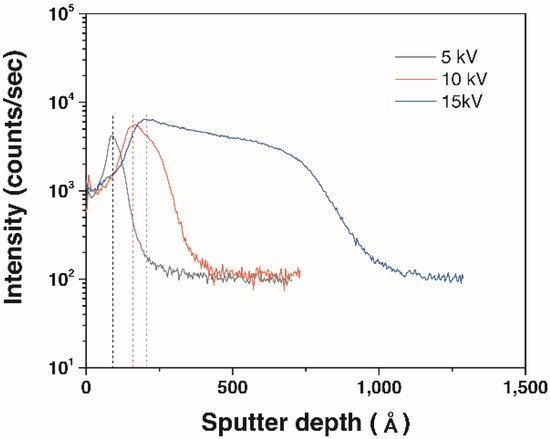
Figure 3.
Secondary ion mass spectrometry (SIMS) depth profiles of nitrogen contents in the implanted samples at the different bias voltages.
Table 3.
Implanted ion range of TRIM simulations and SIMS analysis
3.2. Electrochemical Characteristics
All the electrochemical analysis was performed in the cathodic and anodic conditions of PEMFC, as explained in the methods sections. The open-circuit potential (OCP) test was performed to investigate free corrosion potential until OCP reached equilibrium potential. In Figure 4, the 5 kV and 10 kV samples presented relatively higher potential, and no apparent potential drop was shown. In contrast, the bare and the 15 kV samples presented a sudden potential drop, which means they entered an activated state [21,22]. In particular, the 10 kV sample presented almost constant OCP during the test. This result implies that the 10 kV samples rapidly reach a steady-state with only small free corrosion in anodic conditions. Thus, the OCP test results suggest that applying lower bias voltages could enhance corrosion resistance in both cathodic and anodic conditions.
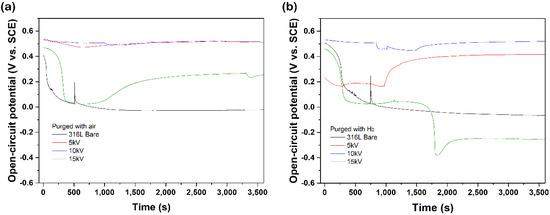
Figure 4.
Open circuit potential curves of N+-implanted samples in 0.5 M H2SO4 at 70 ℃ with purged (a) air and (b) H2.
To understand electrochemical behavior under the PEMFC operation conditions, we further performed a potentiodynamic polarization test (Figure 5). All of the samples presented a specific polarization curve composed of active, passive, and transpassive regions. In addition, they maintained a passive state at the cathode potential in PEMFC (0.6 V). Among all samples, the 10 kV sample exhibited the highest corrosion potential (Ecorr) in both cathodic and anodic conditions, which is consistent with the OCP results. In the case of current density at the cathode (0.6 V) and anode (−0.1) potential, the N+-implanted samples revealed higher current density than that of the bare sample, and expectably, the 10 kV sample exhibited the highest current density. Therefore, the obtained results demonstrate that N+ implantation positively affected corrosion behavior in the PEMFC operation conditions.
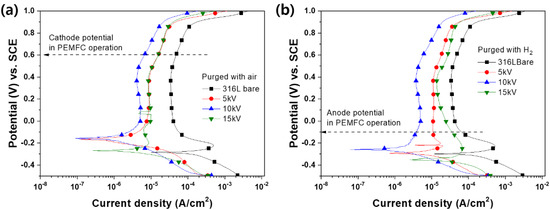
Figure 5.
Potentiodynamic polarization curves of N+-implanted samples in 0.5 M H2SO4 at 70 ℃ with purged (a) air and (b) H2.
To investigate durability during the PEMFC operation, the potentiostatic polarization test was performed (Figure 6). As shown in the variation of current density in the cathode condition (Figure 5a), all of the samples showed a rapid current density drop. Then, they gradually stabilized to low current density with repetitive increasing and decreasing. A rapid current density drop might correspond to the formation of the passive film, which protects the surface from corrosion in the acidic environment [23]. Lower voltages of the 5 kV and the 10 kV samples maintained relatively constant current density, while the 15 kV sample presented a relatively high current density fluctuation. In comparison with the bare sample, the N+-implanted samples reached steady-state quickly due to a fully passivated surface. This result suggests that the N+ implantation at lower bias voltage induces the facile formation of the passive film. In the case of anode condition (Figure 6b), the current density of the N+-implanted samples gradually stabilized after switching from negative to positive and switching reversibly, which might have originated from the native passive film not being stable and quickly dissolving and then forming another passive film [23,24]. A small cathodic current implies the slow dissolution of the passive film and cathodic protection. Unlike the anode condition, the current switching from positive to negative was not observed in the cathode condition, because cathode potential (0.6 V) is located in the middle of the passivation region. As a result, the N+-implanted samples satisfied the target of the US department of energy (DOE) in the cathode condition, whereas, in the anode condition, only the 10 kV sample satisfied the DOE target. These differences will be discussed through phase examination.
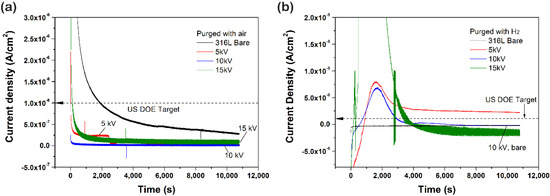
Figure 6.
Potentiostatic polarization curves of N+-implanted samples in 0.5 M H2SO4 at 70 ℃ (a) constant 0.6 V with purged air and (b) constant –0.1 V with purged H2.
3.3. Phase Transformation Characteristics
Figure 7 presents XRD patterns of N+-implanted samples. In the XRD patterns, the peak of the austenite (111) plane was slightly shifted to a lower angle and became broader with increasing applied bias voltage, which might correspond to the lattice expansion, the crystallite size, and the ununiform stress. A detailed parameter that was conducted from XRD patterns is summarized in Table 4. Moreover, the crystallite size was calculated from the obtained results using the Scherrer equation.
where D is the mean size of the ordered crystallite, K is a dimensionless shape factor, which usually equal to 1. λ is the X-ray wavelength, β is the line broadening at half the maximum intensity in radians, and is θ the Bragg angle. The new and small peak appeared at around 41.7°, and it is known as the nitrogen supersaturated phase, so-called expanded austenite (γN). The γN has an austenitic crystallographic structure (FCC), which is a nitrogen supersaturated metastable phase, and it has higher hardness and excellent corrosion and wear resistance [25,26,27,28,29]. Note that its broad peak width arises from high nitrogen concentration producing numbers of interplanar spacing in the whole of the implanted layer [30]. Meanwhile, the intensity of the γ (111) plane is increased as compared with the bare samples. This means that due to the N+ implantation, the number of (111) planes are arranged parallel with the surface, i.e., (111) plane becomes the strongly preferred orientation. This strongly preferred orientation effects on the corrosion resistance. Since the highest packing density of (111) plane in the FCC structure has stronger atomic bonding than (220) plane, it could inhibit atomic dissolution. Thus their corrosion resistance is enhanced by N+ implantation [31,32,33]. However, even though the 15 kV sample includes the γN phase with a strong preferred orientation for (111) plane, it presents different corrosion behavior with other samples. We assume that higher total nitrogen concentration induces the formation of excess nitride and CrN phase, resulting in a lack of chrome for maintaining corrosion resistance.
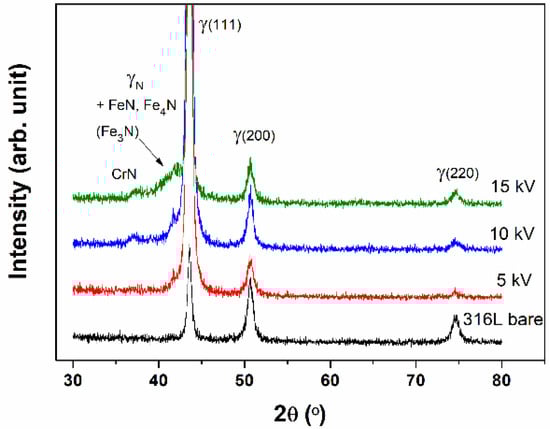
Figure 7.
X-ray Diffraction (XRD) patterns of N+-implanted samples as a function of implantation voltages.
Table 4.
The conducted parameter for (111) plane from XRD patterns of 316L bare and N+-implanted samples.
3.4. Interfacial Contact Resistance
The generated electricity during the PEMFC operation was provided via the bipolar plate that contacted with the electrode. Thus, lower interfacial contact resistance (ICR) is required for enhancing cell efficiency. The ICR between sample and carbon paper at the various compactions were examined. Generally, the bipolar plate is compacted at 150 N/cm2. Thus, the ICR value that conducted at the 150 N/cm2 is used for investigating the relationship between several factors. As can be seen in Figure 8, the 5 kV sample presents the highest resistivity, and its ICR value exhibits a huge difference compared to other samples. As a result, the 10 kV sample presented the lowest ICR at 150 N/cm2, and their values were as follows; 10 kV (0.7 mΩ∙cm2) < 15 kV (11.5 mΩ∙cm2) < 5 kV (791.5 mΩ∙cm2). In Figure 8b, the ICR tended to decrease as the crystallite size increased. Generally, electron scattering is generated from grain boundaries, wherefore an increase in the number of grain boundaries leads to a higher degree of electron scattering. In addition, the decrease in crystallite size gives rise to grain boundaries. Subsequently, increased electron scattering leads to an increase in electric resistivity [34]. Therefore, we assume this big difference in ICR might arise from the crystallite size. The 10 kV sample has the biggest crystallite size because the increase in the implanted nitrogen concentration leads to expanding lattices. However, when ion concentration reaches a critical point, increased plastic deformation induces the excessive formation of nitride, including CrN. On this occasion, a formation of the CrN phase accompanies the decomposition of the γN phase. Consequently, the crystallite size of the 15 kV sample becomes smaller than the 10 kV sample.
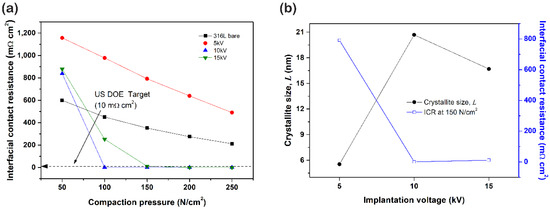
Figure 8.
(a) Interfacial contact resistance (ICR) and (b) correlation between ICR and crystallite size of N+-implanted samples.
4. Conclusions
In summary, based on the above results, increasing applied bias voltages leads to the migration of nitrogen, at peak concentration, into the inside of the surface. In the polarization test, lower bias voltages effectively enhanced corrosion resistance in the PEMFC operation conditions due to the formation of nitrogen supersaturated γN phase and distribution of nitrogen concentration near the surface. The most critical factor in corrosion behavior was the change of phase and preferred orientation. Higher bias voltages induced the formation of excessive nitride, which degraded corrosion resistance due to lack of chrome in the surface region. Consequently, 10 kV of bias voltages was the optimum N+ implantation condition for the best corrosion resistance in both the cathode (6.37 × 10⁻⁶ A/cm2) and anode (3.43 × 10⁻⁶ A/cm2) sides. Moreover, it presented the lowest ICR (0.7 mΩ∙cm2) due to reducing grain boundaries.
Author Contributions
Conceptualization, S.J. and B.-C.C.; Analysis, I.-S.L. and S.Y.; Software, S.J.; Validation, B.-C.C. and D.K.; Writing-Original Draft Preparation, S.J., Y.-S.K., and D.-W.K. All authors have read and agreed to the published version of the manuscript.
Funding
This study has been conducted with the support of the Korea Institute of Industrial Technology as “Development of Core Manufacturing Technology for green Energy Ship (JA200009)”.
Conflicts of Interest
The authors declare no conflict of interest.
References
- Cooper, J.S. Design analysis of PEMFC bipolar plates considering stack manufacturing and environment impact. J. Power Sources 2004, 129, 152–169. [Google Scholar] [CrossRef]
- Wang, H.; Tuner, J.A. Reviewing metallic pemfc bipolar plates. Fuel Cells 2010, 10, 510–519. [Google Scholar] [CrossRef]
- Joseph, S.; McClure, J.C.; Chianelli, R.; Pich, P.; Sebastian, P.J. Conducting polymer-coated stainless steel bipolar plates for proton exchange membrane fuel cells (PEMFC). Int. J. Hydrog. Energy 2005, 12, 1339–1344. [Google Scholar] [CrossRef]
- Hermann, A.; Chaudhuri, T.; Spagnol, P. Bipolar plates for PEM fuel cells: A review. Int. J. Hydrog. Energy 2005, 12, 1297–1302. [Google Scholar] [CrossRef]
- Burstein, G.T.; Pistorius, P.C.; Mattin, S.P. The nucleation and growth of corrosion pits on stainless steel. Corros. Sci. 1993, 35, 57–62. [Google Scholar] [CrossRef]
- Winiczenko, R.; Kaczorowski, M. Friction welding of ductile iron with stainless steel. J. Mater. Process. Technol. 2013, 213, 453–462. [Google Scholar] [CrossRef]
- Mehta, V.; Cooper, J.S. Review and analysis of PEM fuel cell design and manufacturing. J. Power Sources 2003, 114, 32–53. [Google Scholar] [CrossRef]
- Scholta, J.; Rohland, B.; Trapp, V.; Focken, U. Investigations on novel low-cost graphite composite bipolar plates. J. Power Sources 1999, 84, 231–234. [Google Scholar] [CrossRef]
- Liang, W.; Bin, X.; Zhiwei, Y.; Yaqin, S. The wear and corrosion properties of stainless steel nitrided by low-pressure plasma-arc source ion nitriding at low temperatures. Surf. Coat. Technol. 2000, 130, 304–308. [Google Scholar] [CrossRef]
- Pranevicius, L.; Templier, C.; Rivière, J.P.; Méheust, P.; Pranevicius, L.L.; Abrasonis, G. On the mechanism of ion nitriding of an austenitic stainless steel. Surf. Coat. Technol. 2001, 135, 250–257. [Google Scholar] [CrossRef]
- Tian, R.; Sun, J.; Wang, L. Plasma-nitrided austenitic stainless steel 316L as bipolar plate for PEMFC. Int. J. Hydrog. Energy 2006, 31, 1874–1878. [Google Scholar] [CrossRef]
- Gil, L.; Brühl, S.; Jiménez, L.; Leon, O.; Guevara, R.; Staia, M.H. Corrosion performance of the plasma nitrided 316L stainless steel. Surf. Coat. Technol. 2006, 7, 4424–4429. [Google Scholar] [CrossRef]
- Lieberman, M.A. Model of plasma immersion ion implantation. J. Appl. Phys. 1989, 66, 2926–2929. [Google Scholar] [CrossRef]
- Davies, D.P.; Adcock, P.L.; Turpin, M.; Rowen, S.J. Bipolar plate materials for solid polymer fuel cells. J. Appl. Electrochem. 2000, 30, 101–105. [Google Scholar] [CrossRef]
- Wang, H.; Sweikart, M.A.; Turner, J.A. Stainless steel as bipolar plate material for polymer electrolyte membrane fuel cells. J. Power Sources 2003, 115, 243–251. [Google Scholar] [CrossRef]
- Wang, K.S.; Che, H.L.; Lei, M.K. Corrosion-fatigue properties of plasma-based low-energy nitrogen ion implanted AISI 304 L austenitic stainless steel in borate buffer solution. Surf. Coat. Technol. 2016, 288, 30–35. [Google Scholar] [CrossRef]
- Budzynski, P. Long-range effect in nitrogen ion-implanted AISI 316L stainless steel. Nucl. Instrum. Methods Phys. Res. Sect. B Beam Interact. Mater. At. 2015, 342, 1–6. [Google Scholar] [CrossRef]
- Zhang, J.; Peng, S.; Zhang, A.; Wen, J.; Zhang, T.; Xu, Y.; Yan, S.; Ren, H. Nitrogen ion implantation on the mechanical properties of AISI 420 martensitic stainless steel. Surf. Coat. Technol. 2016, 305, 132–138. [Google Scholar] [CrossRef]
- Voorwald, H.J.C.; Bonora, R.G.; Oliveira, V.M.C.A.; Cioffi, M.O.H. Increasing fatigue resistance of AISI 4340 steel by nitrogen plasma ion-implantation. Eng. Fail. Anal. 2019, 104, 490–499. [Google Scholar] [CrossRef]
- Bunker, S.N.; Armini, A.J. Modeling of concentration profiles from very high dose ion implantation. Nucl. Instrum. Methods Phys. Res. Sect. B Beam Interact. Mater. At. 1989, 39, 7–10. [Google Scholar] [CrossRef]
- Ibrahim, M.A.M.; Korablov, S.F.; Yoshimura, M. Corrosion of stainless steel coated with TiN, (TiAl)N and CrN in aqueous environments. Corros. Sci. 2002, 44, 815–828. [Google Scholar] [CrossRef]
- Padhy, N.; Ningshen, S.; Panigrahi, B.K.; Mudali, U.K. Corrosion behaviour of nitrogen ion implanted AISI type 304L stainless steel in nitric acid medium. Corros. Sci. 2010, 52, 104–112. [Google Scholar] [CrossRef]
- Feng, F.; Shen, Y.; Liu, D.; Chu, P.K.; Cai, X. Ni–Cr Co-implanted 316L stainless steel as bipolar plate in polymer electrolyte membrane fuel cells. Int. J. Hydrog. Energy 2010, 35, 690–700. [Google Scholar] [CrossRef]
- Jones, D.A. Principles and Prevention of Corrosion, 2nd ed.; Prentice Hall: Upper Saddle River, NJ, USA, 2011. [Google Scholar]
- Christiansen, T.; Somers, M.A.J. On the crystallographic structure of S-phase. Scr. Mater. 2004, 50, 35–37. [Google Scholar] [CrossRef]
- Li, X.; Samandi, M.; Dunne, D.; Hutchings, R. Evolution of the microstructure of austenitic stainless steel nitrogen implanted at elevated temperatures. Surf. Coat. Technol. 1995, 71, 175–181. [Google Scholar] [CrossRef]
- Picard, S.; Memet, J.B.; Sabot, R.; Grosseau-Poussard, J.L.; Rivière, J.P.; Meilland, R. Corrosion behaviour, microhardness and surface characterisation of low energy, high current ion implanted austenitic stainless steel. Mater. Sci. Eng. A 2001, 303, 163–172. [Google Scholar] [CrossRef]
- Blawert, C.; Weisheit, A.; Mordike, B.L.; Knoop, R.M. Plasma immersion ion implantation of stainless steel: Austenitic stainless steel in comparison to austenitic-ferritic stainless steel. Surf. Coat. Technol. 1996, 85, 15–27. [Google Scholar] [CrossRef]
- Blawert, C.; Mordike, B.L.; Jirásková, Y.; Schneeweiss, O. Structure and composition of expanded austenite produced by nitrogen plasma immersion ion implantation of stainless steels X6CrNiTi1810 and X2CrNiMoN2253. Surf. Coat. Technol. 1999, 116, 189–198. [Google Scholar] [CrossRef]
- Fewell, M.P.; Mitchell, D.R.G.; Priest, J.M.; Short, K.T.; Collins, G.A. The nature of expanded austenite. Surf. Coat. Technol. 2000, 131, 300–306. [Google Scholar] [CrossRef]
- Park, H.; Szpunar, J.A. The role of texture and morphology in optimizing the corrosion resistance of zinc-based electrogalvanized coatings. Corros. Sci. 1998, 40, 525–545. [Google Scholar] [CrossRef]
- Kumar, B.R.; Singh, R.; Mahato, P.K.B.; Bandyopadhyay, D.N.R.; Bhattacharya, D.K. Effect of texture on corrosion behavior of AISI 304L stainless steel. Mater. Charact. 2005, 52, 141–147. [Google Scholar] [CrossRef]
- Song, G.L.; Xu, Z. Crystal orientation and electrochemical corrosion of polycrystalline Mg. Corros. Sci. 2012, 63, 100–112. [Google Scholar] [CrossRef]
- Day, M.E.; Delfino, M.; Fair, J.A.; Tsai, W. Correlation of electrical resistivity and grain size in sputtered titanium films. Thin Solid Films 1995, 254, 285–290. [Google Scholar] [CrossRef]
© 2020 by the authors. Licensee MDPI, Basel, Switzerland. This article is an open access article distributed under the terms and conditions of the Creative Commons Attribution (CC BY) license (http://creativecommons.org/licenses/by/4.0/).