1. Introduction
Ductile iron possesses the properties of high strength, toughness, wear resistance, shock absorption, easy cutting, notch insensitive, etc. However, due to the harsh working conditions, the surface wear of ductile iron can cause mechanical failure [
1,
2]. Surface modification technology is an effective way to enhance surface strengthen, overcome the limitations of shape and size, and reduce costs [
3]. Due to its good properties and low cost, Ni-based powders are often used to improve the surface properties of substrates, such as strength, wear resistance, and corrosion resistance [
4,
5,
6].
Mughal et al. [
7,
8] used the finite element method to study the process of metal additive manufacturing process. It has been proven that continuous deposition without interlayer cooling leads to high and uniform preheating of the substrate, which reduces the deformation of the cladding layer. However, at the same time, it was found that the continuous multilayer deposition causes a thermal storage effect, which results in the loss of control over dimensional tolerances.
Delinger et al. [
9] studied the effect of interlayer cooling time on the distortion and residual stress of Ti–6Al–4V powder. The results show that a shorter interlayer cooling time produces lower distortion and residual stresses. Nevertheless, shortening the cooling time can excessively increase the energy input into the system. Overheating can consequently lead to undesirable remelting, poor surface finish, and poor dimensional tolerances in the final part.
Chen et al. [
10] studied the effect of improving the base cooling effect on the metal additive manufacturing process. It is found that the crystal orientation of the specimens can be improved by imposing a continuous water flow on the back of the substrate. As described in the paper, due to the thermal storage during the deposition process, the microstructure of the deposition is uneven. This means that as the number of layers increases, the cooling effect becomes worse. Furthermore, it is only suitable for specimens with simple shapes, not for specimens with complex shapes.
At present, there are many studies on laser process parameters. Weng et al. [
11] studied the effects of laser-specific energy on the microstructures and properties of the cladding layers. Liu et al. [
12] compared the structural and mechanical properties of Inconel 718 prepared with or without argon protection during laser cladding. Cheng et al. [
13] studied the effects of laser energy density and scanning speed on the properties of the cladding layer. However, few studies have been done on the effect of interlayer cooling. In this paper, the differences in the microstructure and properties of two Ni-based alloys deposited on ductile iron under interlayer cooling or non-interlayer cooling conditions were investigated. This work can improve the quality of the cladding layer, especially strength and hardness, and help control dimensional tolerances.
2. Experimental Details
The experimental system consists of a 4 kW semiconductor laser (LDM 4000-100, Laserline, Mülheim-Kärlich, Germany), a 6-axis KUKA robot (KR 16-2), a high precision powder feeder, a side powder feeding nozzle, and an inert gas (Ar) protection box.
The substrate was a piece of ductile iron (ISO 1038/JS/500-7) with a size of 100 mm × 50 mm × 15 mm. The powder used in the experiment was Ni-based self-fluxing alloy powder (Wall Colmonoy Corporation, Madison Heights, MI, USA). The chemical compositions of the ductile iron and the powder are listed in
Table 1 and
Table 2, respectively.
Before the experiment, the powder was dried in a vacuum at 100 °C for 2 h to remove water vapor adsorbed on the surface. The substrate’s surface was polished with sandpaper (180–400 grit sandpaper) and cleaned with acetone. The main process parameters used in the experiments are as follows: laser power of 1.6–2.5 kW, scanning speed of 8 mm/s, powder feeding speed of 20 g/min, gas flow rate of 12 L/min, laser spot diameter of 5 mm, and deposition thickness of 0.2 mm.
Table 3 shows the deposition parameters in the experiment. After each cladding layer was completed, each interlayer cooling specimen was cooled to room temperature (about 5 min), and each non-interlayer cooling specimen was cladded without waiting time. The cladding equipment and one of the samples are shown in
Figure 1.
The height of the cladding layers was measured by a micrometer. The cross-section of the specimen was cut by a wire-cut electrical discharge machine (EDM, DK7763, CHENGHONG, Jiangsu, China) along a vertical laser path. Metallographic specimens were prepared by mechanical polishing. The polished specimens were etched by a solution (200 mL H
2O + 200 mL HCl + 40 g CuSO
4). The heat-affected zone (HAZ) was etched by a solution (HF and HNO
3 1:1 mixing). The microstructures of the powder and the layers were analyzed by optical microscopy (OM, Axio Vert.A1, ZEISS, Oberkochen, Germany), and a scanning electron microscopy (SEM, SIGMA 04-03, ZEISS, Oberkochen, Germany) equipped with an energy-dispersive spectroscopy (EDS). The penetration data in
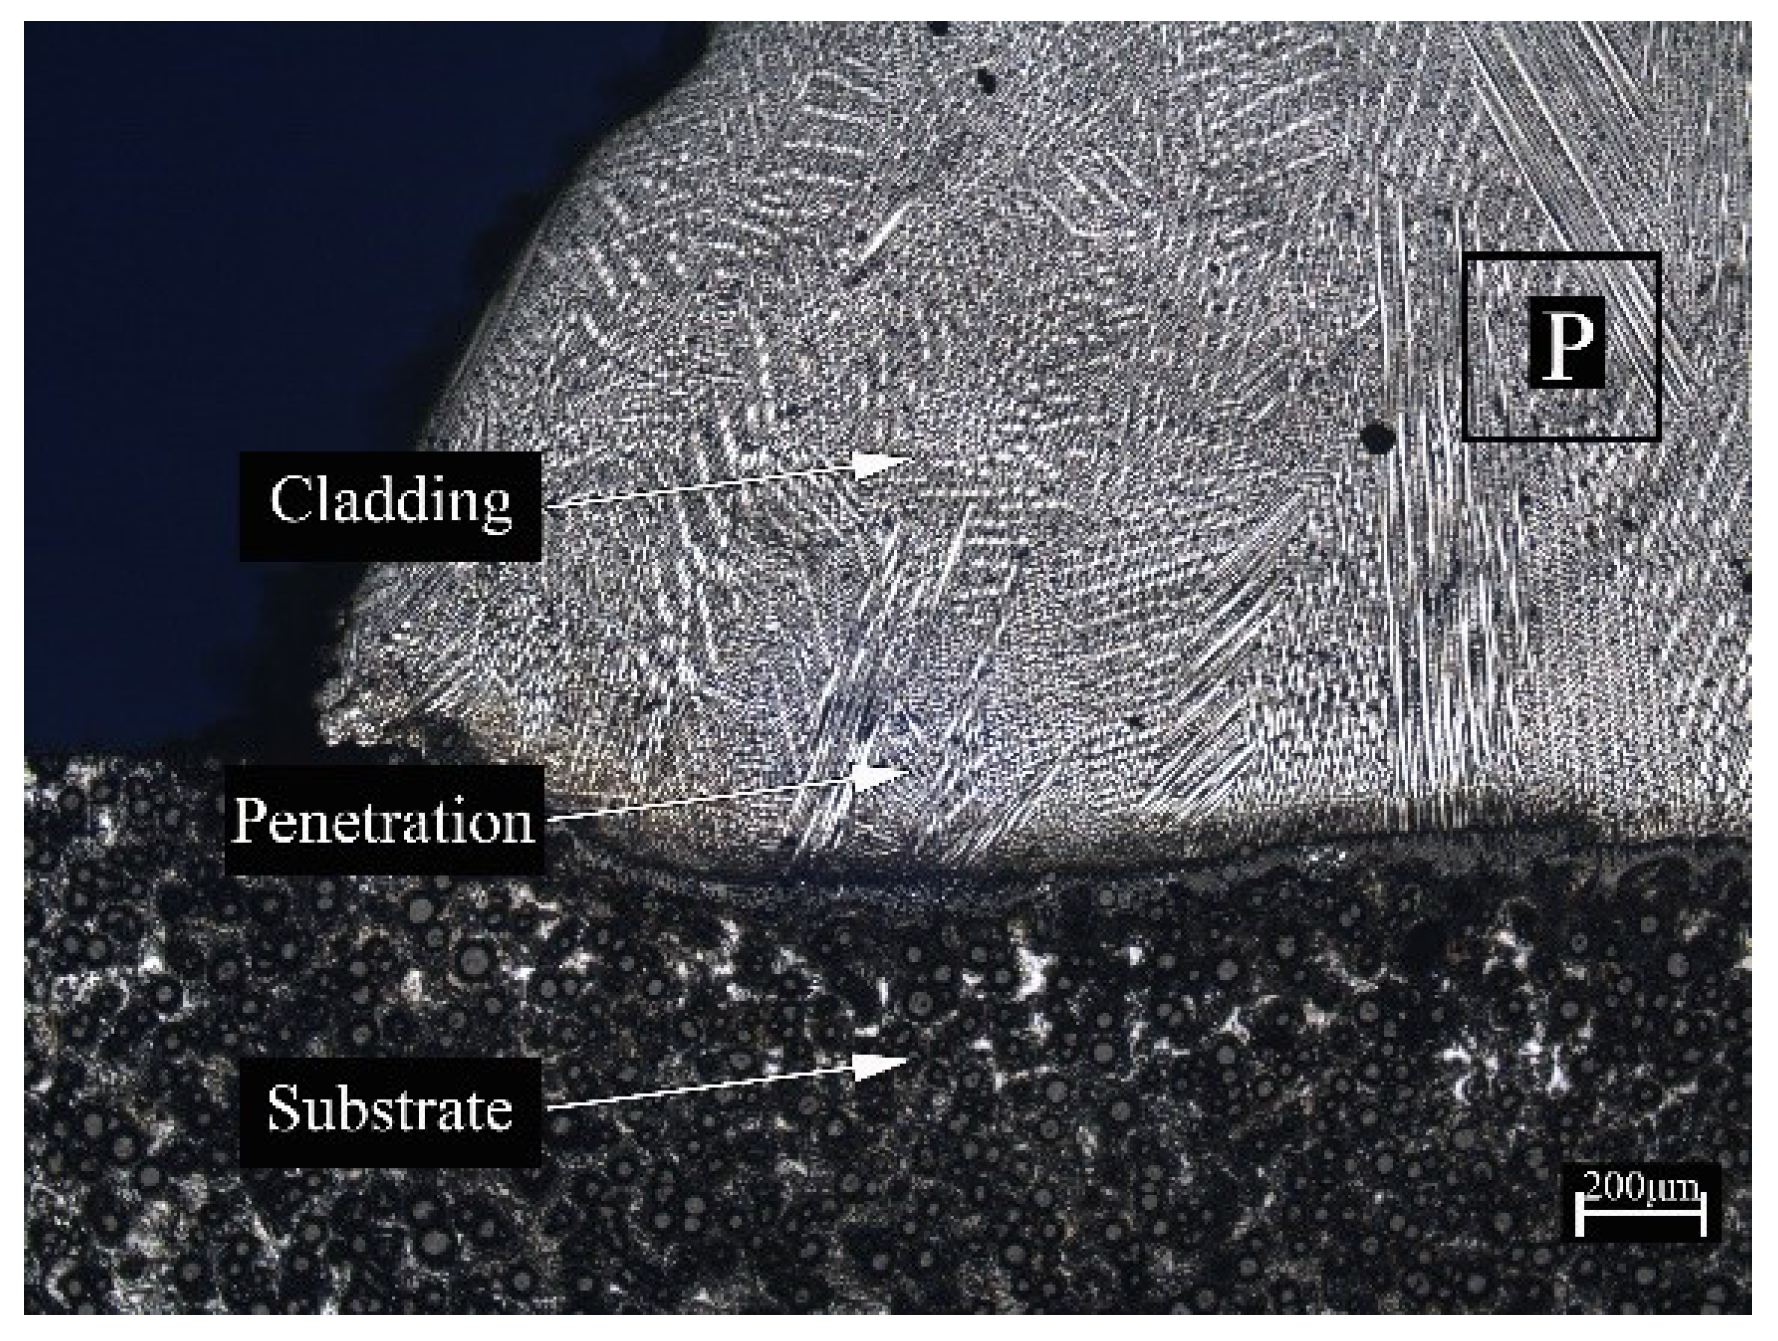
Table 3, which indicate the distance from the deepest position of the substrate’s melting part to the surface of the substrate, as schematically illustrated in
Figure 2, were also measured by an optical microscopy. Meanwhile, the dilution ratio in
Figure 2 is the ratio of penetration to thickness of layers. Phase constitution was identified by X-ray diffraction (XRD, D/MAX 2500/PC, Neo-confucianism, Tokyo, Japan). The microhardness of the single tracks was measured with a HV-5ACL microhardness tester (HENGYI, Shanghai, China) and a Vickers pyramidal-shaped diamond indenter under the load of 0.5 kg for 15 s of loading.
3. Results and Discussion
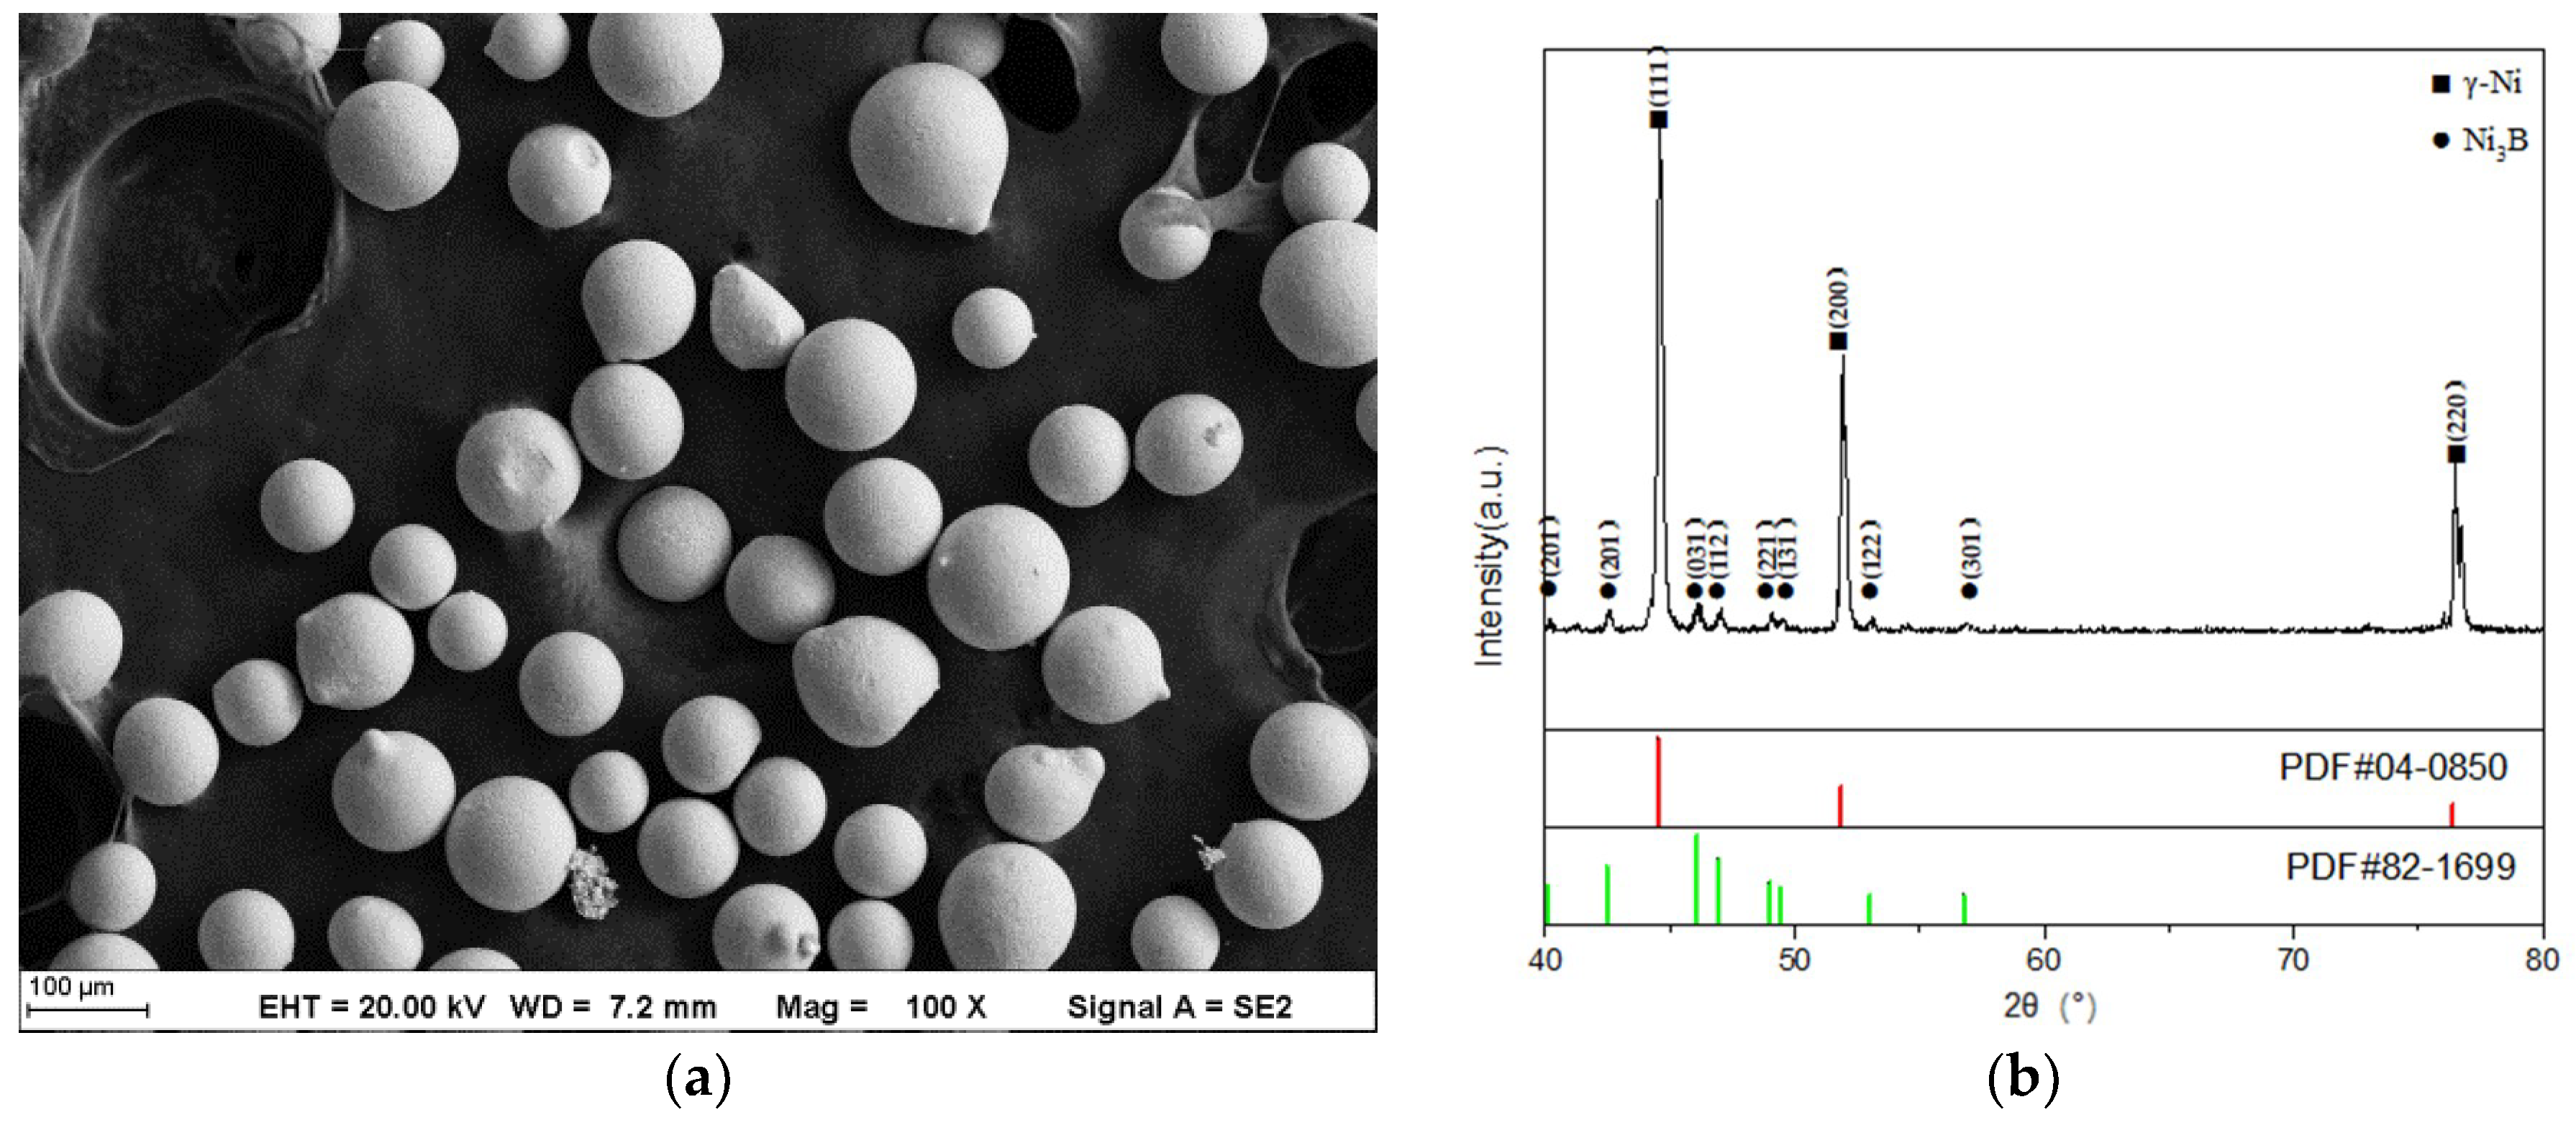
Figure 3a shows that the powder particles are regular spheres of 50–100 μm, which helps the smooth powder transfer during the deposition process.
Figure 3b (the XRD pattern of the powder) shows that the main phase of the powder is γ-Ni.
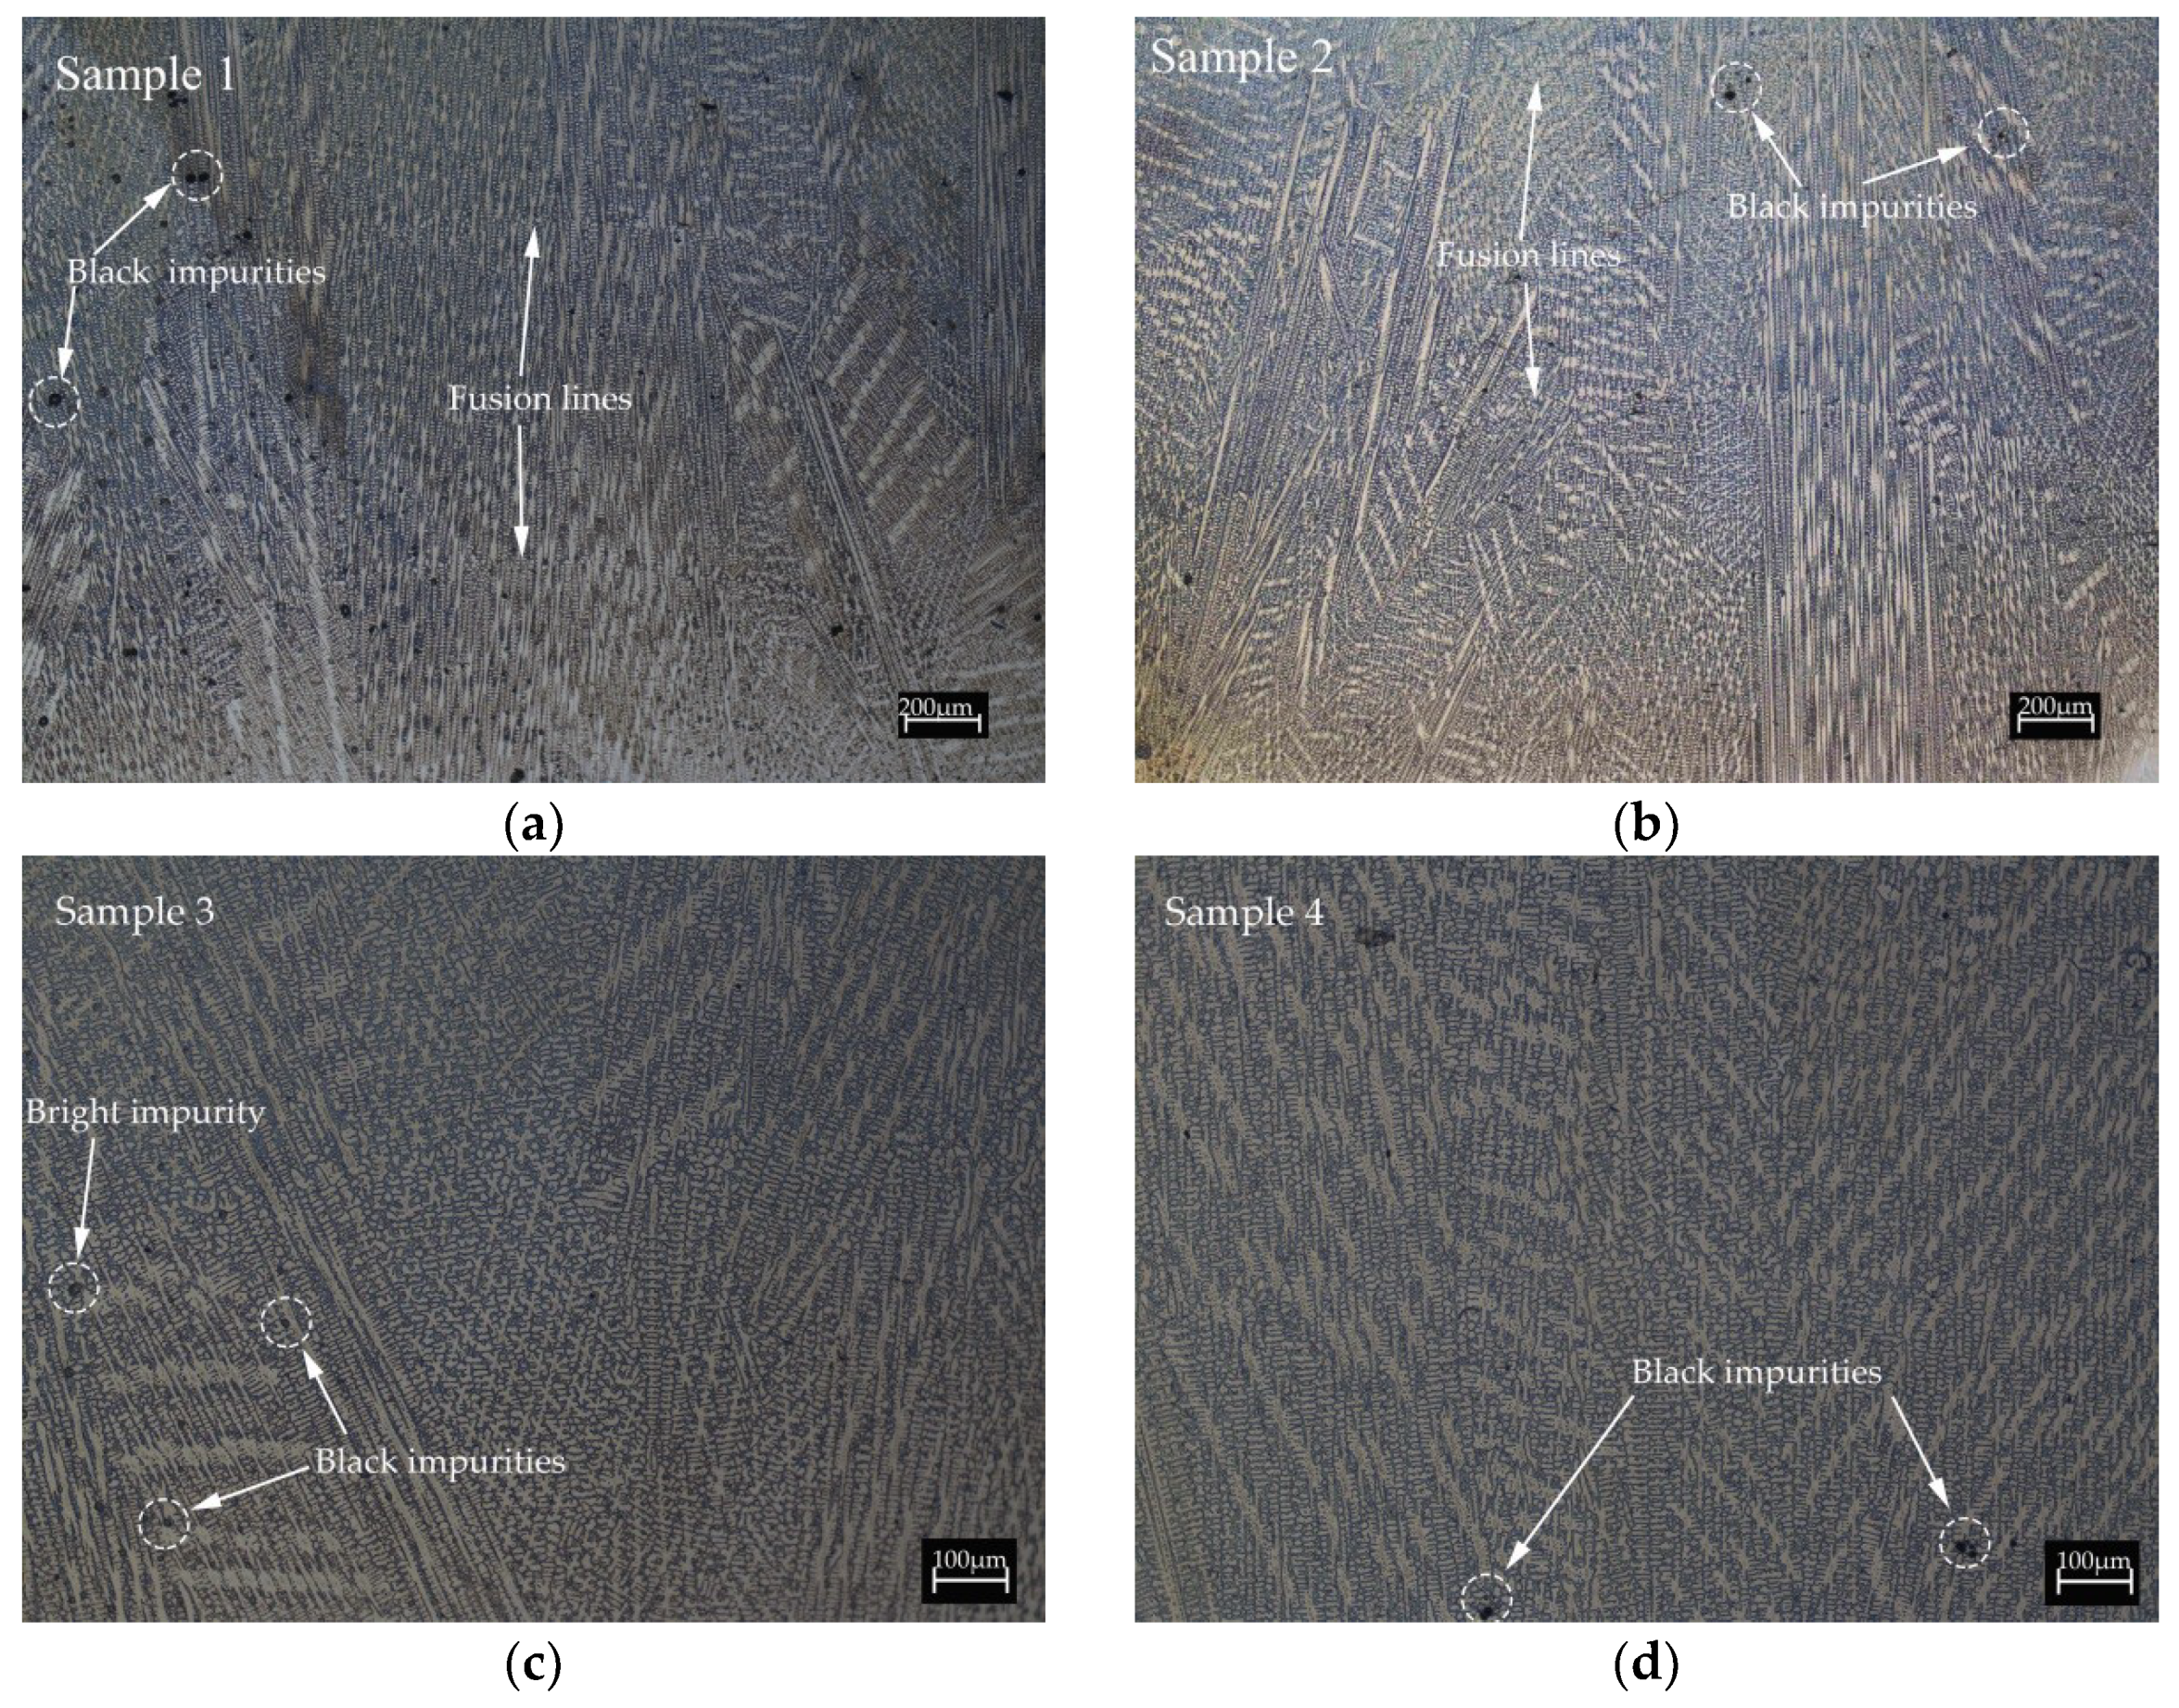
Figure 2 shows a schematic overview image of the cladding. There are no pores or cracks in the coating. Planar growth at the interface between the coating/substrate indicates good metallurgical bonding. The micromorphologies of the six specimens in
Table 3 are shown in
Figure 4. Their corresponding areas are in the middle of the samples (Area P in
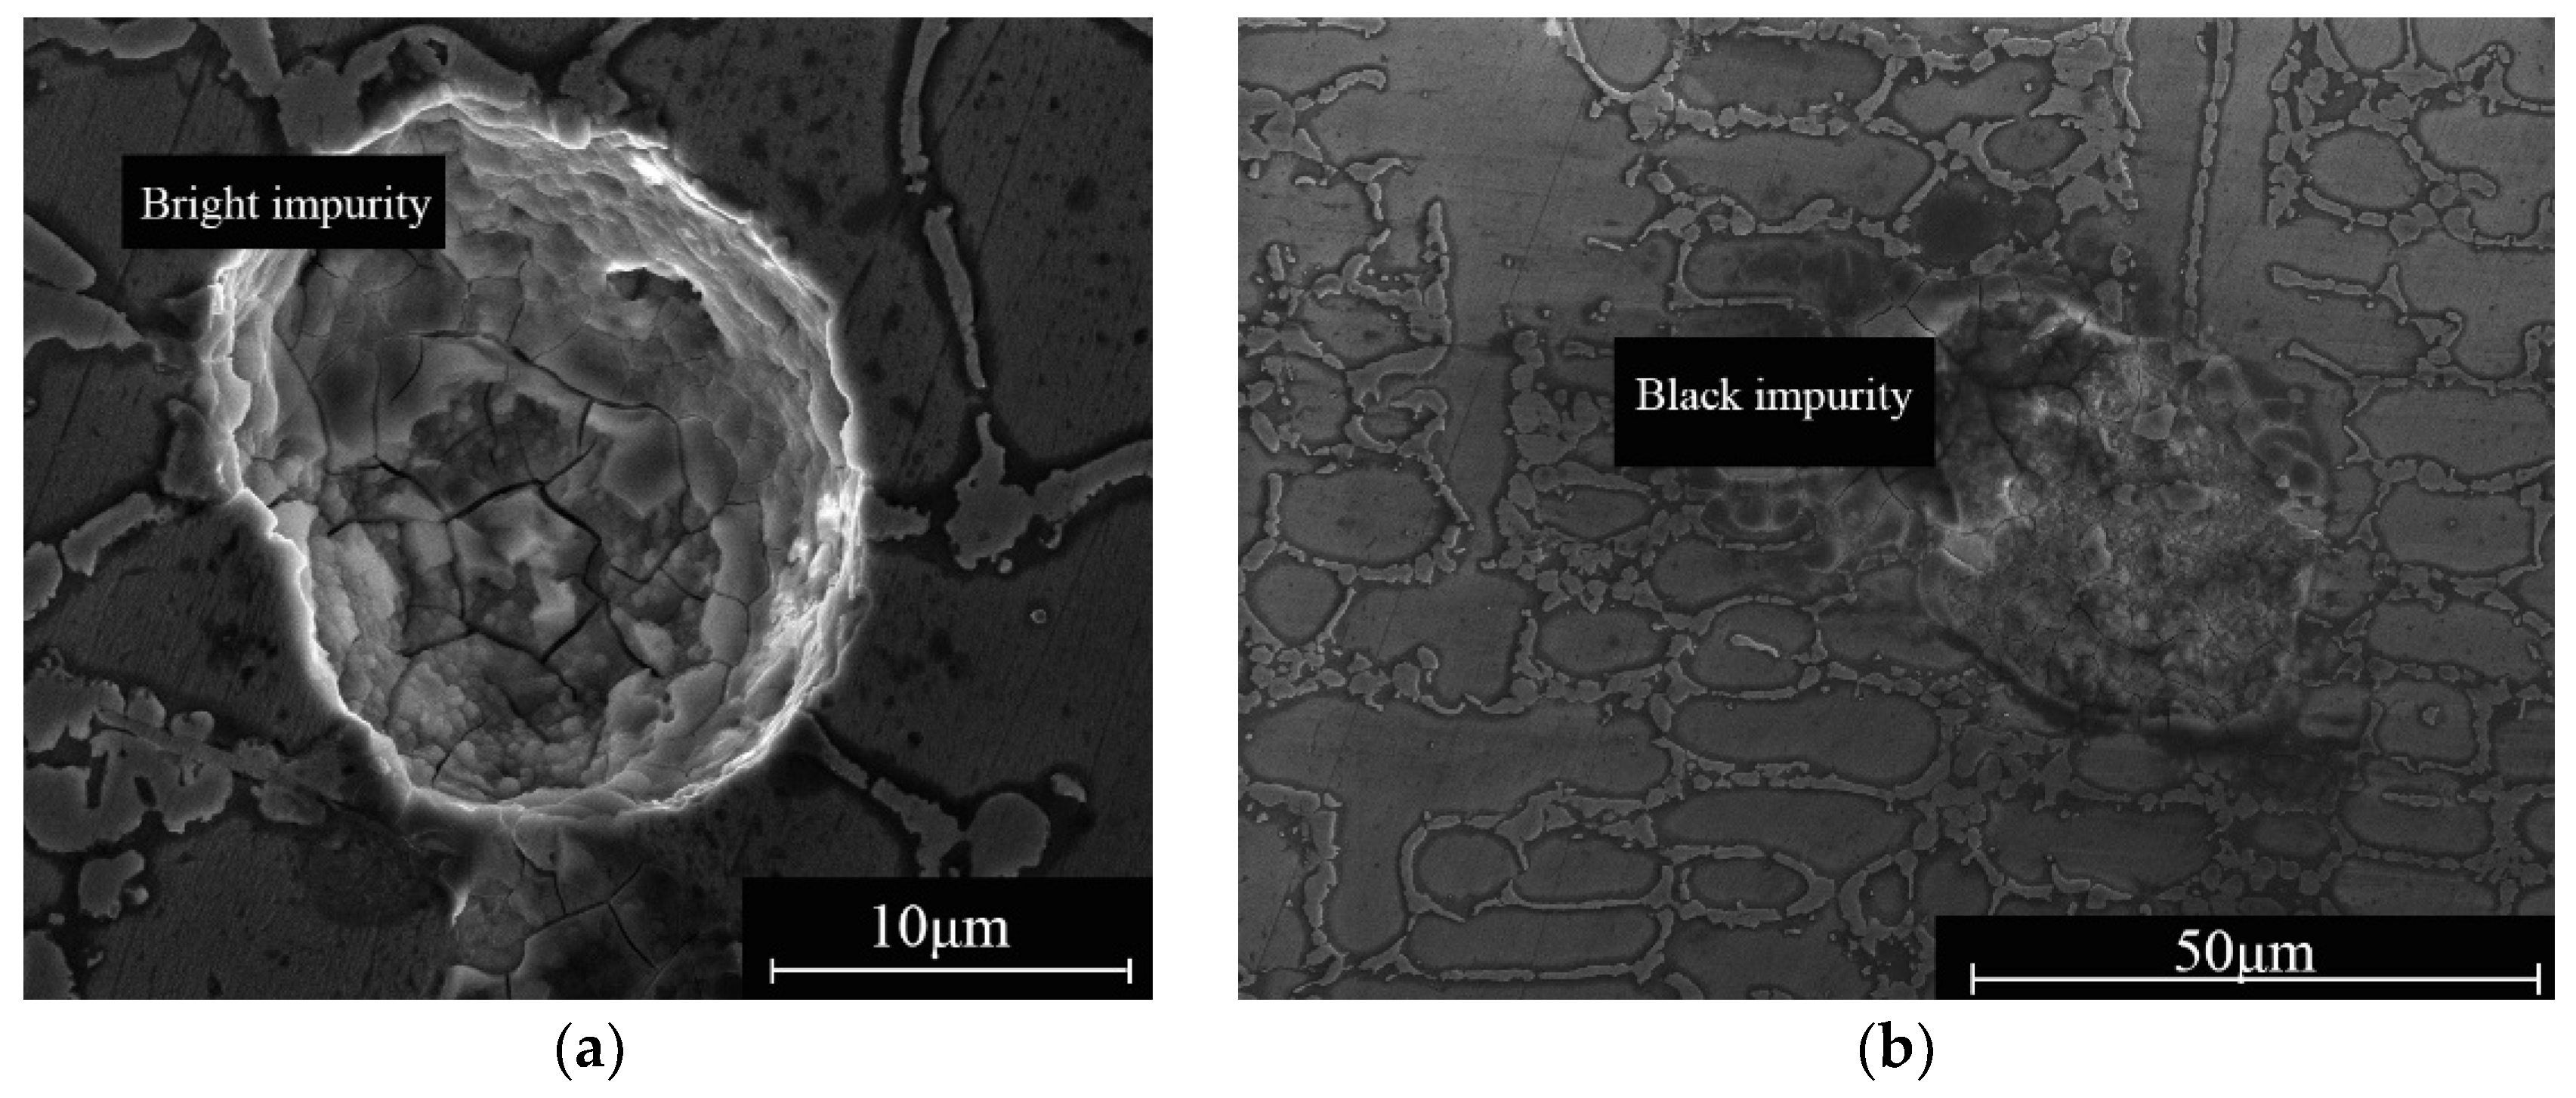
Figure 2). There are some bright and black impurities in coatings, as shown in
Figure 4 and
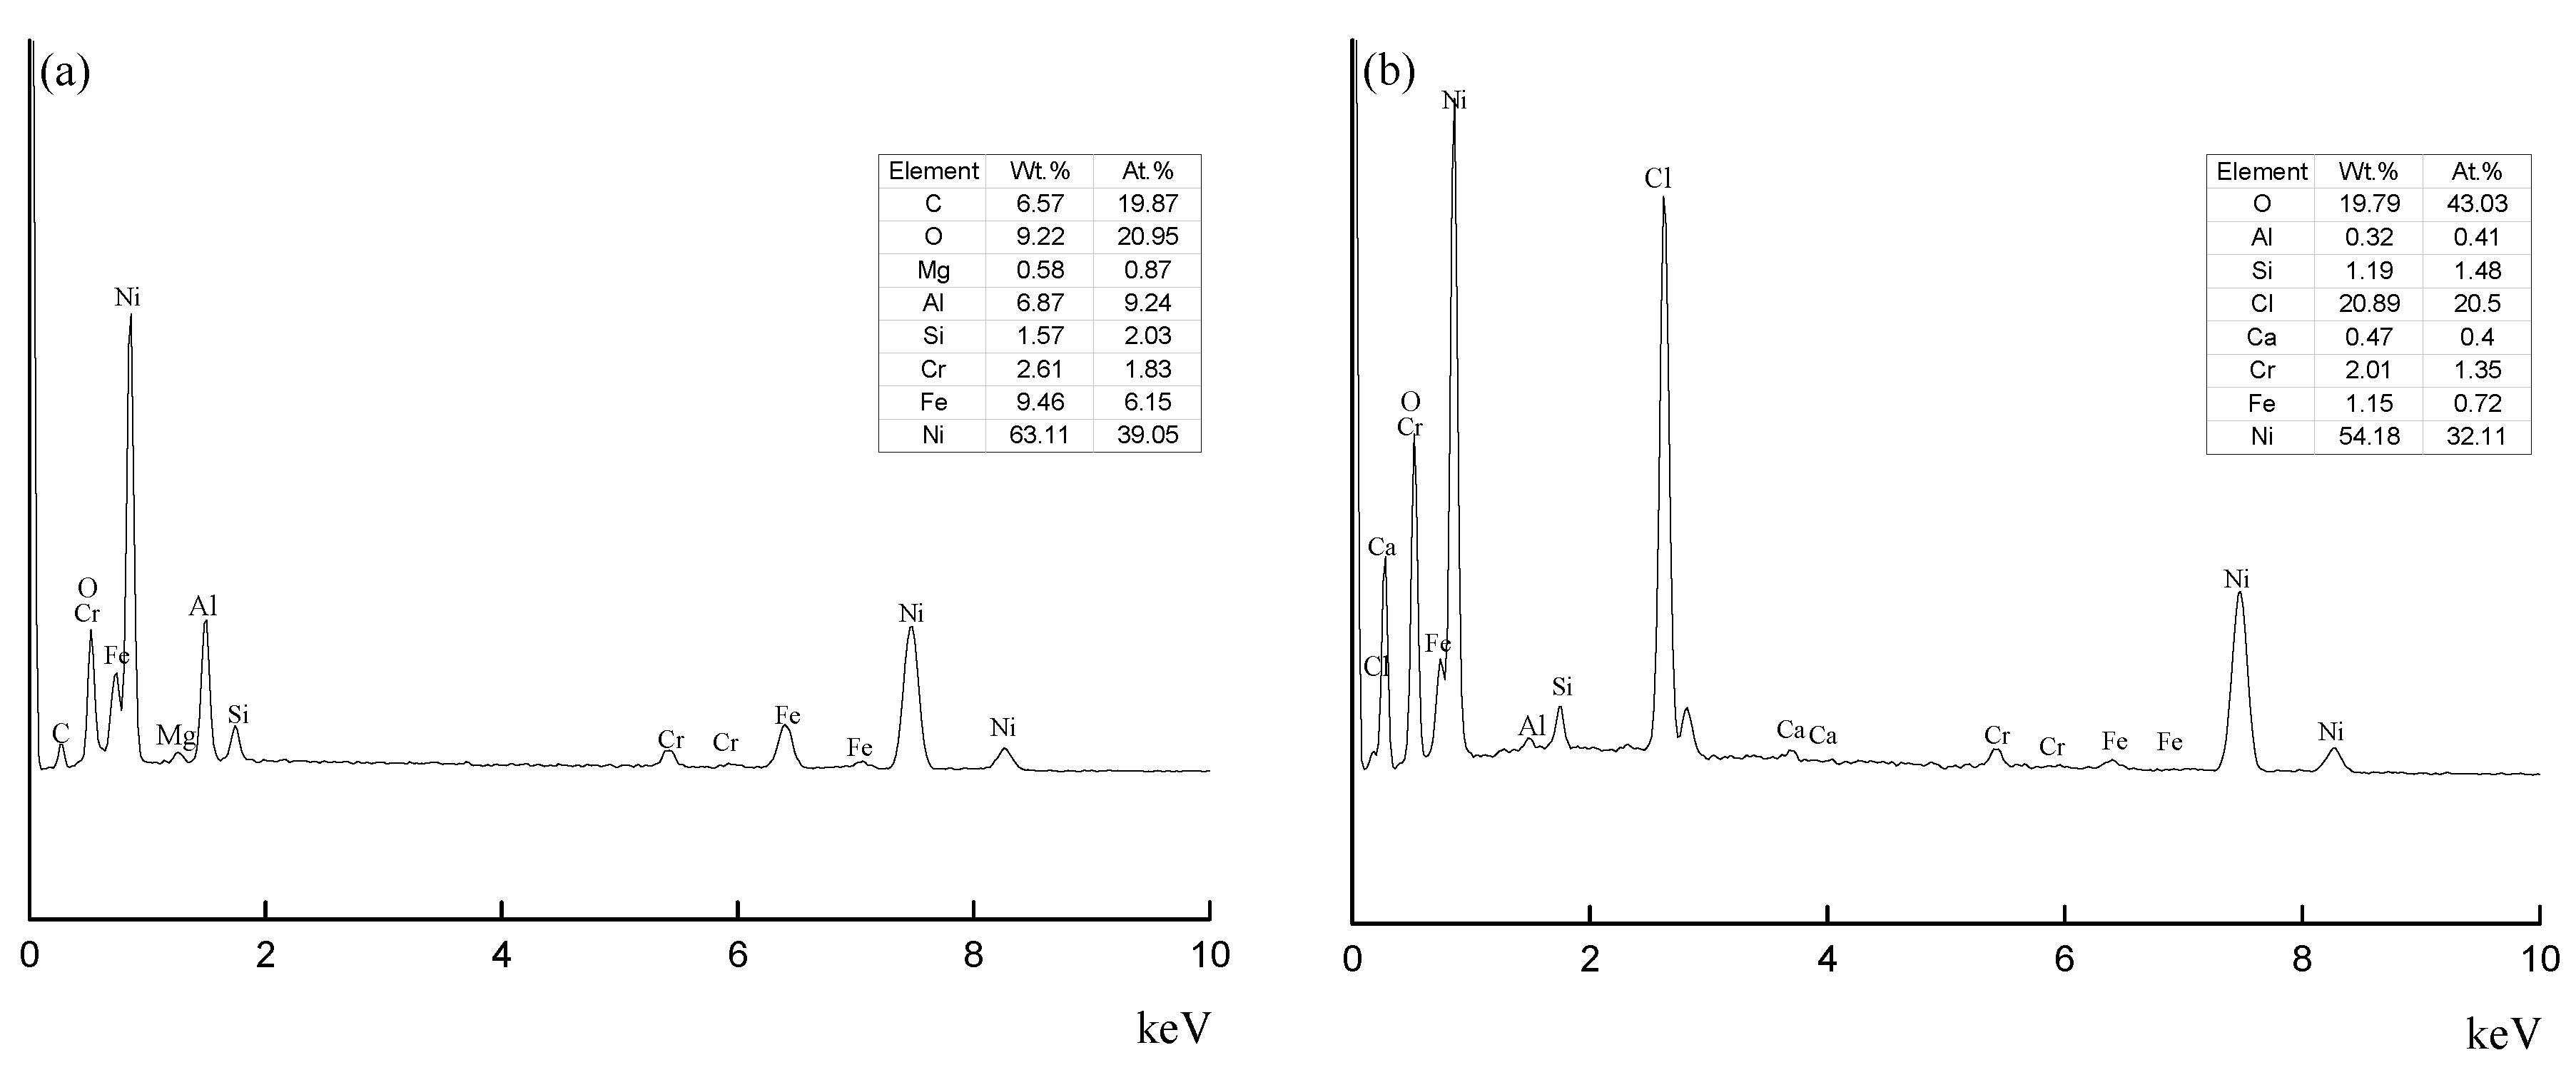
Figure 5. Compared to the non-interlayer cooling specimens, the interlayer cooling specimens have less impurities. Through SEM and EDS results (
Figure 6), the contents of Fe and Al in the bright impurities are 6.8% and 9.4%, respectively, which are higher than the normal values. Meanwhile, the contents of O and Cl are more than 20% in the black impurities. This may be due to the reaction between the black impurities and HCl during sample preparation. Hence, the bright impurities in
Figure 4c may be the intermetallic compounds of Al, and the black impurities in
Figure 4a may be oxides.
During the deposition process, the pre-deposited layer acts as a substrate. At the bottom of the molten pool, the low-melting eutectic compounds in the interdendritic region were remelted; then, they diffused into the molten pool and diluted the composition of the interdendritic liquid [
14]. After that, the interdendritic liquid was restored to a composition suitable for dendritic growth. As a result, the un-remelted dendrite arms grew slightly larger than the dendrites in the surrounding area, which produced metallographical details of the fusion lines in the optical micrograph, as shown in
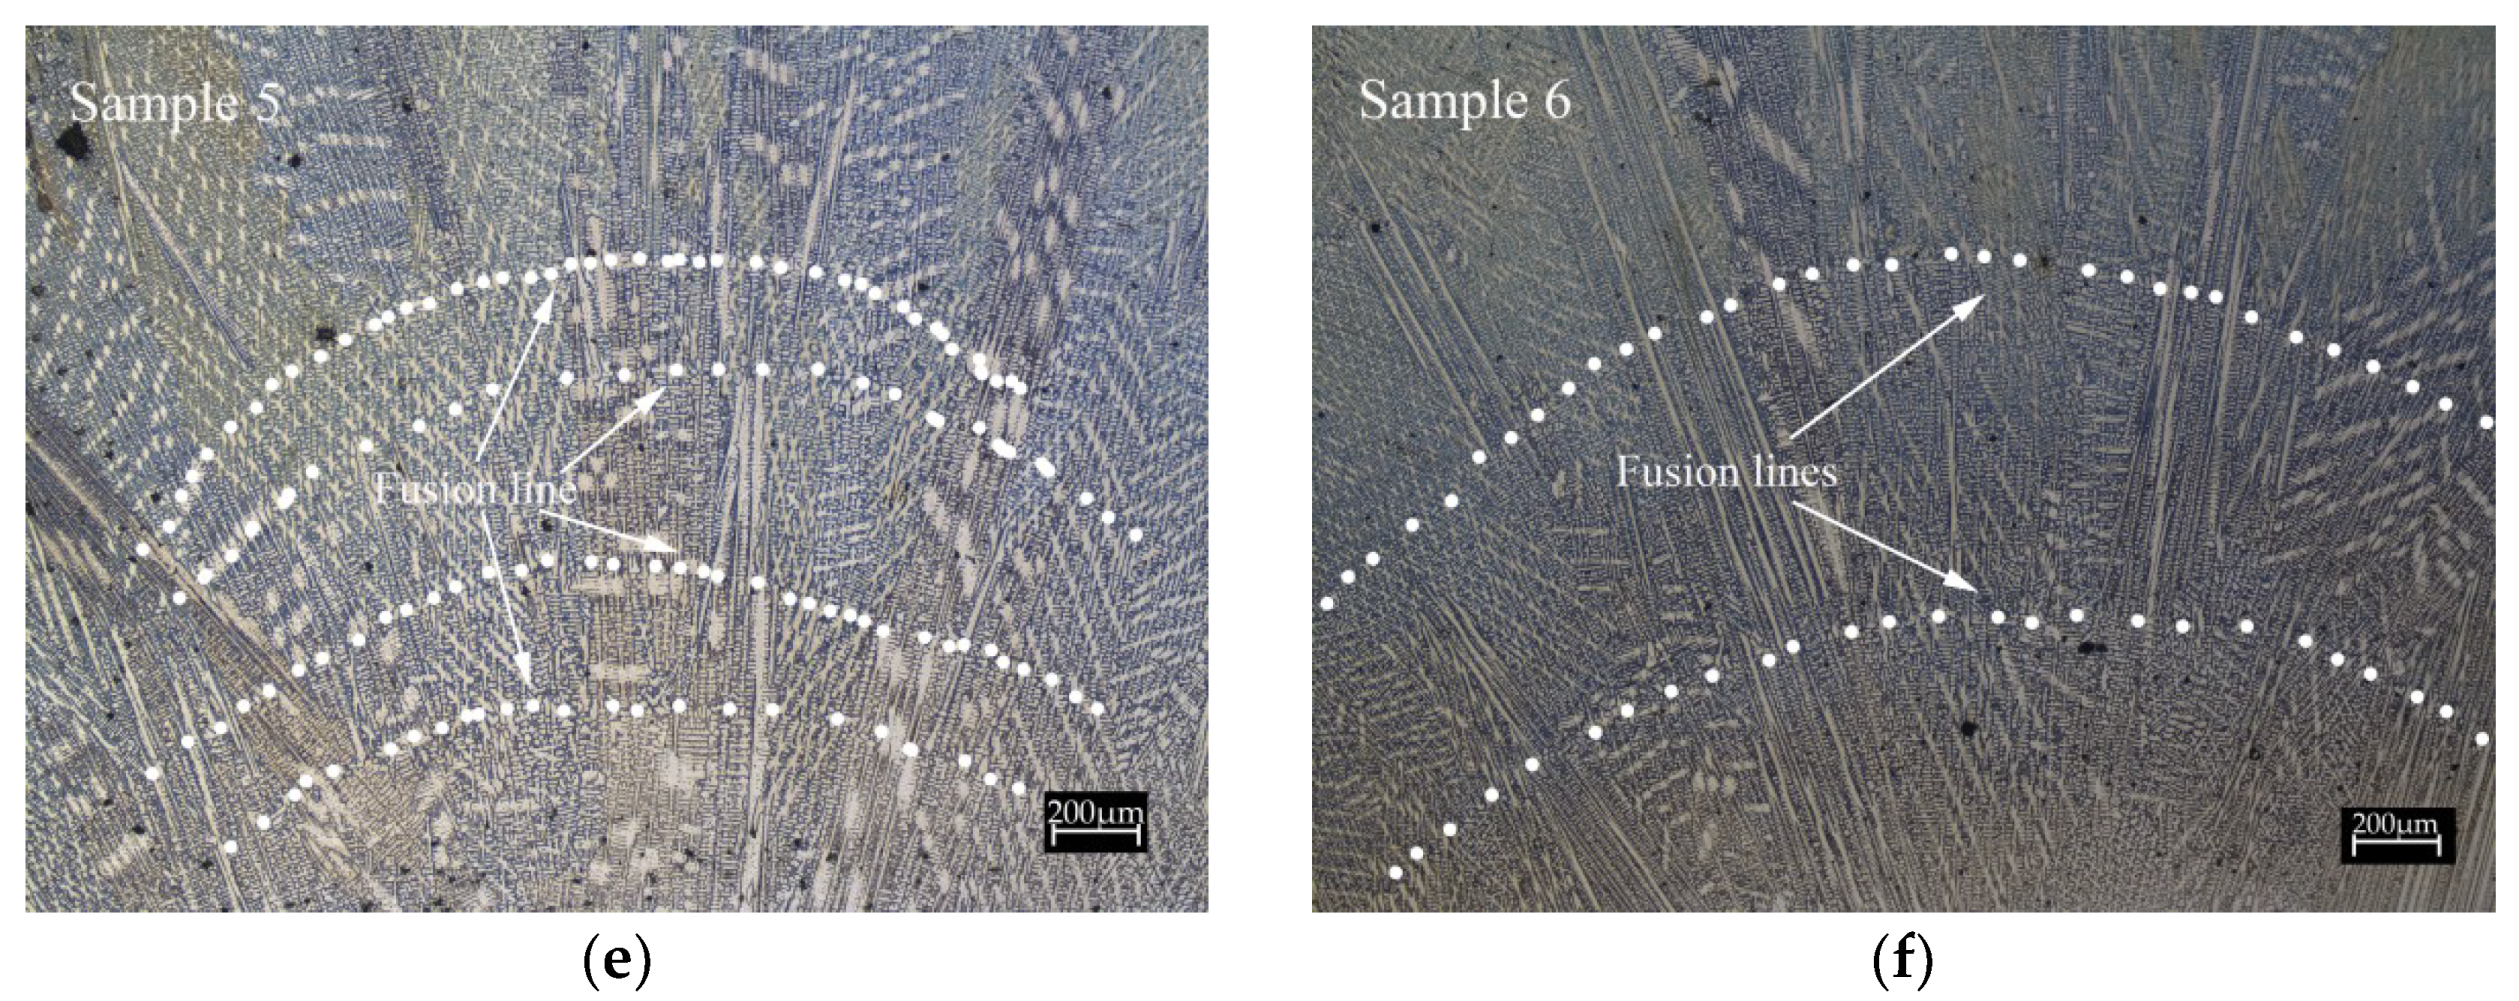
Figure 4a,b. The fusion of each layer in Sample 5 and Sample 6 is highlighted by the white dashed lines in
Figure 4e,f, respectively.
Figure 7 shows a further enlarged detail of the fusion lines, which clearly shows the fusion lines produced by remelting. Due to the high energy input of laser, according to the metallographic diagram, part of the pre-deposited layer was remelted into the lower layer during the deposition of each layer. Therefore, the size of the molten pool is increased.
Compared with the interlayer cooling specimens, non-interlayer cooling deposition was preheated excessively due to heat storage effect, which caused the temperature of the molten pool to rise. Thus, the control of the dilution rate and the dimensional tolerance of the non-interlayer cooling deposition become harder [
6,
15,
16]. Moreover, excessive preheating makes each layer of the non-interlayer cooling specimen thinner and the final layer thicker. As shown in
Table 3, with the same process parameters, the thickness of the layers without cooling is slightly smaller than that with cooling. This is because the poor thermal conductivity of nickel causes heat buildup in the layer, which increases the diameter of the molten pool. The higher the temperature of the pre-deposited layer, the larger the molten pool will be. The larger size of the molten pool will form a cladding layer with a smaller thickness and a larger width. By comparing the specimens with and without interlayer cooling, the interlayer cooling specimens have a greater penetration depth but a smaller dilution rate. Sample 1 and Sample 2 were not considered because their penetration depths were too small to be representative. In order to ensure the high performance of the cladding layer, it is generally considered that the dilution rate should be less than 10%, preferably about 5% [
17]. Furthermore, the direction of dendrite growth in the non-interlayer cooling specimens is more chaotic. This is due to the preheating of the substrate, which makes it difficult to dissipate heat, thereby making the dendrites grow disorderly.
Figure 8 shows high magnification micrographs of Sample 5 and Sample 6. Due to the high cooling rate, the typical rapid directional solidified structures composed of dendritic and interdendritic regions are shown. In contrast, the number of primary dendrites and secondary dendrites in the cladding specimens with interlayer cooling was significantly higher than that in the specimen without cooling. The smaller the number of dendrites per unit area, the greater the distance between the dendrites. According to the solidification theory, the dendrite spacing depends on the heat dissipation condition at the solidification interface. The stronger the heat dissipation ability, the smaller the influence range of the latent heat of the crystals precipitated from each branch, and the smaller the dendrite spacing. When directional solidification occurs, the cooling rate is determined by the heat dissipation capacity at the solid–liquid interface. The greater the cooling rate, the stronger the heat dissipation capability at the solid–liquid interface. Therefore, a high solidification rate often leads to fine dendrite arrangement. Interlayer cooling facilitates heat dissipation during deposition and provides faster cooling rates. Some studies have shown that at higher cooling rates, dendrite coarsening is inhibited, dendrite spacing decreases, nucleation rate increases, and the grain refinement and interfacial base increase [
18,
19], which prevent dislocation movement, balance plastic deformation, and increase the strength of the coating [
20,
21,
22].
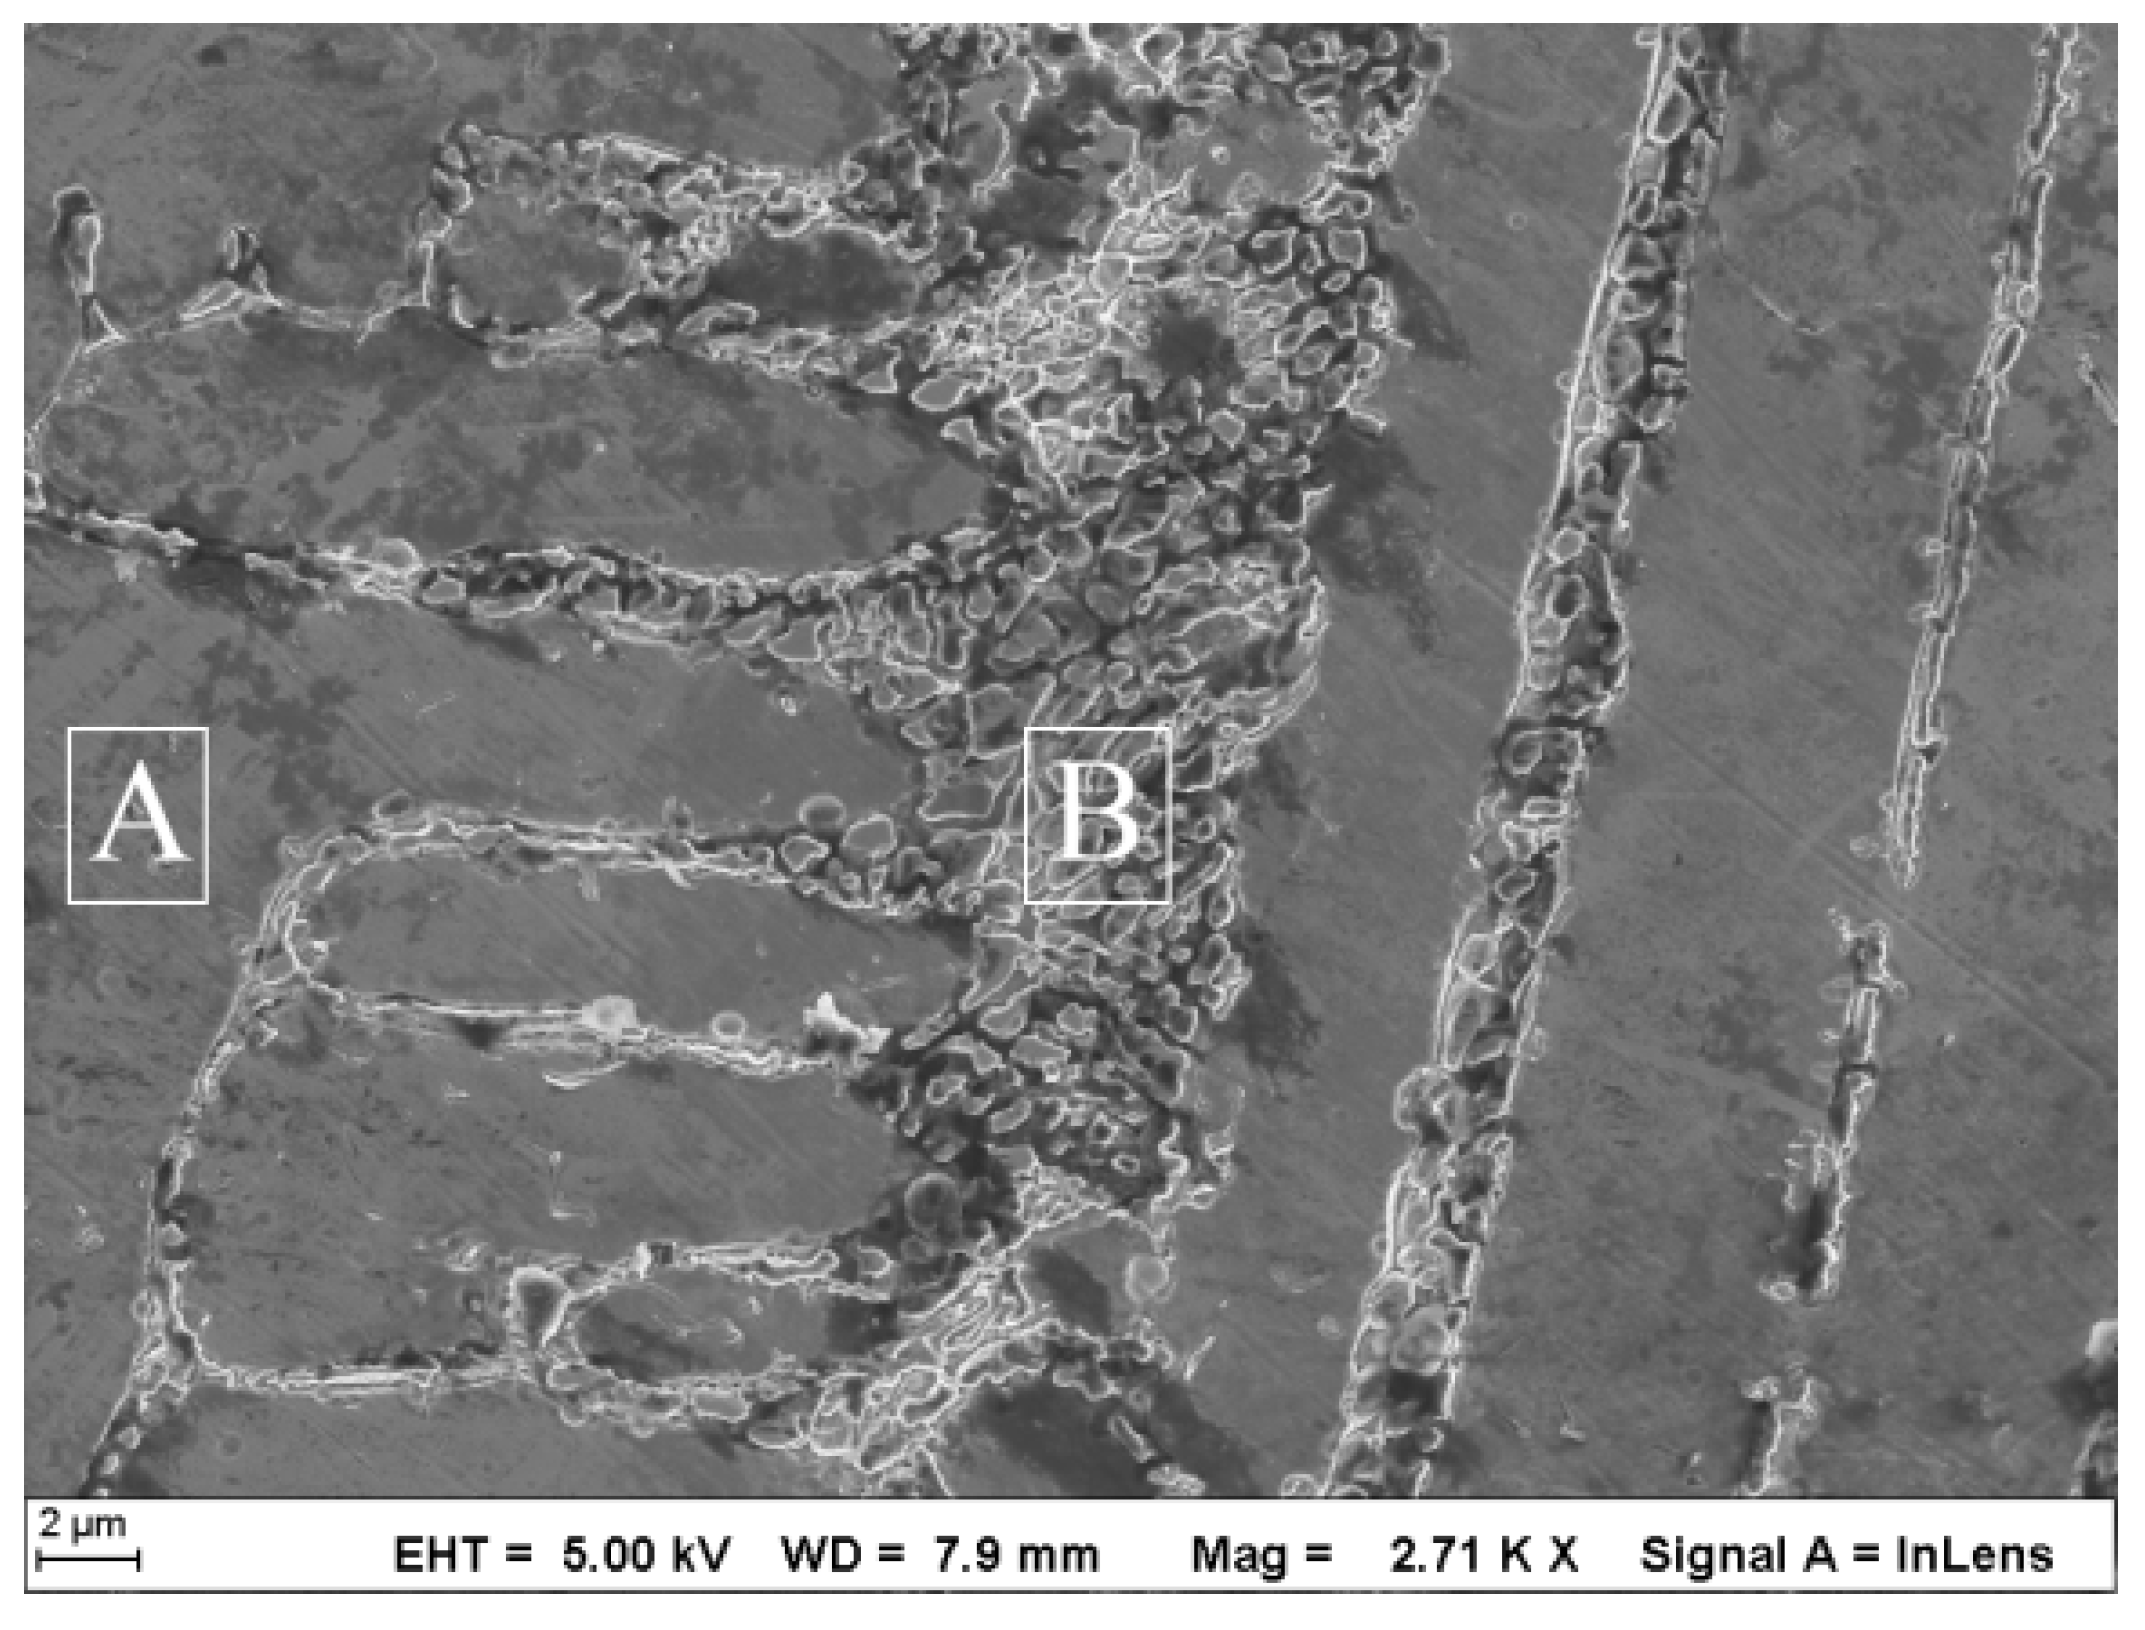
Since the constituent phases cannot be identified by optical microscopy, further SEM and EDS analyses were performed on the cladding layers.
Figure 9 is a representative SEM image of Sample 5. Typical dendritic structures, including dendritic and interdendritic regions, can be clearly seen in the figure. Combine with the EDS results in
Figure 10, it is judged that area A is the γ phase and area B is the γ’ phase.
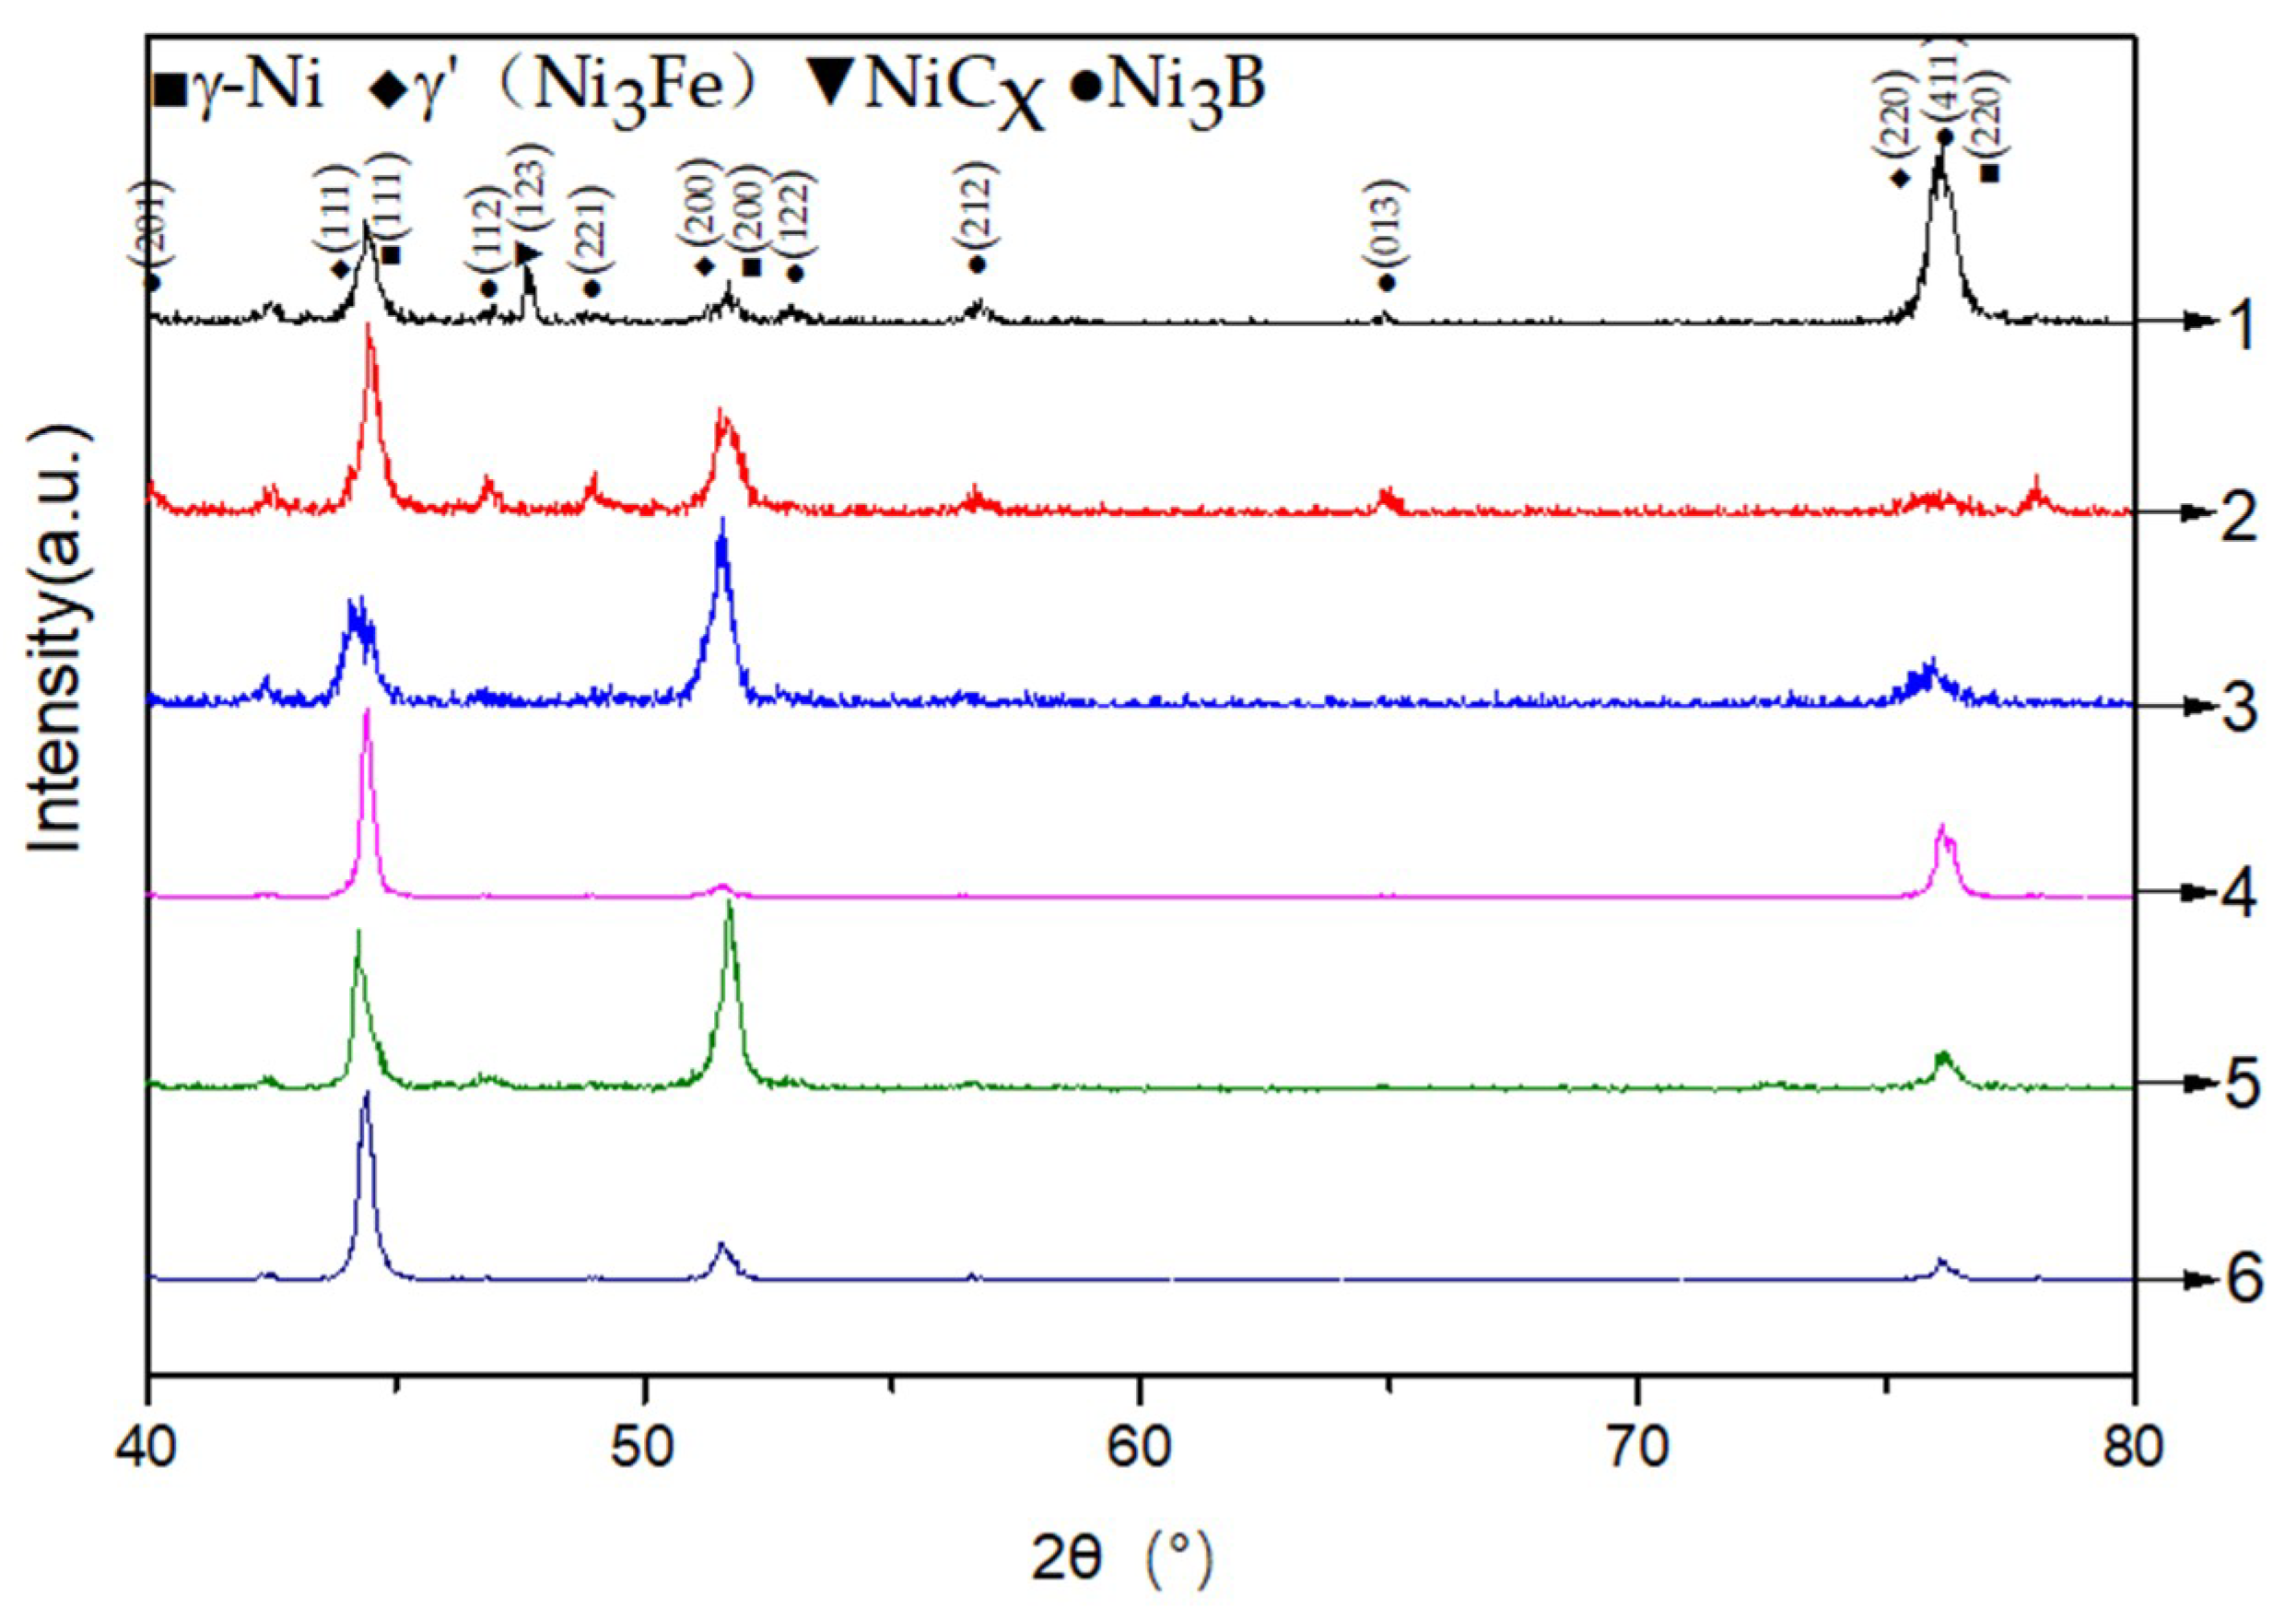
To further determine the composition, six sets of specimens were analyzed by XRD, as shown in
Figure 11. Sharp and broad peaks were observed, which corresponded to the γ and γ’ phase of the Ni-base solid solution. Ni
3B phase and some other compounds of Ni were observed in Samples 1 and 2. Combined with the XRD pattern of the powder (
Figure 3b), it may be due to insufficient laser power, resulting in more Ni3B residue powder in the coatings. At the same time, NiC
x was created. From the XRD results, no significant intermetallic oxides were observed due to the low volume fraction.
The grain sizes of in
Figure 11 were calculated by Scheler’s formula. The grain sizes of samples 1–6 are 33.2, 28.7, 56.7, 36.9, more than 100 and 39.5 nm, respectively. By comparing Samples 1, 3, and 5 or Samples 2, 4, and 6, we can find that the grain sizes of the sample increase with the increase of laser power. This is due to the temperature of molten pool increasing with the increase of laser power. However, there is no obvious difference in the increase of grain sizes of the samples with interlayer cooling, only from 28.7 increase to 39.5 nm, while the grain sizes of non-interlayer cooling change greatly, from 33.2 to more than 100 nm.
Furthermore, by comparing Sample 1 and 2, there is no significant difference between the grain sizes of them, which shows that the effect of interlayer cooling on the grain size is small at the laser power of 1.6 kW. Nevertheless, with the increase of laser power, the difference of grain size becomes more and more significant. Especially when the laser power is 2.5 kW, the grain size of the samples without interlayer cooling is more than twice that of the samples with interlayer cooling. This shows that the effect of interlayer cooling will be improved with the increase of laser power.
The microhardness distribution from the top of the coatings to the substrate are shown in
Figure 11. It indicates that the average microhardness of the cladding layer increases from 263 ± 8.5 HV
0.5 to 335 ± 6.9 HV
0.5. Under the same process parameters, the average microhardness of the specimens with and without interlayer cooling does not change significantly near the surface of the substrate due to the interaction between the cladding layer and the substrate. In
Figure 12a, there is no significant difference in microhardness between Samples 1 and 2, especially near the surface of the substrate. This is due to the lower laser power and insufficient thermal input. As a result, the remelting area of the pre-deposited layer is less. In this area, the interlayer cooling effect is not significant, and the lower the power, the larger the area. As the distance increases, the average microhardness of the specimens with interlayer cooling begins to be higher than that of the specimen without interlayer cooling. By comparing the microhardness of the two samples in
Figure 12a–c, we can find that the microhardness difference is more and more significant with the increase of laser power. The microhardness of the same thickness exceeds 3–4% in
Figure 12b, while that exceeds 6–8% in
Figure 12c. This is due to the poor thermal conductivity of Ni-based metals. As deposits accumulate, the heat dissipation effect decreases gradually, resulting in heat accumulation and relative preheating of the substrate. The better heat dissipation makes the grain size of the interlayer cooling specimens relatively fine and uniform and increases the total area of the grain boundaries, thereby preventing dislocation movement, balancing plastic deformation, and improving the strength of the coating. When the laser power is low (
Figure 12a), the influence is insignificant. With the increase of laser power, there is a significant difference between the two grain sizes, leading to a significant difference between the two conditions. This shows that with the increase of laser power, the effect of interlayer cooling will become more and more significant.

 ,
, 


