Article

Nanoscale Correlations of Ice Adhesion Strength and Water Contact Angle

1
NTNU Nanomechanical Lab, Department of Structural Engineering, Norwegian University of Science and Technology (NTNU), Richard Birkelandsvei 1A, NO-7491 Trondheim, Norway
2
Justervesenet—Norwegian Metrology Service, Fetveien 99, 2007 Kjeller, Norway
*
Author to whom correspondence should be addressed.
Coatings 2020, 10(4), 379; https://doi.org/10.3390/coatings10040379
Submission received: 16 March 2020 / Revised: 4 April 2020 / Accepted: 5 April 2020 / Published: 12 April 2020
(This article belongs to the Special Issue Low Ice Adhesion Coatings)

Abstract

:
Surfaces with low ice adhesion represent a promising strategy to achieve passive anti-icing performance. However, as a successful and robust low ice adhesion surface must be tested under realistic conditions at low temperatures and for several types of ice, the initial screening of potential low ice adhesion surfaces requires large resources. A theoretical relation between ice adhesion and water wettability in the form of water contact angle exists, but there is disagreement on whether this relation holds for experiments. In this study, we utilised molecular dynamics simulations to examine the fundamental relations between ice adhesion and water contact angle on an ideal graphene surface. The results show a significant correlation according to the theoretic predictions, indicating that the theoretical relation holds for the ice and water when discarding surface material deformations and other experimental factors. The reproduction of the thermodynamic theory at the nanoscale is important due to the gap between experimental observations and theoretical models. The results in this study represent a step forward towards understanding the fundamental mechanisms of water–solid and ice–solid interactions, and the relationship between them.

1. Introduction

Unwanted icing and ice accretion are potentially hazardous and can impact daily life [1]. Dangerous situations occur for instance within wind energy, aircrafts, power lines, and industries in Arctic environments [2]. Passive anti-icing surfaces where the accreted ice is automatically removed is a possible solution [3]. There are three main pathways to such passive anti-icing, or icephobic surfaces: (1) the removal of water before it is allowed to freeze; (2) the delay of ice nucleation; and (3) the lowering of ice adhesion so that formed ice does not stick to the surface [1,3,4,5,6]. Due to the nature of icing, and that it is impossible to fully avoid icing, the lowering of ice adhesion strength is considered as the most promising strategy for anti-icing surfaces [7,8,9,10].
The development of low ice adhesion surfaces has been in focus for several years. The aim for these surfaces are to reach ice adhesion strength below 20 kPa [9,11], which is considered as the limit to remove accreted ice naturally by wind or gravity due to its own weight. Surfaces with ice adhesion strength below 10 kPa are often denoted as super-low, or ultra-low, ice adhesion surfaces (SLIAS) [6]. In the past years, examples of surfaces reaching below 1 kPa have also been reported [12,13,14]. However, the field of low ice adhesion materials research has been known to operate by continuum theory or a trial-and-error strategy, where the focus has been on developing new surfaces and coatings without fully understanding the underlying mechanisms [15,16,17]. One reason for this lack of understanding is the amount of resources required to properly test anti-icing surfaces in realistic conditions. It is important to use realistic ice samples and temperatures to test ice adhesion surfaces for a given application [16]. However, to test surfaces in cold rooms of temperatures below −20 °C, or the construction of realistic ice types for surface testing, which may need icing wind tunnels, require both energy and infrastructure. As a result, an ideal solution would be to screen a potential low ice adhesion surface with water at room temperature before testing the ice adhesion strength.
To facilitate the screening of potentially low ice adhesion surfaces, the possible relationships between room temperature characteristics related to surface wettability and ice adhesion strength of a given surface has been investigated [18]. Several studies showed a correlation between water contact angle and ice adhesion, both for the static contact angle [7,8,19,20] and for the receding contact angle [20,21,22,23,24,25,26], while other studies discard such correlations [18,27,28,29,30]. In short, the experimental results differ greatly, and there is little agreement on whether there exist experimental correlations between the ice adhesion and wettability of a surface.
In this study, the correlation between water contact angle and ice adhesion was investigated by utilising atomistic modelling and molecular dynamics simulations. By simulating the atomistic behaviour of water molecules on an ideal surface, it is possible to investigate the underlying physical mechanisms of water–solid and ice–solid interactions. By addressing the thermodynamic models governing water behaviour, which are not reproduced clearly through experiments, the hypothesis of this study is that the simulations will show a trend between the experimental results and the predictions made by pure theoretical relations. Surprisingly, the results show a behaviour very close to the theoretical model. This study thus indicates that the difference from the theoretical predictions stems from experimental factors, and not the inherent behaviour of the water or ice. The reproduction of the theoretic relation between wettability and ice adhesion at the nanoscale is important as it helps to bridge the understanding between experimental observations and theoretical models. Other measures of wettability should be similarly investigated to fully examine simulation results compared with the experimental studies on low ice adhesion surfaces. The application of atomistic simulations to investigate the underlying characteristics of materials provide new insights to the fundamental mechanisms of ice adhesion strength and ice detachment, extending the experimental limits of resolution.

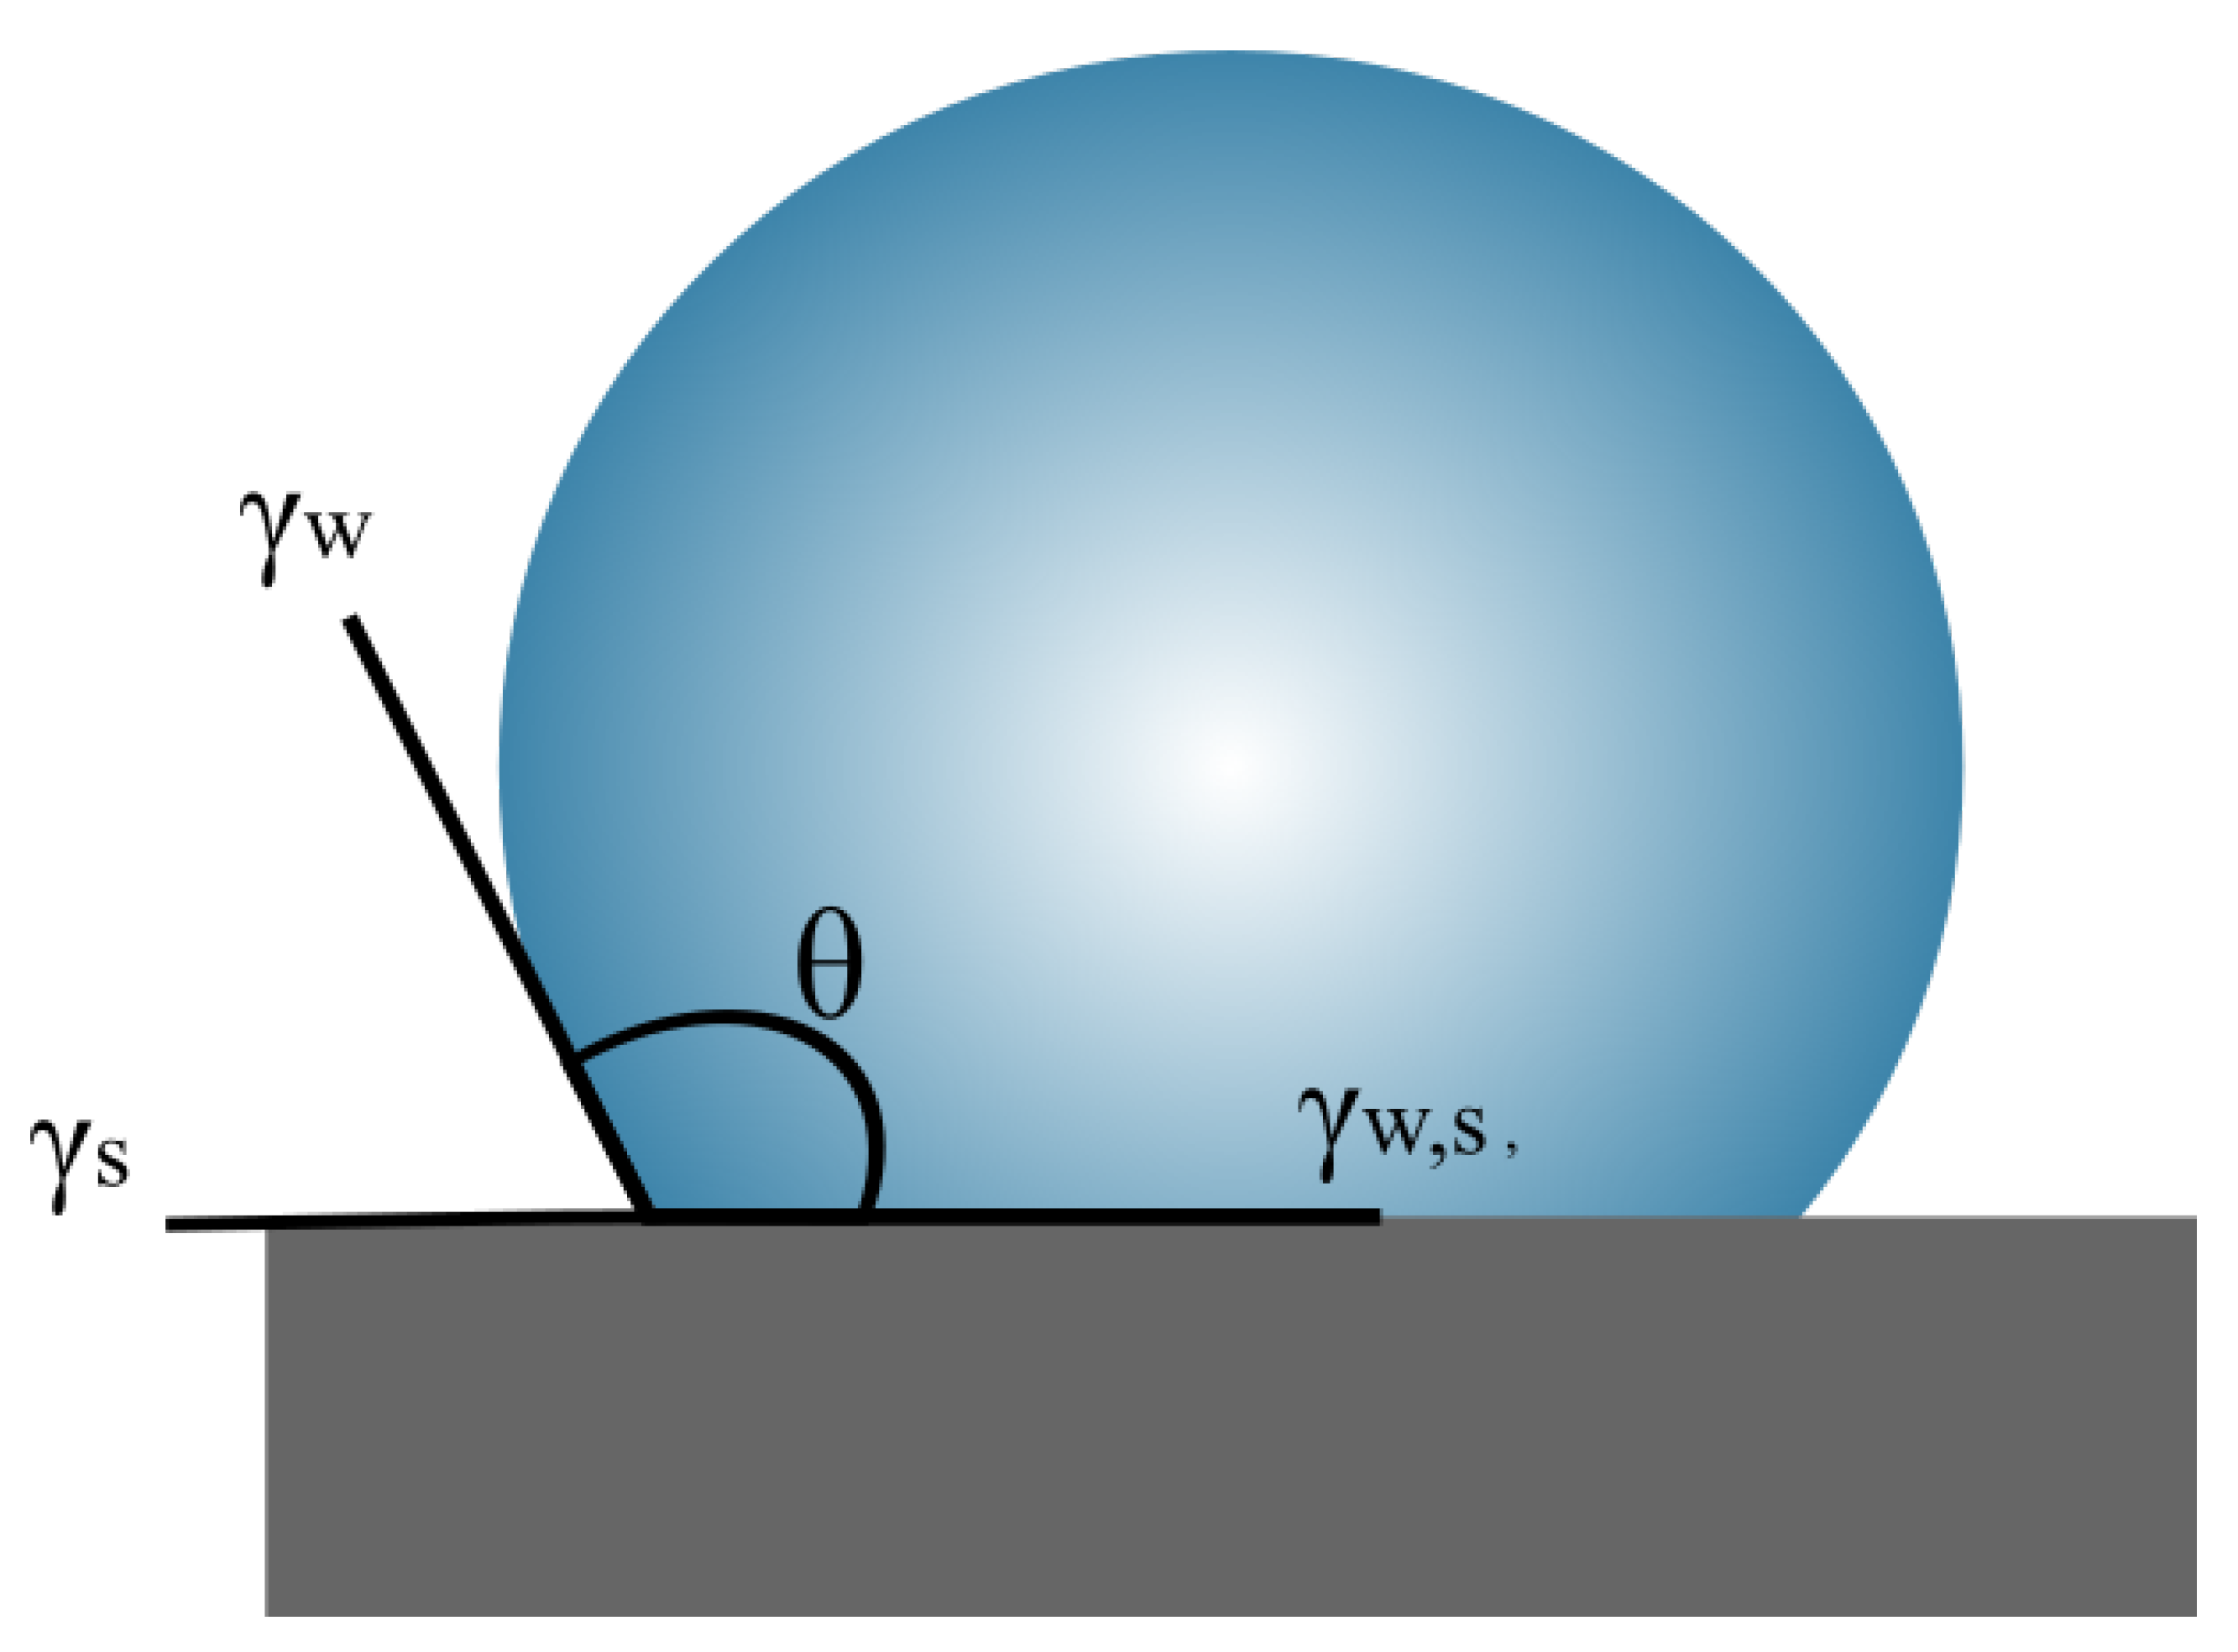
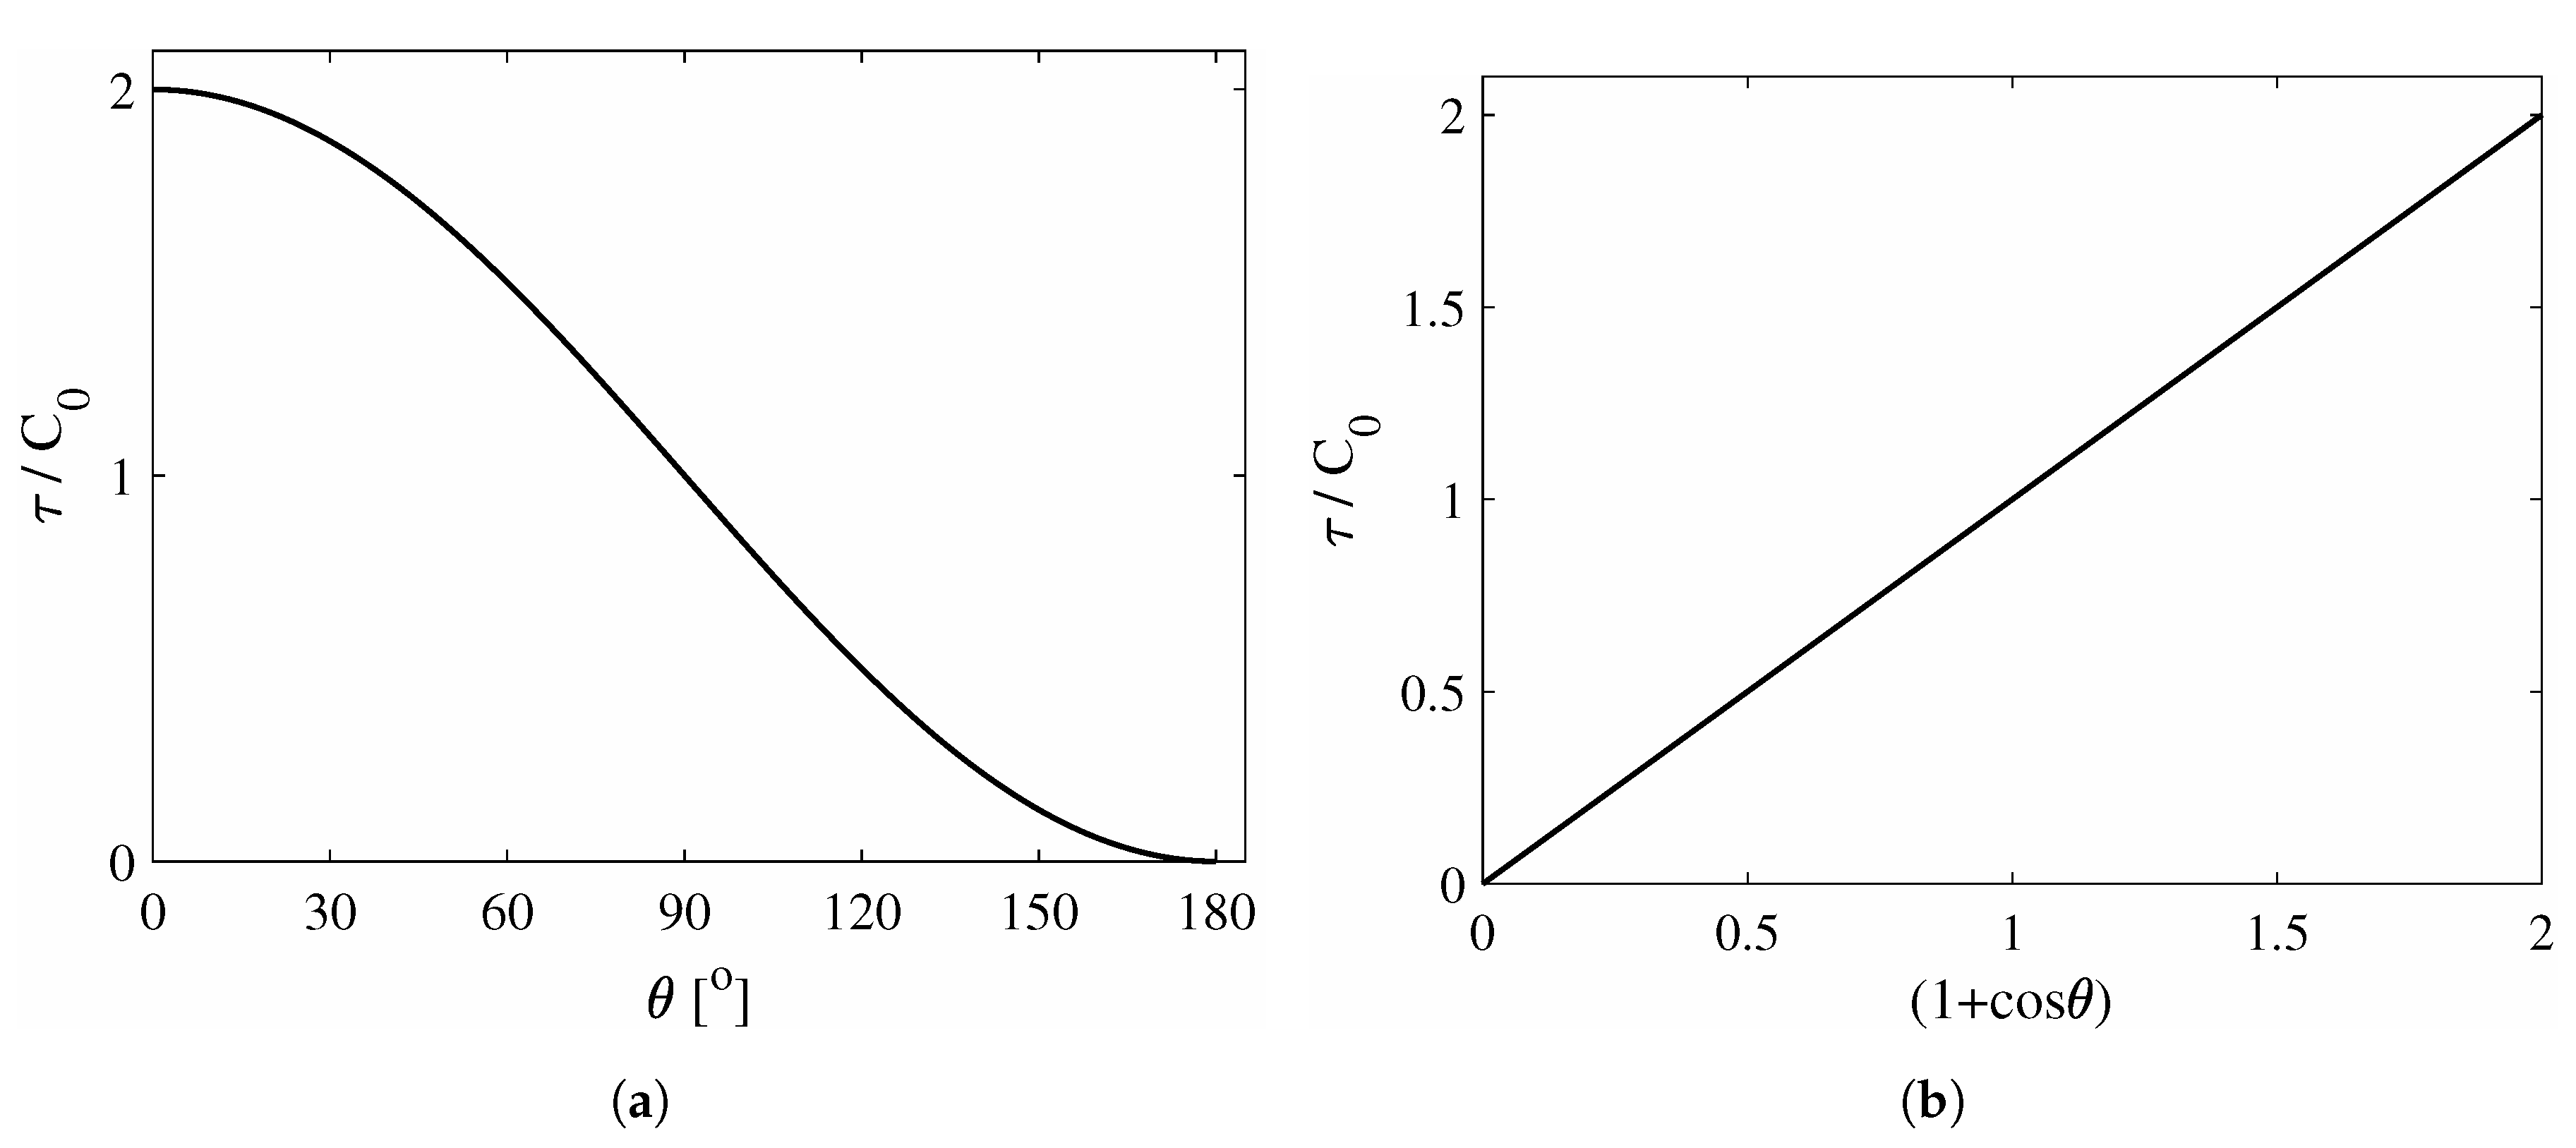
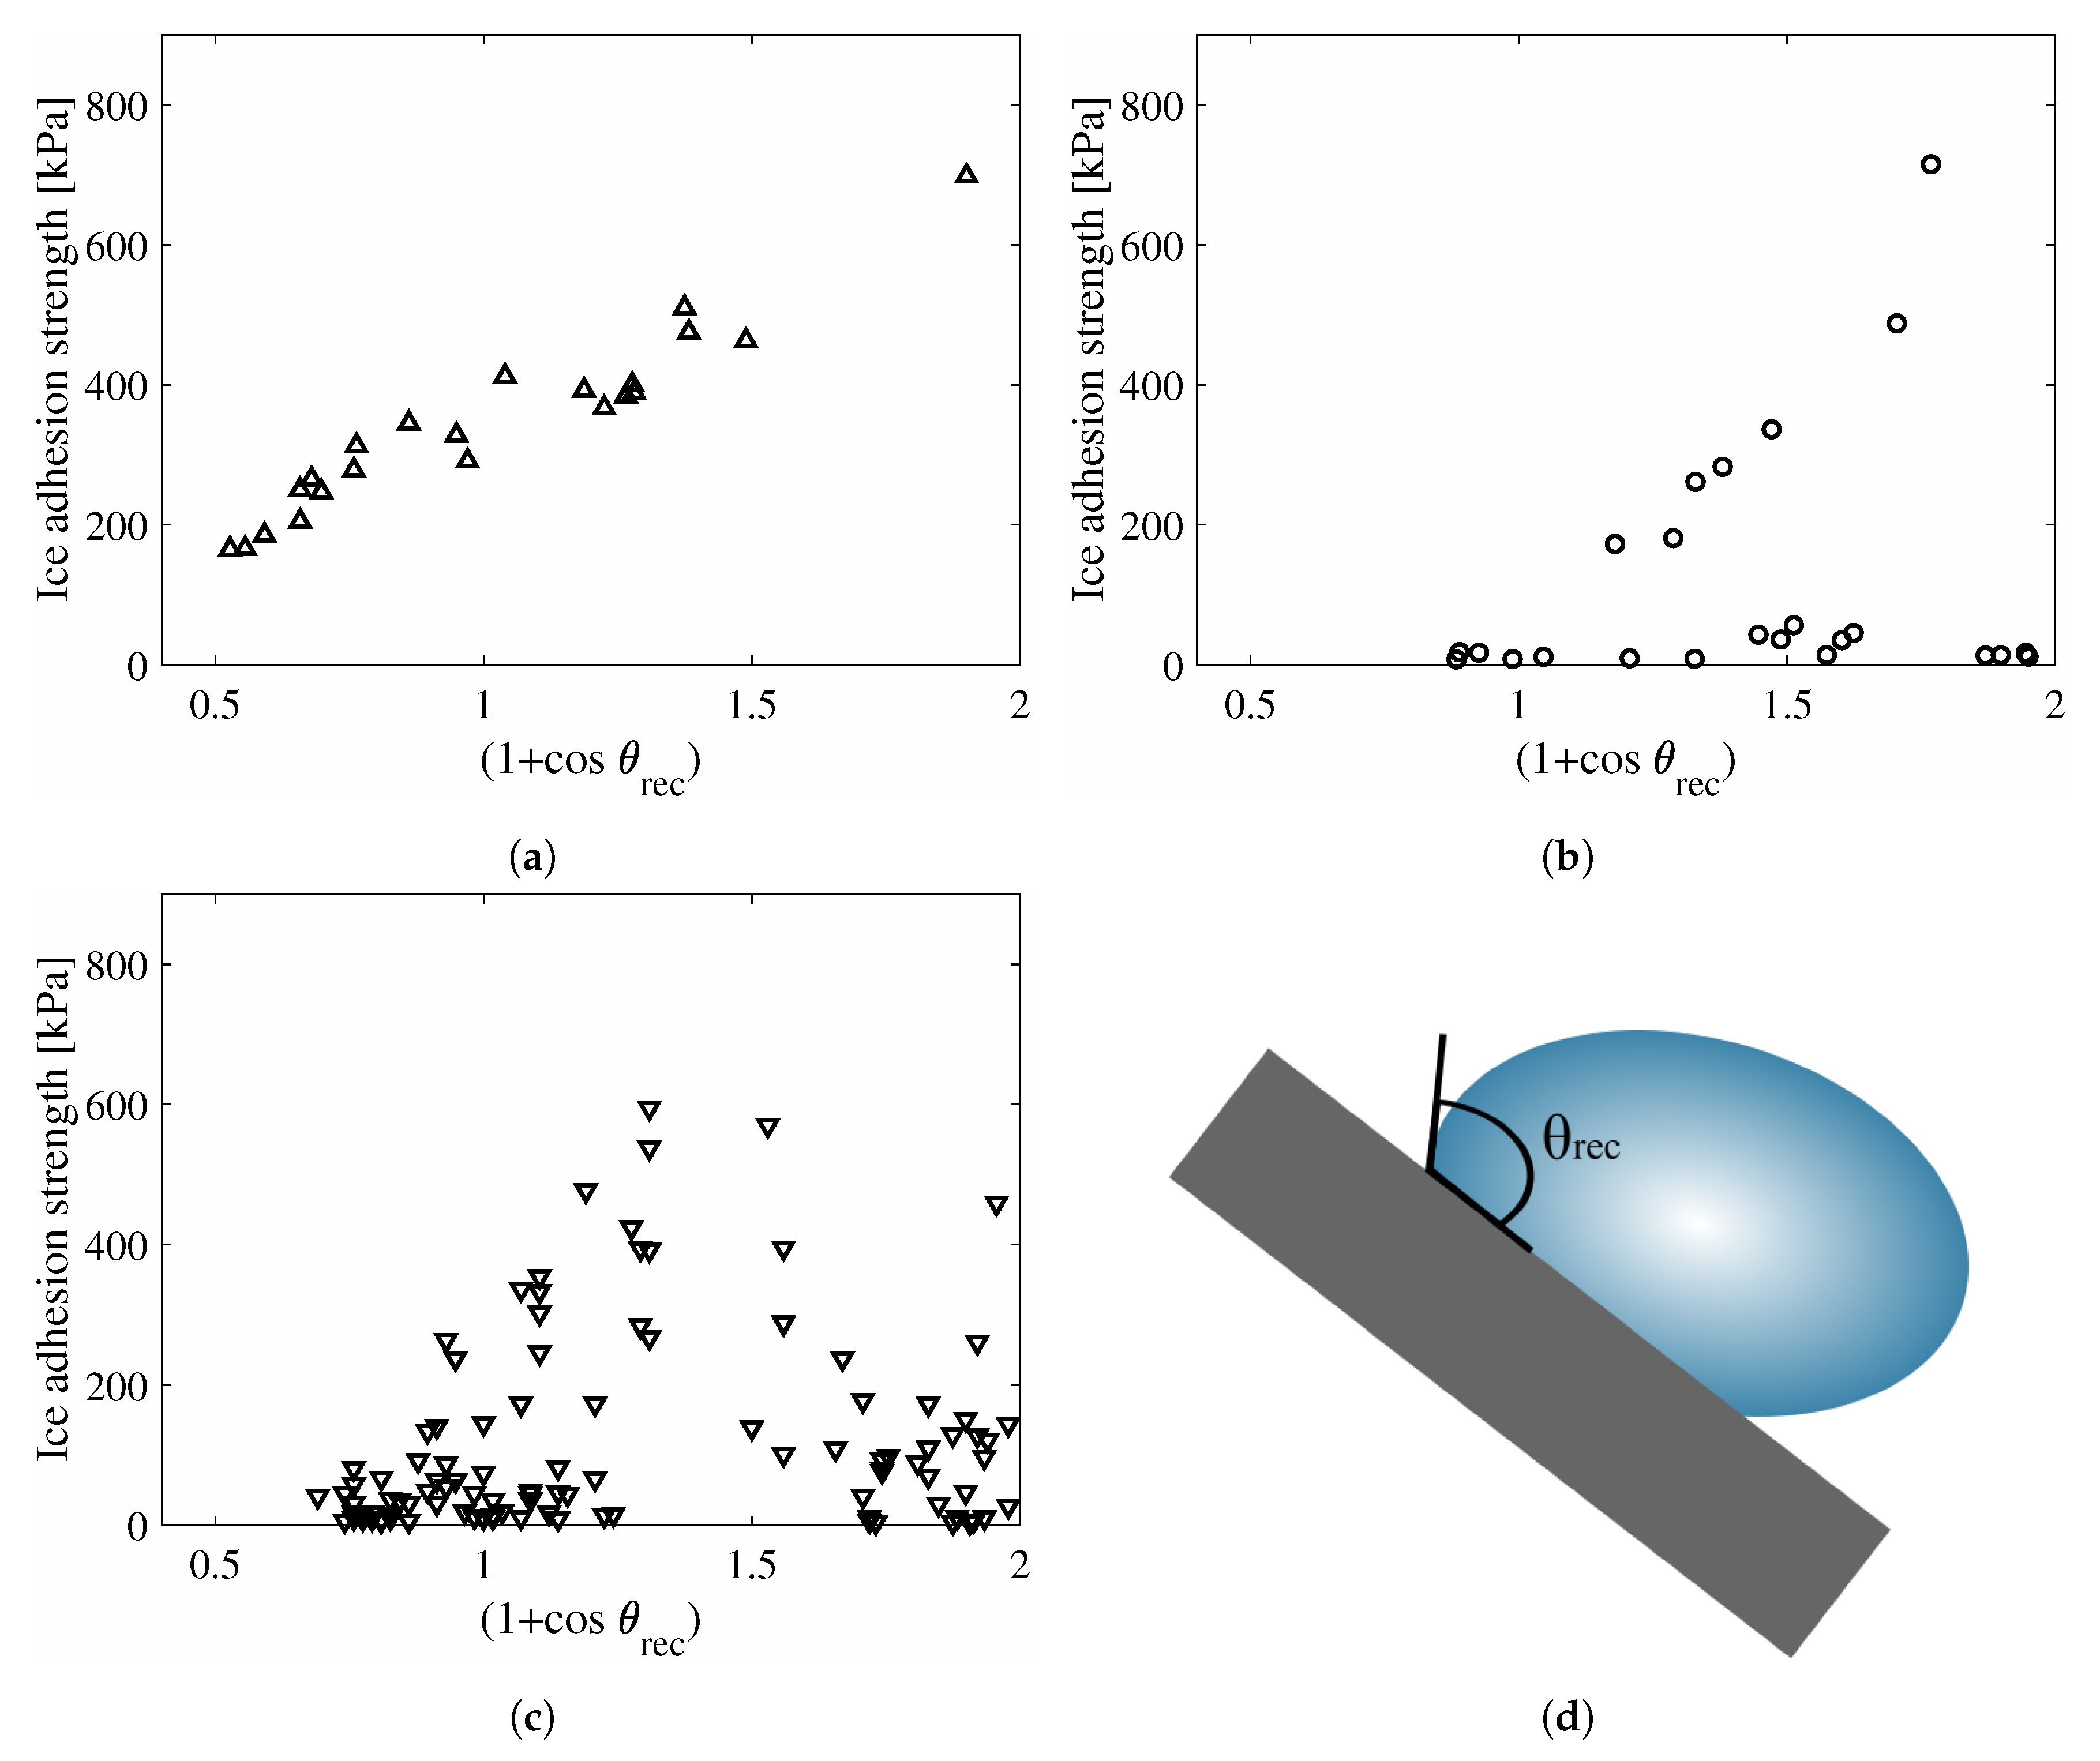
2. Theoretical Aspects

The contact angle is the most common measure of the wettability of a surface. The contact angle is defined as the experimentally observed angle of a liquid droplet, as shown in Figure 1. The general definition applies to all equilibrium and non-equilibrium situations [31]. In this study, the ideal contact angle is studied. The ideal contact angle is the contact angle on an ideal surface, which is a smooth surface that is rigid and chemically homogeneous, and does not chemically bond with the liquid [31]. Such a surface is typically not experimentally viable, due to the difficulties associated with preparing and maintaining an ideal surface. In experimental studies, the most common measured contact angle is the apparent contact angle [31], although so-called static and dynamic contact angles are often discussed as well.
The most widely referred contact angle is the Young contact angle, which is calculated from Young’s equation [32], as stated in Equation (1), for ideal solid surfaces [28]. Young contact angle is a thermodynamic property of a three-phase system, which corresponds to the lowest energy state for the system [31]. For other types of surfaces, other definitions of equilibrium contact angles have been proposed. The Wenzel equation describes contact angle of a droplet on a surface with a given roughness [33], the Cassie equation [34] describes the contact angle of a droplet on a heterogeneous solid surface and the Cassie–Baxter equation [35] describes the contact angle of a droplet on a textured surface with trapped air underneath the droplet [28].
The theoretical relation between the water contact angle θ and ice adhesion is based purely on thermodynamic relations. These relations are described by Makkonen [36], and briefly reiterated here. We consider a drop of water (w) on a solid (s) with an interface (w,s) and the corresponding surface energies γ and droplet contact angle θ . The situation is schematically illustrated in Figure 1. We assume the Young contact angle, described by the equation
γ w , s + γ w cos θ = γ s ,
where the subscripts w denotes water and s denotes surface, respectively. It is further assumed that the water droplet freezes to ice on the surface. The work that is required to remove the ice is defined as the thermodynamic work of adhesion, W a [36]. This work of adhesion is defined as
W a = γ s + γ i γ i , s ,
where subscript i denotes ice, and represents the work required to break the bond between the ice and the surface and form two new surfaces. Combining Equations (1) and (2) shows that
W a = γ i + γ w cos θ + ( γ w , s γ i , s ) .
When considering the commonly accepted assumption that the surface energies of water and ice are similar [37], and thus also the interfacial energies are similar [36], Equation (2) can be reduced to
W a γ w ( 1 + cos θ ) .
The ice adhesion strength τ is commonly defined as the maximum force required to detach the ice from the surface divided by the contact area of the ice solid surface, given by
τ = F m a x A .
The ice adhesion strength is thus a measure of pressure, and when considering that the work of adhesion is a measure of energy, it can be assumed in general that the relation between the ice adhesion strength and the work of adhesion is given by
W a = τ A δ ,
where A is the surface area of the ice and δ is a characteristic measure of the removal distance between the ice and surface. Combining Equations (3) and (5) thus gives
τ γ w A δ ( 1 + cos θ ) .
The surface area of the ice A, the distance δ , and the water surface tension γ w are constants, and can be combined to a general constant C 0 and neglected when the general trend is of interest. The theoretical relation between the ice adhesion strength and the water contact angle thus becomes
τ = C 0 ( 1 + cos θ ) .
This relation is illustrated in Figure 2.
The relation from Equation (7) and Figure 2 has been extensively studied for experimental screening of low ice adhesion surfaces. When the contact angle in Equation (3) is substituted with the receding contact angle θ r e c , which is defined as the lowest metastable contact angle that can be measured [31], the work of adhesion is replaced with the practical work of adhesion W p such that [21,22]
W p γ w ( 1 + cos θ r e c ) .
The same reasoning may be applied to Equation (8) as applied to Equation (3) to derive Equation (7), with an analogous result. As such, both the contact angle and receding contact angle may correlate with the ice adhesion strength.
Meuler et al. [22] investigated the receding contact angle and its relation to the ice adhesion strength for commercially available icephobic surfaces. Analogous experiments were performed by He et al. [18] and Golovin et al. [38]. Their experimental results are shown in Figure 3. It can be seen that the relation from Equation (7) agrees with the results from Meuler et al. in Figure 3a, but only for surfaces with ice adhesion strengths above about 160 kPa as shown by He et al. in Figure 3b. The same relation is not apparent for the large number of samples tested by Golovin et al. [38], as shown in Figure 3c.
Ideally, the relation from Equation (7) and Figure 2a should predict the ice adhesion strength of a given surface based on the water contact angle, or similarly for the receding contact angle. However, the experimental studies vary considerably, and ice adhesion strength depends on more parameters than just wettability, such as for instance softness of the surface, and elastic incompatibility between ice and the surface. The discrepancy between theory and macroscale experiments with ice adhesion and wettability is well known, and might be due to mechanical deformation or the varying structure of ice, among others. Thus far, investigations have only been performed either at macroscale or by theoretical analyses. In this study, molecular dynamics simulations were applied to breach this gap and investigate the relation in Equation (7) at the nanoscale.
The use of molecular dynamics enables the system to be controlled precisely, and to investigate the underlying mechanisms of the ice adhesion related to water contact angle. The water itself, and the water–solid and ice–solid interactions which govern the behaviour, can be controlled and observed while changing the parameters of the water–ice interaction with the surface. Consequently, it is possible to investigate different water contact angles for the same water-surface system, and the associated ice adhesion strength.
In this study, only the water contact angle was investigated, and not the receding contact angle. To perform similar investigations as presented in this study with the receding contact angle to determine the practical work of adhesion will be part of a future project.

3. Methods

Our simulation system consisted of an ice cube situated on a graphene surface, which melts to water when the temperature is raised. The system is similar to a previously published system [39]. The aim of the study was to determine the relation between the ideal water contact angle and the ice adhesion strength on an ideal graphene surface.

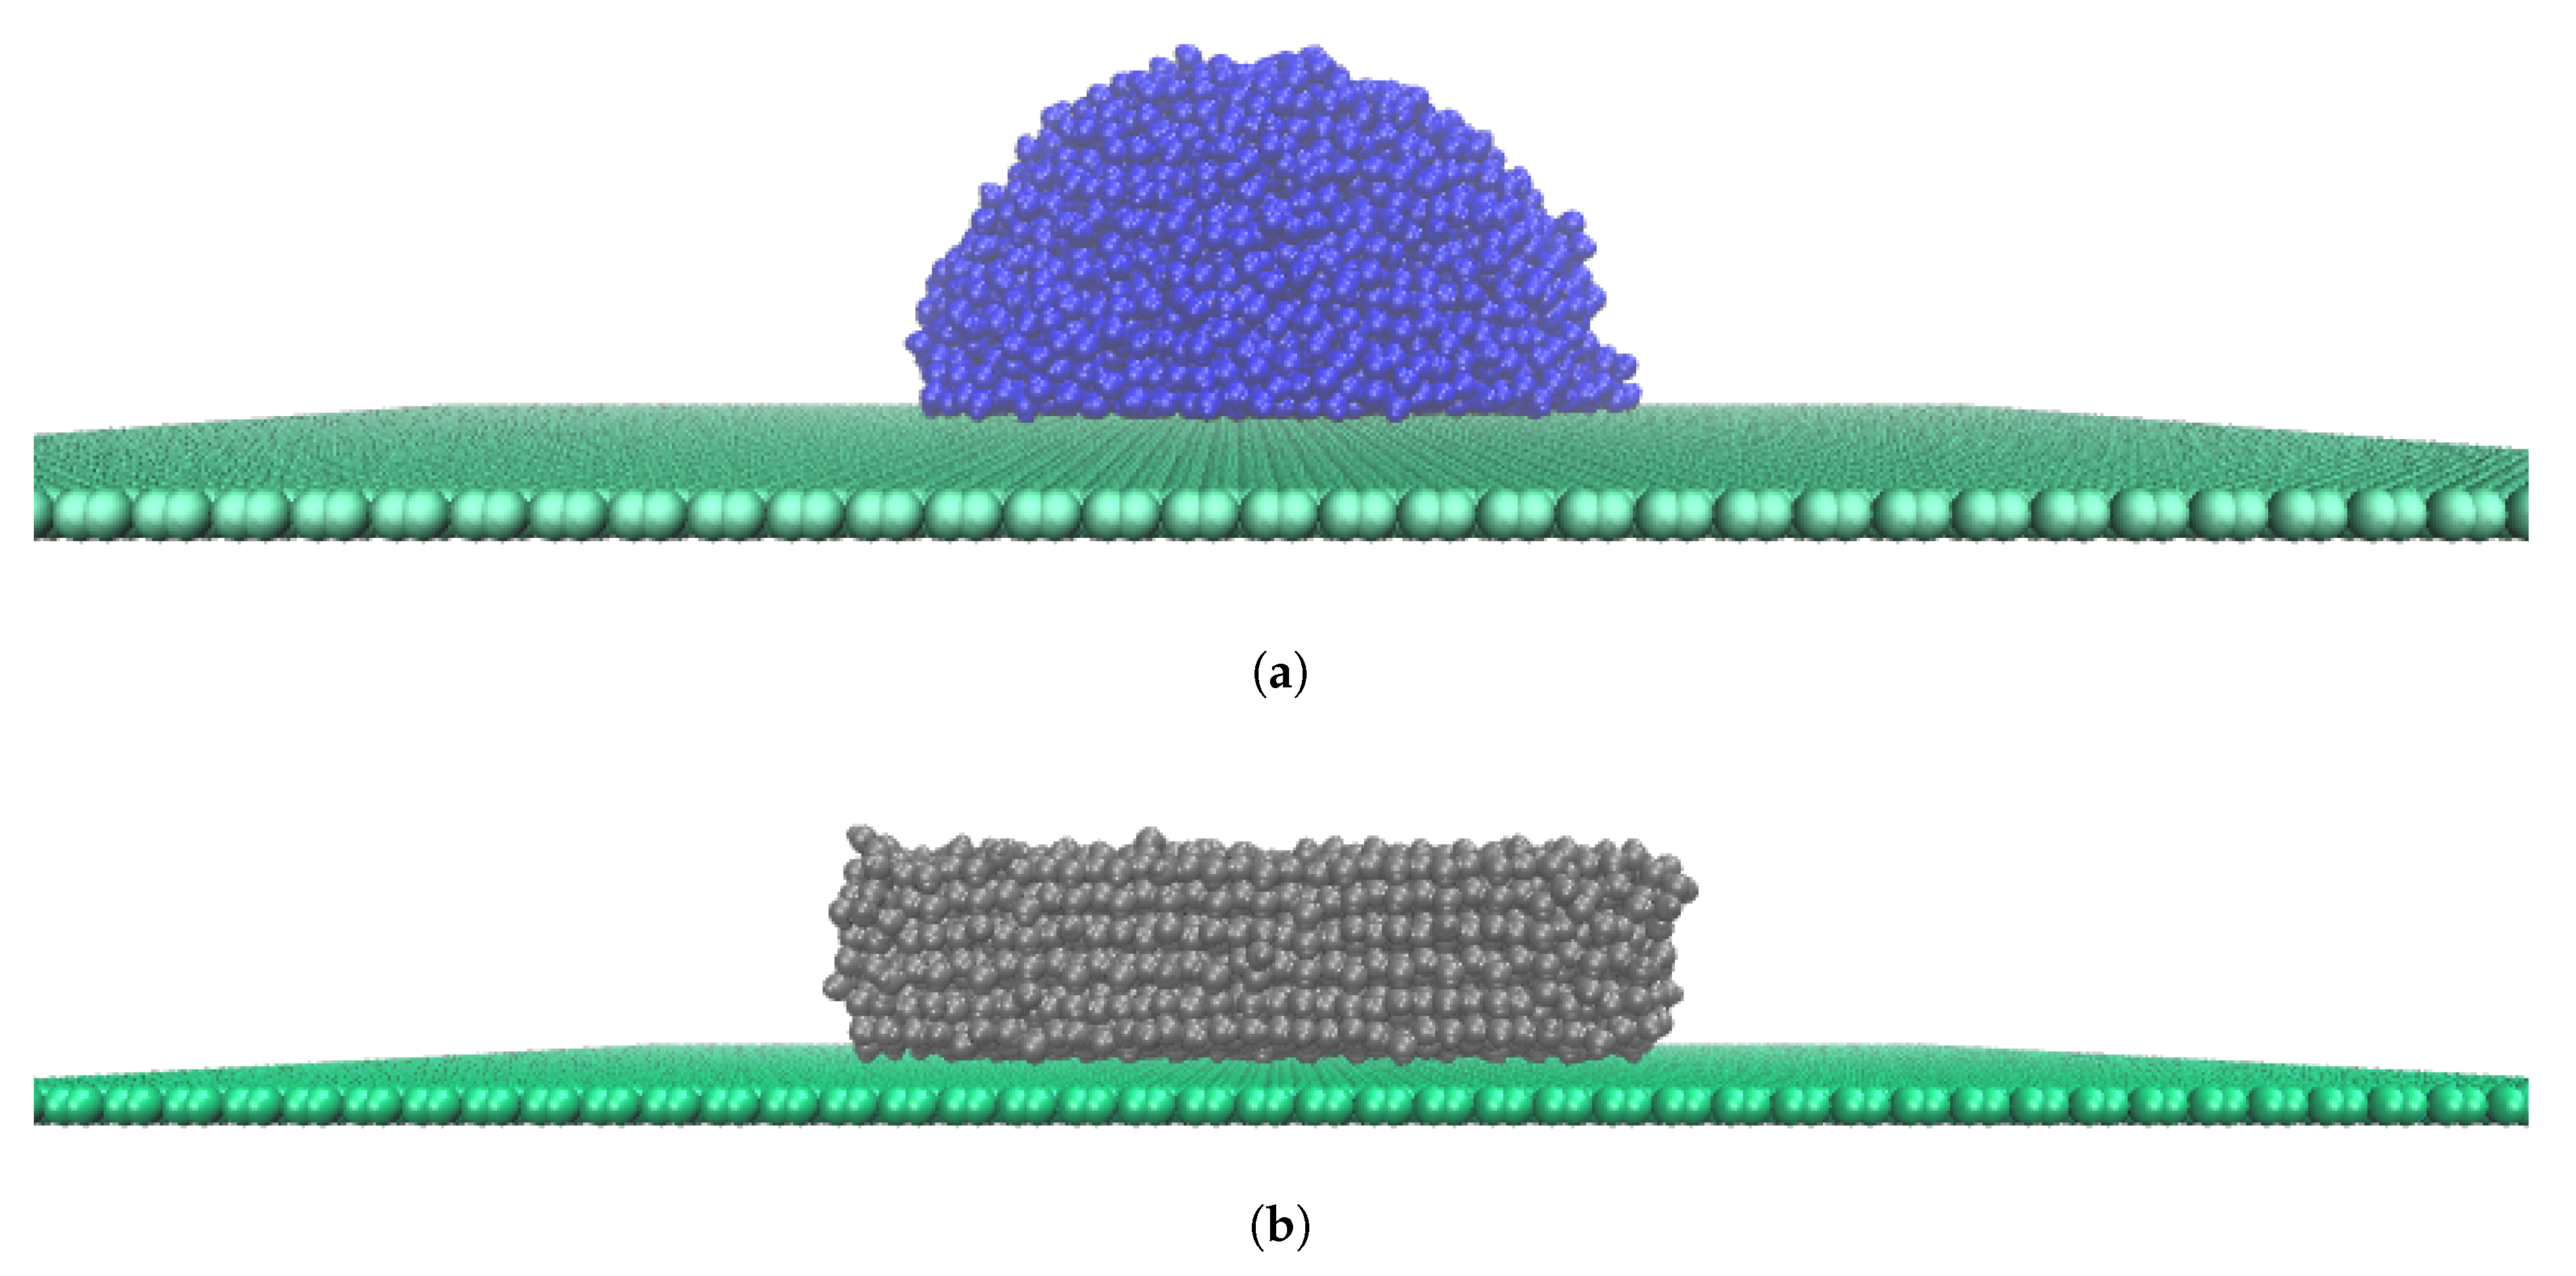
3.1. Atomistic Modelling

The chosen water model was the all-atom TIP4P/ICE [40], both for the ice cube during ice adhesion simulations and for the water droplet contact angle calculations. Compared to other widely applied water models, such as SPC [41], SPC/E [42], TIP3P and TIP4P [43], this water model was reported to reproduce appropriate properties for both ice and water, in addition to a more correct phase transition [40]. TIP4P/ICE has a higher transition temperature of 272.2 K, and is suitable for investigating the detachment of ice from a solid substrate as is the aim of this study. We chose here to use the same water model for ice and water for the sake of simplicity in comparing results, despite the possibility that other water models, for instance TIP4P, could provide better results of liquid water dynamics at room temperature. We leave the subject of systematic investigation of different water models for wetting and ice adhesion to future studies. Although the surface tension of water using the TIP4P/ICE model had been previously studied [44,45], the surface interaction energy of ice using TIP4P/ICE still needs to be further explored by extensive future studies. It is not the scope of this work to investigate the surface properties of the TIP4P/ICE model. For the graphene surface, parameters from the OPLS force field [46,47] were applied, as discussed below.
The ice modelled in this study was ice Ih. This ice phase was chosen because it is the only phase of ice occurring naturally during normal conditions [48], and this ice phase is thus the only ice phase of interest to the ice adhesion research. The ice cubes were modelled with a hexagonal molecular arrangement. The basal face of the ice cube, (0 0 0 1), was the face used to adhere to the surface. The ice cube had surface area A = 8.0 × 7.6 nm 2 , and thickness 2 nm. The size of the ice cube was thus on nanometre scale, and might be considered as a nanoscale location of a realistic sample at microscale and macroscale.
Both electrostatic interactions and van der Waals forces are important for ice adhesion [49,50]. However, due to the highly complex situation of Coulombic interactions and the possible surface oxidation by the water molecules [39], we chose graphene that interacts with water through van der Waals forces via Lennard–Jones potential.
Graphene was chosen as the surface in study for the sake of simplicity and because the surface can be considered atomically flat and thus an ideal surface [31] when comparing to water. The graphene surface consisted of electrically neutral carbon atoms, with a surface area of 19.9 nm × 20.3 nm . This surface area was more than four times larger than the contact area of the ice cube and the associated water droplet, which assured enough space for the water molecules to migrate during the simulation. The system is illustrated in Figure 4. The system had periodic boundary conditions in all directions, and thus the surfaces expand to infinite surfaces during simulations.
The van der Waals parameters for the simulated graphene surface were a van der Waals radius of σ = 0.355 nm and an energy well depth ε = = 0.29288 kJmol 1 nm 2 . These parameters were borrowed from napthalene fusion carbon number 9 in the OPLS force field [46,47], as this atom only connects to other carbon atoms [39]. The carbon atoms were situated in aromatic ring structures and bonded to their closest neighbours by harmonic potentials with an equilibrium bond length and force constant of 0.14 nm and 3.924592 × 10 5 kJmol 1 nm 2 , respectively. More information about the graphene surface has been published previously [39]. To simulate different water contact angles with the same system, the energy well depth ε was changed manually. This energy well depth determined the interaction potential between the water molecules and the surface, and is a common method to investigate wettability through changing contact angles [17,51,52,53,54]. The energy well depth, or interaction energy, was changed as shown in Table 1. It should be noted that different contact angles were realised by tuning the atomistic interactions between the substrate and the water molecules here. Such approach thus focused us purely on the theoretical relationship between water contact angle and ice adhesion strength, which lacked many details in different systems and experiments [55,56]. It is important to keep the modeling principle in mind when utilising our results to interpret experiments.
In addition to the simulation system described thus far, three additional simulation systems were tested. These systems were similar to the one already described, denoted as System A, except that they had different sizes. The changes in size refer both to the size of the graphene surface, and the size of the original ice cube. All the simulation systems are detailed further in Table 2, and range from roughly 7000 atoms to 100,000 atoms. All four systems are displayed in Figures S1 and S2.

3.2. Simulation Details
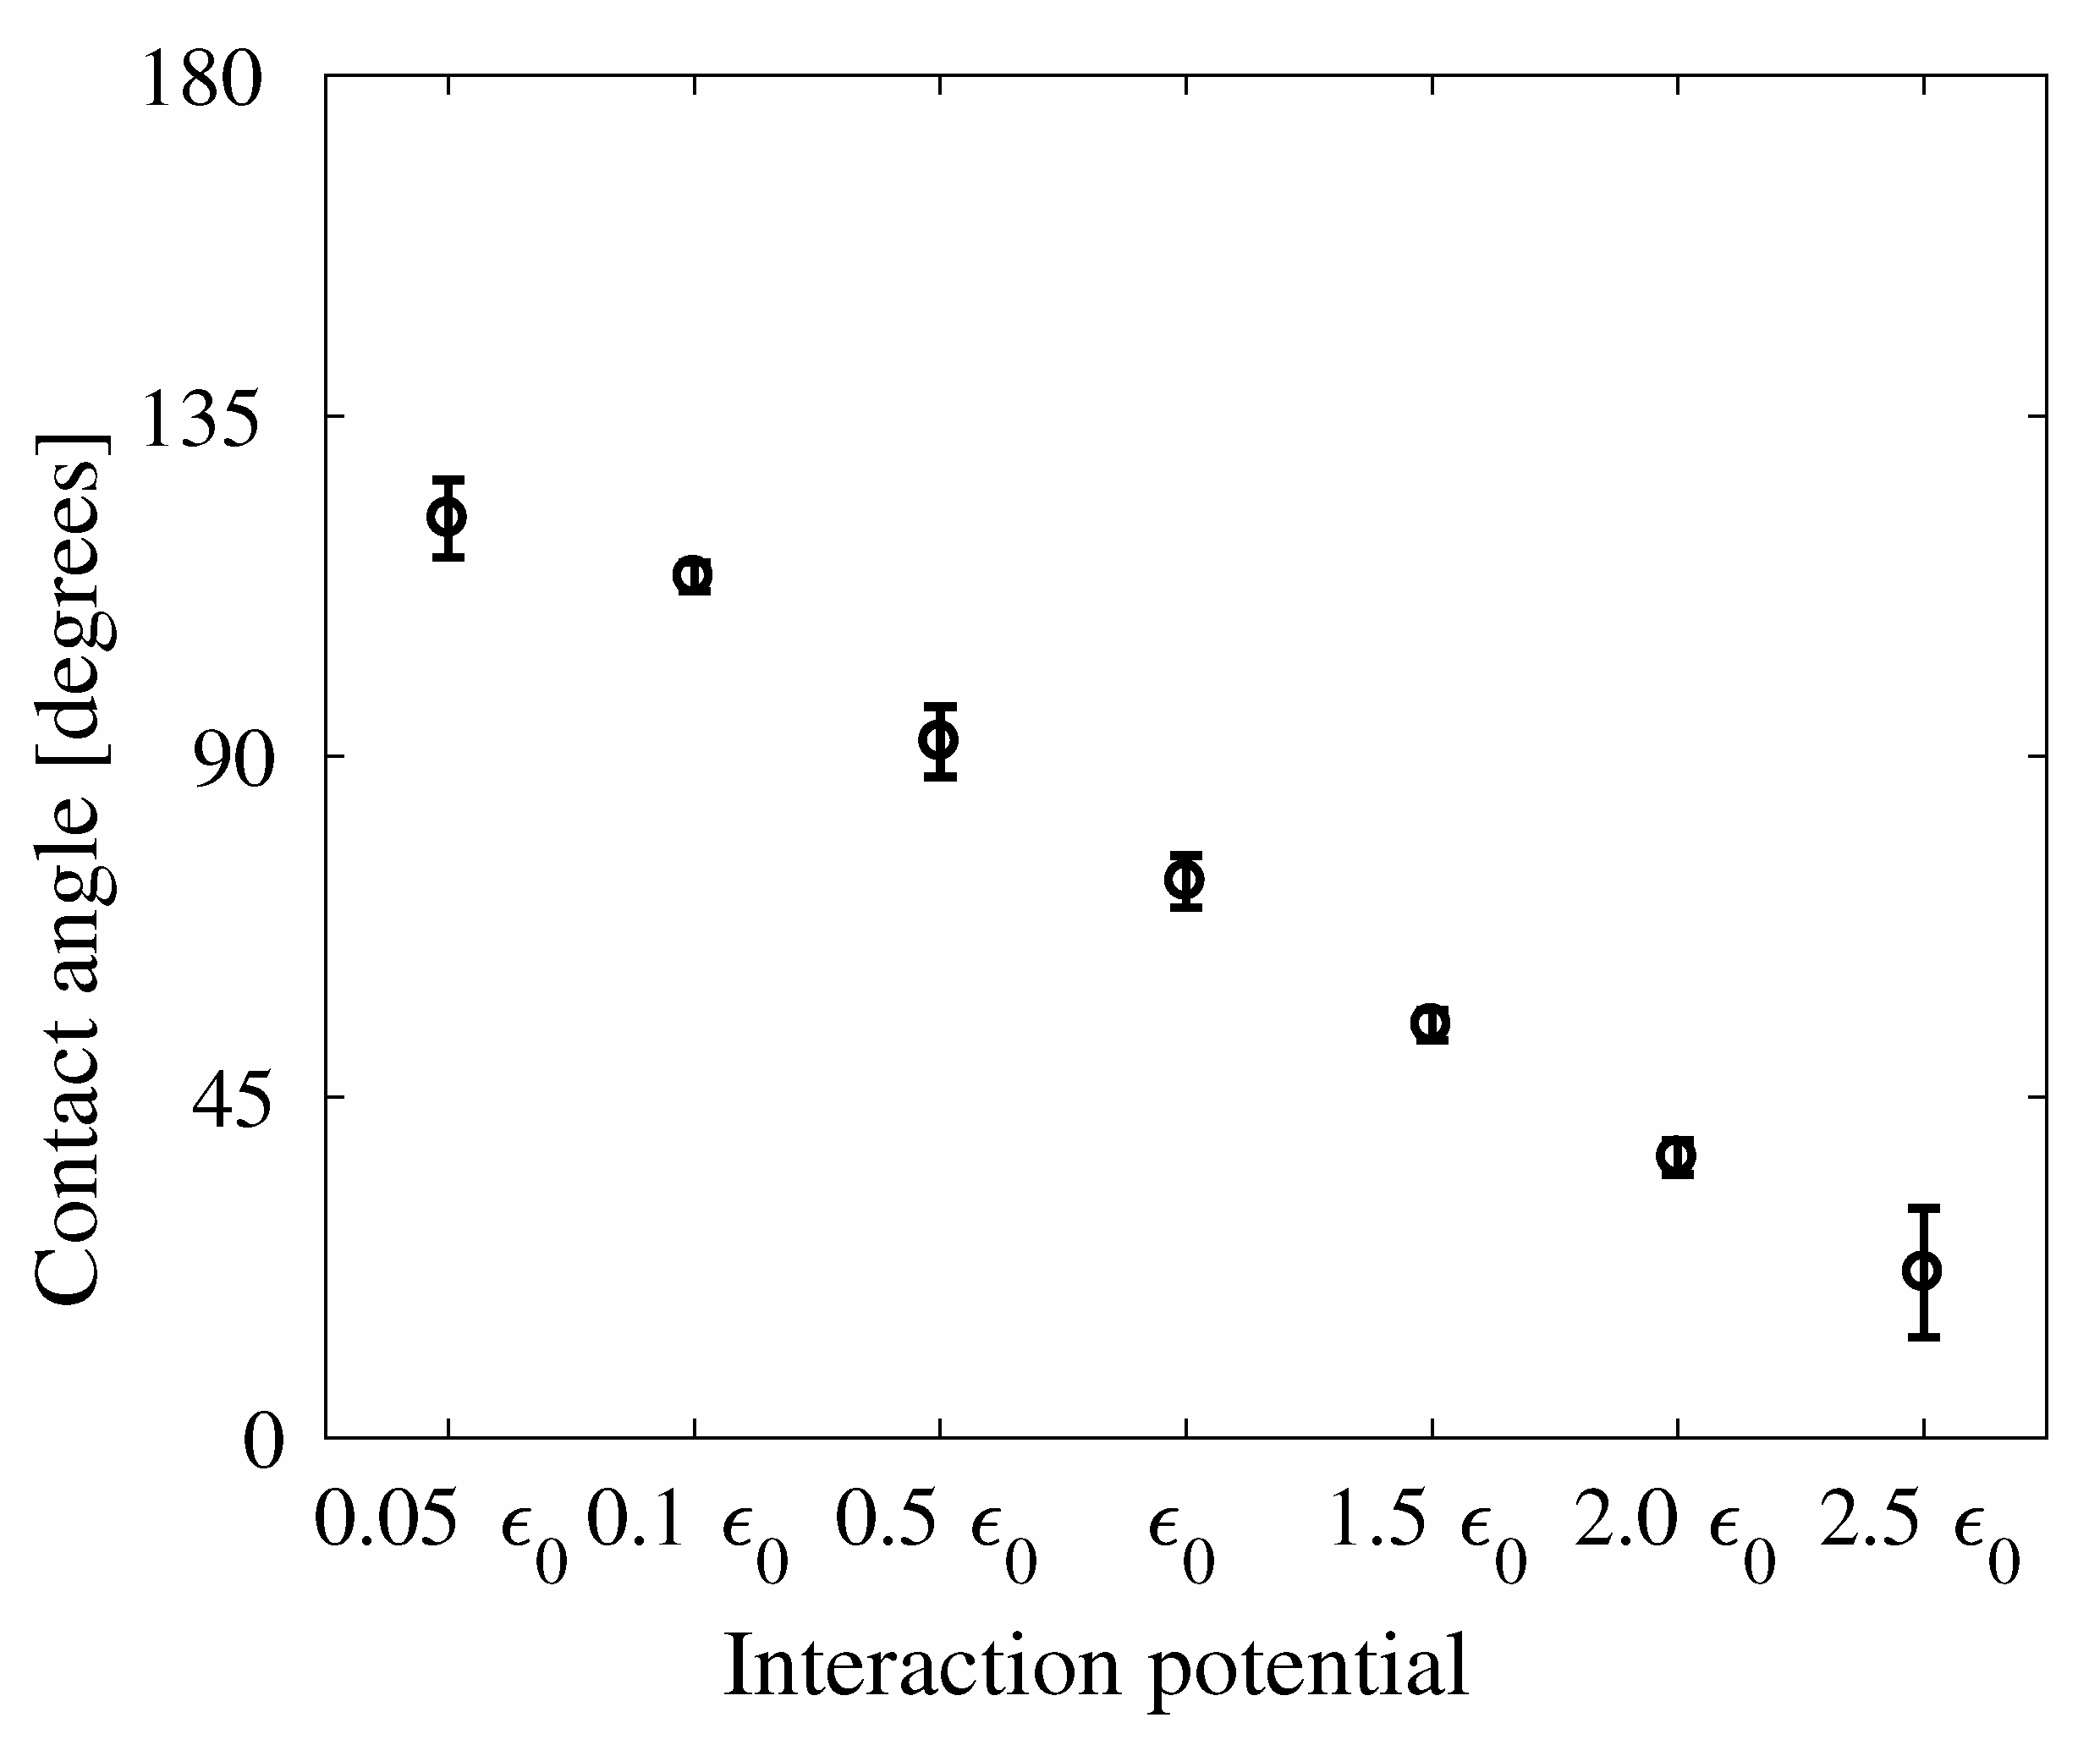
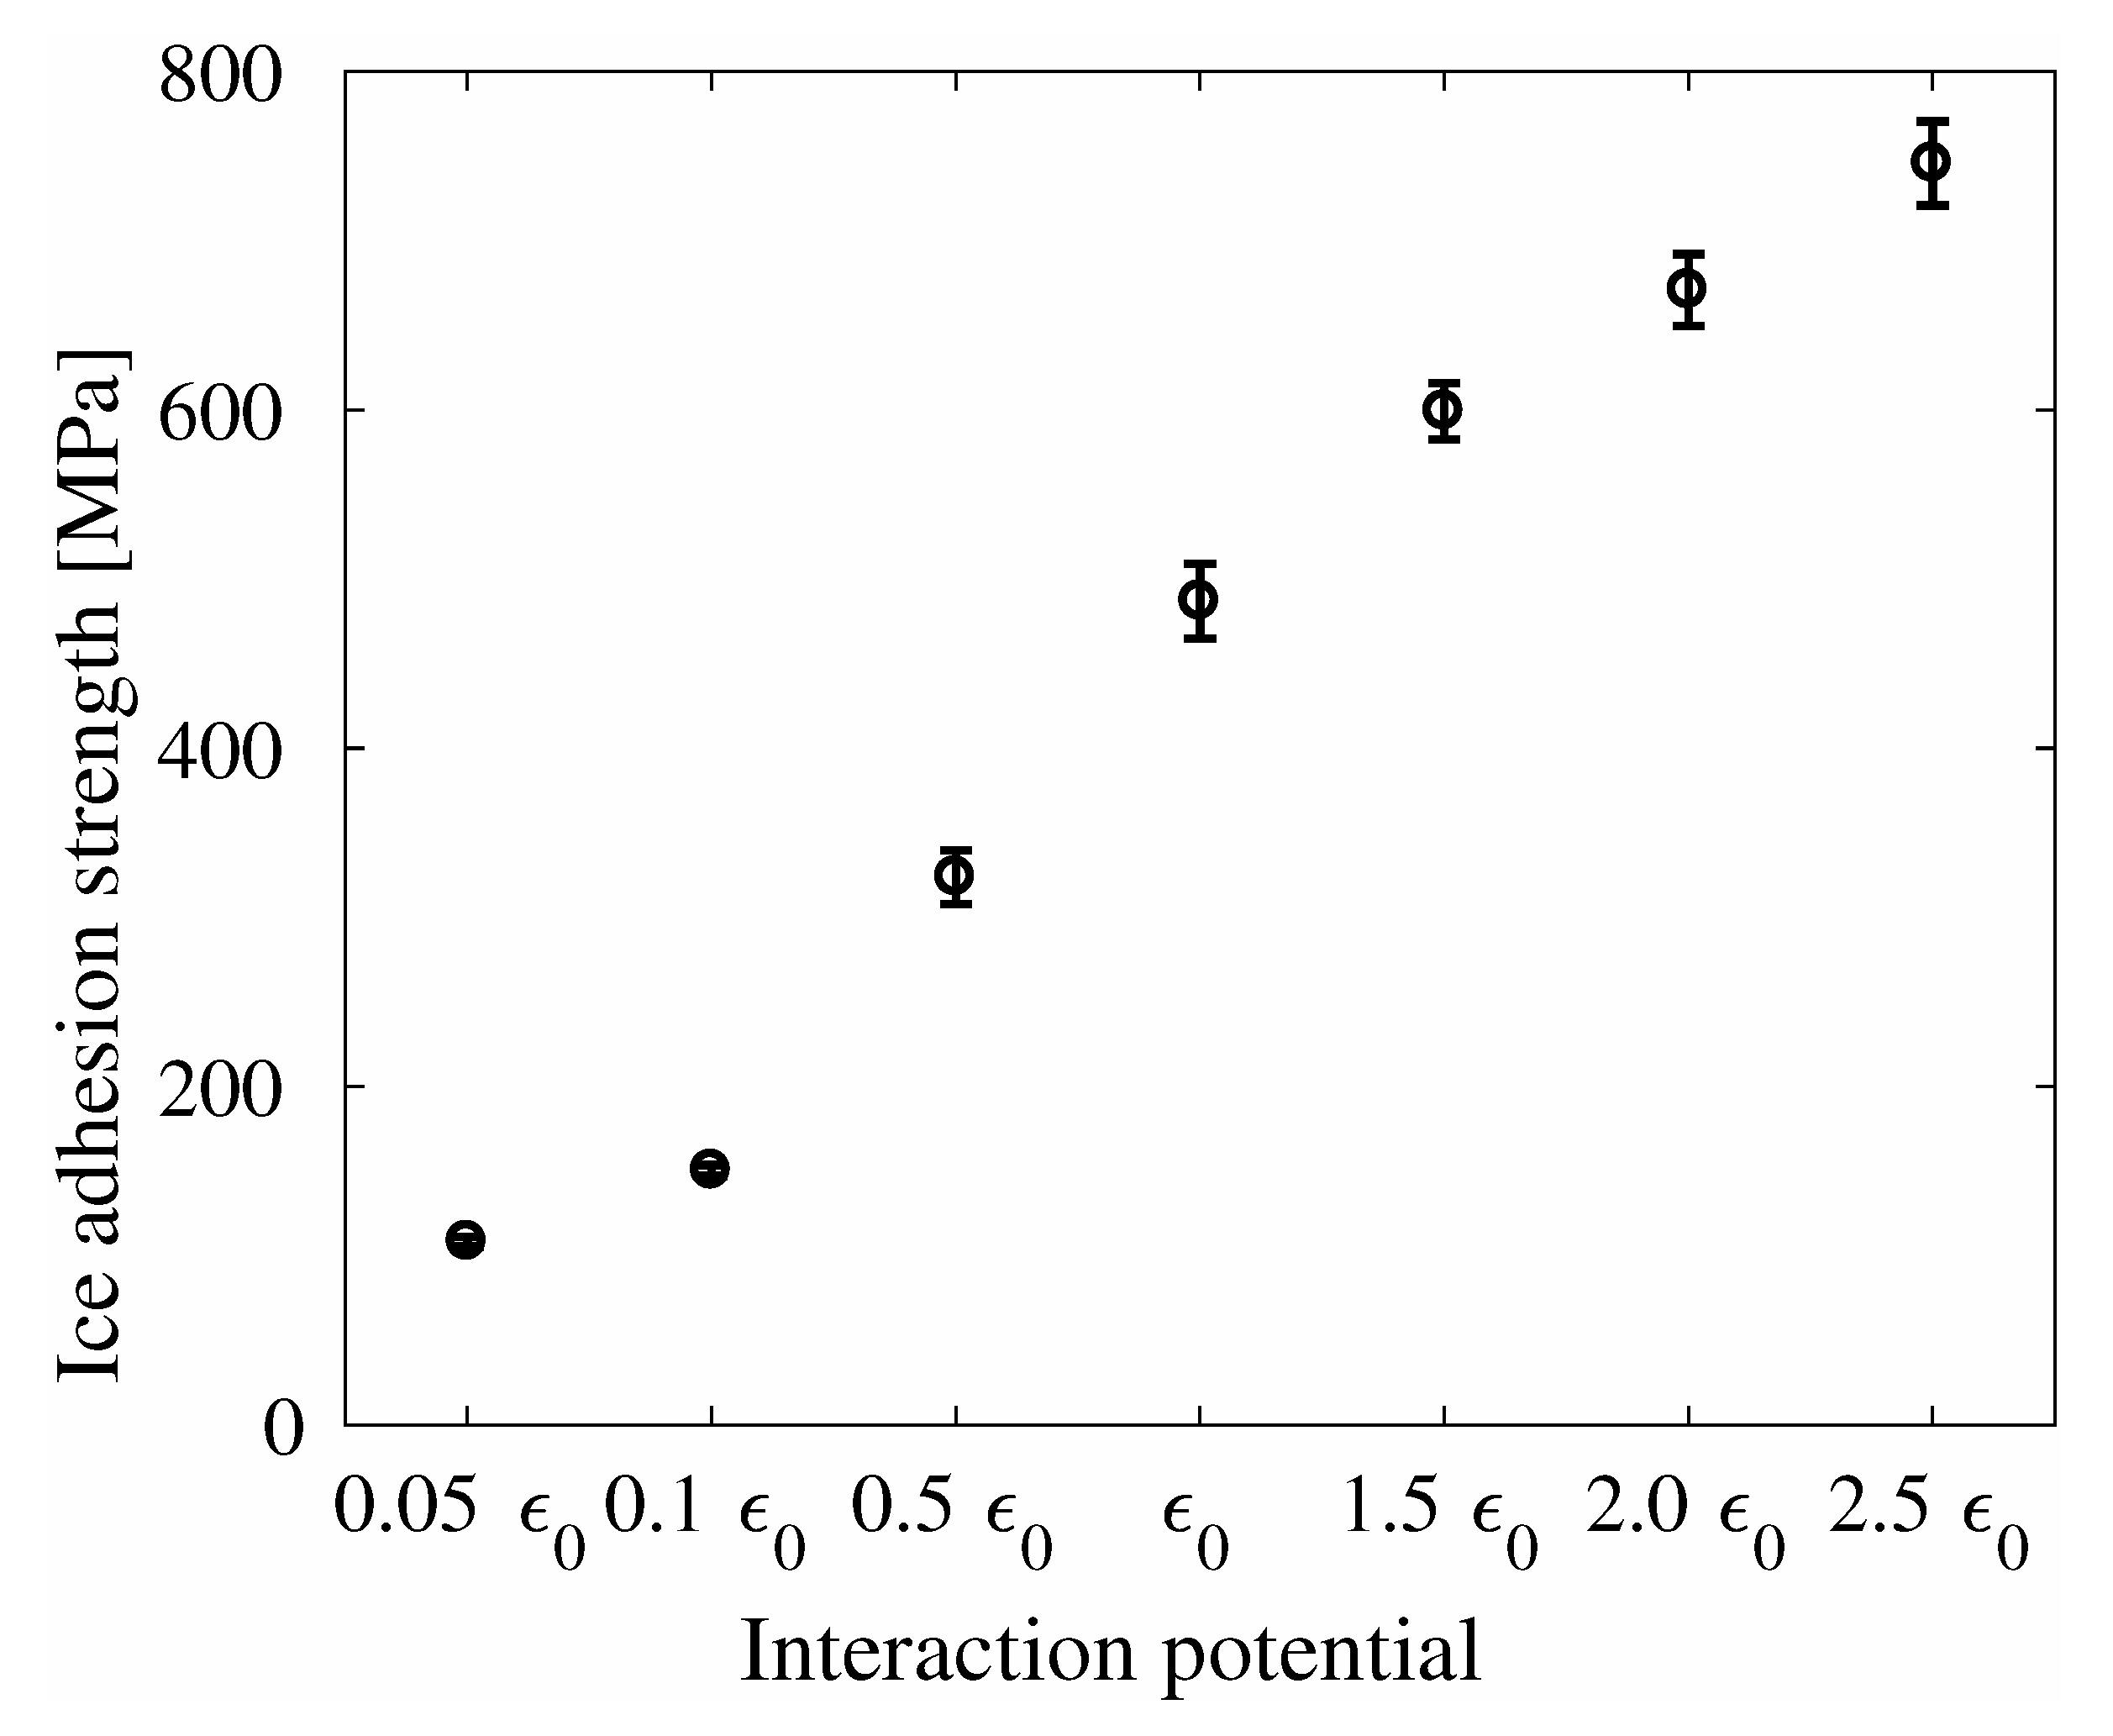
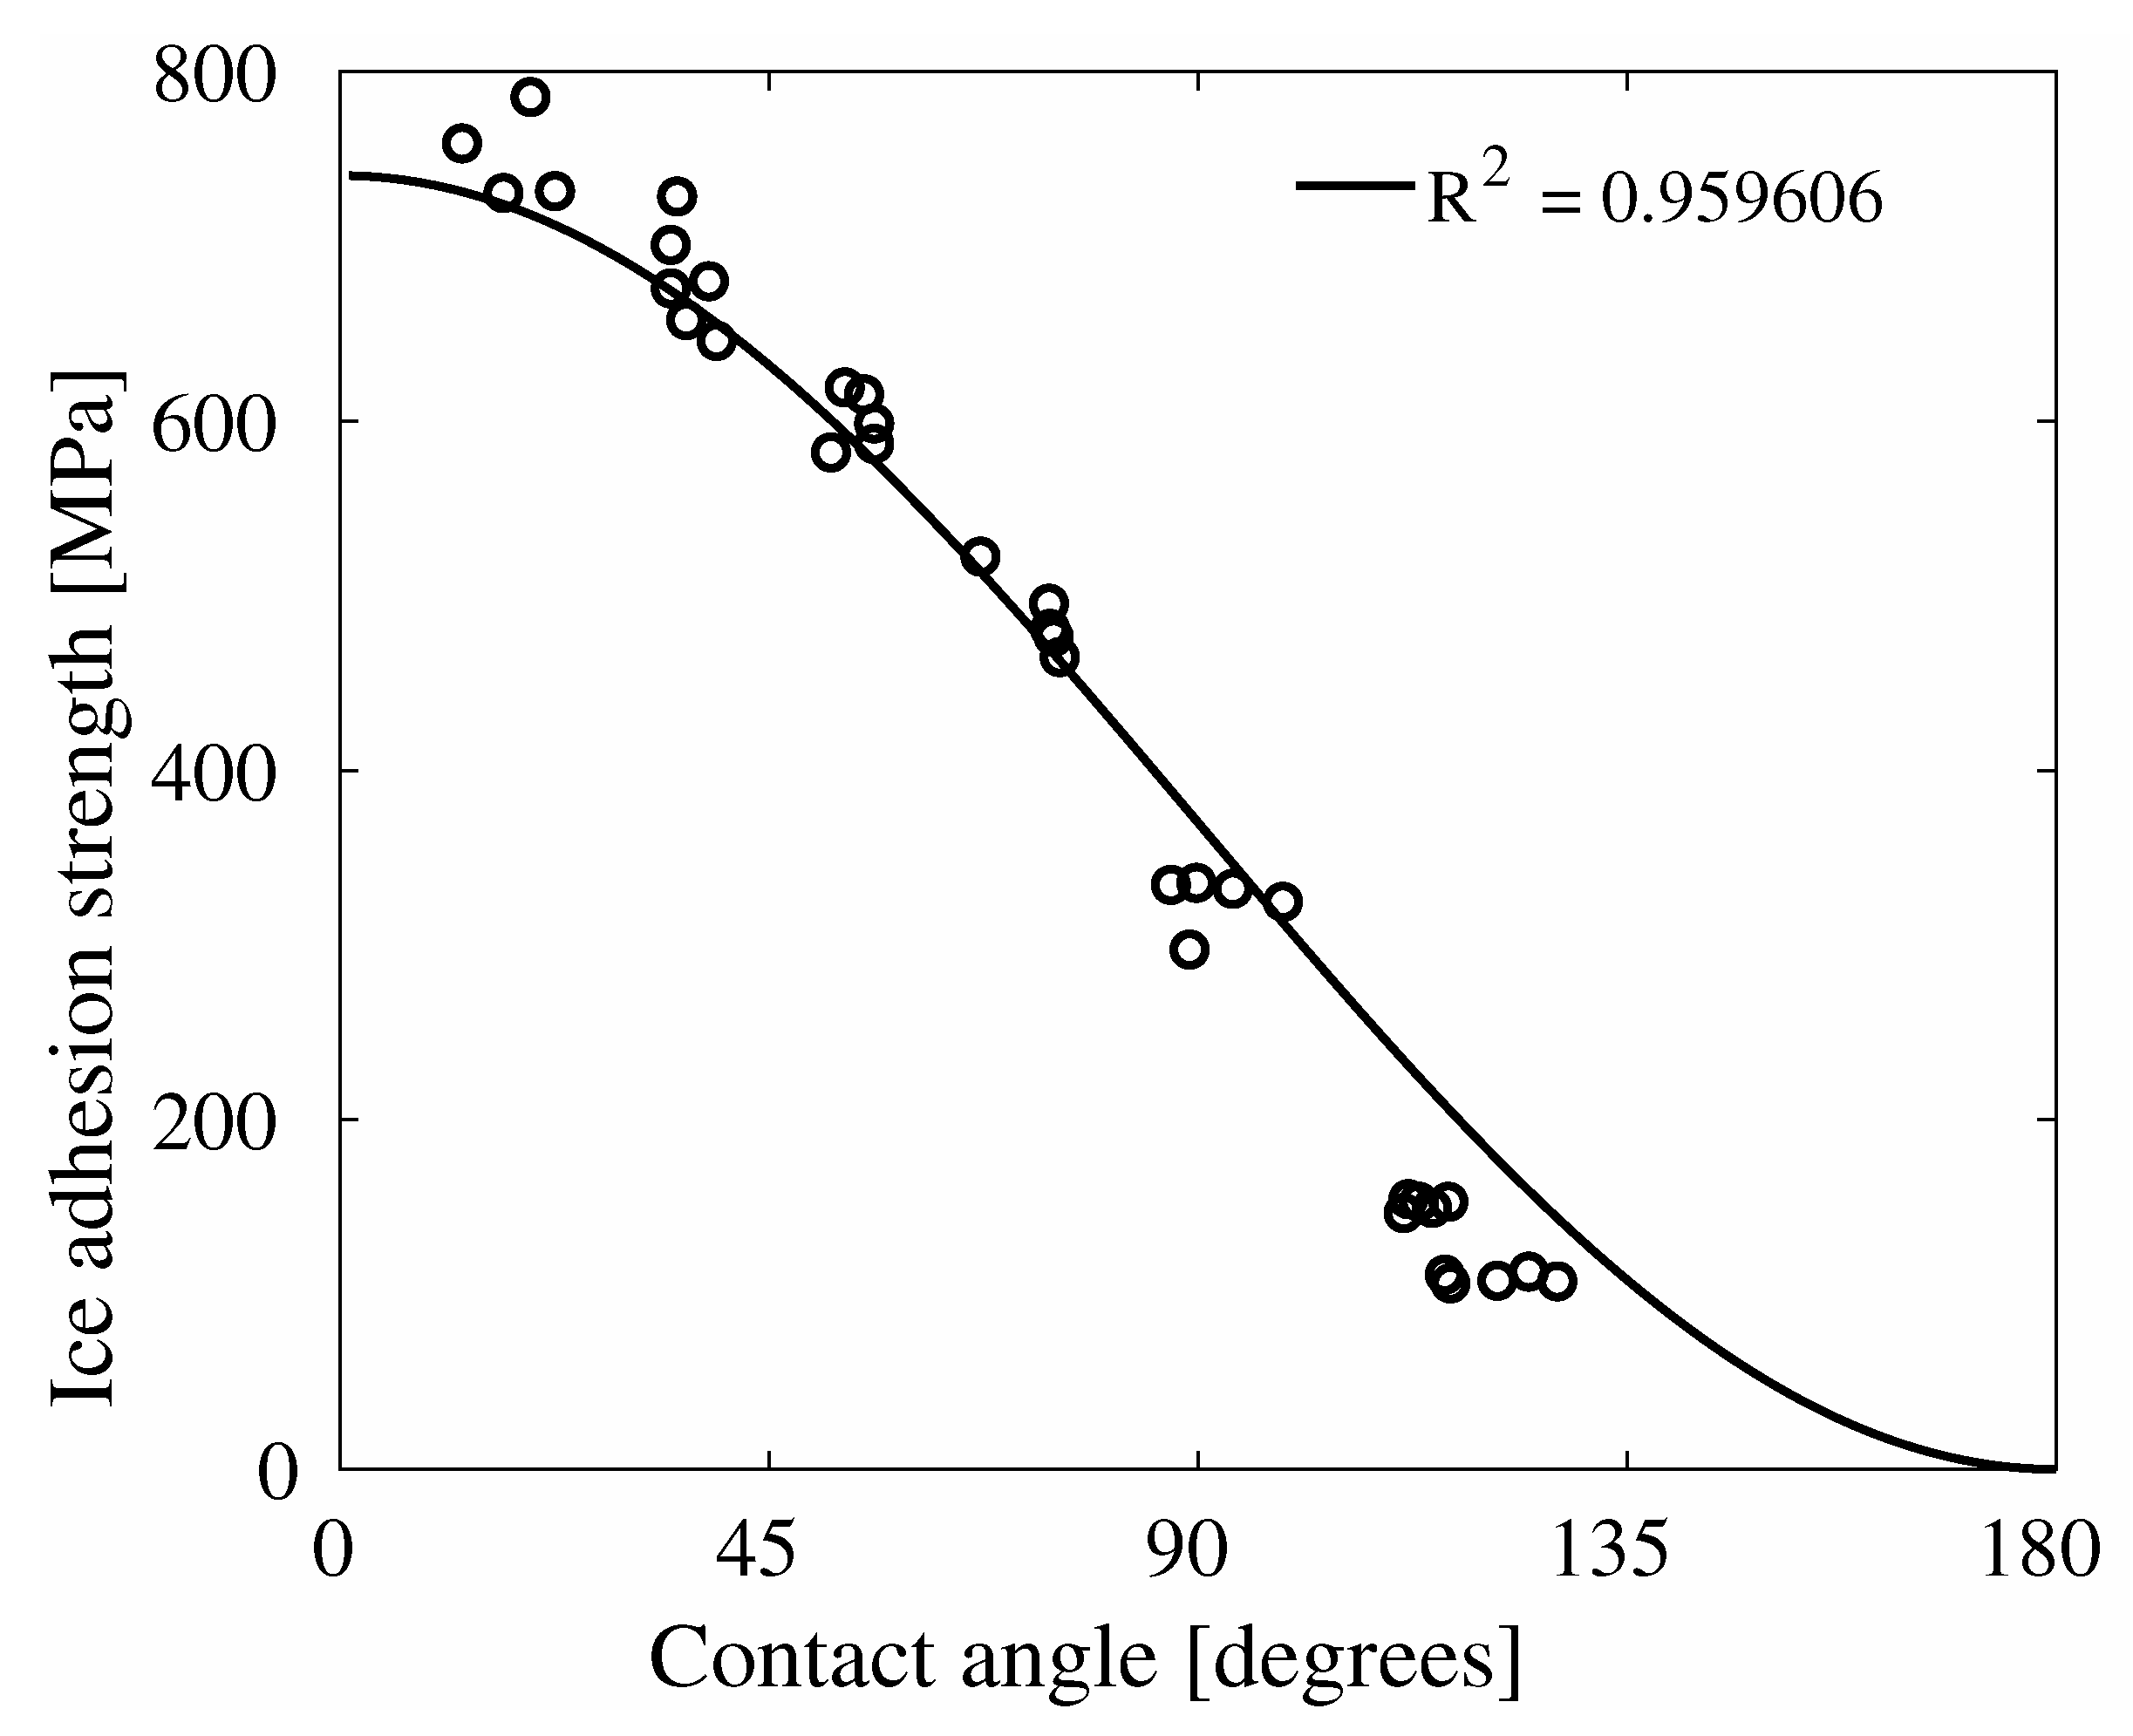
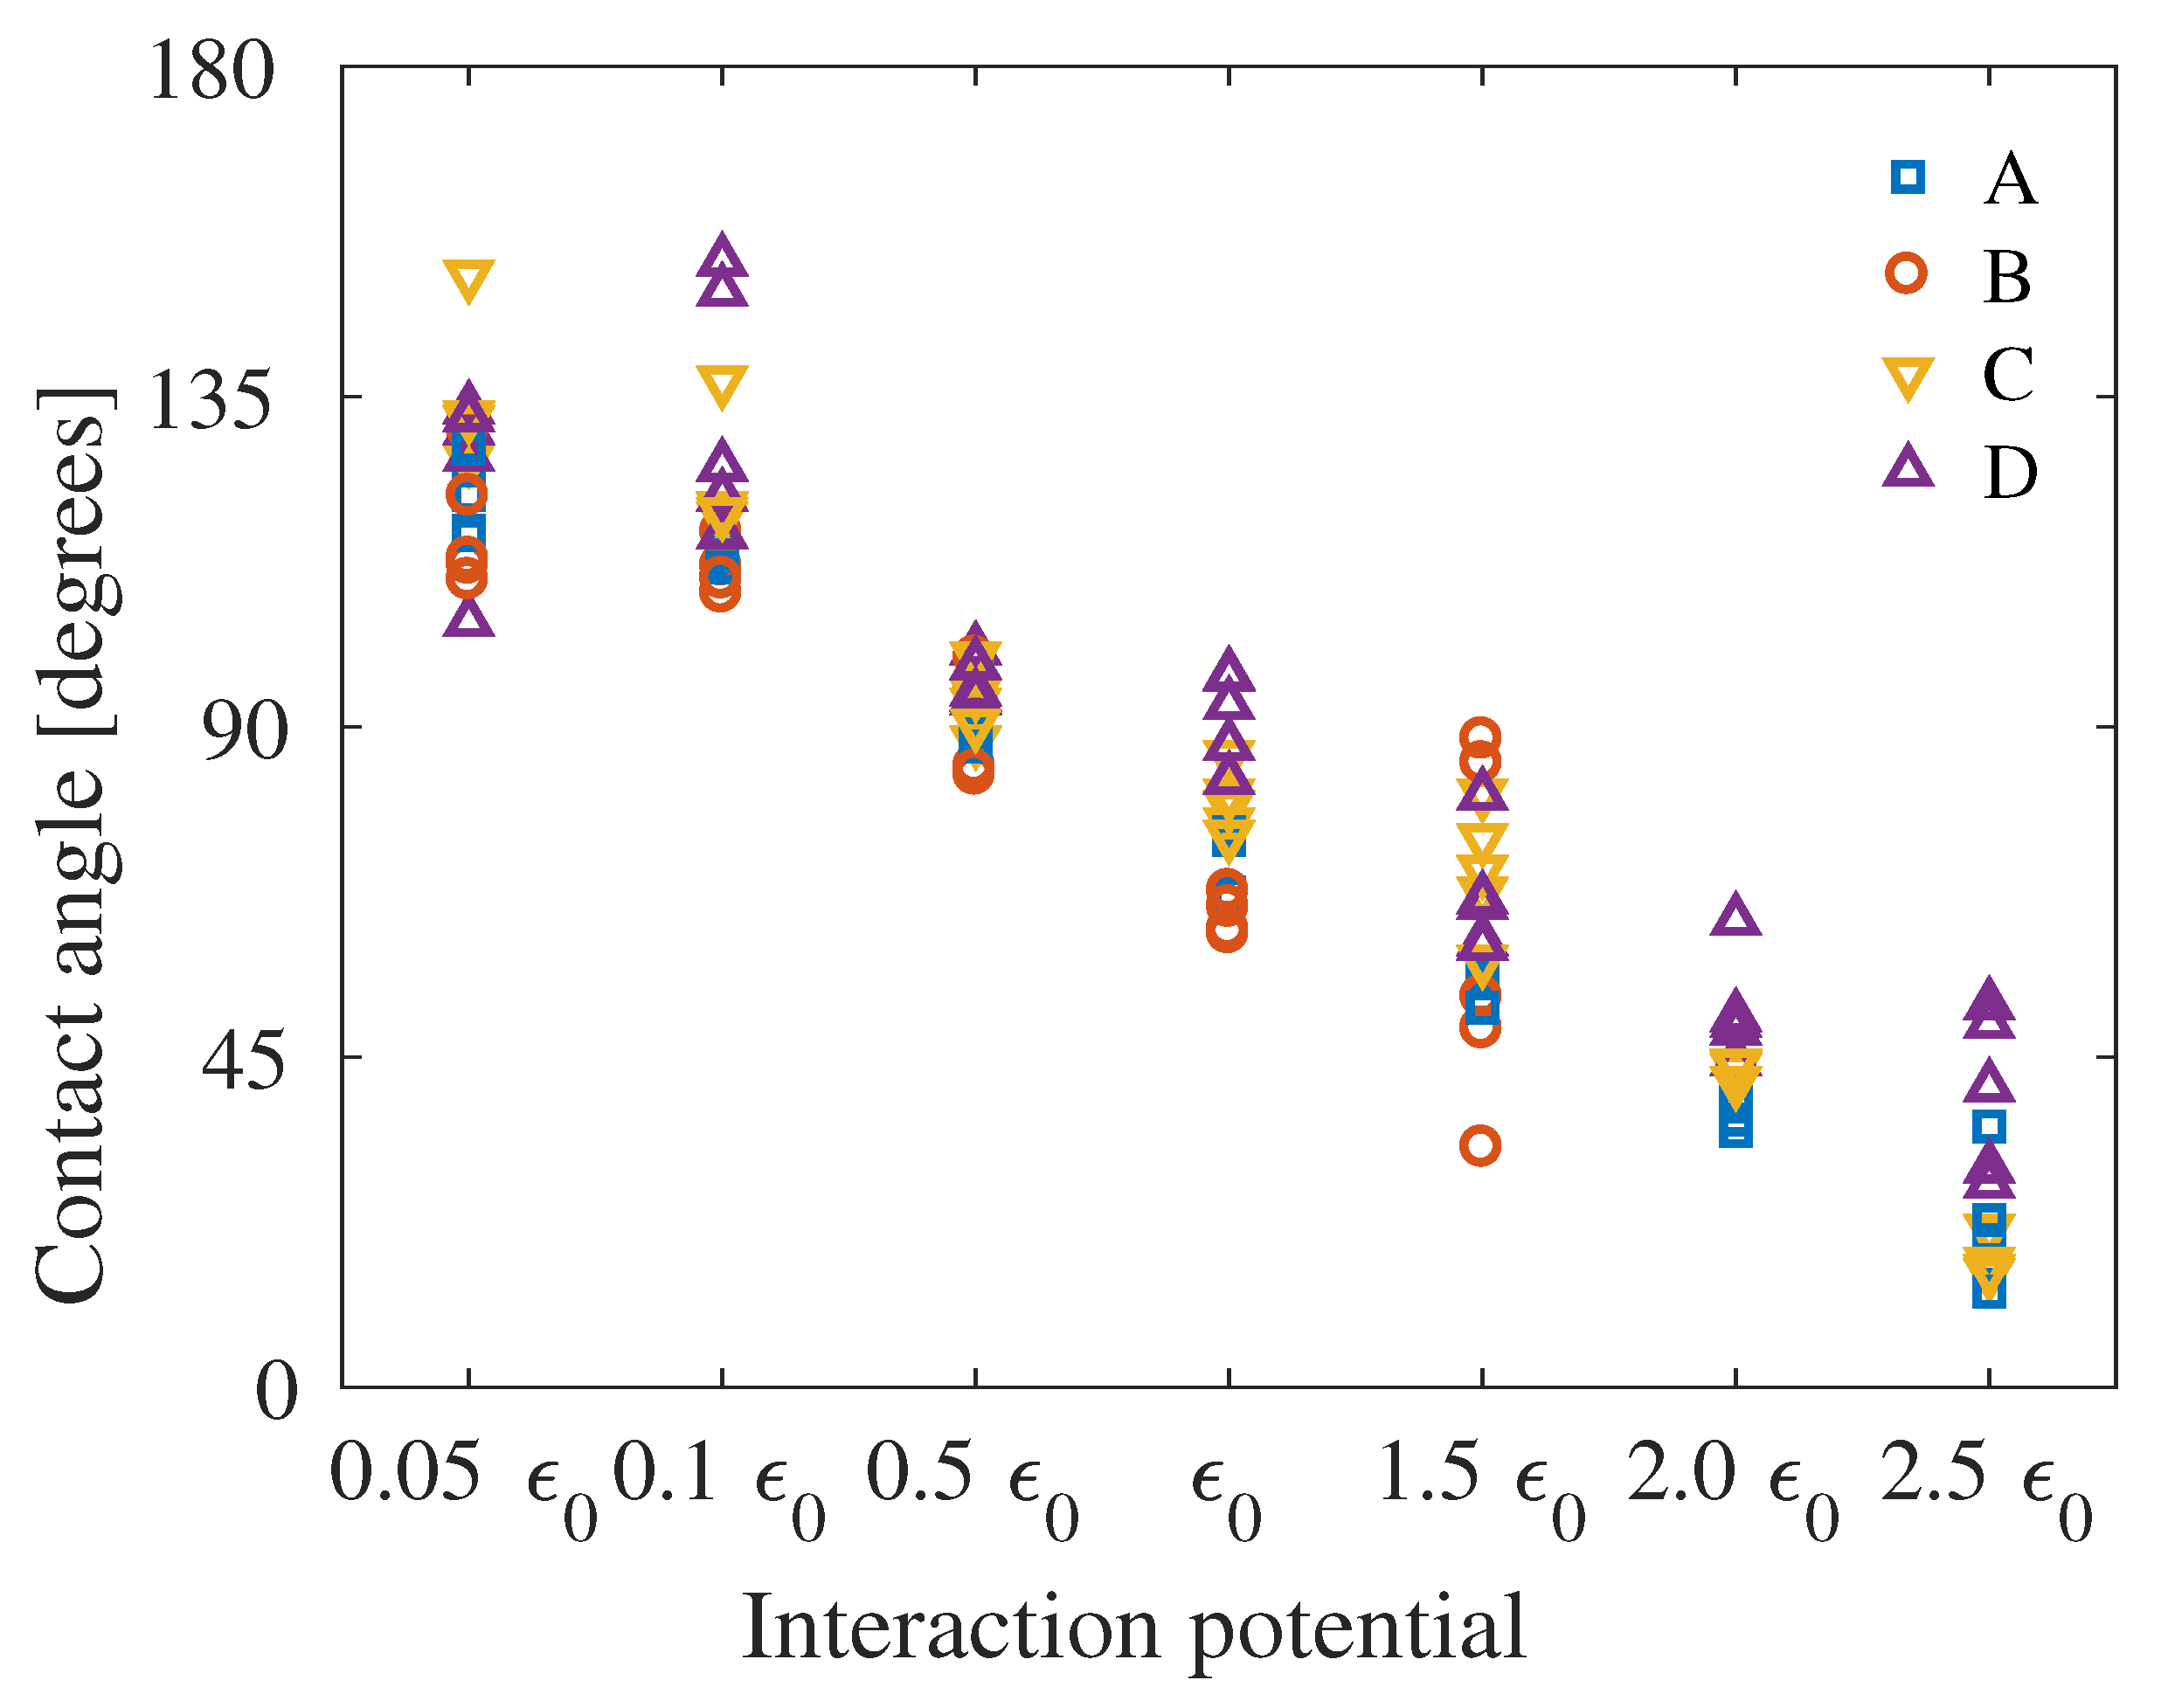
Three different types of subsequent molecular dynamics (MD) simulations were performed on the atomistic models for accessing the ice adhesion strength. These were structural energy minimisation, ice adhesion equilibration and force-probe MD simulations. For determining the water contact angle, the structural energy minimisation and equilibration were applied. The MD simulation package GROMACS 5.1.2 [57] was employed to carry out the simulations. The substrates were placed in the XY-plane of the simulation boxes, and the Z-dimension of the simulation boxes was large enough to ensure that the atoms did not interact with their periodic images at any time. The Lennard–Jones and Coulombic interactions in all the systems were truncated at cut-off distances of 1.0 and 1.5 nm, respectively. The particle-Ewald method was applied to account for the long-range electrostatic interactions [58] for the water and ice molecules, with 0 nm start switching distance from real to k-space. The LINCS algorithm was applied to constrain bond vibration in order to use a longer time step of 0.002 ps [59]. The simulation system was set in a NVT ensemble at varied temperatures depending on whether ice or water was investigated, and use sthe Nosé–Hoover coupling method to maintain the simulation temperature [60,61], with a coupling time constant τ T = 0.4 ps .
First, the steepest descent algorithm was applied to relax the atomistic structures in the simulation system by energy minimisation. The aim of this energy minimisation was to remove any possible close atom contacts. Then, system equilibration was performed. With experience from a similar ice cube system on silicon and graphene [39], temperatures of 180 K were applied to test ice adhesion strength, while temperatures of 275 K were applied to investigate the water contact angle. For the larger systems (Systems C and D in Table 2), the temperature to test the water contact angle was increased to 300 K in order to decrease the remnants of ice crystal in the system after equilibration. It should be noted that lower temperature can lead to higher ice adhesion in experiments, owing to the unclear changes of the ice–substrate interfaces at low temperature [62]. The atomistic surface model used here can not capture this temperature effect on ice adhesion.
The graphene surface was fixed during simulations, such that it represented an inert wall. This fixing does not affect the contact angle, and reduces the computation time [63].
For the ice adhesion simulations, the systems were equilibrated for 20 ns . The final equilibrated structures were used for force-probe MD simulations to determine ice adhesion strength. The ice adhesion strength was, as mentioned, defined by Equation (4), and was calculated by the simulation system as pulling the ice cube perpendicular to the surface, similar to an experimental tensile test [16]. To detach the ice, the center of mass (COM) of the ice cube was linked to a moving virtual harmonic spring with a spring constant of 5000 kJ mol 1 nm 2 . The spring started at the COM of the ice cube and moved with a constant speed of 0.5 nm ns 1 perpendicular to the graphene surface. At the same time, a counter force acted on the COM of the graphene surface. The pulling force generated by the displacement between the spring and the ice cube COM was collected every 5 ps . The ice adhesion strength was determined by collecting the force peak value ( F m a x ) from each independent simulations, and normalising by the contact area of the ice cube. For the larger systems, Systems C and D in Table 2, the spring constant was increased to 10,000 kJ mol−1nm−2 to ensure ice detachment for the highest values of interaction energies.
The water contact angle was calculated by applying the algorithm presented by Khalkhali et al. [64]. This algorithm calculates the contact angle along the contact line and provides an angular distribution, which is useful for a more thorough analysis of the droplet. Furthermore, the algorithm does not assume a spherical droplet. Therefore, the algorithm can be applied to droplets with less regular shapes, as was the case for several of the water droplets in this study. Independent equilibrated water droplets were adopted for contact angle analysis in each system. Snapshots of the analysis of the water contact angles and distributions, maximum detachment force for ice adhesion strength calculations, and ice structure root mean squared deviation (RMSD) can be found in Figures S3–S6, respectively. The effect of changing the box size in the z-dimension and the spring constant in the determination of the ice adhesion strength is also shown in Figure S7. It can be seen that neither the spring constant nor the box size has significant impact on the calculated ice adhesion strength in the simulations.

4. Results

Figure 5 shows the average water contact angle as function of the changing interaction potential ε for System A. It can be seen that the contact angle scales almost linearly with the chosen values of the energy well depth. For the system with the original energy well depth ε 0 , the water contact angle is calculated to be 73.49 ± 3.44°. The contact angle of graphite and graphene has been studied by atomistic simulations previously, with reported contact angles ranging from 83° for graphite [64] to a predicted 90–95° for graphene [65]. Although the contact angles obtained in this study are below these values, the studies in literature used the SPC/E forcefield, which may give different contact angle values. Furthermore, the present system has a fixed ideal surface, and contact angle is impacted by surface roughness and impurities. As such, the contact angles in this study are within the range to be expected for water wettability on graphene.
The ice adhesion strength of System A is displayed in Figure 6, also as a function of the interaction potential ε . It can be seen that the trend of the ice adhesion strength is similar to that seen for the ideal relation between ice adhesion strength and contact angle shown in Figure 2a. For the system with the original interaction energy ε 0 , the ice adhesion strength was found to be 487 ± 22 MPa . This ice adhesion strength is significantly higher than previously found for this type of system, which was 259 ± 21 MPa [39]. However, the previous study allowed flexible graphene sheets, while the present study has fixed the graphene sheet. It is likely this difference which have caused the disagreement in reported ice adhesion strengths. Furthermore, the ice adhesion strength of different system sizes and spring constants are all consistent in value, as shown in Table S1.
In Figure 7, the results of the ice adhesion strength as function of the water contact angles are displayed. This figure displays all data points from the combination of Figure 5 and Figure 6, and includes a fitting of the theoretical relation from Equation (7). As can be seen in Figure 7, the theoretical relation matches the simulation results with a high significance. This similarity between simulation results and theoretical relation is in contrast with the absence of similar trends in Figure 3.
In Figure 8, the contact angle for all system sizes can be seen for the seven different interaction energies. It can be seen that the contact angles are relatively constant, although there are large outliers in the extreme cases and for the largest systems tested. For System B, which is the smallest system, the water droplets deplete to a water layer already at interaction energy of 1.5 ε 0 , and the higher interactions energies were therefore not investigated for this system. For System D, it can be seen that the contact angles are fairly large relative to the other systems, especially for the highest interaction energies.
The ice adhesion strength as function of the interaction energies is shown in Figure 9. It can be seen that the ice adhesion strength is very similar for all systems, with the greatest variance at the highest interaction energy. Furthermore, System D displays larger differences of measured ice adhesion strength than for each interaction energy than the other systems.
When combining the contact angles and ice adhesion strengths displayed in Figure 8 and Figure 9, the ice adhesion strength as function of the contact angle can be viewed and compared to Figure 2 and Equation (7). In Figure 10, the correlation between this theoretical relation and the simulation results can be seen, with the fitting and level of significance included. All systems have significances above R 2 = 0.75 , with significances above R 2 = 0.95 for Systems A and C. Hence, it is the smallest and largest systems which differ the most from the theoretical relation due to the increase of outliers in the results.
Separated results from the four different systems can be found in the Supplementary Materials.

5. Discussion

From the high level of significance seen in Figure 10, it is clear that the theoretical relation from Equation (7) holds for simulations at the nanoscale for water molecules situated on an ideal surface and for adhesive perpendicular detachment of a perfect ice crystal. The same relation is, however, not agreed upon from an experimental point of view.
The fact that the theoretical relation between the ice adhesion strength and the water contact angle is found in atomistic simulations indicates that the disagreement from experiments, as shown in Figure 2 and Figure 3, comes from experimental factors and not from properties of water molecules in liquid and solid form on the same surface. Such an experimental disagreement might stem from material or substrate deformations during detachment, an incomplete ice–solid contact [36], the so-called nanoscale crack initiators [6] or the difference in other surface parameters for the real surfaces during experiments compared to the ideal surface investigated in this study. Several surface parameters which are known to impact the ice adhesion strength, such as material softness and elastic modulus [14], have not been included in this study. Furthermore, real materials are often deformed upon detachment, and work may be done in forming micro-cracks within the ice. While a perfectly smooth and ideal surface has been studied here, a real surface will contain defects, interlocking and other irregularities. As a result, we cannot expect to match experimental observations with the current simulations. The work spent to detach ice from a surface is typically much more than the work of adhesion, due to experimental deformations and mechanisms [36]. It follows that the work of adhesion W a might be considered a theoretical minimal adhesion strength for a given material.
The ice adhesion strengths obtained through the simulations in this study are higher than experimental values for similar systems, as well as previously performed simulations [39]. As stated above, the difference from previous simulations likely results in the fixing of the graphene surface. For the difference to experimental results, this fixing of the graphene surface is probably also an impacting factor. Furthermore, in contrast to the majority of experimental ice adhesion tests utilising shear force [16], the ice adhesion strength in this study was determined through tensile ice detachment. There was evidence indicating the importance of both shear and tensile stresses to surface ice adhesion [66]. It has been shown previously that tensile failure results in much higher ice adhesion strengths than shear failures [67], and more often results in a cohesive fracture [16]. However, as the simulation system is ideal and ice is detached through COM movement of the ice sample, an adhesive failure is assured. Furthermore, as the ice adhesion strength values obtained in this study are consistent for the different systems and configurations included, it may be concluded that the ice adhesion strengths represent a realistic trend although the values are higher than expected experimentally.
By testing several different system sizes, as described in Table 2, the size effect of water contact angle and ice adhesion strength may be investigated. It has been stated previously that the droplet size impacts the contact angle [68]. For systems similar to the one investigated here, it has been found that increasing droplet sizes results in narrower contact angle distributions [64]. Furthermore, fluctuations in the droplet shape decreases for larger droplets. Both effects are proposed to originate from from higher sphericality in larger droplets. For the simulations performed in this study, the probability distributions of one simulation for each system size can be seen in Figure S11. This figure shows very similar probability distributions, except for System D. However, the higher contact angle and non-uniform probability distribution of this system is likely caused by an unmelted remnant of the original ice crystal.
As shown in Figure 10, the amplitude of the fitting of Equation (7) seems to scale with the size of the system. This scaling indicates that there is a size effect present. In Figure 8 and Table S2, it can be seen that the contact angle increases with increases of system sizes. Overall, however, it is thought that the contact angle decreases as the droplet size increases [63,64,69,70]. The reason for this disagreement is unclear, but as the different contact angles obtained in this study are relatively similar and often within the range of deviation, the size effect may be less than previously thought, and the effect of the fitting amplitude might be due to the combined size effect of the water droplets and ice adhesion strength.
In this study, the contact angles investigated were the so-called static contact angle, as described with Young’s equation from Equation (1) and Figure 1. However, as can be seen in the literature [22,23,24,25,71] and Figure 3, wettability is most often referred to as the receding contact angle, or contact angle hysteresis, when compared with the ice adhesion strength. Due to resources and because the dynamic contact angles are more computationally demanding than the static contact angles, only the static contact angle was investigated here. The next step will be to include the dynamic contact angles, such as the advancing and receding contact angle as well as the contact angle hysteresis, and see if Equation (7) holds for these measures of the wettability as well.
Future work for continuing to probe the relation between the ice adhesion strength and wettability of a surface thus includes investigating the dynamic contact angles, in addition to testing other surfaces. This study tested only one type of ideal surface, and to change to a metallic surface might change the simulation results. Furthermore, surfaces with texture and nanostructures must be investigated for ice adhesion strength and wettability. In addition, only contact angles obtained at the nanoscale can be investigated in atomic simulations. Due to size-effects for nanoscale systems, the contact angles obtained in molecular dynamics simulations are not necessarily transferable to macroscopic contact angles [65,68]. Further work should thus also include a comparison between wettability measured obtained at the nanoscale and experimental results on macroscopic scale. Such a comparison may be carried out for instance by the dry surface simulation approach [72].
An effect of probing the relation between ice adhesion strength and water contact angle in atomistic simulations is that the system created is idealistic. In experimental situations, the contact angle of a smooth surface, such as the surface simulated in this study, cannot surpass 120°. However, by tuning the interaction potential directly in the atomistic simulations, the graphene surface can attain contact angles of more than 150°, as shown in Figure 8. As a result of the artificiality of the surface, the results of the molecular dynamics simulations presented in this study cannot be directly transferred to real systems. Furthermore, the small sizes of atomistic systems give rise to obvious fluctuations in water contact angles. The system sizes effect on contact angle and ice adhesion also play significant roles in the results [39,68,73], as depicted in Figure 8, Figure 9 and Figure 10. Nonetheless, the results here shed light on the fundamental relation between water and ice situated on a surface, and bring us one step closer to the fundamental relation between ice adhesion and wettability.

6. Conclusions

In this study, the correlation between water contact angle and ice adhesion was investigated by utilising atomistic modelling and molecular dynamics simulations. By comparing the results from ice adhesion calculations by detaching an ice sample normal to a graphene surface and water contact angle on the same surface, the relation from thermodynamic theory is reproduced. This correlation indicates that the discrepancy in experimental results stems from experimental parameters and not the properties of the ice–solid or water–solid interactions. The reproduction of the theoretical relation between wettability and ice adhesion at the nanoscale is important due to the gap in understanding between experimental observations and theoretical models. It is important to note that there are many other factors, for instance temperature and nanoscale topography, affecting local wetting and ice adhesion. The full relationship between microscopic wetting and ice adhesion is far from being understood. The results presented here represent a step towards a more thorough understanding of the fundamental mechanisms of ice adhesion, and it relation to water wettability.

Supplementary Materials

The following are available online at https://www.mdpi.com/2079-6412/10/4/379/s1, Table S1: Mean value and standard deviation for ice adhesion strength of simulation systems with different sizes and spring constants. Table S2: Mean contact angles and standard deviations for the four different systems and the different interaction energies. Figure S1: The four simulation systems in Table 2 with equilibrated water droplets. Figure S2: The four simulation systems in Table 2 with ice samples before detachment. Figure S3: Illustration of the quickhull-algorithm for mapping the droplet. Figure S4: Illustration of the contact angle probability distribution. Figure S5: The resulting force–time curve when detaching an ice cube from the graphene surface. Figure S6: Root mean square deviation of ice for the ice detachment process Figure S7: Effect of changing simulation parameters on the recorded ice adhesion strength. Figure S8 Contact angle as function of interaction potential for the four different system sizes. Figure S9: Ice adhesion strength as function of interaction potential for the four different system sizes. Figure S10: Ice adhesion strength as function of contact angle with fitting from Equation (7) for the four different system sizes. Figure S11: Contact angle distributions for the first simulations performed with interaction energy for the four different system sizes.

Author Contributions

All authors contributed in conceptualisation, methodology, and writing—review and editing; software, S.R. and S.X.; validation, S.R. and S.X.; formal analysis, S.R.; investigation, S.R.; resources, S.X.; data curation, S.R. and S.X.; writing—original draft preparation, S.R.; visualisation, S.R.; supervision, S.X., J.H., and Z.Z.; project administration, J.H. and Z.Z.; and funding acquisition, J.H. and Z.Z. All authors have read and agreed to the published version of the manuscript.

Funding

This research was funded by the Norwegian Research Council FRINATEK project Towards Design of Super-Low Ice Adhesion Surfaces (SLICE, 250990). The funding sources had no involvement in designing the study or the publication.

Conflicts of Interest

The authors declare no conflicts of interest.

References

  1. Lv, J.; Song, Y.; Jiang, L.; Wang, J. Bio-inspired strategies for anti-icing. ACS Nano 2014, 8, 3152–3169. [Google Scholar] [CrossRef] [PubMed]
  2. Brassard, J.; Laforte, C.; Guerin, F.; Blackburn, C. Icephobicity: Definition and Measurement Regarding Atmospheric Icing. In Advances in Polymer Science; Springer: Berlin/Heidelberg, Germany, 2017. [Google Scholar] [CrossRef]
  3. Kreder, M.J.; Alvarenga, J.; Kim, P.; Aizenberg, J. Design of anti-icing surfaces: Smooth, textured or slippery? Nat. Rev. Mater. 2016, 1, 1–15. [Google Scholar] [CrossRef]
  4. Hejazi, V.; Sobolev, K.; Nosonovsky, M. From superhydrophobicity to icephobicity: Forces and interaction analysis. Sci. Rep. 2013, 3. [Google Scholar] [CrossRef] [PubMed] [Green Version]
  5. Sojoudi, H.; Wang, M.; Boscher, N.D.; McKinley, G.H.; Gleason, K.K. Durable and scalable icephobic surfaces: Similarities and distinctions from superhydrophobic surfaces. Soft Matter 2016, 12, 1938–1963. [Google Scholar] [CrossRef] [Green Version]
  6. He, Z.; Xiao, S.; Gao, H.; He, J.; Zhang, Z. Multiscale Crack Initiators Promoted Super-Low Ice Adhesion Surfaces. Soft Matter 2017, 13, 6562–6568. [Google Scholar] [CrossRef]
  7. Varanasi, K.K.; Deng, T.; Smith, J.D.; Hsu, M.; Bhate, N. Frost formation and ice adhesion on superhydrophobic surfaces. Appl. Phys. Lett. 2010, 97, 234102. [Google Scholar] [CrossRef]
  8. Dotan, A.; Dodiuk, H.; Laforte, C.; Kenig, S. The Relationship between Water Wetting and Ice Adhesion. J. Adhes. Sci. Technol. 2009, 23, 1907–1915. [Google Scholar] [CrossRef]
  9. Chen, J.; Liu, J.; He, M.; Li, K.; Cui, D.; Zhang, Q.; Zeng, X.; Zhang, Y.; Wang, J.; Song, Y. Superhydrophobic surfaces cannot reduce ice adhesion. Appl. Phys. Lett. 2012, 101. [Google Scholar] [CrossRef]
  10. Wang, F.; Ding, W.; He, J.; Zhang, Z. Phase transition enabled durable anti-icing surfaces and its DIY design. Chem. Eng. J. 2019, 360, 243–249. [Google Scholar] [CrossRef]
  11. Beemer, D.L.; Wang, W.; Kota, A.K. Durable gels with ultra-low adhesion to ice. J. Mater. Chem. A 2016, 4, 18253–18258. [Google Scholar] [CrossRef]
  12. Irajizad, P.; Al-Bayati, A.; Eslami, B.; Shafquat, T.; Nazari, M.; Jafari, P.; Kashyap, V.; Masoudi, A.; Araya, D.; Ghasemi, H. Stress-Localized Durable Icephobic Surfaces. Mater. Horiz. 2019, 6, 758–766. [Google Scholar] [CrossRef]
  13. Golovin, K.; Dhyani, A.; Thouless, M.D.; Tuteja, A. Low–interfacial toughness materials for effective large-scale deicing. Science 2019, 364, 371. [Google Scholar] [CrossRef] [PubMed]
  14. He, Z.; Zhuo, Y.; He, J.; Zhang, Z. Design and Preparation of Sandwich-Like Polydimethylsiloxane (PDMS) Sponges with Super-Low Ice Adhesion. Soft Matter 2018, 14, 4846–4851. [Google Scholar] [CrossRef] [PubMed]
  15. Work, A.; Lian, Y. A critical review of the measurement of ice adhesion to solid substrates. Prog. Aerosp. Sci. 2018, 98, 1–26. [Google Scholar] [CrossRef]
  16. Rønneberg, S.; He, J.; Zhang, Z. The need for standards in low ice adhesion surface research: A critical review. J. Adhes. Sci. Technol. 2019, 1–29. [Google Scholar] [CrossRef]
  17. Zhao, T.Y.; Jones, P.R.; Patankar, N.A. Thermodynamics of sustaining liquid water within rough icephobic surfaces to achieve ultra-low ice adhesion. Sci. Rep. 2019, 9, 258. [Google Scholar] [CrossRef]
  18. He, Z.; Vågenes, E.T.; Delabahan, C.; He, J.; Zhang, Z. Room Temperature Characteristics of Polymer-Based Low Ice Adhesion Surfaces. Sci. Rep. 2017, 7, 42181. [Google Scholar] [CrossRef] [Green Version]
  19. Petrenko, V.F.; Peng, S. Reduction of ice adhesion to metal by using self-assembling monolayers (SAMs). Can. J. Phys. 2003, 81, 387–393. [Google Scholar] [CrossRef]
  20. Sarshar, M.; Swarctz, C.; Hunter, S.; Simpson, J.; Choi, C.H. Effects of contact angle hysteresis on ice adhesion and growth on superhydrophobic surfaces under dynamic flow conditions. Colloid Polym. Sci. 2013, 291, 427–435. [Google Scholar] [CrossRef]
  21. Chen, D.; Gelenter, M.D.; Hong, M.; Cohen, R.E.; McKinley, G.H. Icephobic Surfaces Induced by Interfacial Nonfrozen Water. ACS Appl. Mater. Interfaces 2017, 9, 4202–4214. [Google Scholar] [CrossRef]
  22. Meuler, A.J.; Smith, J.D.; Varanasi, K.K.; Mabry, J.M.; McKinley, G.H.; Cohen, R.E. Relationships between Water Wettability and Ice Adhesion. ACS Appl. Mater. Interfaces 2010, 2, 3100–3110. [Google Scholar] [CrossRef]
  23. Fillion, R.M.; Riahi, A.R.; Edrisy, A. Design factors for reducing ice adhesion. J. Adhes. Sci. Technol. 2017, 31, 2271–2284. [Google Scholar] [CrossRef]
  24. Janjua, Z.A.; Turnbull, B.; Choy, K.L.; Pandis, C.; Liu, J.; Hou, X.; Choi, K.S. Performance and durability tests of smart icephobic coatings to reduce ice adhesion. Appl. Surf. Sci. 2017, 407, 555–564. [Google Scholar] [CrossRef]
  25. Kulinich, S.A.; Farzaneh, M. How wetting hysteresis influences ice adhesion strength on superhydrophobic surfaces. Langmuir 2009, 25, 8854–8856. [Google Scholar] [CrossRef] [PubMed]
  26. Karmouch, R.; Ross, G.G. Experimental Study on the Evolution of Contact Angles with Temperature Near the Freezing Point. J. Phys. Chem. C 2010, 114, 4063–4066. [Google Scholar] [CrossRef]
  27. Bascom, W.D.; Cottington, R.L.; Singleterry, C.R. Ice adhesion to hydrophilic and hydrophobic surfaces. J. Adhes. 1969, 1, 246–263. [Google Scholar] [CrossRef]
  28. Drelich, J.W. Contact angles: From past mistakes to new developments through liquid-solid adhesion measurements. Adv. Colloid Interface Sci. 2019, 267, 1–14. [Google Scholar] [CrossRef] [PubMed]
  29. Koivuluoto, H.; Stenroos, C.; Ruohomaa, R.; Bolelli, G.; Lusvarghi, L.; Vuoristo, P. Research on icing behavior and ice adhesion testing of icephobic surfaces. In Proceedings of the International Workshop on Atmospheric Icing of Structures (IWAIS), Uppsala, Sweden, 28 June–3 July 2015. [Google Scholar]
  30. Liu, J.; Zhu, C.; Liu, K.; Jiang, Y.; Song, Y.; Francisco, J.S.; Zeng, X.C.; Wang, J. Distinct ice patterns on solid surfaces with various wettabilities. Proc. Natl. Acad. Sci. USA 2017, 114, 11285–11290. [Google Scholar] [CrossRef] [PubMed] [Green Version]
  31. Marmur, A.; Della Volpe, C.; Siboni, S.; Amirfazli, A.; Drelich, J.W. Contact angles and wettability: Towards common and accurate terminology. Surf. Innov. 2017, 5, 3–8. [Google Scholar] [CrossRef] [Green Version]
  32. Young, T., III. An essay on the cohesion of fluids. Philos. Trans. R. Soc. Lond. 1805, 95, 65–87. [Google Scholar] [CrossRef]
  33. Wenzel, R.N. Resistance of Solid Surfaces to Wetting by Water. Ind. Eng. Chem. 1936, 28, 988–994. [Google Scholar] [CrossRef]
  34. Cassie, A.B.D. Contact angles. Discuss. Faraday Soc. 1948, 3, 11–16. [Google Scholar] [CrossRef]
  35. Cassie, A.B.D.; Baxter, S. Wettability of porous surfaces. Trans. Faraday Soc. 1944, 40, 546–551. [Google Scholar] [CrossRef]
  36. Makkonen, L. Ice Adhesion—Theory, Measurements and Countermeasures. J. Adhes. Sci. Technol. 2012, 26, 413–445. [Google Scholar] [CrossRef]
  37. Makkonen, L. Surface Melting of Ice. J. Phys. Chem. B 1997, 101, 6196–6200. [Google Scholar] [CrossRef]
  38. Golovin, K.; Kobaku, S.P.R.; Lee, D.H.; DiLoreto, E.T.; Mabry, J.M.; Tuteja, A. Designing durable icephobic surfaces. Sci. Adv. 2016, 2. [Google Scholar] [CrossRef] [PubMed] [Green Version]
  39. Xiao, S.; He, J.; Zhang, Z. Nanoscale deicing by molecular dynamics simulation. Nanoscale 2016, 8, 14625. [Google Scholar] [CrossRef]
  40. Abascal, J.L.F.; Sanz, E.; García Fernández, R.; Vega, C. A potential model for the study of ices and amorphous water: TIP4P/Ice. J. Chem. Phys. 2005, 122, 234511. [Google Scholar] [CrossRef] [Green Version]
  41. Berendsen, H.J.C.; Postma, J.P.M.; van Gunsteren, W.F.; Hermans, J. Interaction Models for Water in Relation to Protein Hydration. In Interaction Forces; Pullman, B., Ed.; The Jerusalem Symposia on Quantum Chemistry and Biochemistry; Springer: Dordrecht, The Netherlands, 1981; Volume 14, pp. 331–342. [Google Scholar] [CrossRef]
  42. Berendsen, H.J.C.; Grigera, J.R.; Straatsma, T.P. The missing term in effective pair potentials. J. Phys. Chem. 1987, 91, 6269–6271. [Google Scholar] [CrossRef]
  43. Jorgensen, W.L.; Chandrasekhar, J.; Madura, J.D.; Impey, R.W.; Klein, M.L. Comparison of simple potential functions for simulation liquid water. J. Chem. Phys. 1983, 79, 926–935. [Google Scholar] [CrossRef]
  44. Vega, C.; De Miguel, E. Surface tension of the most popular models of water by using the test-area simulation method. J. Chem. Phys. 2007, 126, 154707. [Google Scholar] [CrossRef] [PubMed] [Green Version]
  45. Espinosa, J.R.; Vega, C.; Sanz, E. Ice–water interfacial free energy for the TIP4P, TIP4P/2005, TIP4P/Ice, and mW models as obtained from the Mold integration technique. J. Phys. Chem. C 2016, 120, 8068–8075. [Google Scholar] [CrossRef]
  46. Jorgensen, W.L.; Tirado-Rives, J. The OPLS [optimized potentials for liquid simulations] potential functions for proteins, energy minimizations for crystals of cyclic peptides and crambin. J. Am. Chem. Soc. 1988, 110, 1657–1666. [Google Scholar] [CrossRef] [PubMed]
  47. Jorgensen, W.L.; Maxwell, D.S.; Tirado-Rives, J. Development and Testing of the OPLS All-Atom Force Field on Conformational Energetics and Properties of Organic Liquids. J. Am. Chem. Soc. 1996, 118, 11225–11236. [Google Scholar] [CrossRef]
  48. Bartels-Rausch, T.; Bergeron, V.; Cartwright, J.H.E.; Escribano, R.; Finney, J.L.; Grothe, H.; Gutierrez, P.J.; Haapala, J.; Kuhs, W.F.; Pettersson, J.B.C.; et al. Ice structures, patterns, and processes: A view across the ice-fields. Rev. Mod. Phys 2012, 84, 885–944. [Google Scholar] [CrossRef] [Green Version]
  49. Wilen, L.A.; Wettlaufer, J.S.; Elbaum, M.; Schick, M. Dispersion-force effects in interfacial premelting of ice. Phys. Rev. B 1995, 52, 12426–12433. [Google Scholar] [CrossRef]
  50. Ryzhkin, I.A.; Petrenko, V.F. Physical mechanisms responsible for ice adhesion. J. Phys. Chem. B 1997, 101, 6267–6270. [Google Scholar] [CrossRef]
  51. de Ruijter, M.J.; Blake, T.D.; De Coninck, J. Dynamic Wetting Studied by Molecular Modeling Simulations of Droplet Spreading. Langmuir 1999, 15, 7836–7847. [Google Scholar] [CrossRef]
  52. Moore, E.B.; Allen, J.T.; Molinero, V. Liquid-Ice Coexistence below the Melting Temperature for Water Confined in Hydrophilic and Hydrophobic Nanopores. J. Phys. Chem. C 2012, 116, 7507–7514. [Google Scholar] [CrossRef]
  53. Singh, J.K.; Müller-Plathe, F. On the characterization of crystallization and ice adhesion on smooth and rough surfaces using molecular dynamics. Appl. Phys. Lett. 2014, 104, 021603. [Google Scholar] [CrossRef] [Green Version]
  54. Xiao, S.; Zhang, Z.; He, J. Atomistic dewetting mechanics of Wenzel and monostable Cassie–Baxter states. Phys. Chem. Chem. Phys. 2018, 20, 24759–24767. [Google Scholar] [CrossRef] [Green Version]
  55. Mabudi, A.; Noaparast, M.; Gharabaghi, M.; Vasquez, V. A molecular dynamics study on the wettability of graphene-based silicon dioxide (glass) surface. Colloids Surf. A Physicochem. Eng. Asp. 2019, 569, 43–51. [Google Scholar] [CrossRef]
  56. Terzyk, A.P.; Bryk, P.; Korczeniewski, E.; Kowalczyk, P.; Zawadzka, A.; Płóciennik, P.; Wisśniewski, M.; Wesołowski, R.P. Water nanodroplet on a hydrocarbon “Carpet”—The mechanism of water contact angle stabilization by airborne contaminations on Graphene, Au, and PTFE surfaces. Langmuir 2018, 35, 420–427. [Google Scholar] [CrossRef] [PubMed]
  57. Abraham, M.; van der Spoel, D.; Lindahl, E.; Hess, B.; GROMACS Development Team. GROMACS User Manual Version 5.1.2. 2016. Available online: www.gromacs.org (accessed on 16 March 2020).
  58. Darden, T.; York, D.; Pedersen, L. Particle mesh Ewald: An Nlog(N) method for Ewald sums in large systems. J. Chem. Phys. 1993, 98, 10089–10092. [Google Scholar] [CrossRef] [Green Version]
  59. Hess, B.; Bekker, H.; Berendsen, H.J.C.; Fraaije, J.G.E.M. LINCS: A linear constraint solver for molecular simulations. J. Comput. Chem. 1997, 18, 1463–1472. [Google Scholar] [CrossRef]
  60. Nosé, S. A molecular dynamics method for simulations in the canonical ensemble. Mol. Phys. 1984, 52, 255–268. [Google Scholar] [CrossRef]
  61. Hoover, W.G. Canonical dynamics: Equilibrium phase-space distributions. Phys. Rev. A 1985, 31, 1695–1697. [Google Scholar] [CrossRef] [Green Version]
  62. Wang, F.; Xiao, S.; Zhuo, Y.; Ding, W.; He, J.; Zhang, Z. Liquid layer generators for excellent icephobicity at extremely low temperatures. Mater. Horiz. 2019, 6, 2063–2072. [Google Scholar] [CrossRef] [Green Version]
  63. Werder, T.; Walther, J.H.; Jaffe, R.L.; Halicioglu, T.; Koumoutsakos, P. On the Water-Carbon Interaction for Use in Molecular Dynamics Simulations of Graphite and Carbon Nanotubes. J. Phys. Chem. B 2003, 107, 1345–1352. [Google Scholar] [CrossRef]
  64. Khalkhali, M.; Kazemi, N.; Zhang, H.; Liu, Q. Wetting at the nanoscale: A molecular dynamics study. J. Chem. Phys. 2017, 146, 114704. [Google Scholar] [CrossRef]
  65. Taherian, F.; Marcon, V.; van der Vegt, N.F.A.; Leroy, F. What Is the Contact Angle of Water on Graphene? Langmuir 2013, 29, 1457–1465. [Google Scholar] [CrossRef]
  66. Maitra, T.; Jung, S.; Giger, M.E.; Kandrical, V.; Ruesch, T.; Poulikakos, D. Superhydrophobicity vs. ice adhesion: The quandary of robust icephobic surface design. Adv. Mater. Interfaces 2015, 2, 1500330. [Google Scholar] [CrossRef]
  67. Jellinek, H.H.G. Adhesive properties of ice. J. Colloid Sci. 1959, 14, 268–280. [Google Scholar] [CrossRef]
  68. Good, R.J. Contact angle, wetting, and adhesion: A critical review. J. Adhes. Sci. Technol. 1992, 6, 1269–1302. [Google Scholar] [CrossRef]
  69. Ramírez, R.; Singh, J.K.; Müller-Plathe, F.; Böhm, M.C. Ice and water droplets on graphite: A comparison of quantum and classical simulations. J. Chem. Phys. 2014, 141, 204701. [Google Scholar] [CrossRef] [PubMed]
  70. Dutta, R.C.; Khan, S.; Singh, J.K. Wetting transition of water on graphite and boron-nitride surfaces: A molecular dynamics study. Fluid Phase Equilib. 2011, 302, 310–315. [Google Scholar] [CrossRef]
  71. Makkonen, L. Back to the basics: Wettability, icing and ice adhesion. In Proceedings of the International Workshop on Atmospheric Icing of Structures (IWAIS), Uppsala, Sweden, 28 June–3 July 2015. [Google Scholar]
  72. Leroy, F.; Müller-Plathe, F. Dry-Surface Simulation Method for the Determination of the Work of Adhesion of Solid-Liquid Interfaces. Langmuir 2015, 31, 8335–8345. [Google Scholar] [CrossRef]
  73. Rafiee, J.; Mi, X.; Gullapalli, H.; Thomas, A.V.; Yavari, F.; Shi, Y.; Ajayan, P.M.; Koratkar, N.A. Wetting transparency of graphene. Nat. Mater. 2012, 11, 217–222. [Google Scholar] [CrossRef]
Figure 1. Illustration of the most general water contact angle θ . The surface energies γ correspond to the parameters of Young’s equation in Equation (1), where γ w , s , γ s and γ w refer to the specific energies of the solid–water, solid–vapour and water–vapour interfaces, respectively.
Coatings 10 00379 g001
Figure 2. Two forms of the general relation between ice adhesion strength τ and water contact angle θ on a generic surface with properties C0; (a) Normalised ice adhesion strength as function of the cosine of the contact angle (1 + cos θ); (b) Normalised ice adhesion strength as function of the cosine of the contact angle (1 + cos θ). The relation is described by Equation (7).
Coatings 10 00379 g002
Figure 3. Experimental results on the relation between receding contact angle and ice adhesion strength for a collection of surfaces; (a) Results from Meuler et al. [22], with 22 samples. Adapted with permission [22], 2010 American Chemical Society; (b) Results from He et al. [18], with 24 samples; (c) Results from Golovin et al. [38], with 108 samples. Ice adhesion is average value; (d) Illustration of receding contact angle compared to the equilibrium contact angle in Figure 1. The relation from Equation (7) and Figure 2b is clearest for (a), and can be seen for higher ice adhesion strengths in (b). The relation cannot be seen in (c). The definition of the receding contact angle is shown in (d).
Coatings 10 00379 g003
Figure 4. Illustrations of the simulation system in this study of water molecules on a graphene surface, here represented by System A. This system had interaction potential ε0 = 2.9288 × 10⁻¹ kJmol−1nm−2. (a) Water drop at T = 275 K; (b) Ice cube at T = 180 K.
Coatings 10 00379 g004
Figure 5. Water contact angle θ as function of the interaction potential ε for the System A. The values of ε can be found in Table 1.
Coatings 10 00379 g005
Figure 6. Ice adhesion strength τ as function of interaction potential ε for System A. The values of ε can be found in Table 1.
Coatings 10 00379 g006
Figure 7. Ice adhesion strength as function of contact angle, with the relation from Equation (7) fitted to the data. It can be seen that the fit of the general relation shows a very high level of significance.
Coatings 10 00379 g007
Figure 8. Contact angle as function of interaction energy ε for all system sizes. Separate figures can be seen in Figure S8.
Coatings 10 00379 g008
Figure 9. Ice adhesion strength as function of interaction energy ε for all system sizes. Separate figures can be seen in Figure S9.
Coatings 10 00379 g009
Figure 10. Overview of the correlation with Equation (7) for the four systems investigated in this study. The ice adhesion strength has been normalised with respect to the mean value from the interaction energy ε 0 . Data from the four individual systems is given in Figure S10.
Coatings 10 00379 g010
Table 1. Overview of the energy well depths, or interaction energies, ε , applied in the seven different simulation systems to change the water contact angle. All systems were simulated five times to obtain averages.
ε Value [ kJ mol 1 nm 2 ]
0.05 ε 0 1.4644 × 10 2
0.1 ε 0 2.9288 × 10 2
0.5 ε 0 1.4644 × 10 1
ε 0 2.9288 × 10 1
1.5 ε 0 4.3932 × 10 1
2 ε 0 5.8576 × 10 1
2.5 ε 0 7.3220 × 10 1
Table 2. Overview of the differently sized simulation systems. The different interaction energies ε in Table 1 were applied to all four systems to investigate water contact angles.
SystemNumber of AtomsArea of Graphene SheetArea of Ice–Solid Contact
A 28,376 19.9 nm × 20.3 nm 8.0 nm × 7.6 nm
B7336 8.0 nm × 8.1 nm 4.9 nm × 4.6 nm
C 58,184 19.9 nm × 19.9 nm 14.7 nm × 13.8 nm
D 102,568 26.3 nm × 26.1 nm 19.6 nm × 18.5 nm

