Abstract
A composite coating composed of intermetallic compounds, Al–Si alloys, and an oxide ceramic layer was prepared on TA2 substrate by hot-dipping Al–Si alloy and micro-arc oxidation (MAO) methods. The microstructure and composition distribution of the resulting hot-dipped Al–Si alloy layer and MAO-caused ceramic layer were studied by scanning electron microscope (SEM) and energy dispersive spectrum (EDS). In addition, the phase composition of the diffusion layer obtained by the Al–Si alloy hot-dipping procedure was investigated by electron backscattered diffraction (EBSD), and the phase structure of the MAO-treated layer was studied by X-ray diffraction (XRD) analysis and X-ray photoelectron spectroscopy (XPS). The MAO method can make the hot-dipped Al–Si alloy layer in-situ oxidized to form a ceramic layer. Finally, a three-layer composite coating composed of a diffusion layer formed by the Ti–Al–Si interdiffusion, an Al–Si alloy layer and a ceramic layer was prepared on TA2 substrate. Compared with TA2 substrate, the TA2 sample with a three-layer composite coating has larger friction coefficient and less abrasion loss. The three-layer composite coating can significantly improve the wear resistance of TA2. A technical composite method was developed to the low cost in-situ growth of alumina-based ceramic wear-resistant coatings on TA2 substrate.
1. Introduction
Titanium alloys have been widely used in the aviation, aerospace, chemical, and biomedical sectors owing to their excellent specific strength, corrosion resistance, and biocompatibility [,,,]. Surface techniques can improve the wear resistance, oxidation resistance, biocompatibility, the electrical insulation, and the infrared emission of titanium alloy. The surface coating technology of titanium alloy is a recent research hotspot, and various surface technologies are used to improve the surface properties of titanium alloys. Alumina-based ceramics exhibit high hardness, wear resistance, and good electrical insulation properties. Alumina-based ceramic coatings are deposited on titanium alloy surfaces in order to improve their wear resistance and to electrically insulate the titanium alloy surfaces. The various advanced surface techniques for alumina-based ceramic coatings on titanium alloy are thermal spraying, laser cladding, sol–gel, electron beam remelting, and cathode plasma electrolytic deposition. By thermal spraying, single or composite alumina ceramic coatings (e.g., Al2O3, Al2O3–TiO2, Al2O3–Y2O3, Al2O3–ZrO2) can be prepared on titanium alloy surfaces [,,]. In the laser cladding technology, the composite coatings (e.g., Al2O3, Al2O3–metal, Al2O3 and borides, oxides, and other ceramics) are metallurgically bonded with titanium alloy surfaces [,]. Furthermore, electron beam remelting, the sol-gel method, and in-situ reaction synthesis can be used to prepare alumina-based ceramic coatings on titanium alloys [,]. The novel cathodic plasma electrolytic deposition technology is mainly used to prepare an alumina-containing coating on the surface of the titanium workpiece by a spark discharge on the surface of titanium workpiece as cathode in aluminum-containing electrolyte solutions [,].
The MAO method can be used to form a ceramic coating with TiO2 as the main component by in-situ oxidation on the titanium alloy. In the MAO process, the composite coatings such as TiO2 + SiO2, TiO2 + Al2O3, TiO2 + ZrO2, TiO2 + MoS2, TiO2 + Ag, and TiO2 + graphite can be formed on the titanium alloy substrate to improve the wear resistance, friction, and oxidation resistance of the titanium alloy by the regulation of the electrolyte composition and addition of solid particles in the electrolyte [,,]. Compared with other surface technologies, the MAO exhibits strong adaptability, simple operation, and low cost, and is environmentally friendly. In particular, the MAO coating can be easily prepared in the cavity of parts. Therefore, the preparation of MAO ceramic coatings on titanium alloy surfaces is a recent research hotspot. However, the ceramic coatings using direct MAO preparation on titanium alloy surfaces are mainly TiO2 phase, which exhibits low hardness and poor thermal stability. The preparation of alumina-based ceramic coatings on titanium alloy surfaces with the MAO technology can significantly improve the wear resistance and oxidation resistance of titanium alloys, which are superior to those of TiO2 ceramic coatings. In the hot-dip aluminizing process, a metal substrate is immersed in the molten aluminum. A diffusion layer is formed by the interdiffusion between the liquid aluminum and substrate elements. Consequently, an aluminum coating is formed on the substrate surface when the metal substrate is taken out and cooled. The hot-dip method is simple, inexpensive, and has high maturity. Currently, hot-dip technology is mainly used to prepare the Al and Al–Si alloys on steel surfaces. Moreover, the hot-dipped composition coating, which consists of Fe–Al and Fe–Al–Si intermetallic compound diffusion layers, and Al and Al–Si alloy metal layers, can be prepared to improve the high-temperature resistance, corrosion resistance, and wear resistance of the steel [,,]. After hot-dipping Al and Al–Si on the surface of the steel, the obtained hot-dipped coating is in-situ oxidized to form an Al2O3-based ceramic coating by MAO, which further improves the high-temperature performance and wear resistance of steel [,]. Although hot-dip aluminizing on titanium surfaces has been studied, the research has mainly focused on the formation of Ti–Al and Ti–Al–Si intermetallic compound phases on titanium surfaces in order to improve the oxidation resistance of the titanium alloy [,]. However, there have been few studies on the formation of alumina ceramic coatings by MAO. Therefore, in this study, a metallurgical bonding and in-situ-grown alumina-based ceramic coating was prepared on a titanium surface using the hot-dipping and MAO technologies in order to improve the wear resistance of titanium and titanium alloys.
2. Materials and Methods
The substrate used was TA2 (industrial pure titanium, Ti ≥ 99 wt.%), which was cut into a sample with the size of 60 mm × 12 mm × 1.5 mm. The coating material was Al–10Si alloy. The samples were cleaned with a metal cleaning agent to remove the surface scale, quickly rinsed with alcohol, and immediately dried before being applied with a hot-dip coating.
The hot-dip coating process was carried out in a self-made well-type resistance furnace. The Al–10Si alloy was mechanically cut into small pieces, cleaned, degreased, dried, and placed in an alumina crucible into the well-type electric resistance furnace. The specific process parameters are shown in Table 1. In the hot-dipping process, the surface of the aluminum liquid was covered with a molten aluminum covering agent with 46% KCl, 28% NaCl, and 26% Na3AlF6 (wt.%, Analytical reagent, Sinopharm Chemical Reagent Co., Ltd., Shanghai, China) to prevent the oxidation of the aluminum liquid surface.

Table 1.
Process parameters of hot-dipping Al–Si alloy and micro-arc oxidation (MAO).
After the hot-dipping procedure, the MAO treatment was immediately performed. A DC pulse power source was adopted. The electrolyte was an aqueous solution of Na2SiO3, Na6O18P6, and NaOH (Analytical reagent, Sinopharm Chemical Reagent Co., Ltd., Shanghai, China). The process parameters are shown in Table 1. The temperature of the electrolyte was maintained below 40 °C during the MAO process.
The microstructure was studied with a tungsten filament SEM (TESCAN VEGAII XMU, Brno, Czech Republic), the coating composition was investigated with an EDS (Oxford INCA, Oxford, UK), and the microstructure of the hot-dipped Al–Si layer was investigated with an EBSD (Oxford Nordlys, Oxford, UK) detector. Moreover, the phase structure of the coating was analyzed with an XRD (D/max-2200pc, RIGAKU, Tokyo, Japan). The diffraction analysis conditions were as follows: the anode was made from copper, the diffraction angles 2θ was 20°–90°, the scanning speed was 2°/min, the electron acceleration voltage was 40 kV, and the current was 40 mA. Finally, the surface structure of the MAO-treated layer was detected by XPS (ESCALAB 250Xi, Thermo Fisher Scientific, Waltham, MA, USA).
The pin-on-disc wear test (MS-T3000, Lanzhou Institute of Chemical Physics, Lanzhou, China) was conducted on the composition coatings at room temperature under dry sliding condition. The pin was a Si3N4 ceramic ball with a 5 mm diameter. The disk was the coating samples. The test was performed under a normal load of 0.98 N at a rotational speed of 500 rpm of the coating samples, the sliding time was 20 min, and the diameter of the worn track was 6 mm. The cross-section profile of the wear track was measured using the material surface comprehensive performance tester (MFT-4000, Lanzhou Institute of Chemical Physics, Lanzhou, China). The wear volumes were estimated by calculation using the following equation []:
In Equation (1), Vw is the wear volume, mm3; t is the depth of the wear track, mm; b is the width of the wear track, mm; and r is the radius of the wear track, mm.
Friction coefficient and wear volume of three samples were tested respectively, and the average value of the data obtained from the three samples was used for graphic analysis.
3. Results
3.1. Micrographic Characteristics of Hot-Dipped Al–Si Alloy Layer
Figure 1 shows the cross-sectional microscopic back-scattered electron (BSE) morphology of a hot-dipped Al–Si alloy layer on a TA2 substrate. The resulting Al–Si layer had a two-layer structure; the outer layer was an Al–Si alloy layer, and the inner layer was a diffusion layer formed by the interdiffusion of the Al, Si, and Ti elements. According to the Figure 1a,c, the Al–Si coating had a dense interface without microscopic defects such as cracks or holes. However, it exhibited a small amount of micropore defects and white precipitated products, which mainly existed in the form of sheets or strips that were distributed longitudinally along the cross-section of the Al–Si layer. The white products occurred in the middle and near the surface of the Al–Si layer. Regarding the T1 sample (Figure 1a,b), the formed diffusion layer exhibited the morphology of a needle-like structure; the needle-like tissue was mainly orientated in the longitudinal direction of the cross section, and the root of the needle-like structure (at the interface of the substrate) was integrated into the substrate. Thus, the needle tissue and substrate tissue could not be clearly distinguished. At the interface between the diffusion layer and outer layer, the needle-like structure entered the outer layer, and no clear interface could be observed. Regarding the T2 sample, the observed diffusion layer structure was grey–white and in the form of a block structure; a small amount of needle-like tissue was distributed inside, mainly in the horizontal direction. The interface between the diffusion layer and Al–Si alloy layer was evident. The measured overall thicknesses of the hot-dipped Al–Si alloy coating (including the diffusion and Al–Si alloy layers) of the T1 and T2 samples were 39.01 and 22.95 μm, respectively. The thicknesses of the diffusion layers were 6.33 and 13.44 μm, and the thicknesses of the Al–Si alloy layers were 32.68 and 9.51 μm, respectively.
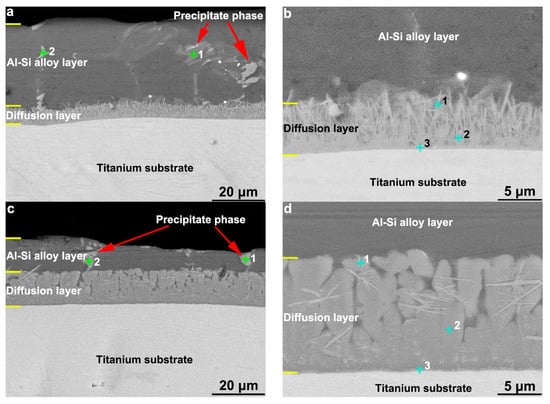
Figure 1.
The cross-sectional morphology of the (a,b) T1 sample and (c,d) T2 sample for hot-dip Al–Si alloy on TA2 substrate.
The distribution of Al, Si, and Ti from the surface to the substrate of the hot-dipped Al–Si alloy coating on the TA2 surface was analyzed by EDS line scanning. The results are shown in Figure 2. The outer layer (Al–Si layer) contained no Ti according to the EDS line scan. In the vicinity of the interface between the Al–Si alloy and diffusion layers, a low Al content and increasing Ti and Si content gradients were discovered. The Al in the diffusion layer of the T1 sample exhibited a lower negative slope than at the interface. The relative Ti and Si contents did not change much, and the distribution curve was basically straight. In the diffusion layer of the T2 sample, the distributions of Al, Ti, and Si were basically the same as those in the T1 sample. However, the negative slope of the Al distribution was lower. At the interfaces between the diffusion layers and substrates of the two samples, the content gradients of Si and Al decreased to zero, and the Ti content gradient increased to the level of that in the TA2 substrate. In the T1 sample (Figure 2a), the Si content increased, and the Al content decreased in the grey–white block structure inside the Al–Si layer, thereby indicating that the Si content of the grey–white block structure was higher than those of the other microstructures in the Al–Si layer. Because the line scan baseline did not pass through the grey–white structure, no similar Si element distribution was observed in the T2 sample. To determine the element contents of the different regions of the diffusion layer and grey–white structure in the Al–Si alloy layer, the elemental contents were analyzed by EDS point scanning. The results are shown in Figure 3 and Figure 4. Points 1, 2, and 3 in Figure 3 correspond to points 1, 2, and 3 (marked by crosses) in Figure 1b,d, respectively. Points 1 and 2 in Figure 4 correspond to points 1 and 2 (marked by crosses) in Figure 1a,c, respectively.
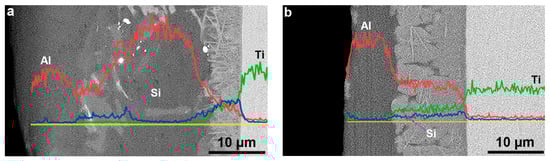
Figure 2.
Al, Si, and Ti elements EDS line analysis of (a) T1 sample and (b) T2 sample for hot-dip Al–Si coating on TA2 substrate.
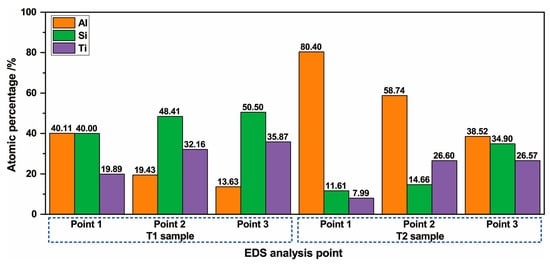
Figure 3.
Results of the EDS analysis of diffusion layer composition of the hot-dip Al–Si layer.
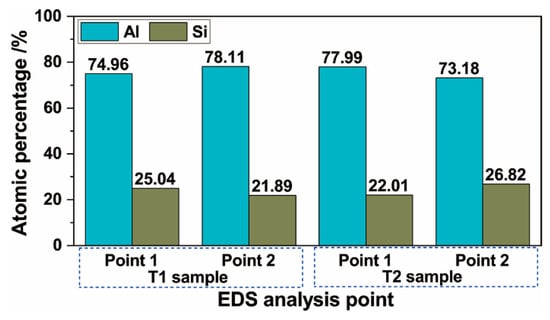
Figure 4.
Results of the EDS analysis of precipitate phase composition of the Al–Si alloy layer.
According to Figure 3, near the surface of the diffusion layer (point 1) in sample T1, the atomic percentages of Al, Si, and Ti were 40.11%, 40%, and 19.89%, respectively. In the center of the diffusion layer, close to the substrate (point 2), the Al content was significantly reduced (19.43%), whereas the Si and Ti contents were slightly increased (48.41% and 32.16%, respectively). Near the interface of the diffusion layer and substrate (point 3), the Al content was further reduced (reduction with a smaller slope, 13.63%), and the Si and Ti contents were further increased (increase with a smaller slope, 50.5% and 35.87%, respectively). In the T2 sample, the Al, Si, and Ti contents in the three analysis points from the surface of the diffusion layer to the interface between the diffusion layer and substrate were similar to those in the T1 sample; the Al content was reduced, and the Si and Ti contents were increased. However, the Al content in the T2 sample was higher than that in the T1 sample. At point 1, the Al content was approximately twice that of the T1 sample at point 1; at points 2 and 3, the Al content was approximately three times those of points 2 and 3 of the T1 sample. In addition, the Si and Ti contents were lower than those of the T1 sample. At points 1 and 2, their contents were approximately one-third of those at the corresponding positions in the T1 sample; at point 3, they were approximately 70% of those of the T1 sample. According to the results of the EDS point scanning analysis, the hot-dipping temperature had a significant influence on the composition of the diffusion layer.
Figure 4 presents the results of the grey–white structure composition in the Al–Si alloy. In the T1 sample, the Al contents were 74.96% and 78.11%, and the Si contents were 25.04% and 21.89% at points 1 and 2, respectively. In the T2 sample, the measured Al contents were 77.99% and 73.18%, and the Si contents were 22.01% and 26.82%, respectively. In the grey–white structure of the two samples, the Al and Si contents remained basically unchanged. However, the Si content was higher than that in the hot-dipped coating material (approximately 9.64%), thereby indicating the aggregation of Si in the grey–white structure.
Figure 5 shows the micro-area EBSD diffraction pattern and phase structures (analyzed with software) in the diffusion layer of the hot-dipped Al–Si alloy on the TA2 substrate. In the EBSD analysis, the microdomains near the middle of the diffusion layer were investigated. The diffraction pattern obtained by the interference between the substrate element and Al–Si alloy layer in the vicinity of the diffusion layer surface and interface between the diffusion layer and substrate during the EBSD analysis process was blurred and could not be calibrated. The T1 sample contained mainly TiAl, Ti3Al, and TiSi phases in the middle of the diffusion layer. The T2 sample exhibited mainly TiAl3 and TiAl phases; a compound Si phase was not observed.
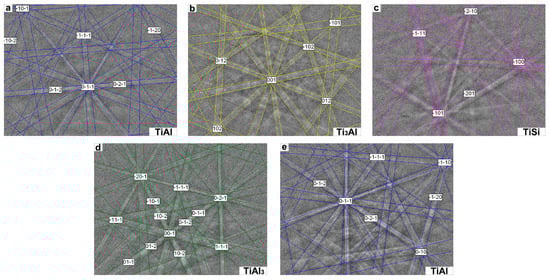
Figure 5.
EBSD analysis results: (a–c) T1 sample, (d,e) T2 sample.
3.2. Microscopic Properties of Composite Coatings
The BSE topography and surface EDS composition results of the ceramic layer obtained by the MAO treatment of the hot-dipped Al–Si layer on the TA2 substrate surface are shown in Figure 6. According to Figure 6a,b, the surface morphology of the ceramic layer obtained by MAO exhibited a typical MAO-treated-layer morphology. Moreover, the microscopic unevenness of the surface and the morphological characteristics of the crater formed by arc-oxidized discharge holes could be clearly seen. The surface discharge holes after the MAO of the T1 sample were finer than the discharge holes of the T2 sample. In addition, the surface of the T1 sample was relatively dense. Furthermore, different degrees of microcracks occurred in the ceramic layer. According to the EDS surface scan results of the surface components in Figure 6c,d, the MAO layers mainly contained Al, Si, and O, and the oxygen contents in the two samples were similar. The Al content in the T1 sample was slightly higher, and the Si content was slightly lower than those in the T2 sample. Because the samples were treated with the same MAO process, the main reason for the difference in the Al and Si contents in the surface composition of the ceramic layers is related to the microscopic characteristics of the hot-dipped Al–Si alloy coating. Small amounts of Na and P occurred in the T1 sample, whereas T2 exhibited only a small amount of P and no Na. The Na and P were mainly the residual elements of the electrolyte component in the coating.
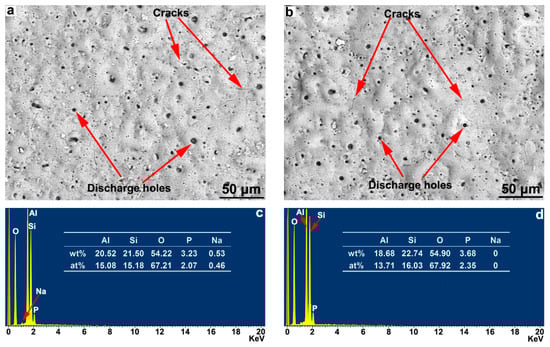
Figure 6.
The surface morphology and composition of (a,b) T1 sample and (c,d) T2 sample for MAO ceramic layer of the hot-dipped Al-Si alloy coating on TA2 substrate.
To determine the size and distribution characteristics of the surface discharge holes, the surface morphologies of the ceramic layers in Figure 6a,b were statistically analyzed with an image analysis method. Owing to their irregular shapes, the determined areas of the discharge holes were used to characterize the hole sizes. The statistical results are shown in Figure 7. Sample T1 exhibited a total of 313 holes; 209 holes had an area of less than 5 μm2, 50 holes had an area of 5–10 μm2, and 54 holes had an area of more than 10 μm2; the area of the largest holes was 42.16 μm2. Sample T2 exhibited 328 discharge holes. The number of holes with areas below 5 μm2, between 5 and 10 μm2, and above 10 μm2 were 208, 73, and 47, respectively; the area of the largest hole was 95.56 μm2. According to the statistical results, the numbers and sizes of the holes in the ceramic layer of the T1 sample were smaller than those of the T2 sample, and the ceramic layer of the T1 sample was relatively dense. However, the difference between the two samples was insignificant.
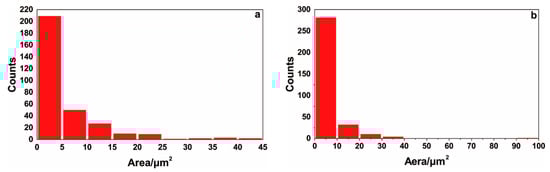
Figure 7.
Image analysis results of distribution and size of the holes in MAO ceramic layer of hot-dipped Al–Si alloy coating on TA2 substrate: (a) T1 sample, (b) T2 sample.
Figure 8 presents a photomicrograph of the cross-sectional BSE of the composite coatings obtained by hot-dipping Al–Si alloy on a TA2 substrate and using MAO technologies. The obtained composition coatings on the T1 and T2 samples exhibited three-layer structures; the outer layer was the ceramic layer obtained by MAO, the central layer was the un-oxidized Al–Si alloy layer, and the inner layer was a diffusion layer obtained with the hot-dipped Al–Si alloy. The MAO reaction occurred only in the Al–Si alloy layer, and a part of the Al–Si alloy layer oxidized to form a ceramic layer. The obtained ceramic and Al–Si alloy layers had a clear, dense, well-combined interface. However, it exhibited a “mountain” undulation. Holes of uneven sizes were distributed in the ceramic layer, but no holes could be observed in the cross-section of the ceramic layer. In addition, the hole sizes in the ceramic layer of the T2 sample were larger than those in the T1 sample. The thicknesses of the ceramic layers of the T1 and T2 samples determined with the image analysis method were approximately 29.98 and 32.34 μm, and the thicknesses of the remaining un-oxidized Al–Si alloy layers were approximately 18.03 and 4.43 μm, respectively. According to the thickness measurement results of the hot-dipped Al–Si layer in Figure 1, the thicknesses of the Al–Si alloy layers of samples T1 and T2 consumed by the MAO were 14.65 and 5.08 μm, respectively.
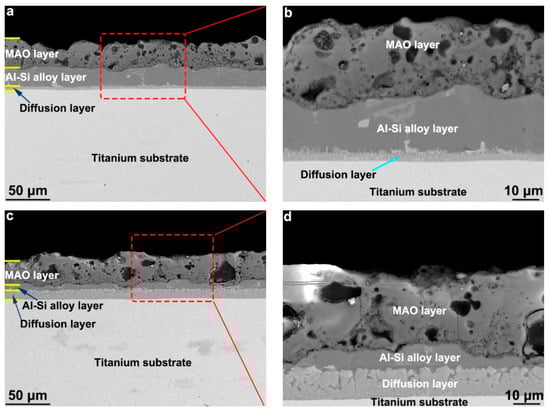
Figure 8.
The cross-section morphology of the composition coating by the hot-dipping Al–Si alloy and MAO technologies on the TA2 substrate: (a,b) T1 sample and (c,d) T2 sample.
Figure 9 presents the cross-sectional EDS line scan results of the composite coatings prepared on TA2 substrates. The distribution curves of O, Al, and Si were basically straight inside the ceramic layer. However, a certain undulation was measured when passing through a hole along the scanning baseline. The Si content in the T2 sample was slightly higher than that of the T1 sample, and the distribution curve was far from the measurement baseline. Because there was no diffusion layer between the ceramic layer and Al–Si alloy, no significant gradient transition in the element contents could be observed at the interface between the ceramic and un-oxidized Al–Si alloy layers. In addition, because the Na and P elements were mainly residual electrolyte elements with low contents in the ceramic layer, their distribution characteristics were not studied in the line scan analysis.
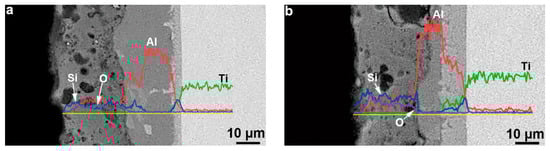
Figure 9.
EDS line analysis of Si, Ti, and O elements of the cross-section of composition coating formed on TA2 substrate by hot-dipping Al–Si alloy and MAO technologies: (a) T1 sample, (b) T2 sample.
The XRD diffraction patterns of the ceramic layer prepared by hot-dipping a TA2 substrate in Al–Si alloy and using MAO technologies are shown in Figure 10. The ceramic layers of the T1 and T2 samples were mainly composed of Al2O3, mullite, and small amounts of Al phases. The Al2O3 and mullite phases resulted from the MAO process of the Al–Si alloy layer, and the Al had not completely reacted and remained in the ceramic layer. In addition, the intensities of the diffraction peaks of Al2O3 and mullite of the T2 sample were higher than those of the T1 sample, thereby indicating that the MAO process of the T2 sample was more sufficient.
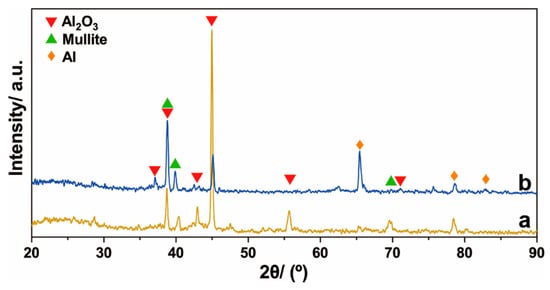
Figure 10.
XRD diffraction spectrum of the ceramic layer on the surface of the (a) T1 sample and (b) T2 sample.
Figure 11 shows the results of the XPS analysis of the ceramic layer on the T1 sample surface. An Si2p peak occurred at 103.45 eV, thereby indicating that the Si in the coating mainly existed in the form of SiO2. The Al2p peak appeared at a binding energy of 74.82 eV. Thus, the Al in the coating mainly existed in the form of Al2O3, which further explains why the oxide layer contained mainly alumina and a mullite phase.
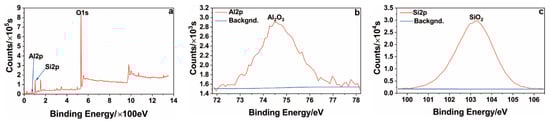
Figure 11.
XPS spectrum of the ceramic layer on the surface of the T1 sample: (a) all; (b) Al; (c) Si.
3.3. Wear Resistance of Composite Coatings
Figure 12 shows the friction coefficient curves of TA2, T1, and T2 samples. It can be seen that at the initial stage, the friction coefficients of the TA2, T1, and T2 samples increased rapidly with the increase of the test time. After about 5 min, the friction coefficient curves of T1 and T2 samples were gentle. With the increasing of the wear time, the friction coefficient curve had slight fluctuations. In the stabilization stage, the average friction coefficients of T1 and T2 samples were about 0.63 and 0.72, respectively. After about 2 min of wear test on the TA2 sample, the friction coefficient showed a slow increasing trend. In the range of 15–20 min test time, the friction coefficient of the TA2 sample trended towards stability with an average value of about 0.52. When the composite coating was prepared on a TA2 substrate by hot-dipping in Al–Si alloy and MAO technologies, the friction coefficients presented an increment in the range of 0.11–0.20 compared to TA2 substrate.
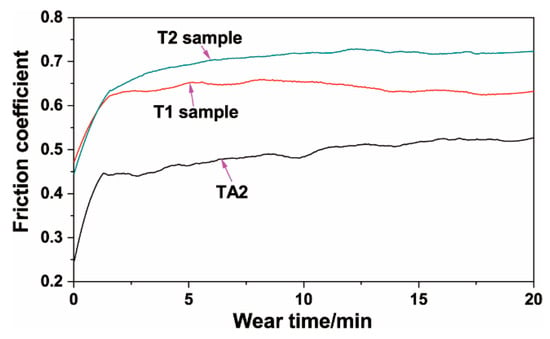
Figure 12.
Friction coefficient curves of TA2, T1, andT2 samples after MAO.
The cross-sectional profile curves of the wear tracks are outlined in Figure 13. It can be clearly seen that the wear track of the TA2 sample was significantly deeper and wider than that of the T1 and T2 samples, which indicates that the composition coatings effectively improved the wear resistance of TA2. Figure 14 shows a comparison diagram of the wear volumes, which were calculated by the depth and width of the wear track using Equation (1). It can be seen that the wear volumes of the TA2, T1, and T2 samples were 0.736, 0.069, and 0.056 mm3, respectively. According to the calculation results of the wear volume, the wear resistance of the TA2 sample with composite coatings prepared by hot-dipping in Al–Si alloy and MAO were significantly better than that of the pure TA2 sample, whose wear volume was 10% less than that of the TA2 sample.
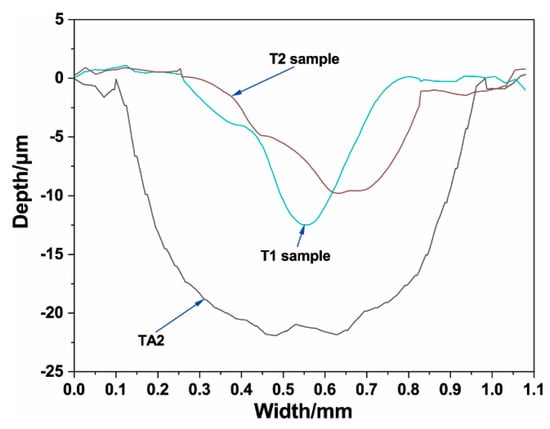
Figure 13.
Cross-section wear profile curve of TA2, T1, and T2 samples.
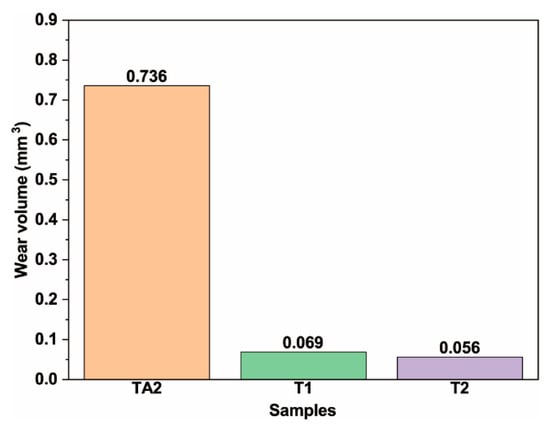
Figure 14.
Wear volumes of TA2, T1, and T2 samples.
4. Discussion
In the hot-dipping process of Al–Si alloy on a TA2 surface, the liquid Al–Si alloy must first completely penetrate the TA2 substrate. According to the phase diagrams of the Ti–Al, Ti–Si, and Ti–Al–Si binary and ternary alloys and related research results, at 710 and 750 °C, Al, Ti, and Si can form, for instance, α-TiAl3, TiAl2, TiAl, Ti3Al, α-Ti solid solution, TiSi2, TiSi, Ti5Si4, Ti5Si3, and Ti3Si; Si can dissolve into the TiAl3 lattice to form a Ti(AlxSi1−x)3 phase [,]. When the TA2 sample was immersed into the Al–Si liquid alloy, the Al and Si reacted with Ti to form an intermetallic compound in a reactive wetting mode. Thus, the Al–Si liquid alloy impregnated the TA2 substrate [,]. The wetting of the solid sample by the liquid metal is the premise of preparing the hot-dipped coating. Only when the liquid metal can sufficiently wet the substrate and the liquid hot-dipping coating material and solid substrate experience interdiffusion are a diffusion layer and finally a hot-dipping coating formed [,]. According to Figure 1, the hot-dipped Al–Si coating on the TA2 surface forms a continuous diffusion layer, which is well-combined with the substrate. Hence, the liquid Al–Si alloy completely infiltrates the TA2 substrate.
When the Al–Si liquid alloy wets completely the TA2 substrate, a liquid–solid interface is formed, Al and Si atoms diffuse into the substrate through the interfacial reaction, and Ti in the substrate diffuses outwards. An interdiffusion zone is formed, and the solid–liquid interface migrates into the liquid Al–Si alloy. In the interdiffusion zone, Al, Si, and Ti react to form an intermetallic compound phase. According to the phase diagram of the Al–Si alloy, an intermetallic compound phase was not formed between Al and Si. Consequently, a binary intermetallic compound phase between Al–Ti and Ti–Si and a ternary intermetallic compound phase between Al–Si–Ti were mainly formed in the interdiffusion region [,]. For an increasing hot-dipping time, Al and Si continue to diffuse into the substrate owing to the thermodynamic action and concentration gradient. The intermetallic compound phase in the diffusion layer changes dynamically with the relative contents of Al, Si, and Ti in the diffusion layer, and the thickness of the diffusion layer continues to increase. The liquid–solid interface migrates into the liquid Al–Si alloy, and the diffusion layer grows into the substrate. During the hot-dipping process, the intermetallic compound phase in the diffusion layer is always in a dynamic state. After the hot-dipping process, the sample was cooled to room temperature, and the phase composition in the diffusion layer did not change. According to the results of the microstructure, composition, and phase composition investigations, the hot-dipping temperature has a direct influence on the microscopic morphology, composition, and phase of the resulting diffusion layer. Regarding the sample, which was hot-dipped into Al–Si alloy for 3 min at 710 °C (T1 sample, Figure 1a,b), the formed diffusion layer exhibits a needle-like morphology in the longitudinal direction of the section. In the sample that was hot-dipped into Al–Si alloy for 3 min at 750 °C (T2 sample, Figure 1c,d), the observed diffusion layer structure is grey–white and in the form of a strip; the layer exhibits a small amount of needle-like structures in an approximately horizontal direction. The compositions of the diffusion layers of samples T1 and T2 are significantly different. The Si content in the diffusion layer of the T1 sample is significantly higher, and the Al content is significantly lower than those in the T2 sample. According to the EBSD results of the diffusion layer, TiAl, Ti3Al, and TiSi phases occur in the diffusion layer of the T1 sample, whereas sample T2 exhibits only TiAl3 and TiAl phases. According to the comprehensive morphology, composition, and EBSD analysis results, a hot-dipping temperature of 710 °C promotes the diffusion of Si for the creation of a diffusion layer, and the resulting silicide mainly grows in the form of a needle-like structure. At 750 °C, Al diffuses more easily into the diffusion layer, thereby forming an intermetallic phase between the Al–Ti elements, which inhibits the formation of silicide. However, compared with other studies conducted under equal process conditions, the addition of Si significantly increases the growth rate of the prepared diffusion layer, and the diffusion layer obtained by hot-dipping in Al–Si alloy is significantly thicker than that of the hot-dip aluminizing results []. According to [], the diffusion layer should contain Al–Si–Ti ternary compound phases. However, no ternary compound phase was discovered in the EBSD analysis. Based on related research studies and the component results in this study, Ti(AlxSi1−x)3 or Ti(AlxSi1−x) phases should be present in the diffusion layer []. However, probably owing to their low contents, they could not be detected in the EBSD analysis.
After the hot dip into Al–Si alloy, the liquid Al–Si alloy adhered to the lifted TA2 substrate, which was exposed to room temperature air to obtain a great degree of subcooling. The liquid Al–Si alloy rapidly cooled and solidified. Al–Si binary alloys are eutectic alloys that undergo eutectic reactions during their solidification []. In the solidification and crystallization processes of an Al–Si alloy layer, the α(Al) solid solution phase is first precipitated, and a liquid–solid two-phase region composed of the liquid Al–Si alloy and solid α(Al) is formed. When the temperature decreases to the eutectic temperature, the Si content in the remaining liquid phase reaches the Si content of the eutectic point, and the remaining liquid phase experiences a eutectic transformation at the eutectic temperature to form an Al–Si eutectic structure. The Al–Si eutectic structure generally precipitates along the grain boundary of the primary phase. The grey–white precipitate in Figure 1 is composed of Al–Si eutectic products. In addition, the grey–white structure composition in the Al–Si layer of Figure 4 shows that the Si content is significantly higher than that in the hot-dipping Al–Si alloy material. The atomic percentage of Si at the eutectic point of the Al–Si alloy is 12.2%. According to Figure 4, the Si content in the grey–white structure is higher than those at the eutectic point and in the hot-dipping Al–Si alloy material. This implies a segregation of Si in the grey–white structure during the cooling and solidification processes of the Al–Si alloy layer after the hot-dip. The hot-dipping temperature has a direct influence on the thickness of the prepared Al–Si alloy layer. The thickness of the Al–Si alloy layer prepared at 710 °C (T1 sample) in Figure 1 is significantly higher than that of the T2 prepared at 750 °C. This is because the hot-dipping temperature is low, and the viscosity of the Al–Si alloy liquid is high. When the sample was lifted from the Al–Si liquid alloy, the adhering liquid Al–Si alloy layer was thick and remained thick after cooling and its solidification.
The MAO process is a plasma micro-area arc discharge process generated in an electrolyte under the action of an external electric field between an anode workpiece and cathode plate. Thus, the anode workpiece (substrate) is in-situ oxidized to form oxide ceramic. During the MAO process, with continuously applied electric field, the plasma micro-area arc discharge continues to occur randomly. Finally, an oxide ceramic coating is in-situ formed on the surface of the anode sample [,,]. In this study, the hot-dipped Al–Si alloy layer (anode) of the outer layer of a TA2 substrate was in-situ oxidized to form an oxide ceramic coating through an MAO process. The formation of the oxide ceramic layer is not fundamentally different from that of the Al–Si alloy sample. However, owing to the different preparation processes of the hot-dipped Al–Si alloy layer, the obtained hot-dipped coating has a different composition and microstructure, thereby resulting in different micro-arc discharge characteristics during the MAO and different growth rates and microscopic properties of the prepared MAO layer. In the T2 sample (hot-dipped into 750 °C Al–Si alloy), owing to the high hot-dipping temperature, the Al–Si layer solidification shrinkage phenomenon is more significant during solidification, and the hot-dipped Al–Si alloy layer is less dense than that of the T1 sample. In addition, the diffusion layer of the T2 sample is thicker; it constitutes mainly an intermetallic compound phase, and its resistivity is higher than that of the metal phase. Thus, the surface micro-region discharge in the actual MAO process requires a higher voltage and current, and the MAO process is consequently more intense. Therefore, the growth rate of the MAO layer of the T2 sample is higher than that of the T1 sample, and the number and sizes of discharge holes are higher and larger than those in the T1 sample, respectively. Similarly, in the MAO process, Si and O in the electrolyte solution are more likely to enter the ceramic layer. Thus, a thicker ceramic layer is obtained when the Al–Si layer is consumed less.
An oxide ceramic layer was grown in-situ by MAO technology on the TA2 sample coated with a hot-dipped Al–Si alloy layer. The wear volume of the TA2 sample with a MAO ceramic layer is only one tenth of that of TA2 sample, which indicates that the composite coating significantly improves the wear resistance of TA2 sample. The wear volume of the T1 sample is slightly larger than that of the T2 sample, which attributes to high actual micro-region discharge voltage and current of the T2 sample. Since the harder ceramic phases are generated on the TA2 sample during the micro-arc oxidation process, the better wear resistance is. Although the wear volumes are not much different for both T1 and T2 samples, the surface morphology of the T2 sample is rougher, which results in the higher friction coefficient of the T2 sample.
Some scholars also use other composite technologies to prepare alumina-based ceramic coatings on the surface of metal materials. For example, Kang et al. [] used the composite technology of magnetron sputtering and MAO to first deposit an aluminum layer on the surface of Ti6Al4V alloy and then to oxidize the deposited aluminum layer using in-situ MAO to form an alumina-based ceramic coating to improve wear resistance of the titanium alloy. Zhang et al. [] first used cold spray technology to prepare an aluminum layer on a steel substrate and then used MAO technology to oxidize the sprayed aluminum layer to produce an alumina-based ceramic coating and tested the friction and wear performance in 3.5 wt.% NaCl solution. The wear resistance of the steel materials with composite coating was significantly improved. Compared with the above two composite technologies, the composite method adopted in this study can promote the formation of a diffusion layer on the surface of the substrate to enhance the coating bonding performance. In addition, the cost of the method used in this paper is relatively low.
In this article, a composite coating consisting of diffusion layer, Al–Si alloy layer, and alumina-based ceramic layer was prepared on the surface of industrial pure titanium TA2 by hot-dipping Al–10Si alloy and MAO composition technologies in order to improve the wear resistance of industrial pure titanium. The composite technology is also appropriate for titanium alloy materials (such as Ti6Al4V, TC11, etc.) to improve their wear resistance. The composite coating was composed of an intermetallic compound diffusion layer and an alumina-based ceramic was prepared by the hot-dipping and MAO composite technology, which has good high-temperature performance and application potential in improving the high-temperature performance of titanium and titanium alloys.
5. Conclusions
- The resulting hot-dipped Al–Si alloy layer on the TA2 substrate surface has a two-layer structure: the outer layer is an Al–Si alloy layer, and the inner layer is a diffusion layer formed by the interdiffusion of Ti–Al–Si.
- The hot-dipping temperature has a direct effect on the microscopic properties and growth rate of the diffusion layer. The diffusion layer of the hot-dipped Al–Si layer prepared at 710 °C is mainly composed of a needle-like structure, the direction of which is perpendicular to the interface of the diffusion layer. The diffusion layer of the hot-dipped Al–Si layer prepared at 750 °C is mainly composed of a block-like structure with a small amount of needle-like structures. Moreover, the diffusion layer of the hot-dipped coating prepared at 710 °C has a higher Si content.
- After the hot-dipped Al–Si alloy layer was subjected to an MAO treatment, a three-layer structure coating was obtained on the surface of the TA2 substrate. The inner layer is a diffusion layer obtained by the hot-dipped Al–Si alloy, the central layer is an Al–Si alloy layer which was not subjected to the MAO process, and the outer layer is a ceramic layer obtained by the MAO process. The ceramic layer consists mainly of Al2O3, mullite, and un-oxidized aluminum.
- The friction coefficients of TA2, T1, and T2 samples were 0.52, 0.63, and 0.72, respectively. The wear volumes were 0.736, 0.069, and 0.056 mm3, respectively. The TA2 sample with the MAO composite coating has less abrasion loss. Although the MAO technology can increase the roughness of TA2 sample, the TA2 sample with the MAO composite coating has better wear resistance.
Author Contributions
Conceptualization, S.W., L.Z., C.L. and Z.L.; methodology, S.W., L.Z., C.L. and Z.L.; validation, S.W., L.Y. and H.L.; formal analysis, S.W.; investigation, S.W. and H.L.; resources, S.W.; data curation, S.W.; writing—original draft preparation, S.W.; writing—review and editing, S.W.; funding acquisition, S.W. and L.Y. All authors have read and agreed to the published version of the manuscript.
Funding
This study was supported by the Project of Innovation Ability of the Shaanxi Province, China (2017KCT-06) and the National Natural Science Foundation of China (51701165).
Conflicts of Interest
The authors declare no conflict of interest.
References
- Lujun, H.; Lin, G.; Huaxin, P. Strengthening and toughening mechanisms of the second phase in titanium alloys and titanium matrix composites. Mater. China 2019, 38, 214–222. [Google Scholar] [CrossRef]
- Koizumi, H.; Takeuchi, Y.; Imai, H.; Kawai, T.; Yoneyama, T. Application of titanium and titanium alloys to fixed dental prostheses. J. Prosthodont. Res. 2019, 63, 266–270. [Google Scholar] [CrossRef] [PubMed]
- Rajendran, R. Gas turbine coatings—An overview. Eng. Fail. Anal. 2012, 26, 355–369. [Google Scholar] [CrossRef]
- Singh, P.; Pungotra, H.; Kalsi, N.S. On the characteristics of titanium alloys for the aircraft applications. Mater. Today Proc. 2017, 4, 8971–8982. [Google Scholar] [CrossRef]
- Zhang, C.; Yang, Y.; Miao, L.-L.; Ma, Y.-D.; Zhang, X.; Cui, Y.-H.; Dong, Y.-C.; Chen, X.-G.; Wang, L.; Liu, Z.; et al. Microstructure and properties of Al2O3-Y2O3 ceramic composite coatings fabricated by plasma spraying. Surf. Coat. Technol. 2018, 350, 550–559. [Google Scholar] [CrossRef]
- Chen, Y.-D.; Yang, Y.; Chu, Z.-H.; Chen, X.-G.; Wang, L.; Liu, Z.; Dong, Y.-C.; Yan, D.-R.; Zhang, J.-X.; Kang, Z.-L. Microstructure and properties of Al2O3-ZrO2 composite coatings prepared by air plasma spraying. Appl. Surf. Sci. 2018, 431, 93–100. [Google Scholar] [CrossRef]
- Utu, I.D.; Marginean, G.; Hulka, I.; Serban, V.A.; Cristea, D. Properties of the thermally sprayed Al2O3-TiO2 coatings deposited on titanium substrate. Int. J. Refract. Met. Hard Mater. 2015, 51, 118–123. [Google Scholar] [CrossRef]
- Chen, Y.; Wu, D.; Ma, G.; Lu, W.; Guo, D. Coaxial laser cladding of Al2O3-13%TiO2 powders on Ti–6Al–4V alloy. Surf. Coat. Technol. 2013, 228, S452–S455. [Google Scholar] [CrossRef]
- Weng, F.; Chen, C.; Yu, H. Research status of laser cladding on titanium and its alloys: A review. Mater. Des. 2014, 58, 412–425. [Google Scholar] [CrossRef]
- Çomaklı, O.; Yazıcı, M.; Yetim, T.; Yetim, A.F.; Çelik, A. Effect of Ti amount on wear and corrosion properties of Ti-doped Al2O3 nanocomposite ceramic coated CP titanium implant material. Ceram. Int. 2018, 44, 7421–7428. [Google Scholar] [CrossRef]
- Du, W.; Zhang, S.; Luo, X.; Tao, X.; Fang, C.; Yao, Z. In-Situ reaction synthesis of composite coating on titanium alloy for improving high temperature oxidation resistance. J. Alloy. Compd. 2017, 729, 970–977. [Google Scholar] [CrossRef]
- Jin, Q.; Xue, W.; Li, X.; Zhu, Q.; Wu, X. Al2O3 coating fabricated on titanium by cathodic microarc electrodeposition. J. Alloy. Compd. 2009, 476, 356–359. [Google Scholar] [CrossRef]
- Yang, X.; Jiang, Z.; Hao, G.; Liang, Y.; Ding, X.; Lin, J. Ni-Doped Al2O3 coatings prepared by cathode plasma electrolysis deposition on Ti–45Al–8.5 Nb alloys. Appl. Surf. Sci. 2018, 455, 144–152. [Google Scholar] [CrossRef]
- Yizhou, S.; Haijun, T.; Yuebin, L.; Xiaofei, Z.; Tao, W.; Jie, T.; Lei, P. Fabrication and wear resistance of TiO2/Al2O3 coatings by micro-arc oxidation. Rare Met. Mater. Eng. 2017, 46, 23–27. [Google Scholar] [CrossRef]
- Lu, X.; Mohedano, M.; Blawert, C.; Matykina, E.; Arrabal, R.; Kainer, K.U.; Zheludkevich, M.L. Plasma electrolytic oxidation coatings with particle additions—A review. Surf. Coat. Technol. 2016, 307, 1165–1182. [Google Scholar] [CrossRef]
- Aliasghari, S.; Skeldon, P.; Thompson, G.E. Plasma electrolytic oxidation of titanium in a phosphate/silicate electrolyte and tribological performance of the coatings. Appl. Surf. Sci. 2014, 316, 463–476. [Google Scholar] [CrossRef]
- Cheng, W.-J.; Wang, C.-J. EBSD study of crystallographic identification of Fe–Al–Si intermetallic phases in Al–Si coating on Cr–Mo steel. Appl. Surf. Sci. 2011, 257, 4637–4642. [Google Scholar] [CrossRef]
- Lemmens, B.; Springer, H.; Graeve, I.D.; Strycker, J.D.; Raabe, D.; Verbeken, K. Effect of silicon on the microstructure and growth kinetics of intermetallic phases formed during hot-dip aluminizing of ferritic steel. Surf. Coat. Technol. 2017, 319, 104–109. [Google Scholar] [CrossRef]
- Chang, Y.-Y.; Cheng, W.-J.; Wang, C.-J. Growth and surface morphology of hot-dip Al–Si on 9Cr–1Mo steel. Mater. Charact. 2009, 60, 144–149. [Google Scholar] [CrossRef]
- Luo, S.; Zheng, L.; Luo, H.; Luo, C. A ceramic coating on carbon steel and its superhydrophobicity. Appl. Surf. Sci. 2019, 486, 371–375. [Google Scholar] [CrossRef]
- Zhang, J.; Fan, Y.; Zhao, X.; Ma, R.; Du, A.; Cao, X. Influence of duty cycle on the growth behavior and wear resistance of microarc oxidation coatings on hot dip aluminized cast iron. Surf. Coat. Technol. 2018, 337, 141–149. [Google Scholar] [CrossRef]
- Zhang, Z.G.; Peng, Y.P.; Mao, Y.L.; Pang, C.J.; Lu, L.Y. Effect of hot-dip aluminizing on the oxidation resistance of Ti–6Al–4V alloy at high temperatures. Corros. Sci. 2012, 55, 187–193. [Google Scholar] [CrossRef]
- Zhang, Z.G.; Wang, Y.J.; Xiao, L.J.; Zhang, L.Q.; Su, Y.; Lin, J.S. High-temperature oxidation of hot-dip aluminizing coatings on a Ti3Al–Nb alloy and the effects of element additions. Corros. Sci. 2012, 64, 137–144. [Google Scholar] [CrossRef]
- Broszeit, E.; Matthes, B.; Herr, W.; Kloos, K.H. Tribological properties of r.f. sputtered Ti–B–N coatings under various pin-on-disc wear test conditions. Surf. Coat. Technol. 1993, 58, 29–35. [Google Scholar] [CrossRef]
- Wan, L.; Lv, S.; Huang, Y.; Xu, Y.; Cui, Q. Effect of hot dip aluminising on interfacial microstructure and mechanical properties of Ti/Al joint by TIG arc welding brazing. Sci. Technol. Weld. Join. 2015, 20, 164–171. [Google Scholar] [CrossRef]
- Li, Y.; Gu, Q.-F.; Luo, Q.; Pang, Y.; Chen, S.-L.; Chou, K.-C.; Wang, X.-L.; Li, Q. Thermodynamic investigation on phase formation in the Al–Si rich region of Al–Si–Ti system. Mater. Des. 2016, 102, 78–90. [Google Scholar] [CrossRef]
- Dai, J.; Zhang, F.; Wang, A.; Yu, H.; Chen, C. Microstructure and properties of Ti–Al coating and Ti–Al–Si system coatings on Ti–6Al–4V fabricated by laser surface alloying. Surf. Coat. Technol. 2017, 309, 805–813. [Google Scholar] [CrossRef]
- Lin, Q.; Li, F.; Jin, P.; Zhong, W. Reactive wetting of TA2 pure Ti and TC4 alloy by molten Al 4043 alloy at 873–973 K. Vacuum 2017, 145, 95–102. [Google Scholar] [CrossRef]
- Zhang, Q.Y.; Zhou, Y.; Liu, J.Q.; Chen, K.M.; Mo, J.G.; Cui, X.H.; Wang, S.Q. Comparative research on dry sliding wear of hot-dip aluminized and uncoated AISI H13 steel. Wear 2015, 344–345, 22–31. [Google Scholar] [CrossRef]
- Dinh, K.-A.; Hong, S.-T.; Luu, T.V.; Kim, M.-J.; Han, H.N. Intermetallic evolution of Al–Si-Coated hot stamping steel during modified electrically assisted rapid heating. Acta Metall. Sin. Engl. Lett. 2018, 31, 1327–1333. [Google Scholar] [CrossRef]
- Wang, S.; Zhou, L.; Li, C.; Li, Z.; Li, H. Morphology and wear resistance of composite coatings formed on a TA2 substrate using hot-dip aluminising and micro-arc oxidation technologies. Materials 2019, 12, 799. [Google Scholar] [CrossRef] [PubMed]
- Sadeq, F.O.; Sharifitabar, M.; Afarani, M.S. Synthesis of Ti–Si–Al coatings on the surface of Ti–6Al–4V alloy via hot dip siliconizing route. Surf. Coat. Technol. 2018, 337, 349–356. [Google Scholar] [CrossRef]
- Bobzin, K.; Brögelmann, T.; Kalscheuer, C.; Liang, T. Al-Si and Al-Si-Y coatings deposited by HS-PVD for the oxidation protection of γ-TiAl. Surf. Coat. Technol. 2018, 350, 587–595. [Google Scholar] [CrossRef]
- Wang, X.; Zhu, Z.; Li, Y.; Chen, H. Characterization of micro-arc oxidation coatings on 6N01 aluminum alloy under different electrolyte temperature control modes. J. Mater. Eng. Perform. 2018, 27, 1890–1897. [Google Scholar] [CrossRef]
- Liu, J.; Gu, Y.; Yue, W.; Yi, P.; Liang, J.; Hou, B.; Sun, J.; She, D. Effects of evaluated temperature on tribological behaviors of micro-arc oxidated 2219 aluminum alloy and their field application. Int. J. Adv. Manuf. Technol. 2018, 96, 1725–1740. [Google Scholar] [CrossRef]
- Krishna, L.R.; Purnima, A.S.; Wasekar, N.P.; Sundararajan, G. Kinetics and properties of micro arc oxidation coatings deposited on commercial Al alloys. Metall. Mater. Trans. A 2007, 38, 370–378. [Google Scholar] [CrossRef]
- Kang, S.-H.; Tu, W.-B.; Han, J.-X.; Li, Z.; Cheng, Y.-L. A significant improvement of the wear resistance of Ti6Al4V alloy by a combined method of magnetron sputtering and plasma electrolytic oxidation (PEO). Surf. Coat. Technol. 2019, 358, 879–890. [Google Scholar] [CrossRef]
- Zhang, J.; Kong, D. Effect of micro-arc oxidation on friction-wear behavior of cold-sprayed Al coating in 3.5 wt.% NaCl solution. J. Mater. Eng. Perform. 2019, 28, 2716–2725. [Google Scholar] [CrossRef]
© 2020 by the authors. Licensee MDPI, Basel, Switzerland. This article is an open access article distributed under the terms and conditions of the Creative Commons Attribution (CC BY) license (http://creativecommons.org/licenses/by/4.0/).