Abstract
To reduce the deformation and improve the quality of thin-walled parts repaired by laser cladding, a three-factor, three-level orthogonal experimental scheme was employed to clad Ni60 powder on thin-walled parts with a thickness of 3.5 mm. To measure the deformation of the thin-walled parts, a method of combining the meshing of the backs of the thin-walled parts and fixing one end of the parts during cladding was used. The effects of the powder feed rate, laser power, and scanning speed on the deformation of the thin-walled parts were studied via visual analysis and analysis of variance, and the process parameters that resulted in the minimum deformation were determined. The deformation process of the thin-walled parts and the causes of cladding stress were also studied, and the microstructure of the cladding layer with the minimum deformation was analyzed via scanning electron microscopy (SEM). The results reveal that the deformation of the thin-walled parts increased with the increase of laser power. The increases of the scanning speed and powder feed rate were found to reduce the deformation of thin-walled parts; the laser power was found to have a significant effect, and the powder feed rate was found to have no significant effect, on the deformation of thin-walled parts. The order of the influence of factors on the deformation of thin-walled parts from greatest to least was determined to be as follows: laser power > scanning speed > powder feed rate. The optimal parameters to obtain the minimum deformation and good metallurgical bonding of thin-walled parts were found to be a powder feed rate of 1.4 r/min, a laser power of 1100 W, and a scanning speed of 8 mm/s. From the bottom to the top, the crystal structure of the coating with the minimum deformation was found to be coarse dendrite, dendritic crystal, and equiaxed crystal.
1. Introduction
As an environmentally friendly remanufacturing technology, laser cladding technology has the advantages of resulting in a dense coating structure, a small heat-affected area, and environmental protection [1,2]. Laser cladding technology is widely used in automotive, steel, aerospace, mining machinery, petrochemical, and other fields due to its unique advantages when used in parts repair [3,4], and thin-walled parts are also commonly used in the fields of aviation, aerospace, national defense advanced technology, and ships [5]. Although it presents outstanding advantages, there remain many problems when repairing thin-walled parts via laser cladding, as it is difficult to control the process parameters [6,7,8]. When the laser power is too high, the deformation of thin-walled parts increases and the laser can easily burn through the parts; however, when the laser power is too low, a bright white band cannot be formed in the bonding area between the substrate and the alloy material, and the quality requirements of the cladding cannot be met [9]. Many factors affect the quality of thin-walled parts, and determining how to adjust these factors to ensure the quality of the cladding layer and control the deformation of the substrate has become the key to the success of the repair of thin-walled parts [10,11,12]. When repairing thin-walled parts, a large temperature gradient occurs between the cladding layer and the substrate, and there is a difference between the coefficients of thermal expansion of the substrate and the alloy powder; this leads to differences in the thermal expansion and cooling shrinkage of each local area, and cladding stress will occur in the cladding layer [13]. Once the cladding stress exceeds the yield limit, the thin-walled parts will warp and deform, and these defects will affect the actual use of the repaired parts [14,15]. Therefore, determining how to reduce the deformation of thin-walled parts during laser cladding repair has become the focus of a body of research. The formation reason and action rules of stress and deformation in laser cladding are very complex, and many experts and scholars have conducted many related investigations on this topic [16,17,18,19,20,21,22]. Wang et al. [23] used different types of lasers to study the properties of formed AISI316L stainless steel thin-walled parts, and found that the ultimate tensile strength of the sample produced by a pulse laser was higher than that of the sample produced by a continuous-wave laser. Additionally, it was found that a specimen parallel to the scanning direction has a higher ultimate tensile strength than a specimen perpendicular to the scanning direction, but the elongation is the opposite. Krzyzanowski et al. [24] used numerical simulation methods to study the roles of temperature and thermal stress in laser cladding, and reduced the thermal stress of the cladding layer via preheating. Yan et al. [25] studied the influences of the laser-scanning mode on the deformation and residual stress distribution of formed parts, and reduced the deformation by changing the scanning mode. Yan et al. [26] carried out the on-site monitoring of the temperature under different process parameters via infrared cameras and thermocouples, and studied the effect of temperature on laser cladding deformation. However, these studies have not fundamentally solved the problem of deformation that arises when laser cladding is used to repair thin-walled parts.
In this research, aiming at the problem of deformation associated with the repair of thin-walled parts via laser cladding, the mechanisms of the process parameters and deformation during the cladding process were studied in depth. Combined with visual analysis and analysis of variance, an orthogonal experiment was designed to study the effects of the powder feed rate, laser power, and scanning speed on the deformation of the substrate. The order of influence of each factor on the deformation of the substrate was determined by visual analysis, and the degree of the significance of the influence of each factor on the deformation of the thin-walled parts was quantitatively determined via analysis of variance. In addition, the deformation process and the cause of cladding stress were analyzed based on the experimental results. The optimal process parameters that meet the requirements of the small deformation of the substrate and the good metallurgical bonding of the cladding layer were found, and the microstructural analysis of the thin-walled parts coated via the optimal process parameters was carried out. This work presents a method for the process optimization of the laser repair of thin-walled parts in the fields of aerospace and national defense, as well as other cutting-edge technologies.
2. Materials and Methods
2.1. Experimental Equipment and Materials
The laser used in the experiment was a YSL-2000 fiber laser produced by IPG Photonics Corporation (MA, USA). The coordinate-measuring instrument used for deformation measurement was an Inspector 06.08.06 model produced by Hexagon (Stockholm, Sweden). The selected substrate material was 45# steel with a size of 260 mm × 40 mm × 3.5 mm. Before laser cladding, the substrate was polished, sandblasted, and washed with absolute ethanol. Ni60 self-fluxing alloy powder was used as the cladding powder (shown in Figure 1), the particle size of which was 45–106 μm. The powder had been previously (120 °C, held for 2 h). The chemical compositions of the 45# steel and the Ni60 powder are respectively exhibited in Table 1 and Table 2.
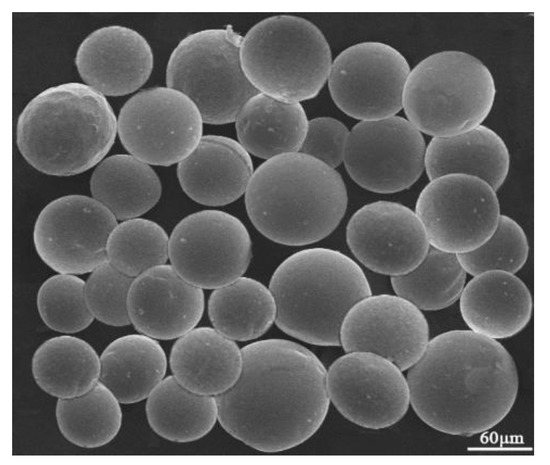
Figure 1.
Scanning electron microscopy (SEM) micrograph of Ni60 powder.

Table 1.
Chemical composition of the 45# steel (wt.%).
Table 2.
Chemical composition of the Ni60 alloy powder (wt.%).
2.2. Experimental Method
Laser cladding is a process of rapid heating, melting, and cooling. If the cladding process is not properly controlled, a high cladding stress can easily be produced, which can result in the deformation of the clad parts or the cracking of the cladding layer. In particular, thin-walled parts are more sensitive to deformation by the stress generated by laser cladding. Via the study of the deformation mechanism of thin-walled parts repaired by laser cladding, it has been found that the changes of the process parameters have significant impacts on the deformation of the laser-clad NI60 coatings of thin-walled parts. Three process parameters (powder feed rate, laser power, and scanning speed) that have substantial effects on the deformation of thin-walled parts were selected as factors for the laser cladding experiment. The deformation in the thickness direction of the thin-walled parts was considered as the research object, and a three-factor, three-level orthogonal experiment (L9 (34)) was designed (9 indicates the total number of tests, 3 is the number of levels, and 4 is the number of factors (including the error column)). The specific orthogonal experiment design scheme is presented in Table 3 and Table 4.
Table 3.
Level and factor design of orthogonal experiment.
Table 4.
Orthogonal experiment scheme.
The laser cladding process is presented in Figure 2. To reduce the experimental errors, the surfaces of the nine substrates were precision-ground. Before laser cladding, a slender strip-shaped substrate was selected, and a grid was drawn on the back of the sheet. Each sample had a total of 70 nodes, and the grid nodes were the coordinate points that needed to be measured. During laser cladding, one end of the sheet was fixed by a fixture, and the deformation of the fixed end of the sheet could be approximately considered as zero. After analyzing the clad samples, it was found that the deformation of the sheet was mainly in the thickness direction; therefore, the minimum distance from each measurement point to the reference plane of the fixed end was considered to be the deformation amount in the thickness direction of the sheet.
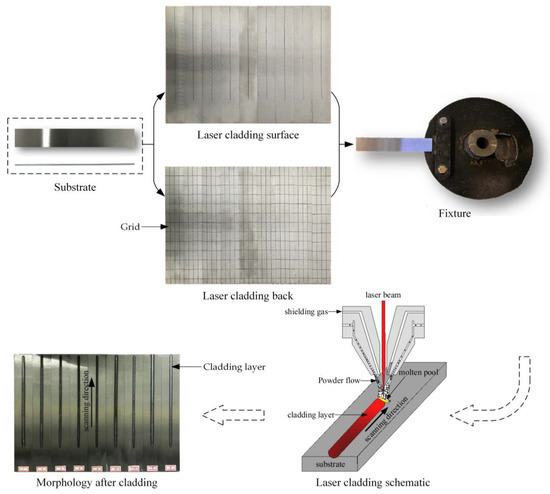
Figure 2.
Laser cladding process.
During the laser cladding process, warpage deformation, angular deformation, twist deformation, and wave deformation can easily occur [27]. The deformation of actual sheets undergoing laser-cladding repair is often complicated, and multiple forms of deformation can exist simultaneously. According to the observation of the cladding sample, it was found that the longitudinal warpage deformation and the transverse angular deformation were substantial, as presented in Figure 3.
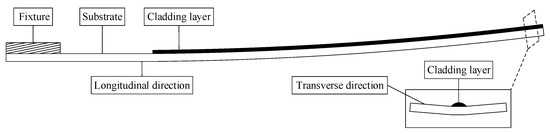
Figure 3.
Diagram of sheet deformation.
The deformation measurement process is exhibited in Figure 4. First, a special fixture was used to fix the cladding sample on the worktable of a three-coordinate measuring instrument, which was then used to measure the deformation of the thin-walled parts. Using the coordinate and reference plane measured by the three-coordinate measuring instrument, the deformation amount of each sample measurement point was determined. To investigate the amount of deformation of each sample, the first ten greatest deformation values were selected from the 70 deformation values of each sample, and their average value was taken as the deformation value of each sample. The deformation data in the thickness direction of the nine groups are listed in Table 5.
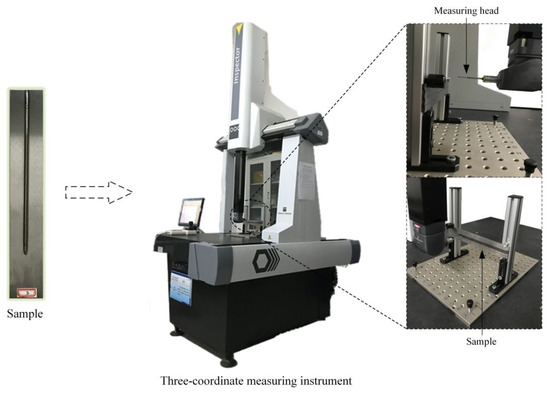
Figure 4.
Deformation measurement process.
Table 5.
Amount of deformation in the thickness direction (mm).
The average deformation of sample 6 was the greatest, and that of sample 7 was the least. This demonstrates that, among the nine groups of cladding samples, the cladding stress produced by sample 6 was the greatest, and that of sample 7 was the least.
3. Results and Analysis
3.1. Visual Analysis
In Table 6, Kt is the sum of the deformation amount of any factor at the t level, kt is the average deformation of any factor at the t level, kt = Kt/s, and s is the number of occurrences of any factor at the t level. Additionally, Rj = max(kj) - min(kj), Rj is the range of factor j, and kj is the deformation amount of factor j.
Table 6.
The results of the range analysis of the sheet deformation.
The range analysis method was used to analyze the data from the results of the orthogonal experiment. The results of the range analysis of the sheet deformation are exhibited in Table 6, and the influences of various factors on the amount of deformation are presented in Figure 5. It can be determined from the single-factor analysis that the deformation amount in the thickness direction of the sheet decreased with the increase of the scanning speed (C), and the deformation amount of the third level (8 mm/s) was the least. The deformation of the sheet was found to increase with the increase of laser power (B), and the deformation of the first level (1,100 W) was the least. The main reason for this is that, with the increase of laser power, the heat input per unit area of the sheet surface increased, the temperature increased rapidly, the temperature difference between the upper and lower surfaces of the sheet increased, and the yield limit of the heating zone of the sheet decreased; therefore, the deformation in the thickness direction of the sheet increased. With the increase of the powder feeding rate (A), the deformation of the sheet was found to gradually decrease, and that of the third level (1.4 r/min) was the least. The first reason for this is that the increased powder flow increased the absorption of laser energy, and the energy required to reach the sheet became relatively less. The second reason is that the powder had a certain shielding effect on the laser, which prevented the laser energy from reaching the sheet. Therefore, the greater the powder feed rate, the lesser the deformation of the sheet.
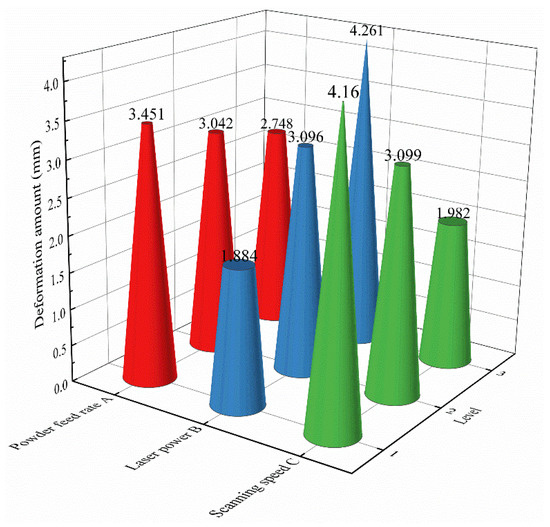
Figure 5.
The influence of various factors on the amount of deformation.
The range of each factor is presented in Figure 6. Among the three factors of the orthogonal experiment, the range of the powder feeding rate was the least; this indicates that the change of the powder feeding rate had the smallest effect on the deformation of the sheet during the experiment. The range of the laser power was the greatest, which indicates that the change of the laser power had the greatest influence on the deformation of the sheet. Therefore, the order of the influence of factors on the deformation of thin-walled parts from greatest to least was determined to be as follows: laser power > scanning speed > powder feed rate. According to Table 6, sample 7 underwent the least deformation. The optimal process parameters of the thin-walled parts with the least deformation were as follows: a powder feed rate of 1.4 r/min, a laser power of 1,100 W, and a scanning speed of 8 mm/s.
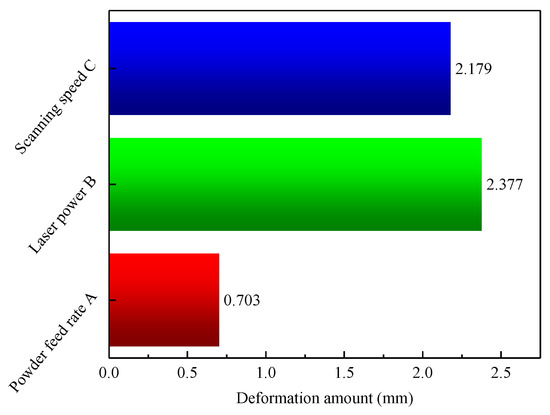
Figure 6.
The range of each factor.
3.2. Analysis of Variance
(1) Calculate the Sum of Squared Deviations
In Equation (1), n is the total number of experiments, Yi is the sheet deformation, and is the average sheet deformation.
where Q is the sum of the squares of the deformation of the sheet, T is the sum of the deformations, and SST is the sum of the squares of total deviations. After calculation, Q = 101.954, T = 27.723, and SST = 16.558.
In Equations (5)–(7), r represents the number of experimental levels, SSj represents the sum of deviation squares caused by any factor, and SSA, SSB, and SSC respectively represent the sums of deviation squares caused by factors A, B, and C. The fourth factor column is blank, and the sum of the deviation squares of the blank column is expressed as SSe. After calculation, SSA = 0.748, SSB = 8.476, SSC = 7.117, and SSe = 0.212.
(2) Calculate Degrees of Freedom
In Equations (8)–(10), dfT is the total degrees of freedom of the experiment, dfj is the degree of freedom of any factor, dfA, dfB, and dfC are the degrees of freedom of factors A, B, and C, respectively, and dfe is the degrees of freedom of the blank column.
(3) Sum of Mean Deviation Squares (Mean Square)
In Equation (11), MSj is the sum of the mean deviation squares of any factor. After calculation, MSA = 0.374, MSB = 4.238, MSC = 3.559, and MSe = 0.106.
(4) F-value Calculation
The value of F is the ratio of the sum of the squares of the average deviation of each factor to the sum of the squares of the average deviation of the error. After calculation, FA = 3.528, FB = 39.981, and FC = 33.575.
(5) Judging the Significance of Factors
After inquiry, the critical values were determined to be F0.025 (2, 2) = 39 and F0.05 (2, 2) = 19. The calculated F values were compared with the critical value Fα; if F > Fα, it indicates that the change of this factor had a significant effect on the deformation of thin-walled parts. The reliability α indicates the confidence of the judgment. It can be determined from Table 7 that if α = 0.025 and FB > F0.025 (2, 2) = 39, then there is an approximately 97.5% probability that the change in the laser power (B) had a very significant effect on the deformation of thin-walled parts. The effects of changes in the powder feed rate (A) and scanning speed (C) on the deformation of thin-walled parts were found to be less significant than that of the laser power (B); in particular, the change of the powder feed rate (A) was found to have no significant effect on the deformation of thin-walled parts. The significance degrees of the influences of various factors on the deformation of thin-walled parts from greatest to least were found to be B > C > A.
Table 7.
Analysis results of deformation variance of thin-walled parts.
3.3. Stress and Deformation Analysis of Laser-Clad Thin-Walled Parts
Laser cladding is a process of non-uniform heating and melting. Under the action of the cladding heat source, the temperature distribution around the liquid metal is extremely uneven, which results in uneven volume expansion and contraction in various areas of the clad part, which ultimately results in deformation. The main cause of the deformation of thin-walled parts is due to cladding stress; plastic deformation occurs when the cladding stress exceeds the yield limit of thin-walled parts. During laser cladding, the laser-active area is rapidly heated and locally melted, and the temperature of the metal far from the laser is lower; thus, the thin-walled parts will experience uneven thermal expansion. The metal in the laser-exposed zone is thermally expanded, but the thermal metal expansion is constrained by the surrounding colder metal; therefore, the thermal metal is under compressive stress and the colder metal is under tensile stress. The yield limit of the metal in the laser zone decreases with the increase of the temperature until the melting yield limit of the metal decreases to zero. As shown in Figure 7b, arch deformation occurs when the thermal expansion of the clad surface of the thin-walled part is larger than that of the non-clad surface. During cooling after laser cladding, the metal in the laser-active area shrinks and undergoes tensile stress, but the metal that is not in the laser-active area undergoes compressive stress, and warping deformation occurs under the influence of the shrinkage force, as shown in Figure 7c.
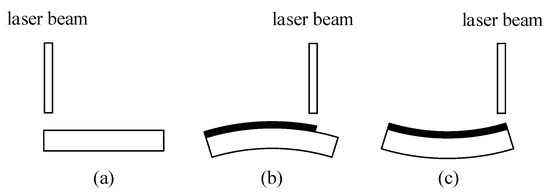
Figure 7.
Schematic of the deformation process of thin-walled parts. (a) Before the laser cladding; (b) During the laser cladding; (c) After the laser cladding.
3.4. Microstructural Analysis
Via orthogonal experimental analysis, it was determined that the deformation amount of sample 6 was the greatest, and the deformation amount of sample 7 was the least. To study the relationship between the deformation of thin-walled parts repaired by laser cladding with different process parameters and the inner structure of the coating, the microstructures of the coatings of samples 6 and 7 were analyzed. The cladding layer was divided into three parts, namely the upper, middle, and lower parts, as shown in Figure 8. No obvious pores, cracks, or other defects were found throughout the cladding layer, and the crystals were found to decrease in size from the bottom to the top of the cladding layer. During the rapid solidification of the molten pool, the temperature gradient between the molten pool and the substrate was the greatest, and the solidification rate approached zero. At this time, the growth of the solid-liquid interface proceeded at a low-speed flat interface, and a bright white band was finally formed at the interface between the fusion zone and the substrate, as shown in Figure 8a,b. This indicates that a good metallurgical bond was formed between the cladding layer and the substrate. In addition, with the progression of solidification, coarse dendrites were formed at the bottom of the cladding layer. As compared with those of sample 7, the sizes of the coarse dendrites at the bottom of sample 6 were more uniform. The main reason for this is that the input specific energy of sample 6 during laser cladding was higher than that of sample 7, which resulted in the full growth of the crystal inside the coating. Additionally, the higher-specific-energy cladding also maximized the deformation of sample 6. Figure 8c,d respectively present the microstructures in the middles of the cladding layers of samples 6 and 7; these microstructures were mainly in the forms of columnar crystals and dendrites, and were more uniform and smaller than the crystals in the lower part of the cladding layer. Due to the different process parameters, the crystal structure in the middle of the coating of sample 6 was coarser than that of sample 7. Figure 8e,f respectively present the microstructures of the upper parts of the cladding layers of samples 6 and 7. The solidification speed of the upper part of the cladding layer was relatively high, and the impurities in the molten pool with high melting points easily floated upward to form a new crystal nucleus, ultimately forming a structure dominated by fine dendrites. As compared with those shown in Figure 8e, the grains shown in Figure 8f were finer and more uniform, and some equiaxed crystals were present. Overall, as compared with sample 6, sample 7, which had the least amount of deformation, had a finer microstructure inside the coating. Enlarged images of the tops of the cladding layers of samples 6 and 7 are depicted in Figure 9, and it is evident that many rich, equiaxed crystals appeared on the top of the cladding layer of sample 7, while sample 6 remained primarily characterized by dendrites. This again demonstrates that the coating of sample 7 not only had small deformation, but also an excellent internal structure.
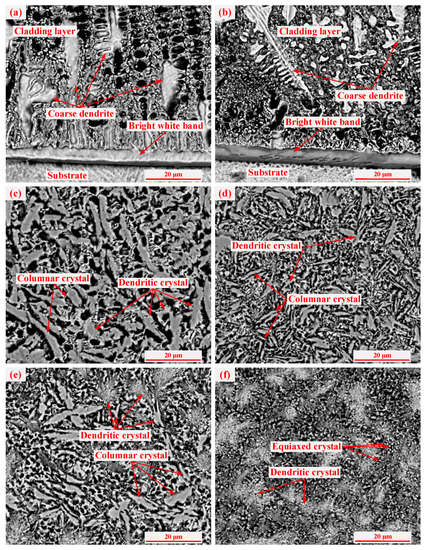
Figure 8.
Microstructures of the cladding layers of samples 6 and 7. (a) and (b) The bottoms of the cladding layers of samples 6 and 7; (c) and (d) The middles of the cladding layers of samples 6 and 7; (e) and (f) The upper parts of the cladding layers of samples 6 and 7.
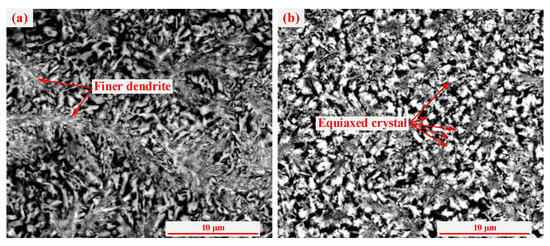
Figure 9.
SEM images of the cladding layers of samples 6 and 7. (a) SEM image of the top of the coating of sample 6; (b) SEM image of the top of the coating of sample 7.
3.5. EDS and XRD Analysis
The analysis results of the energy dispersive spectrometer of the cladding layer of sample 7 with the minimum deformation are presented in Figure 10. The composition elements and relative contents of crystals were analyzed according to the order of the crystal size from largest to smallest. Point a of the coarse dendrite structure was found to contain Ni, Fe, Cr, C, Si, and other elements; among them, Fe, Ni, and Cr were more abundant, while C and Si were relatively less abundant. From point a of the coarse dendrite to point c of the fine dendrite, the relative content of Si increased, but the relative content of Fe decreased. This indicates that the increase of Si and the decrease of Fe are beneficial to the formation of fine dendrites. The relative content of C in point d of the fine grain was found to be higher than that of other dendrites, which indicates that C has the effect of grain refinement in the nickel-based cladding layer. In the crystal structures of different sizes, the differences of element types were small, but the elemental contents were found to be significantly different.
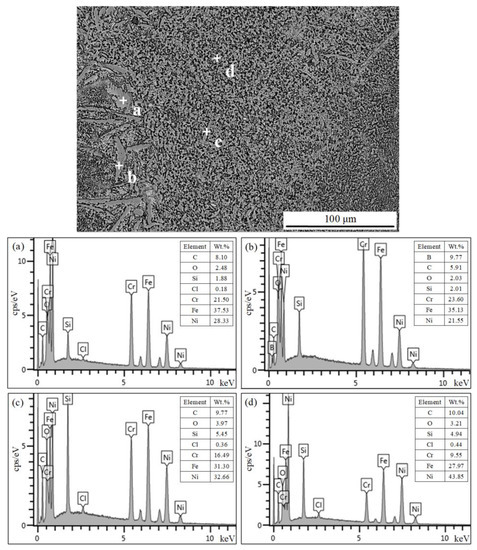
Figure 10.
The analysis results of the energy dispersive spectrometer of the cladding layer. (a) EDS analysis of point a; (b) EDS analysis of point b; (c) EDS analysis of point c; (d) EDS analysis of point d.
To study the relationship between the deformation of the thin-walled coating and the phase, x-ray diffraction analysis was performed on the cladding layer of sample 6, which had the greatest deformation, and that of sample 7, which had the least deformation. It can be seen from Figure 11 that the cladding layers of samples 6 and 7 were mainly composed of phases including γ-Ni solid solution, boron-chromium compounds (Cr5B3, CrB2), and carbon-chromium compounds (Cr23C6). The main peaks of the phases of both samples appeared at about 45°, and the peak shapes were sharp. The main peak diffraction intensity of sample 6 was found to be higher than that of sample 7, and the content of CrB2 in sample 6 was also higher than that in sample 7. As compared with that in Figure 11(b), the half-height width of the main peak in Figure 11a is narrow. According to the Debye-Scherrer Equation (16), it can be determined that the grain size in the coating of sample 6 (Figure 11a) was relatively large. The formula is as follows:
where D is the average thickness of the crystal grains in the direction perpendicular to the crystal plane, K is the Scherrer constant, B is the half-height width of the diffraction peak of the sample, θ is the Bragg diffraction angle, and γ is the X-ray wavelength. γ-Ni is a ductile phase; its content was higher and its toughness was stronger at the bottom of the cladding layer, but its hardness was lower. In addition, after the γ-Ni precipitated after some primary hard phases, the crystal growth was easily inhibited by the hard phases, which changed the size and direction of the crystal grains and ultimately resulted in morphological differences in the fused structure within the cladding layer. The Cr23C6, Cr5B3, and CrB2 phases strengthened the hardness of the cladding layer, but the brittleness also increased. The middle-upper part of the cladding layer had a higher content of uniformly distributed, hard-phase grains. In addition, the intermetallic compounds FeNi3 and Ni2.9Cr0.7Fe0.36 generated in the laser-cladding layer also had a toughening effect on the cladding layer.
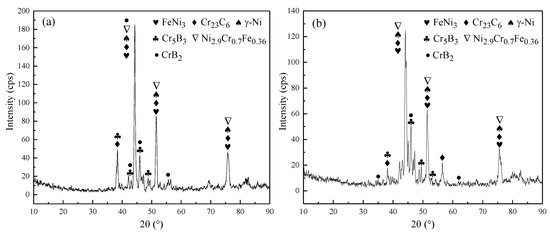
Figure 11.
X-ray diffraction pattern of the cladding layers of samples 6 and 7. (a) XDR pattern of the cladding layer of sample 6; (b) XDR pattern of the cladding layer of sample 7.
3.6. Microhardness Analysis
The microhardness of the coating was measured five times in the same horizontal direction every 0.2 mm from the coating to the substrate, and its average value was taken as the microhardness of the coating in the thickness direction. Figure 12 presents the microhardness values of sample 6, which had the greatest deformation, and those of sample 7, which had the least deformation. As presented in Figure 12, the microhardness values of the cladding layers of samples 6 and 7 were significantly greater than that of the substrate, and the overall microhardness of the coating of sample 7 was higher than that of sample 6. The maximum microhardness of sample 7 was about 0.4 mm from the surface layer and reached 782 HV0.2, while the maximum microhardness of sample 6 was only 742 HV0.2. This demonstrates that when laser cladding with different process parameters is employed to repair thin-walled parts, the overall microhardness of a coating with less deformation will be higher than that of a coating with greater deformation. After approaching the metallurgical bonding zone, the microhardness decreased significantly until it reached a stable state after decreasing to the hardness of the matrix. The reason for this phenomenon is that, at the top of the cladding layer, oxide is formed due to the influence of air, resulting in the hardness of the surface layer being slightly lower than that of the middle-upper part. There was a lesser influence of the external environment of the middle-upper part of the cladding layer, and it more easily formed a denser and fine crystal structure; thus, its hardness was the highest. In addition, the Hall-Petch formula [28] also indicates that the smaller the grain size, the higher the hardness of the coating. The formula is as follows:
where Hv is hardness, H0 and kH are constants related to hardness, and d is the average grain size. In the metallurgical bonding zone, the substrate undergoes convection, and the alloy powder and the substrate are mutually soluble. As a result, the composition of the bonding zone changes greatly, which results in the hardness of the bonding zone being higher than that of the substrate and lower than that of the cladding layer, which plays a transition role.
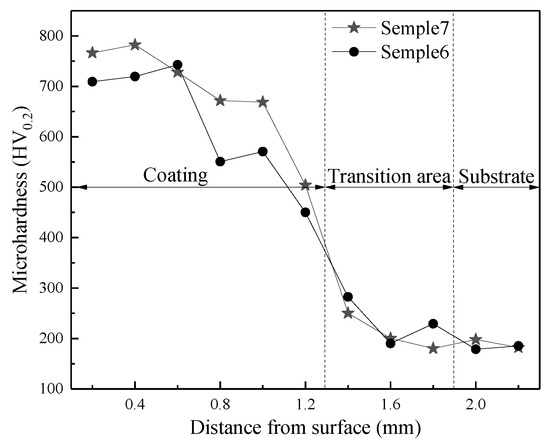
Figure 12.
Microhardness values of samples 6 and 7.
4. Conclusions
- According to the analysis of the orthogonal experiment results, the order of the influence of factors on the deformation of thin-walled parts from greatest to least was determined to be as follows: laser power > scanning speed > powder feed rate. The optimal parameters by which to obtain the minimum deformation and good metallurgical bonding of thin-walled parts were found to be a powder feed rate of 1.4 r/min, a laser power of 1,100 W, and a scanning speed of 8 mm/s.
- The amount of deformation in the thickness direction of the thin-walled parts was found to increase with the increase of the laser power. Increasing the scanning speed and the powder feed rate was found to reduce the amount of deformation in the thickness direction of the thin-walled parts. The laser power was found to have a significant effect on the deformation of thin-walled parts, but the powder feed rate was found to have no significant effect.
- Under the optimal process parameters, a good metallurgical bond was formed between the coating and the substrate, and the internal structure of the cladding layer was continuously dense without obvious defects, such as cracks and pores. This finding provides an important theoretical basis for the deformation control of thin-walled parts repaired by laser cladding.
Author Contributions
W.S., H.H., and Y.H. assisted in the completion of the experiments. J.Y. completed the design of the experiments and the writing of the article. All authors have read and agreed to the published version of the manuscript.
Funding
This research was funded by Karamay Major Project (No. 2018ZD002B) and Construction Project of Public Technical Service System in Autonomous Region (No. 2015531096).
Acknowledgments
The author appreciates the support from the Karamay Major Project (No. 2018ZD002B) and Construction Project of Public Technical Service System in Autonomous Region (No. 2015531096). The author would also like to thank Lei from Eceshi for the EDS and XRD tests.
Conflicts of Interest
The authors declare no conflict of interest.
References
- Matsumoto, M.; Yang, S.; Martinsen, K.; Kainuma, Y. Trends and research challenges in remanufacturing. Int. J. Precis. Eng. Manuf. Green Technol. 2016, 3, 129–142. [Google Scholar] [CrossRef]
- Penaranda, X.; Moralejo, S.; Lamikiz, A.; Figueras, J. An adaptive laser cladding methodology for blade tip repair. Int. J. Adv. Manuf. Technol. 2017, 92, 4337–4343. [Google Scholar] [CrossRef]
- Um, J.; Rauch, M.; Hascoët, J.Y.; Stroud, I. Step-nc Compliant process planning of additive manufacturing: remanufacturing. Int. J. Adv. Manuf. Technol. 2017, 88, 1215–1230. [Google Scholar] [CrossRef]
- Xu, L.; Cao, H.; Liu, H.; Zhang, Y. Study on laser cladding remanufacturing process with FeCrNiCu alloy powder for thin-wall impeller blade. Int. J. Adv. Manuf. Technol. 2017, 90, 1383–1392. [Google Scholar]
- Wu, J.; Zhu, G.; Lu, B.; Shi, T.; Fu, G. Influence of self-regulation-effect on forming quality of thin-walled parts with variable laser spot cladding. J. Xi’an Jiaotong Univ. 2016, 50, 145–150. [Google Scholar]
- Sun, J.; Zhao, Y.; Yang, L.; Yu, T. Process optimization for improving topography quality and manufacturing accuracy of thin-walled cylinder direct laser fabrication. Int. J. Adv. Manuf. Technol. 2019, 105, 2087–2101. [Google Scholar] [CrossRef]
- Aghili, S.E.; Shamanian, M. Investigation of powder fed laser cladding of NiCr-chromium carbides single-tracks on titanium aluminide substrate. Opt. Laser Technol. 2019, 119, 105652. [Google Scholar] [CrossRef]
- Christian, K.; Holger, P.; Martin, R.; Frank, B.; Jens, B.; Christoph, L. Analysis of Melt Pool Characteristics and Process Parameters Using a Coaxial Monitoring System during Directed Energy Deposition in Additive Manufacturing. Materials 2019, 12, 308. [Google Scholar]
- Wang, X.; Sun, W.; Chen, Y.; Zhang, J.; Huang, Y.; Huang, H. Research on trajectory planning of complex curved surface parts by laser cladding remanufacturing. Int. J. Adv. Manuf. Technol. 2018, 96, 2397–2406. [Google Scholar] [CrossRef]
- Wang, J.; Han, F.; Ying, W. Surface evenness control of laser solid formed thin-walled parts based on the mathematical model of the single cladding layer thickness. J. Laser Appl. 2019, 31, 022009. [Google Scholar] [CrossRef]
- Yu, T.; Sun, J.; Qu, W.; Zhao, Y.; Yang, L. Influences of z-axis increment and analyses of defects of AISI 316L stainless steel hollow thin-walled cylinder. Int. J. Adv. Manuf. Technol. 2018, 97, 2203–2220. [Google Scholar] [CrossRef]
- Niz’ev, V.G.; Khomenko, M.D.; Mirzade, F.K. Process planning and optimisation of laser cladding considering hydrodynamics and heat dissipation geometry of parts. Quantum Electron. 2018, 48, 743–748. [Google Scholar] [CrossRef]
- Zhao, J.; Xie, D.; Liang, H.; Xiao, M.; Shen, L.; Tian, Z. Review of distortion and residual stress in metal additive manufacturing. J. Nanjing Univ. Aeronaut. Astronaut. 2019, 51, 1–6. [Google Scholar]
- Ning, J.; Sievers, D.E.; Garmestani, H.; Liang, S.Y. Analytical modeling of in-situ deformation of part and substrate in laser cladding additive manufacturing of Inconel 625. J. Manuf. Process. 2020, 49, 135–140. [Google Scholar] [CrossRef]
- Meng, L.; Zeng, X.; Hou, K.; Hu, Q.; Wang, D. Effect of laser cladding and laser-induction hybrid cladding coatings on the bending properties and fracture behavior of rails. Surf. Coat. Technol. 2019, 374, 1038–1050. [Google Scholar] [CrossRef]
- Jinoop, A.N.; Denny, J.; Paul, C.P.; Kumar, J.G.; Bindra, K.S. Effect of post heat-treatment on the microstructure and mechanical properties of hastelloy-x structures manufactured by laser based directed energy deposition. J. Alloy. Compd. 2019, 797, 399–412. [Google Scholar] [CrossRef]
- Ding, C.; Cui, X.; Jiao, J.; Zhu, P. Effects of substrate preheating temperatures on the microstructure, properties, and residual stress of 12crni2 prepared by laser cladding deposition technique. Materials 2018, 11, 2401. [Google Scholar] [CrossRef]
- Li, R.; Qiu, Y.; Zheng, Q.; Liu, B.; Chen, S.; Tian, Y. Finite element simulation of temperature and stress field for laser cladded nickel-based amorphous composite coatings. Coatings 2018, 8, 336. [Google Scholar] [CrossRef]
- Tao, Y.; Li, J.; Lu, Y.; Hu, L. Residual stress distribution in different depths of TiNi/Ti2Ni-based laser clad coating prepared at different environmental temperatures. Trans. Nonferr Metal. Soc. China 2017, 27, 2043–2054. [Google Scholar] [CrossRef]
- Wang, D.; Hu, Q.; Zeng, X. Residual stress and cracking behaviors of Cr13Ni5Si2-based compositecoatings prepared by laser-induction hybrid cladding. Surf. Coat. Technol. 2015, 274, 51–59. [Google Scholar] [CrossRef]
- Narayanan, A.; Mostafavi, M.; Pirling, T.; Kabra, S.; Lewis, R.; Pavier, M.J.; Peel, M.J. Residual stress in laser cladded rail. Tribol. Int. 2019, 140, 105844. [Google Scholar] [CrossRef]
- Yu, J.; Sun, W.; Huang, H.; Wang, W.; Wang, Y.; Hu, Y. Crack sensitivity control of nickel-based laser coating based on genetic algorithm and neural network. Coatings 2019, 9, 728. [Google Scholar] [CrossRef]
- Wang, X.; Deng, D.; Yi, H.; Xu, H.; Yang, S.; Zhang, H. Influences of pulse laser parameters on properties of AISI316L stainless steel thin-walled part by laser material deposition. Opt. Laser Technol. 2017, 92, 5–14. [Google Scholar] [CrossRef]
- Krzyzanowski, M.; Bajda, S.; Liu, Y. 3D analysis of thermal and stress evolution during laser cladding of bioactive glass coatings. J. Mech. Behav. Biomed. 2016, 59, 404–417. [Google Scholar] [CrossRef] [PubMed]
- Yan, H.; Shen, L.; Wang, X.; Tian, Z.; Xu, G.; Xie, D.; Liang, H. Stress and deformation evaluation of the subarea scanningeffect in direct laser-deposited Ti-6Al-4V. Int. J. Adv. Manuf. Technol. 2018, 97, 915–926. [Google Scholar] [CrossRef]
- Yan, Z.; Liu, W.; Tang, Z.; Liu, X.; Zhang, N.; Wang, Z.; Zhang, H. Effect of thermal characteristics on distortion in laser cladding of aisi 316l. J. Manuf. Process. 2019, 44, 309–318. [Google Scholar] [CrossRef]
- Huang, K.; Xie, C.; Xu, D. Deformation measurement of thin plate die steel during pulsed nd: YAG laser remelting. Chin. J. Lasers 2003, 30, 750–754. [Google Scholar]
- Wang, K.; Du, D.; Liu, G.; Chang, B.; Ju, J.; Sun, S.; Fu, H. Microstructure and property of laser clad Fe-based composite layer containing Nb and B4C powders. J. Alloy. Compd. 2019, 802, 373–384. [Google Scholar] [CrossRef]


© 2020 by the authors. Licensee MDPI, Basel, Switzerland. This article is an open access article distributed under the terms and conditions of the Creative Commons Attribution (CC BY) license (http://creativecommons.org/licenses/by/4.0/).