Article

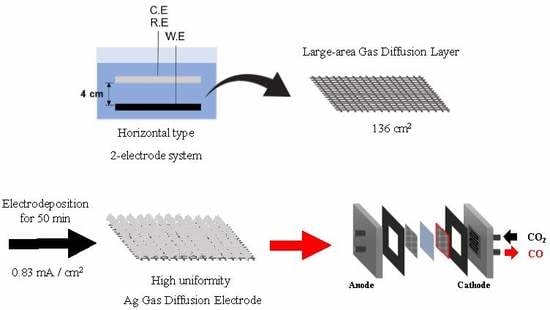
Fabrication of Large Area Ag Gas Diffusion Electrode via Electrodeposition for Electrochemical CO2 Reduction

1
School of Integrative Engineering, Chung-Ang University, Seoul 06974, Korea
2
Center for Hydrogen Fuel Cell Research, Korea Institute of Science and Technology (KIST), Seoul 02792, Korea
*
Author to whom correspondence should be addressed.
Coatings 2020, 10(4), 341; https://doi.org/10.3390/coatings10040341
Submission received: 25 February 2020 / Revised: 18 March 2020 / Accepted: 27 March 2020 / Published: 1 April 2020
(This article belongs to the Special Issue Thin Films: Application of Optical and Electronic Devices)

Abstract

:
For the improvement for the commercialization of electrochemical carbon dioxide (CO2) conversion technology, it is important to develop a large area Ag gas diffusion electrode (GDE), that exhibits a high electrochemical CO2 conversion efficiency and high cell performance in a membrane electrode assembly (MEA)-type CO2 electrolyzer. In this study, the electrodeposition of Ag on a carbon-paper gas diffusion layer was performed to fabricate a large area (25.5 and 136 cm2) Ag GDE for application to an MEA-type CO2 electrolyzer. To achieve uniformity throughout this large area, an optimization of the electrodeposition variables, such as the electrodes system, electrodes arrangement, deposition current and deposition time was performed with respect to the total electrolysis current, CO production current, Faradaic efficiency (FE), and deposition morphology. The optimal conditions, that is, galvanostatic deposition at 0.83 mA/cm2 for 50 min in a horizontal, two-electrode system with a working-counter electrode distance of 4 cm, did ensure a uniform performance throughout the electrode. The position-averaged CO current densities of 2.72 and 2.76 mA/cm2 and FEs of 83.78% (with a variation of 3.25%) and 82.78% (with a variation of 8.68%) were obtained for 25.5 and 136 cm2 Ag GDEs, respectively. The fabricated 136 cm2 Ag GDE was further used in MEA-type CO2 electrolyzers having an active geometric area of 107.44 cm2, giving potential-dependent CO conversion efficiencies of 41.99%–57.75% at Vcell = 2.2–2.6 V.

Graphical Abstract

1. Introduction

Carbon dioxide (CO2) is one of the representative greenhouse gases generated during the combustion and chemical processes of fossil fuels. Studies have been performed on the conversion of CO2 into value-added chemicals via thermochemical, electrochemical and photochemical methods [1,2,3,4,5,6]. Among them, the electrochemical conversion of CO2 is an effective way to generate various organic materials from CO2 under atmospheric temperature and pressure conditions [7] by using product-selective catalysts and a liquid-dissolved/direct gaseous CO2 feed. However, because CO2 is thermodynamically stable, having a linear molecular structure, the use of a suitable catalyst is necessary to reduce CO2. Depending on the selectivity of the catalyst, the products of electrochemical CO2 conversion can vary, e.g., CO [8,9], CH4 [10,11], C2H6 [12,13], HCOOH [14,15], and many other low-C products. Among the products, CO has the following benefits: a small amount of electrical energy required for production [16,17], a simple reaction path [18], and a high market price as a feed material for the Fischer–Tropsch process [19].
Thus, numerous studies have been performed on the electrochemical reduction of CO2 to CO. Metal catalysts such as Au and Ag have high CO selectivity [7], since Au and Ag are known to have weak metal-CO binding [20] which is beneficial to CO production [21]. Although Ag has benefits over Au with regard to cost, it requires a higher overpotential than Au, owing to its moderate activity [22]. To overcome this, the fabrication of nanoparticles with unique shapes, such as nano-corals or triangular nanoplates, which maximize the amounts of active sites for CO production, has been attempted in many studies [23,24,25]. For example, Ag nano-coral catalysts fabricated by Hsieh et al. [23] had a CO production current density of 6.62 mA/cm2, which was approximately 16.55 times higher than that of Ag nanoparticles.
However, most previous studies focused on the development of new catalysts having the advantageous physicochemical properties and high selectivity/activity for CO production at the laboratory level using half-cells and H-type cells [24,26,27,28,29], which cannot yet be scaled for commercialization. For the large-scale conversion of CO2, systems using an aqueous solution-based electrolyte with dissolved CO2 should be avoided, owing to the limited solubility of CO2 in water (~0.03 mol kg−1 at ~300 K and 1 atm) [30]. In contrast, flow cell systems such as proton-exchange membrane (PEM)-based membrane electrode assembly (MEA)-type CO2 electrolyzers [31,32,33,34,35], are capable of converting large amounts of CO2. Some of them have achieved very high efficiencies of 80%–85%, with high CO partial current densities of 50–290 mA/cm2 [31,33], and there are still items to consider, such as using commercial electrodes [31,32], a small electrode area [33,34], and high operating cell voltage [31]. In our previous study, we examined the performance of an Ag gas diffusion electrode (GDE), having a geometric area of 2.8 × 2.8 cm2, and fabricated via electrodeposition to control hydrophilicity using acid-treated carbon paper for a PEM-based MEA-type CO2 electrolyzer [36]. The PEM-based MEA-type CO2 electrolyzer using Ag GDE is commercially advantageous, but in order to manufacture a high-capacity system for the large-scale conversion of CO2, a fabrication method for large area electrodes must be developed.
In the present study, we present the studies of a large area (25.5 and 136 cm2) Ag GDE, having a uniformly high electrochemical CO2 conversion efficiency and high cell performance throughout the geometric area, which is suitable for scaling the MEA-type CO2 electrolyzer. The main objective was to achieve the uniformity of the electrodeposited Ag catalyst over a large area for maintaining high activity, even with a large electrode. To achieve the effective production of large area electrodes using electrodeposition, the process variables that can affect the current distribution [37,38,39], such as the electrodes system, electrodes placement, deposition current density and deposition time, were optimized with regard to uniformity and performance.

2. Materials and Methods

2.1. Materials and Equipments

Ag catalysts were prepared via electrodeposition using a potentiostat (CS310, Wuhan CorrTest Instruments Corp., Ltd., Wuhan, China). The substrate for Ag electrodeposition was a carbon paper (AvCarb Material Solutions, Lowell, MA, USA; AvCarb MGL 280, 1594009)-based gas diffusion layer. The substrate was employed after pretreatment in a sulfuric acid (H2SO4; 95%, Junsei, 83010S1250) solution using a sonicator for 15 min [36]. A mixture of 0.6 M ammonium sulfate ((NH4)2SO4, 99%, 11566; Alfa Aesar, Haverhill, MA, USA) as the supporting electrolyte, 0.01 M silver nitrate (AgNO3, 99.9%, Alfa Aesar, 11414) as the Ag precursor, and 0.04 M ethylenediamine (C2H8N2, 99%, E1521; Aldrich, St. Louis, MO, USA) [40] was used as the electrolyte (pH of 8.6). The geometric area of the carbon paper used for electrodeposition was 25.5 and 136 cm2, respectively, and the lead wires were connected either at the top or at the sides of the carbon paper according to the arrangement of the electrodes (Figure 1).

2.2. Fabrication of Ag GDE

The Ag catalyst was fabricated in both three-electrode and two-electrode systems to examine the differences in the morphology and CO2 conversion efficiency, at room temperature and ambient pressure. For the three-electrode system, an electrodeposition of the Ag catalyst was performed using acid-treated carbon paper, a Pt plate, and a saturated calomel electrode (SCE, saturated KCl) as the working, counter, and reference electrodes, respectively, at −0.49 V (vs. SCE) for 50 min. The effect of the deposition time on the characteristics of the Ag catalysts can be found in our previous work, particularly on the adhesion problem at the longer deposition time [41]. For the two-electrode system, electrodeposition of the Ag catalyst was performed via galvanostatic methods for the same duration. The same working and counter electrodes were used: acid-treated carbon paper and a Pt plate, respectively. The galvanostatic deposition conditions were varied, such as the deposition current (0.63, 0.83 and 1.03 mA/cm2), the distance between the working and counter electrodes (1, 2, 4 and 5 cm), and the deposition time (5 and 50 min). The morphology and uniformity of the Ag deposits were analyzed using field-emission scanning electron microscopy (FE-SEM, SIGMA, Carl Zeiss) at different positions on the large area Ag GDE (denoted as A–E). The loading amounts of Ag by electrodeposition were analyzed with inductively coupled plasma optical emission spectroscopy (ICPOES, Optima 8300, Perkin Elmer, Waltham, MA, USA).

2.3. Electrochemical CO2 Reduction to CO in Half-Cell

For testing the CO2 reduction to confirm the uniform activity throughout the large area Ag GDE, the electrodeposited Ag GDEs were cut into three pieces (for the 25.5 cm2 GDE) or five pieces (for the 136 cm2 GDE), each having a geometric area of 2.56 cm2. The positions of the cut pieces are shown in Figure 1a,b and Figure 9a. Using the cut pieces as working electrodes, the electrochemical CO2 reduction was conducted using a potentiostat (WaveNow, Pine Instrument, Grove City, PA, USA) in a laboratory-made H-type cell, where the cathodic and anodic parts were divided by a PEM (Nafion 212, DupontTM), and Pt gauze and an SCE were used as the counter and reference electrodes, respectively. The electrolyte and operating conditions for the CO2 reduction were based on our previous experimental method [42]. In detail, 0.5 M potassium hydrogen carbonate (KHCO3, 99.5%, 6580-4400, DaeJung, Siheung-si, South Korea) was used for both the anolyte and the catholyte. The catholyte was saturated with CO2 gas for at least 30 min, and the anolyte was saturated with Ar gas for at least 30 min. During the operation, CO2 gas was continuously injected into the catholyte at a flow rate of 10 mL/min using a flow controller to maintain the CO2 saturation state. The CO2 reduction was performed for 30 min under a constant voltage of −1.5 V (vs. SCE), and the generated gas (CO, H2) was injected into a gas chromatograph (GC, 7890A, off-line mode, Agilent, Santa Clara, CA, USA). The produced H2 and CO were detected using a thermal-conductivity detector and a flame ionization detector, respectively. The average electrolysis current density measured during the last 1 min of the reduction was denoted as the total current density. The electrochemical Faradaic efficiency (FE) and the CO production partial current [22] were calculated using the detected concentrations of CO and H2, and the amounts of charge supplied during the same period of the last 1 min.

2.4. Electrochemical CO2 Reduction to CO in MEA-Type Electrolyzer

For the MEA-type CO2 electrolyzer, the fabricated 136 cm2 Ag GDE (actual geometric area of 107.44 cm2) with the optimized electrodeposition condition was used as the working electrode. The counter electrode for oxygen evolution was fabricated by the spray coating of IrO2 stock solution composed of IrO2 (99.99%, Alfa Aesar), Nafion-perfluorinated resin binder (5 wt%, Sigma-Aldrich), isopropyl alcohol (70%, Honeywell Research Chemicals) and de-ionized water onto the oxalic-acid-pretreated Ti paper, giving 1 mg/cm2 of IrO2 loading. Once the electrodes were prepared, the MEA was fabricated by assembling the two electrodes with the PEM (Nafion 117, DuPontTM). A thicker membrane of Nafion 117 (183 µm) was used in making MEA instead of Nafion 212 (50.8 µm) to ensure the mechanical stability under the condition of massive CO2 feed and pressurized system explained in the forthcoming section.
10 mL/min of KHCO3 solution (1.0 M; 99.7%, Sigma-Aldrich) and 100 mL/min of KOH solution (1.0 M; 90%, Sigma-Aldrich) were fed and circulated as the catholyte and anolyte, respectively, using flow fields at both electrodes. Gaseous CO2 at a rate of 150 mL/min (the ratio of the volumetric gaseous flow rate to the cross-sectional area for the gas flow channel was 83.3 cm/sec) were also fed to the cathode using a separated flow field. The electrolysis performance was evaluated at a different cell potential (Vcell) range (1.8 to 3.4 V), using a potentiostat (HCP-803, Bio-Logic Science Instruments, Seyssinet-Pariset, France) under pressurized conditions at 4 bar. The amounts of produced CO and H2 during the electrolysis were measured by a GC (7890B, Agilent, off-line mode).

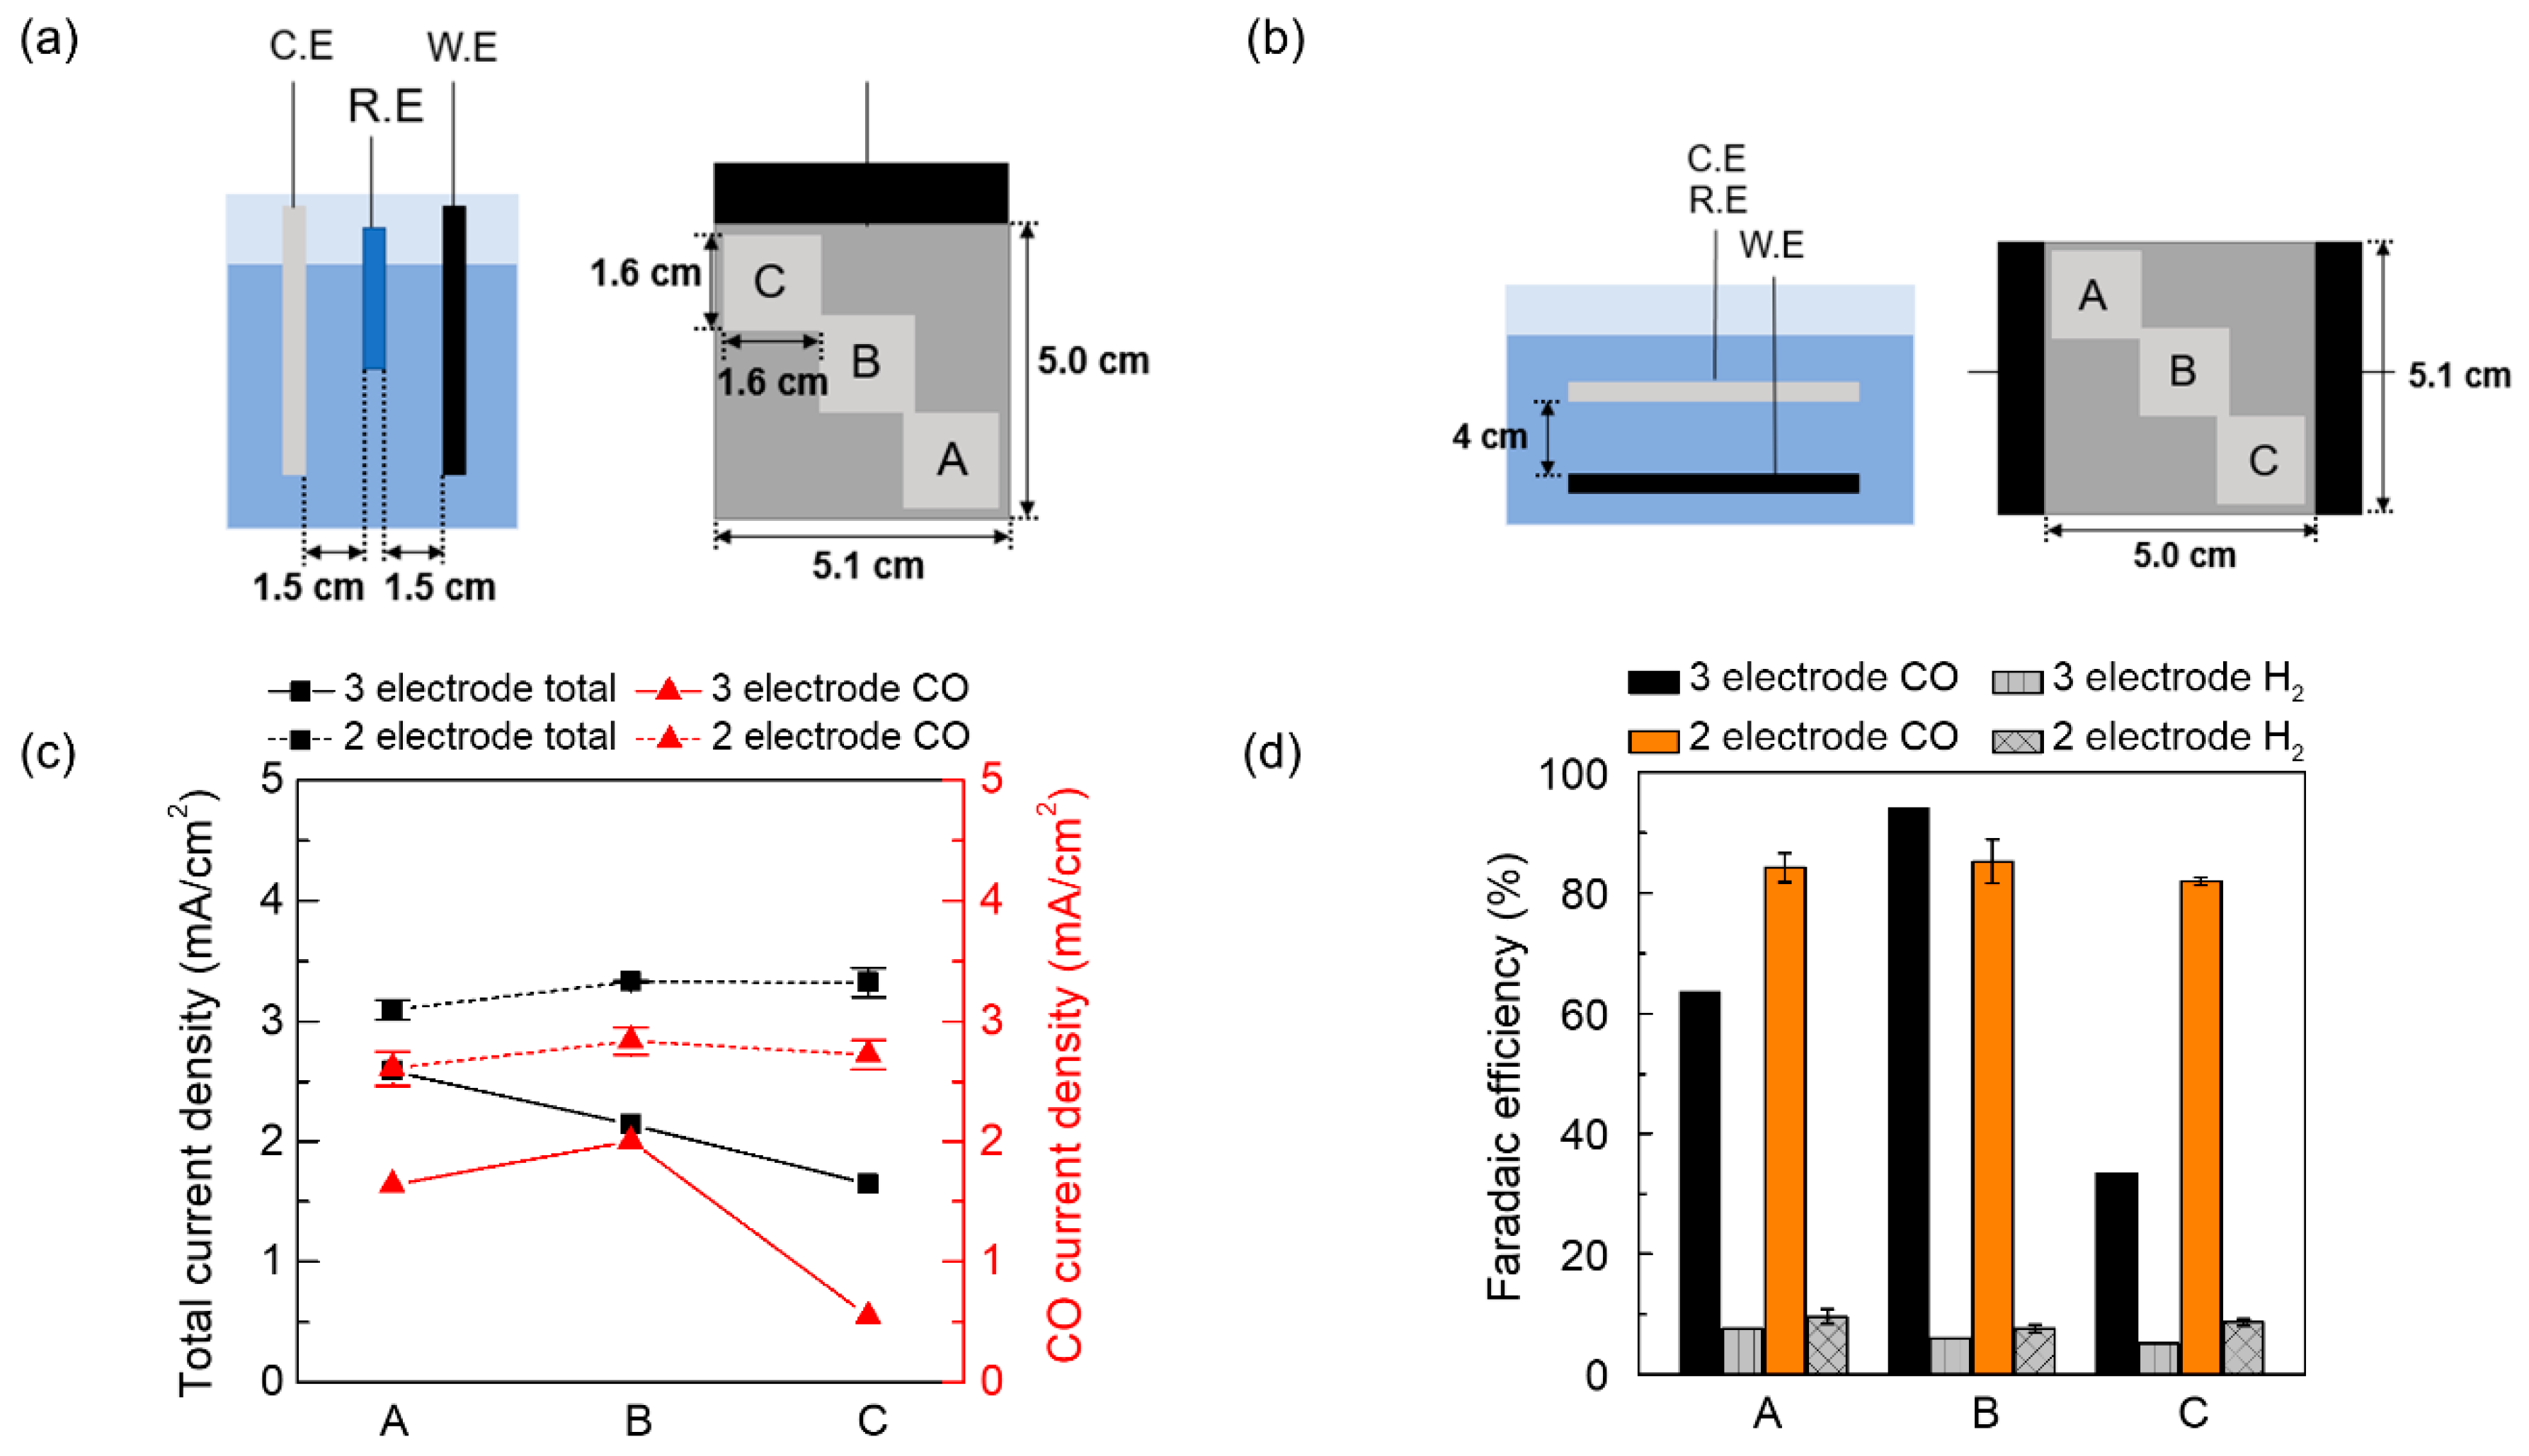
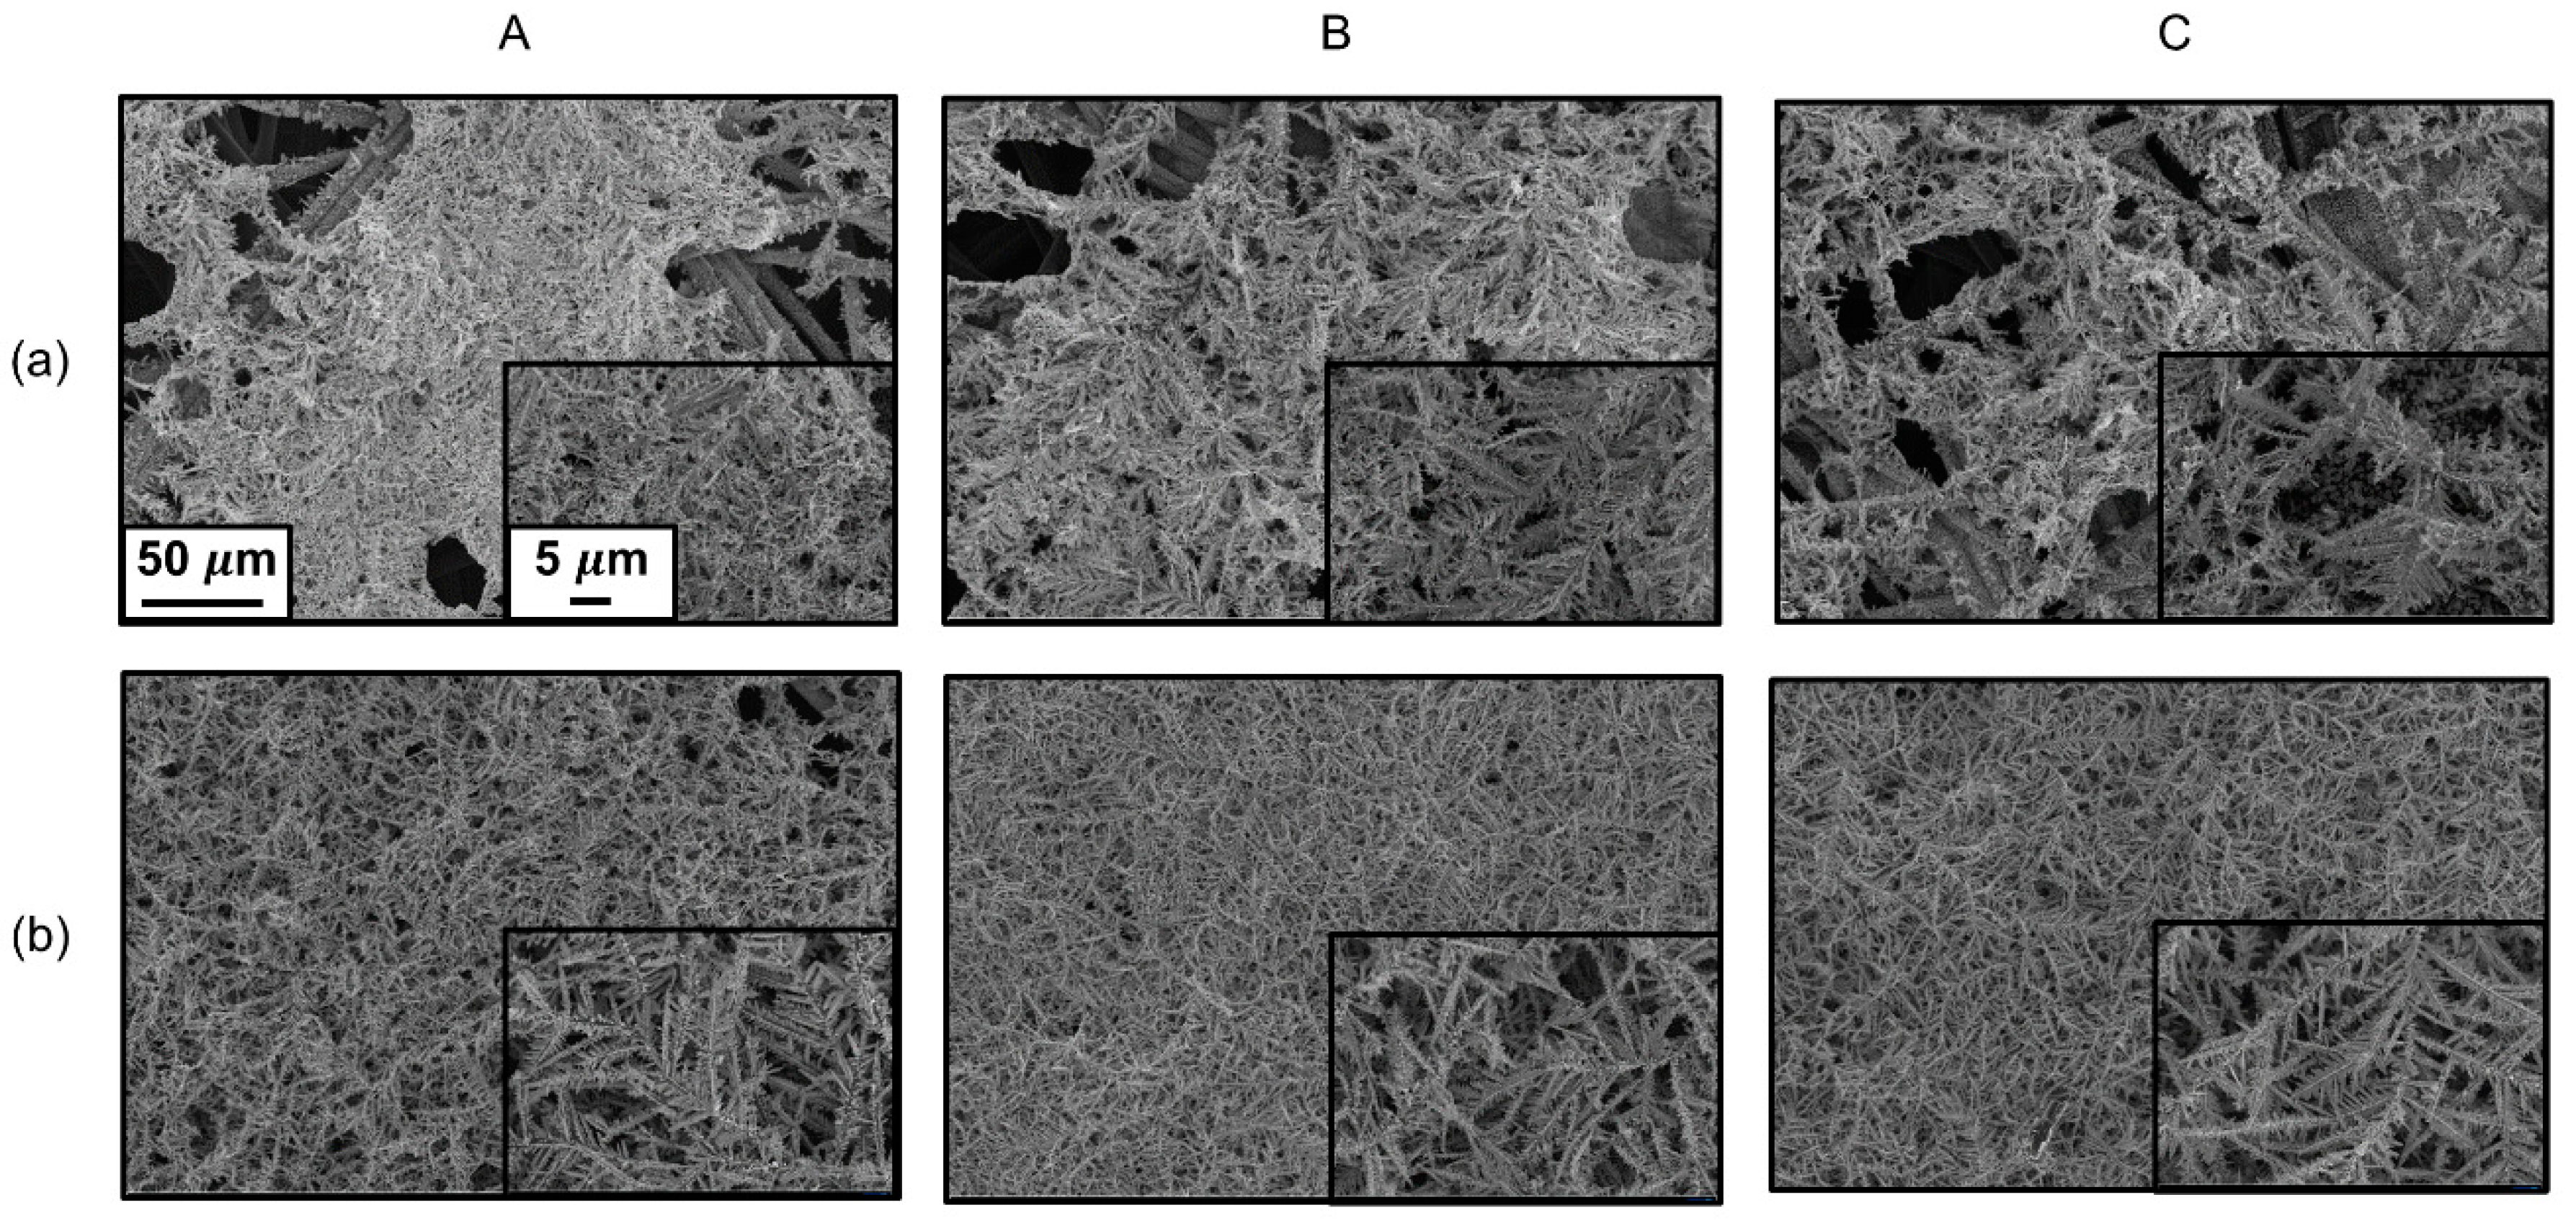
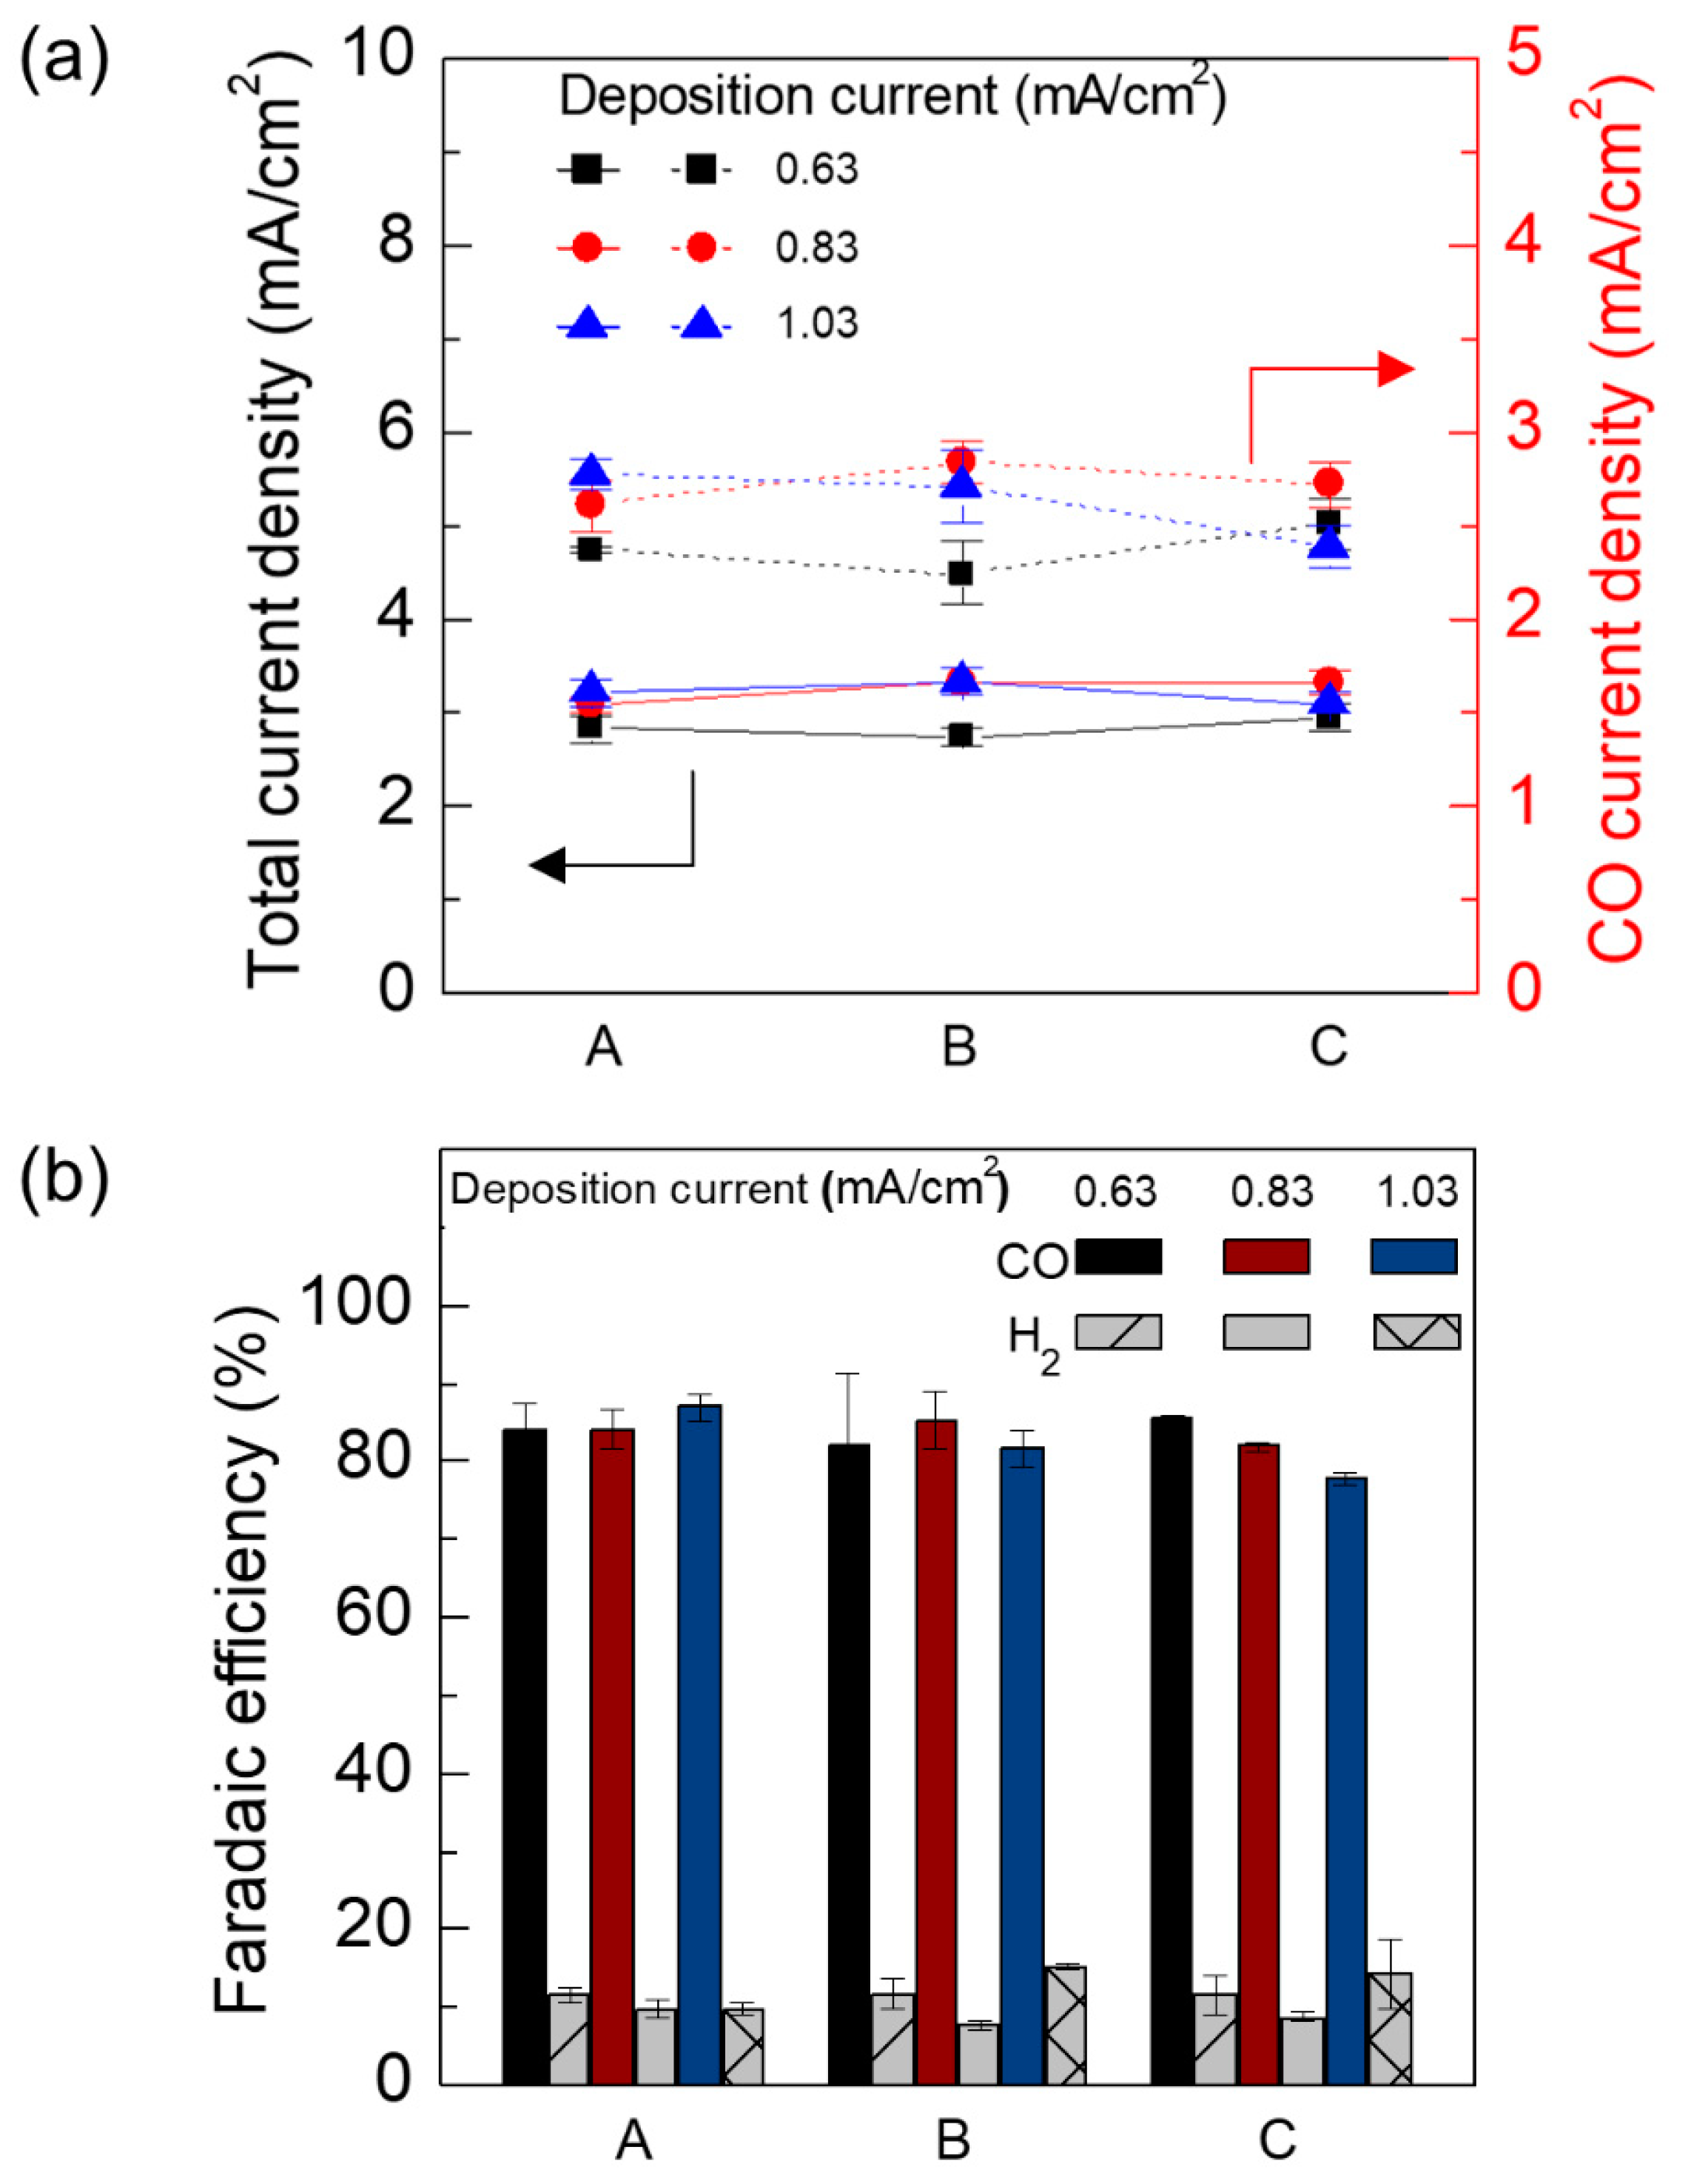
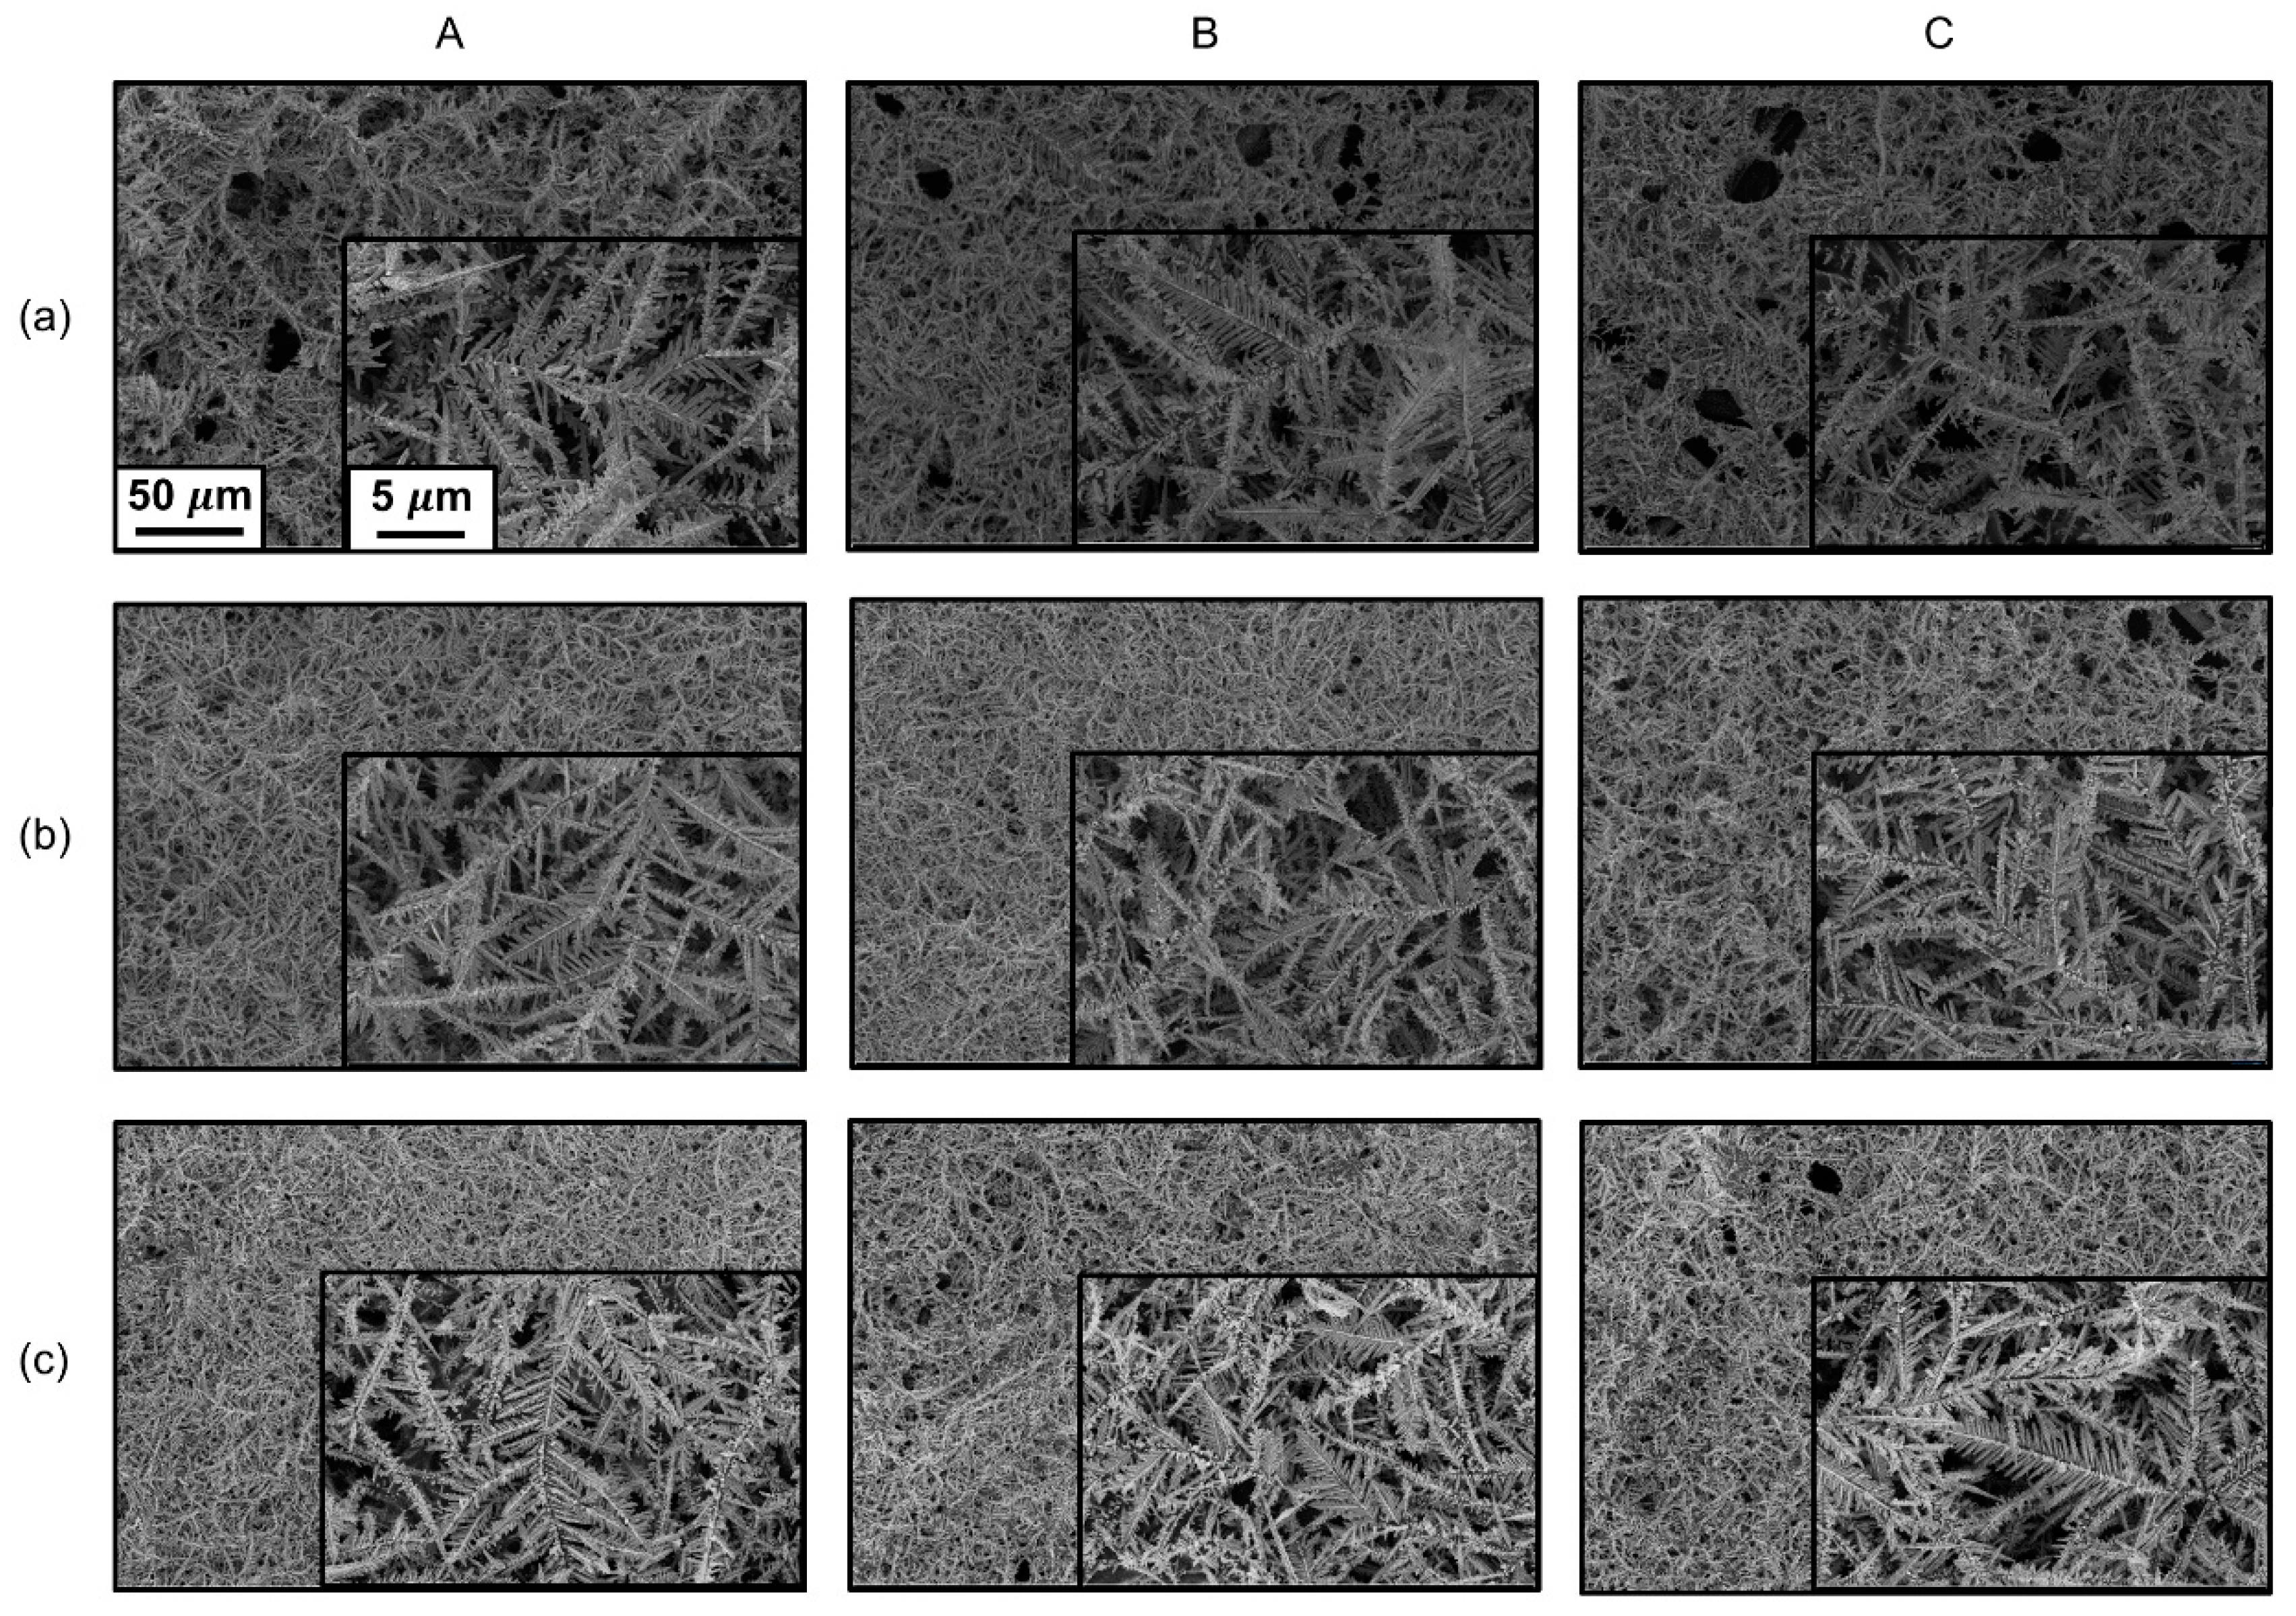
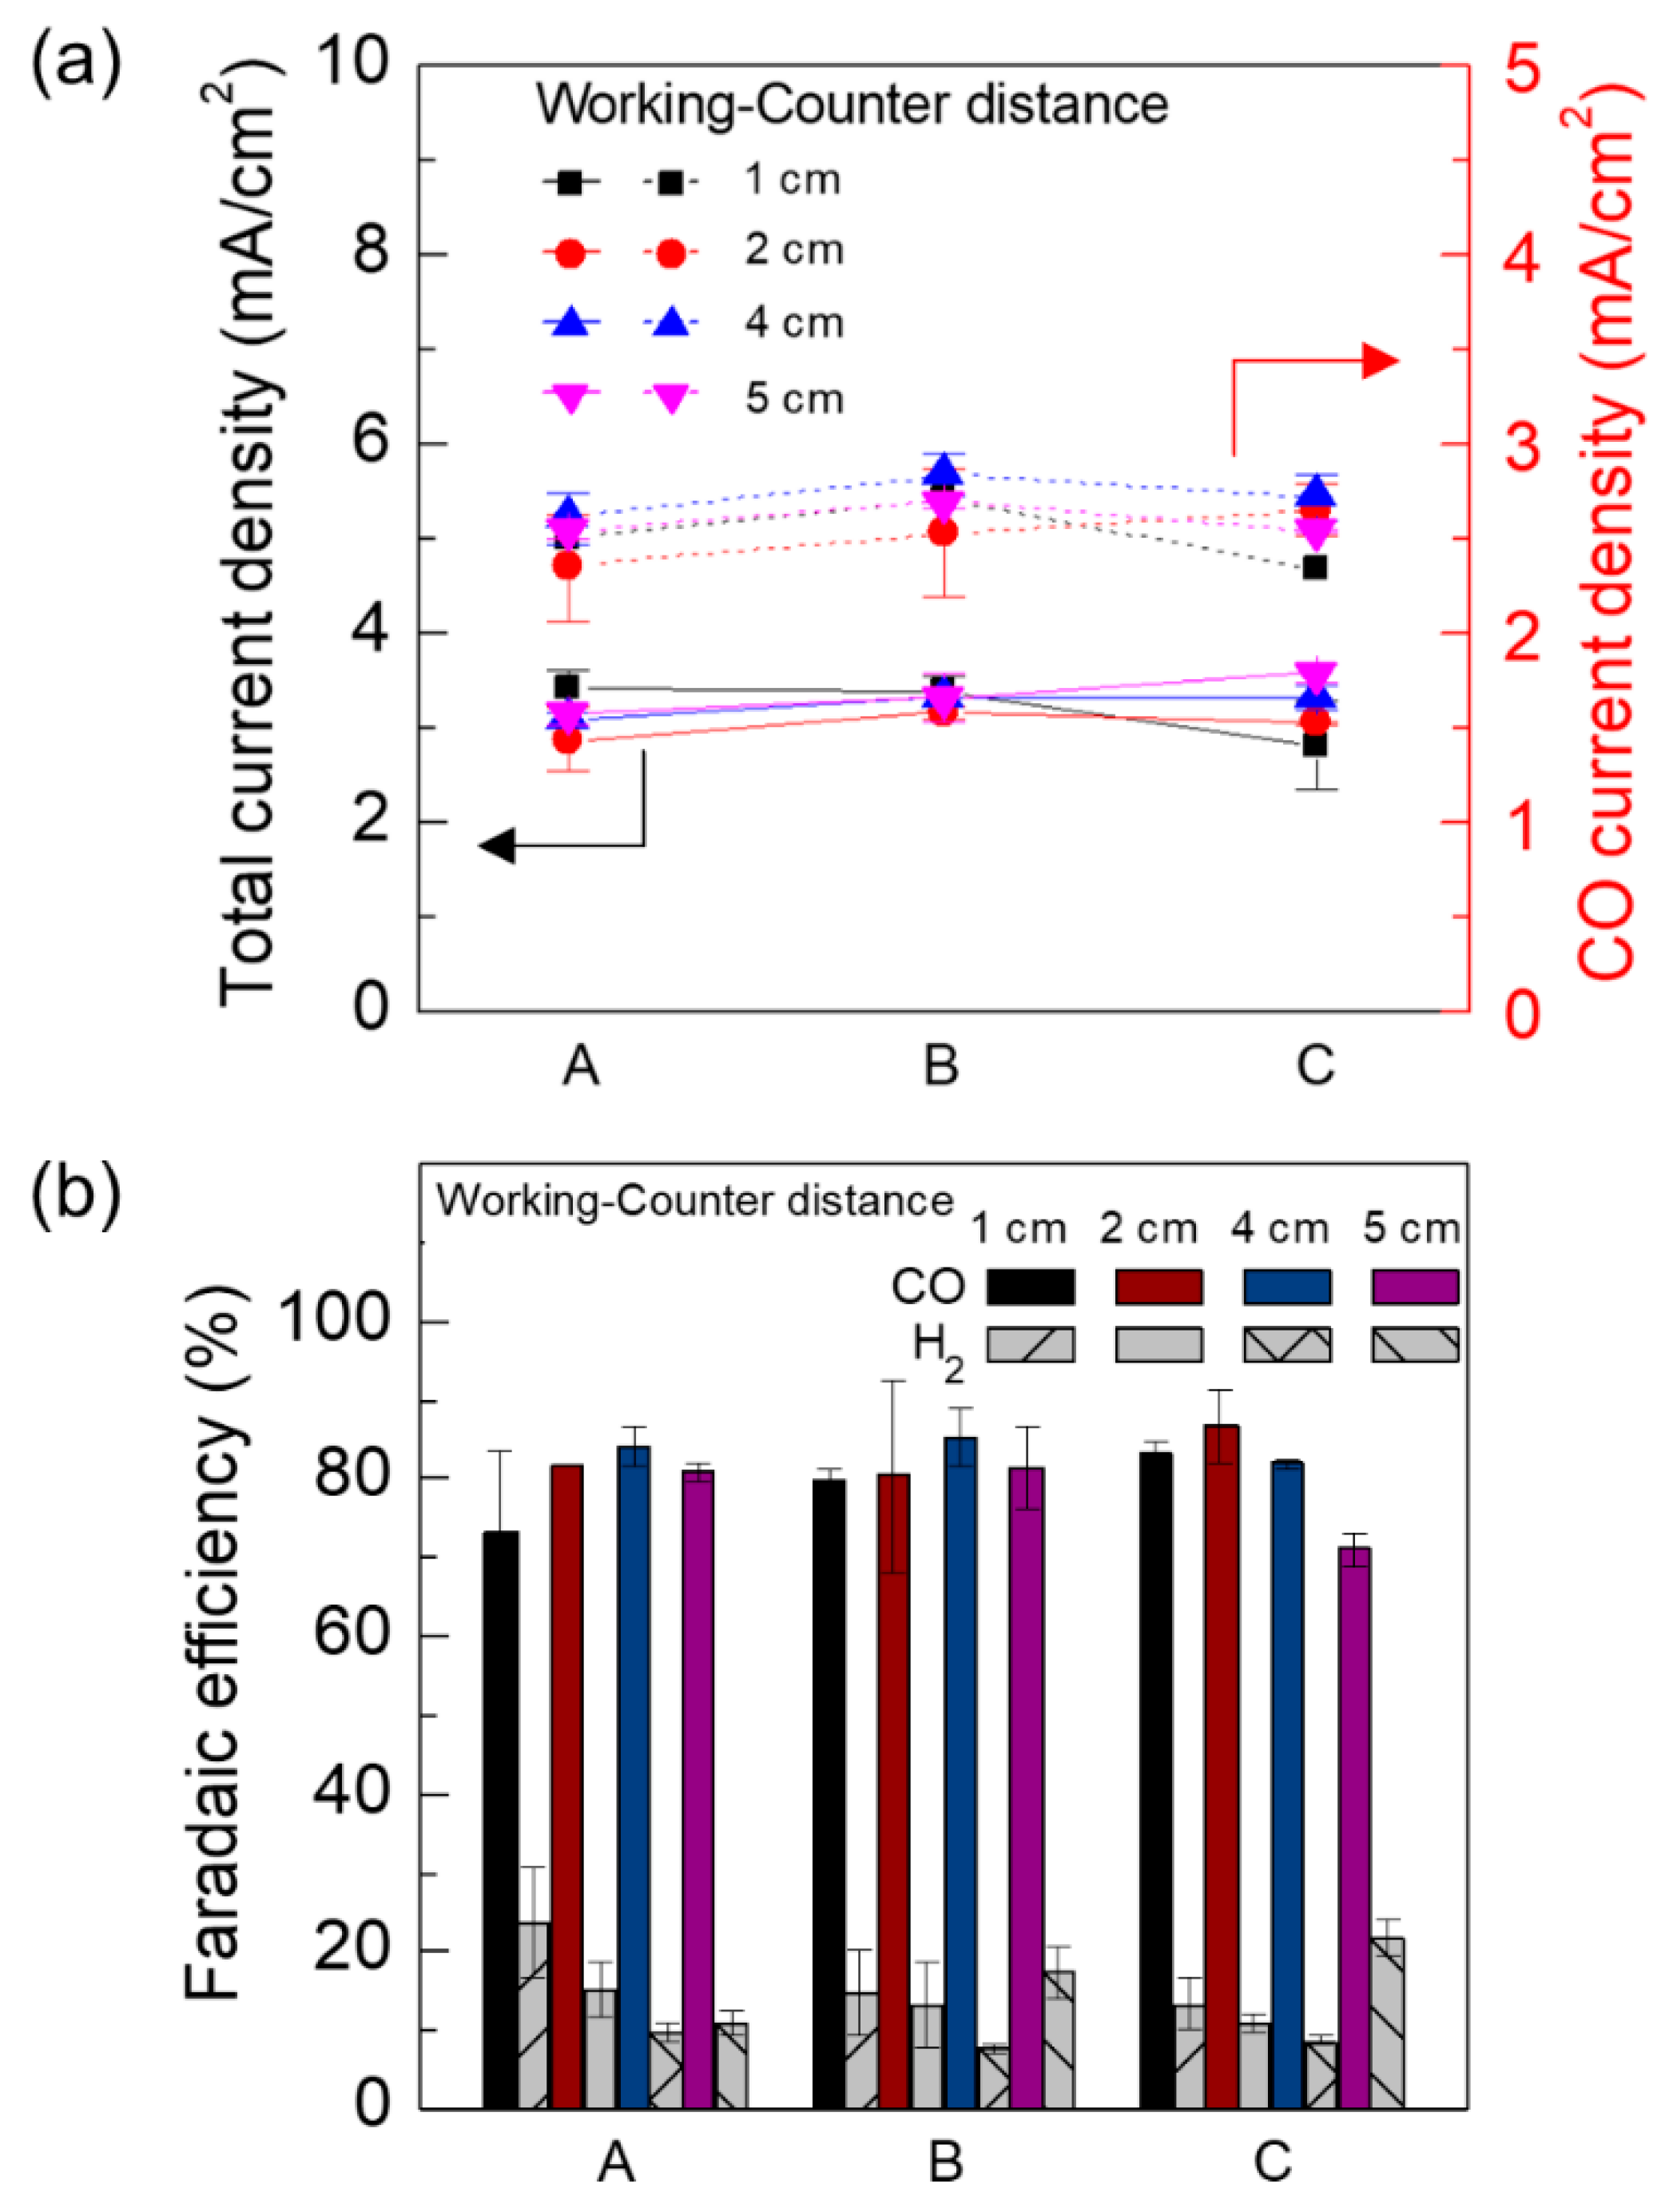
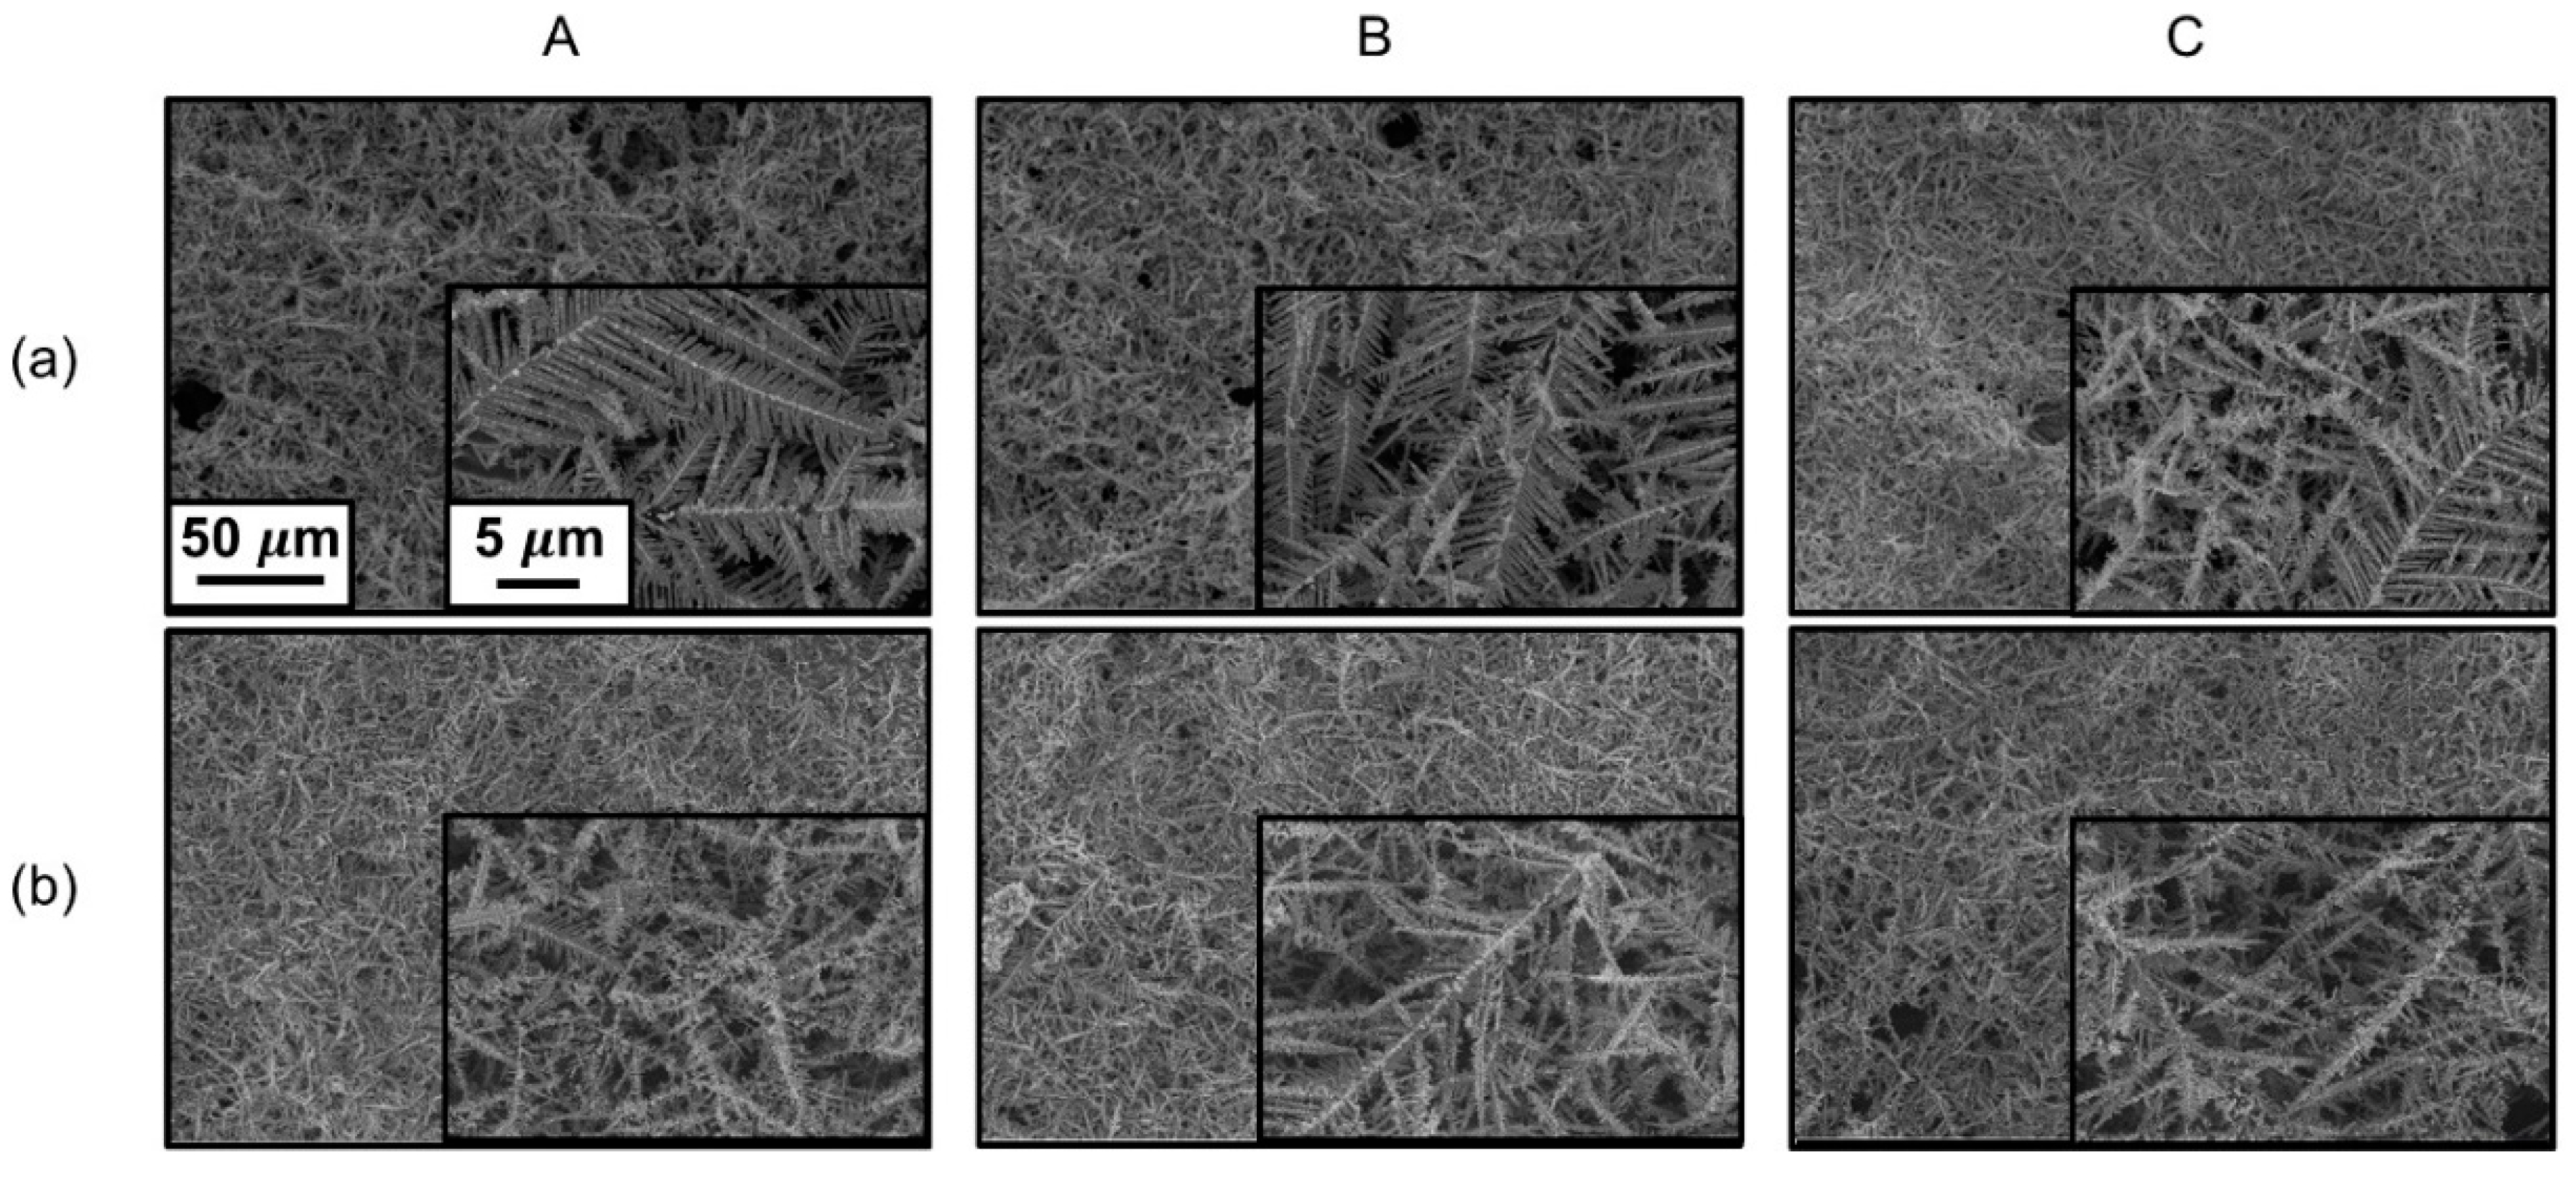
3. Results and Discussion

Large area (25.5 cm2) Ag GDEs were manufactured using three- and two-electrode systems to examine the effects of the electrode system on the uniformity of the catalyst formation and the electrochemical CO2 reduction efficiency. Figure 1a shows a schematic of the three-electrode system consisting of working, counter and reference electrodes. The reference electrode was between the working and counter electrodes, and the distance between the electrodes was maintained at 1.5 cm (Note that the placement of the reference electrode at the side of the working electrode was not adopted here, since it may cause severe non-uniform distribution in the solution resistances between the closest and the farthest parts of the working electrode, particularly in the case of the large area working electrode). Figure 1b shows a schematic of the two-electrode system consisting of working and counter electrodes, where the distance between the electrodes was fixed as 4 cm. Because there was no reference electrode in the two-electrode system, the reduced restriction on placing the electrodes allowed for a horizontal arrangement of the electrodes. In both figures, A, B and C represent the pieces cut to evaluate the uniformity within the electrode. The electrochemical CO2 reduction using each piece in Figure 1a,b was measured. Both the total reduction current and the CO production partial current are presented in Figure 1c. As shown, the Ag GDE deposited via the two-electrode system exhibited higher total current density and CO current density values than the Ag GDE deposited via the three-electrode system. In particular, the Ag GDE fabricated via the two-electrode system exhibited similar total current density values (3.09–3.33 mA/cm2) and CO current density values (2.61–2.83 mA/cm2), regardless of the position within the large electrode. However, for the three-electrode system, the total current density was in the range of 1.65–2.58 mA/cm2 according to the position, exhibiting non-uniformity. The non-uniformity was also severe in the case of the CO current density, which ranged from 0.55 to 2.01 mA/cm2. The variation in the performance according to the position within the electrode was confirmed by examining the FE, as shown in Figure 1d. The Ag GDE fabricated via the two-electrode system exhibited a highly uniform and high CO FE of 81.95%–85.2%, regardless of the position. In contrast, the Ag catalyst fabricated via the three-electrode system exhibited a CO FE ranging from 33.5% to 93.88%, depending on the position, exhibiting severe non-uniformity. The non-uniform characteristics of the Ag GDE fabricated with the three-electrode system are attributed to the uneven mass transport caused by the insertion of the reference electrode between the working and counter electrodes. Moreover, the differences in the length from the reference electrode to each position of the large working electrode might have caused differences in the ohmic voltage drop.
This is supported by the morphologies of the deposited Ag, which are shown in Figure 2 for both electrode systems. Figure 2a shows the FE-SEM results for the Ag GDE deposited in the three-electrode system, and Figure 2b shows those for the two-electrode system, according to the position. In Figure 2a, a decrease in the deposition amount of the Ag catalyst from bottom to top (A → C) is observed. However, in Figure 2b, the deposition amount and morphology do not exhibit any significant differences with respect to the position. Therefore, with the two-electrode system, the electrodeposition of Ag exhibited higher uniformity throughout the electrode, which is important for the scale-up of the electrode. Therefore, electrodeposition using the two-electrode system was studied for the optimization of the deposition variables for fabrication of a 25.5 cm2 large area GDE.
Figure 3 shows the total and CO partial current densities and the calculated FE, according to the position on the 25.5 cm2 Ag GDE fabricated at different deposition currents of 0.63, 0.83 and 1.03 mA/cm2 for the two-electrode system. The distance between the electrodes and the deposition time were fixed at 4 cm and 50 min, respectively. Regardless of the deposition current density, the Ag catalyst fabricated via the two-electrode system maintained uniformity in both the total and CO currents. The CO current densities at different positions were 2.25–2.51 mA/cm2 for the deposition current density of 0.63 mA/cm2, 2.61–2.83 mA/cm2 for the deposition current density of 0.83 mA/cm2, and 2.41–2.79 mA/cm2 for the deposition current density of 1.03 mA/cm2. Generally, the CO current density was highest when the Ag catalyst was deposited at 0.83 mA/cm2. Figure 3b shows the FE of CO and H2 according to the deposition current and position. For the deposition currents of 0.63, 0.83 and 1.03 mA/cm2, the CO FE at different positions was 82.15%–85.5% (3.35% difference), 81.95%–85.2% (3.25% difference), and 77.65%–86.95% (9.3% difference), respectively. The 25.5 cm2 large area Ag GDE fabricated via the two-electrode system with a deposition current of 0.83 mA/cm2 had a high CO current density and uniform CO FE of >80%. The morphologies of the Ag GDE according to the deposition current and position are presented in Figure 4. As shown, there was no significant difference in the morphologies of the Ag deposits, and Ag catalysts with a dendrite morphology were uniformly formed for all samples regardless of the deposition current density and the position.
Figure 5 shows the effect of the distance between the electrodes (1, 2, 4 and 5 cm) on the uniformity of the activity of the 25.5 cm2 large area Ag GDE according to the position. The deposition current density and deposition time were fixed at 0.83 mA/cm2 and 50 min, respectively. The total current density and CO current density for each case according to the position are shown in Figure 5a. The total current density and CO current density exhibited good uniformity, with slight differences of 0.61, 0.29, 0.24 and 0.43 mA/cm2 in the total current density and 0.36, 0.3, 0.22 and 0.16 mA/cm2 in the CO current density for distance between working and counter electrodes of 1, 2, 4 and 5 cm, respectively. In general, a shorter distance between the electrodes yielded a larger variation in the CO current density. Figure 5b presents the H2 and CO FE according to the electrode distance. As shown, the CO FE at different positions was 73.15%–83.37% (10.22% difference), 80.36%–86.67% (6.31% difference), 81.95%–85.2% (3.25% difference), and 71.17%–81.43% (10.26% difference) for the distances of 1, 2, 4 and 5 cm, respectively. The highest average CO FE of 83.78% and the smallest CO FE variation of 3.25% were observed for the 4 cm distance. The drop of CO FE in the case of 5 cm is probably due to the voltage loss during the deposition resulting from the increased solution resistance between the electrodes. This implies that there might be a counterbalance between the uniformity in the distribution of the deposition current and the ohmic drops as the electrode distance changes, giving that 4 cm as the most desirable distance under this system.
Figure 6 shows the morphologies of the Ag GDE according to the distance between the electrodes and the position. Likely to the small variation in the total/CO current densities and FE (Figure 5), the morphology and uniformity were similar among the Ag deposits, and all the samples exhibited dendrite morphologies with slight deviation in the dendrite densities.
As a final variable, the deposition time was reduced to 5 min with simultaneous variation of the distance between the electrodes, at a fixed deposition current of 0.83 mA/cm2. Figure 7 shows the total and CO current density, as well as the FE of H2 and CO. In general, the reduction in the deposition time to 5 min severely degraded the activity and uniformity of the Ag GDE. For example, low CO current densities of 0.54–0.75 mA/cm2 at a 1 cm distance, 0.49–0.64 mA/cm2 at a 2 cm distance, and 0.62–0.83 mA/cm2 at a 4 cm distance were observed. Additionally, the calculated CO FE in Figure 7b was relatively low, and exhibited non-uniform behavior with the decrease in the deposition time compared with the 50 min deposition cases in Figure 5, regardless of the electrode distance. The deteriorated activity and uniformity were closely related to the morphology of the Ag GDE, as shown in Figure 8. In contrast to the fully covered deposits in Figure 6 obtained with a longer deposition time of 50 min, the Ag deposits shown in Figure 8 exhibited relatively low coverage, with less-developed short dendrites at the main branches of the carbon paper. These relatively less-developed catalysts are believed to be the cause of the low CO current and non-uniformity. Position A had more dense Ag deposits than the other two positions when the distance between the electrodes was 1 and 2 cm.
Using the optimized deposition variables that yielded the highest CO current density, CO FE, and uniformity in the fabrication of the 25.5 cm2 Ag GDE (two-electrode system, 0.83 mA/cm2 deposition current, 4 cm working–counter electrode distance, and 50 min deposition time), we fabricated a larger GDE with an area of 136 cm2. For this larger Ag GDE, five different positions were selected to evaluate the uniformity (Figure 9a). First, the uniformity of the deposit was confirmed using FE-SEM, and the results are shown in Figure 9a. The coverage and morphology of the Ag deposit were not significantly different for the different positions (A–E), and were very similar to those of the 25.5 cm2 GDE. The total current density, CO current density, and FE of CO/H2 were also evaluated according to the position, and the results are presented in Figure 9b,c. Although the variation of the CO current density among the positions was slightly enhanced with the increased area of 136 cm2, excellent uniformity in both the total current density and CO FE was observed. The average CO current density among the positions was 2.76 mA/cm2. The average CO FE was as high as 82.78%. This implies that the optimized deposition variables were successfully employed for the fabrication of a very-large-area Ag GDE with highly uniform CO production activity within the electrode.
Figure 10 shows the performance of MEA-type CO2 electrolyzer with 136 cm2 Ag GDE (actual geometric area of 107.44 cm2) according to the cell potential (Vcell) ranging from 1.8 to 3.4 V. The loading amounts of Ag were measured by ICPOES to be 1.32 mg/cm2. Figure 10a exhibits the total reduction current density, giving an increasing trend of the total current density with Vcell. At a Vcell of 1.8 V, the total current density was very close to 0, implying that almost no reduction reaction was happening. As the Vcell was gradually increased, the total current density was substantially increased, giving 151.66 mA/cm2 at 3.4 V. The produced CO ratio over the other gaseous products (mostly H2; no other gaseous products were detected with GC) was calculated and shown in Figure 10b. Likewise our previous results [36,41], the CO ratio according to the Vcell exhibited a peak value of 57.75% at 2.2 V. At lower or higher Vcell than 2.2 V, the CO ratio rapidly decreased showing a volcano-like behavior. Particularly at high Vcell over 3 V, most of the electrolysis currents came from vigorous hydrogen evolution giving a very low CO ratio. Therefore, the large area (>100 cm2) Ag-GDE was effectively fabricated by the optimized electrodeposition method, and the MEA-type electrolyzer using it was successfully used in the CO2 electroreduction to produce CO at the operation cell potential between 2.2 to 2.6 V.

4. Conclusions

The electrodeposition variables were optimized for fabricating large area (25.5 and 136 cm2) Ag GDEs for application to an MEA-type CO2 electrolyzer. In the fabrication of a large electrode via electrodeposition, it is essential to achieve uniformity among different positions on the electrode, which requires optimization of the electrode system, electrode arrangement, deposition current, and deposition time. By comparing the total electrolysis current, CO production current, FE and deposition morphology, it was confirmed that galvanostatic deposition at 0.83 mA/cm2 for 50 min in a horizontal two-electrode system with a working-counter electrode distance of 4 cm was the best condition for fabricating the large area Ag GDE with uniform performance throughout the electrode. Position-averaged CO current densities of 2.72 and 2.76 mA/cm2 and FEs of 83.78% and 82.78% were obtained for 25.5 and 136 cm2 Ag GDEs, respectively. The fabricated large area Ag GDE (actual geometric area of 107.44 cm2) was be used in MEA-type CO2 electrolyzers, giving potential-dependent CO conversion efficiencies of 41.99%–57.75% at Vcell = 2.2–2.6 V.

Author Contributions

Conceptualization, S.-K.K.; Formal analysis, S.-K.K. and J.H.J.; Funding acquisition, S.-K.K.; Investigation, S.O., H.P., H.K., Y.S.P. and M.G.H.; Methodology, S.O. and S.-K.K.; Supervision, S.-K.K.; Validation, S.-K.K. and J.H.J.; Writing—original draft, S.O. and H.P.; Writing—review and editing, S.-K.K. All authors have read and agreed to the published version of the manuscript.

Funding

This research was supported by the Chung-Ang University research grants in 2018. It was also supported by the National Research Foundation (NRF) of Korea grant funded by the Korea CCS R&D Center (KCRC) (grant no. 2014M1A8A1049349).

Conflicts of Interest

The authors declare no conflict of interest.

References

  1. Appel, A.M.; Bercaw, J.E.; Bocarsly, A.B.; Dobbek, H.; DuBois, D.L.; Dupuis, M.; Ferry, J.G.; Fujita, E.; Hille, R.; Kenis, P.J.A.; et al. Frontiers, Opportunities, and Challenges in Biochemical and Chemical Catalysis of CO2 Fixation. Chem. Rev. 2013, 113, 6621–6658. [Google Scholar] [CrossRef] [PubMed] [Green Version]
  2. Kumar, B.; Llorente, M.; Froehlich, J.; Dang, T.; Sathrum, A.; Kubiak, C.P. Photochemical and Photoelectrochemical Reduction of CO2. Annu. Rev. Phys. Chem. 2012, 63, 541–569. [Google Scholar] [CrossRef] [PubMed] [Green Version]
  3. Mikkelsen, M.; Jorgensen, M.; Krebs, F.C. The teraton challenge. A review of fixation and transformation of carbon dioxide. Energy Environ. Sci. 2010, 3, 43–81. [Google Scholar] [CrossRef]
  4. Mendoza, J.A.; Kim, H.K.; Park, H.K.; Park, K.Y. Photocatalytic reduction of carbon dioxide using Co3O4 nanoparticles under visible light irradiation. Korean J. Chem. Eng. 2012, 29, 1483–1486. [Google Scholar] [CrossRef]
  5. Wang, W.; Wang, S.P.; Ma, X.B.; Gong, J.L. Recent advances in catalytic hydrogenation of carbon dioxide. Chem. Soc. Rev. 2011, 40, 3703–3727. [Google Scholar] [CrossRef] [Green Version]
  6. Whipple, D.T.; Kenis, P.J.A. Prospects of CO2 Utilization via Direct Heterogeneous Electrochemical Reduction. J. Phys. Chem. Lett. 2010, 1, 3451–3458. [Google Scholar] [CrossRef]
  7. Hori, Y. Electrochemical CO2 Reduction on Metal Electrodes; Springer: New York, NY, USA, 2008; Volume 42, pp. 89–189. [Google Scholar]
  8. Singh, M.R.; Kwon, Y.; Lum, Y.; Ager, J.W.; Bell, A.T. Hydrolysis of Electrolyte Cations Enhances the Electrochemical Reduction of CO2 over Ag and Cu. ACS Catal. 2016, 138, 13006–13012. [Google Scholar] [CrossRef] [Green Version]
  9. Sun, K.; Wu, L.; Qin, W.; Zhou, J.; Hu, Y.; Jiang, Z.; Shen, B.; Wang, Z. Enhanced electrochemical reduction of CO2 to CO on Ag electrocatalysts with increased unoccupied density of states. J. Mater. Chem. A 2016, 4, 12616–12623. [Google Scholar] [CrossRef]
  10. Hirunsit, P.; Soodsawang, W.; Limtrakul, J. CO2 Electrochemical Reduction to Methane and Methanol on Copper-Based Alloys: Theoretical Insight. J. Phys. Chem. C 2015, 119, 8238–8249. [Google Scholar] [CrossRef]
  11. Peterson, A.A.; Norskov, J.K. Activity Descriptors for CO2 electroreduction to Methane on Transition-Metal Catalysts. J. Phys. Chem. Lett. 2012, 3, 251–258. [Google Scholar] [CrossRef]
  12. Chen, C.S.; Wan, J.H.; Yeo, B.S. Electrochemical Reduction of Carbon Dioxide to Ethane Using Nanostructured Cu2O-Derived Copper Catalyst and Palladium(II) Chloride. J. Phys. Chem. C 2015, 119, 26875–26882. [Google Scholar] [CrossRef]
  13. Yang, K.D.; Ko, W.R.; Lee, J.H.; Kim, S.J.; Lee, H.; Lee, M.H. Morphology-Directed Selective Production of Ethylene of Ethane from CO2 on a Cu Mesopore Electrode. Angew. Chem. Int. Ed. 2016, 56, 796–800. [Google Scholar] [CrossRef] [PubMed]
  14. Kortlever, R.; Peters, I.; Koper, S.; Kopr, T.M. Electrochemical CO2 reduction to Formic Acid at Low Overpotential and with High Faradaic Efficiency on Carbon-Supported Bimetallic Pd-Pt Nanoparticles. ACS Catal. 2015, 5, 3916–3923. [Google Scholar] [CrossRef]
  15. Alvarex-Guerra, M.; Quintanilla, S.; Irabien, A. Conversion of carbon dioxide into formate using a continuous electrochemical reduction process in a lead cathode. Chem. Eng. J. 2012, 207–208, 278–284. [Google Scholar] [CrossRef]
  16. Peterson, A.A.; Abild-Pedersen, F.; Studt, F.; Rossmeisl, J.; Norskov, J.K. How copper catalyzes the electroreduction of carbon dioxide into hydrocarbon fuels. Energy Environ. Sci. 2010, 3, 1311–1315. [Google Scholar] [CrossRef]
  17. Oh, W.; Rhee, C.K.; Han, J.W.; Shong, B. Atomic and Molecular Adsorption on the Bi(111) Surface: Insights into Catalytic CO2 Reduction. J. Phys. Chem. C 2018, 122, 23084–23090. [Google Scholar] [CrossRef]
  18. Li, W. Electrocatalytic Reduction of CO2 to Small Organic Molecule Fuels on Metal Catalysts; ACS Publications: Washington, DC, USA, 2010; pp. 55–76. [Google Scholar]
  19. Keim, W. Carbon monoxide: Feedstock for chemicals, present and future. J. Organomet. Chem. 1989, 372, 15–23. [Google Scholar] [CrossRef]
  20. Kuhl, K.P.; Hatsukade, T.; Cave, E.R.; Abram, D.N.; Kibsgaard, J.; Jaramillo, T.F. Electrocatalytic Conversion of Carbon Dioxide to Methane and Methanol on Transition Metal Surfaces. J. Am. Chem. Soc. 2014, 136, 14107–14113. [Google Scholar] [CrossRef]
  21. Katayama, Y.; Nattino, F.; Giordano, L.; Hwang, J.; Rao, R.R.; Andreussi, O.; Marzari, N.; Shao-Horn, Y. An In Situ Surface-Enhanced Infrared Absorption Spectroscopy Study of Electrochemical CO2 Reduction: Selectivity Dependence on Surface C-Bound and O-Bound Reaction Intermediates. J. Phys. Chem. C 2019, 123, 5951–5963. [Google Scholar] [CrossRef] [Green Version]
  22. Kim, C.; Jeon, H.S.; Eom, T.; Jee, M.S.; Kim, H.; Friend, C.M.; Min, B.K.; Hwang, Y.J. Achieving Selective and Efficient Electrocatalytic Activity for CO2 Reduction Using Immobilized Silver Nanoparticles. J. Am. Chem. Soc. 2015, 137, 13844–13850. [Google Scholar] [CrossRef]
  23. Hsieh, Y.C.; Senanayake, S.D.; Wenqian, Y.Z.; Xu, W.; Polyansky, D.E. Effect of Chloride Anions on the Synthesis and Enhanced Catalytic Activity of Silver Nanocoral Electrodes for CO2 Electroreduction. ACS Catal. 2015, 5, 5349–5356. [Google Scholar] [CrossRef]
  24. Liu, S.; Tao, H.; Zeng, L.; Liu, Q.; Xu, Z.; Liu, Q.; Luo, J.-L. Shape-Dependent Electrocatalytic Reduction of CO2 to CO on Triangular Silver Nanoplates. J. Am. Chem. Soc. 2017, 139, 2160–2163. [Google Scholar] [CrossRef] [PubMed]
  25. Back, S.; Yeom, M.S.; Jung, Y. Active Sites of Au and Ag Nanoparticle Catalysts for CO2 Electroreduction to CO. ACS Catal. 2015, 5, 5089–5096. [Google Scholar] [CrossRef] [Green Version]
  26. Tornow, C.E.; Thorson, M.R.; Ma, S.; Gewirth, A.A.; Kenis, P.J.A. Nitrogen-Based Catalysts for the Electrochemical Reduction of CO2 to CO. J. Am. Chem. Soc. 2012, 134, 19520–19523. [Google Scholar] [CrossRef]
  27. Rosen, J.; Hutchings, G.S.; Lu, Q.; Forest, R.V.; Moore, A.; Jiao, F. Electrodeposited Zn Dendrites with Enhanced CO Selectivity for Electrocatalytic CO2 Reduction. ACS Catal. 2015, 5, 4586–4591. [Google Scholar] [CrossRef]
  28. Zhu, W.; Michalsky, R.; Metin, O.; Lv, H.; Guo, S.; Wright, C.J.; Sun, X.; Peterson, A.A.; Sun, S. Monodisperse Au Nanoparticles for Selective Electrocatalytic Reduction of CO2 to CO. J. Am. Chem. Soc. 2013, 135, 16833–16836. [Google Scholar] [CrossRef]
  29. Luc, W.; Collins, C.; Wang, S.; Xin, H.; He, K.; Kang, Y.; Jiao, F. Ag-Sn Bimetallic Catalyst with a Core-Shell Structure for CO2 Reduction. J. Am. Chem. Soc. 2017, 139, 1885–1893. [Google Scholar] [CrossRef]
  30. Duan, Z.; Sun, R. Am improved model calculating CO2 solubility in pure water and aqueous NaCl solutions from 273 to 533 K and from 0 to 2000 bar. Chem. Geol. 2003, 193, 257–271. [Google Scholar] [CrossRef]
  31. Dufek, E.J.; Lister, T.E.; Stone, S.G.; Mcllwain, M.E. Operation of a pressurized system for continuous reduction of CO2. J. Electrochem. Soc. 2012, 159, F514–F517. [Google Scholar] [CrossRef]
  32. Dufek, E.J.; Lister, T.E.; Mcllwain, M.E. Influence of S Contamination on CO2 Reduction at Ag Electrodes. J. Electrochem. Soc. 2011, 158, B1384–B1390. [Google Scholar] [CrossRef]
  33. Kim, B.; Ma, S.; Jhong, H.-R.M.; Kenis, J.A. Influence of dilute feed and pH on electrochemical reduction of CO2 to CO on Ag in a continuous flow electrolyzer. Electrochim. Acta 2015, 166, 271–276. [Google Scholar] [CrossRef] [Green Version]
  34. Delacourt, C.; Ridgway, P.L.; Kerr, J.B.; Newman, J. Design of an Electrochemical Cell Making Syngas (CO + H2) from CO2 and H2O Reduction at Room Temperature. J. Electrochem. Soc. 2008, 155, B42–B49. [Google Scholar] [CrossRef]
  35. Wu, J.; Risalvato, F.G.; Sharma, P.P.; Pellechia, P.J.; Ke, F.S.; Zhou, X.D. Electrochemical Reduction of Carbon Dioxide II. Design, Assembly, and Performance of Low Temperature Full Electrochemical Cells. J. Electrochem. Soc. 2013, 160, F953–F957. [Google Scholar] [CrossRef]
  36. Ham, Y.S.; Park, Y.S.; Jo, A.; Jang, J.H.; Kim, S.-K.; Kim, J.J. Proton-exchange membrane CO2 electrolyzer for CO production using Ag catalyst directly electrodeposited onto gas diffusion layer. J. Power Sources 2019, 437, 226898. [Google Scholar] [CrossRef]
  37. Echendu, O.K.; Okeoma, K.B.; Oriaku, C.I.; Dharmadasa, I.M. Electrochemical Deposition of CdTe Semiconductor Thin Films for Solar Cell Application Using Two-Electrode and Three-Electrode Configurations: A Comparative study. Adv. Mater. Sci. Eng. 2016, 2016, 1–8. [Google Scholar] [CrossRef] [Green Version]
  38. Rajkumar, S.R.; Alagar, M.; Kanagasabapathy, M. Current Density Distribution Studies in Manifold Dimensions. J. Chem. Pharm. Res. 2012, 4, 1173–1178. [Google Scholar]
  39. Park, H.; Choi, J.; Kim, H.; Hwang, E.; Ha, D.-H.; Ahn, S.H.; Kim, S.-K. AgIn dendrite catalysts for electrochemical reduction of CO2 to CO. Appl. Catal. B 2017, 219, 123–131. [Google Scholar] [CrossRef]
  40. Ham, Y.S.; Choe, S.; Kim, M.J.; Lim, T.; Kim, S.-K.; Kim, J.J. Electrodeposited Ag catalysts for the electrochemical reduction of CO2 to CO. Appl. Catal. B 2017, 208, 35–43. [Google Scholar] [CrossRef]
  41. Oh, S.; Park, Y.S.; Park, H.; Kim, H.; Jang, J.H.; Choi, I.; Kim, S.-K. Ag-deposited Ti gas diffusion electrode in proton exchange membrane CO2 electrolyzer for CO production. J. Ind. Eng. Chem. 2020, 82, 374–382. [Google Scholar] [CrossRef]
  42. Choi, J.; Kim, M.J.; Ahn, S.H.; Choi, I.; Jang, J.H.; Ham, Y.S.; Kim, J.J.; Kim, S.-K. Electrochemical CO2 reduction to CO on dendritic Ag-Cu electrocatalysts prepared by electrodeposition. Chem. Eng. J. 2016, 299, 37–44. [Google Scholar] [CrossRef]
Figure 1. Schematic diagrams of the (a) vertical three-electrode system and (b) horizontal two-electrode system for fabricating the 25.5 cm2 Ag gas diffusion electrode (GDE). The sectioned positions used in the subsequent analysis were denoted as A, B and C. (c) Total electrolysis current density and CO production current density of the Ag GDE fabricated in each electrode system according to the position and (d) the corresponding FE for CO and H2. The Ag deposition conditions were −0.49 V (vs. the saturated calomel electrode (SCE)) for 50 min in the three-electrode system, and 0.83 mA/cm2 for 50 min in the two-electrode system. The CO2 reduction was performed at a constant voltage of −1.5 V (vs. SCE) in a laboratory-made H-type cell. 0.5 M KHCO3 was used for both the anolyte and the catholyte.
Coatings 10 00341 g001
Figure 2. Field emission scanning electron microscope (FE-SEM) images of the fabricated 25.5 cm2 Ag GDE (Figure 1) according to the position on the electrode: (a) three-electrode system; (b) two-electrode system.
Coatings 10 00341 g002
Figure 3. (a) Total electrolysis current density and CO production current density of the 25.5 cm2 Ag GDE according to the position and (b) the corresponding FE for CO and H2. Ag deposition was performed with different deposition current densities (0.63, 0.83 and 1.03 mA/cm2) for 50 min with a fixed working-counter electrode distance of 4 cm. The CO2 reduction was performed at a constant voltage of −1.5 V (vs. SCE) in a laboratory-made H-type cell. 0.5 M KHCO3 was used for both the anolyte and the catholyte.
Coatings 10 00341 g003
Figure 4. FE-SEM images of the fabricated 25.5 cm2 Ag GDE (Figure 3) according to the position on the electrode. Ag deposition was performed with different deposition current densities: (a) 0.63 mA/cm2, (b) 0.83 mA/cm2 and (c) 1.03 mA/cm2.
Coatings 10 00341 g004
Figure 5. (a) Total electrolysis current density and CO production current density of the 25.5 cm2 Ag GDE according to the position and (b) the corresponding FE for CO and H2. Ag deposition was performed at 0.83 mA/cm2 for 50 min with different working-counter electrode distances: 1, 2, 4 and 5 cm. The CO2 reduction was performed at a constant voltage of −1.5 V (vs. SCE) in a laboratory-made H-type cell. 0.5 M KHCO3 was used for both the anolyte and the catholyte.
Coatings 10 00341 g005
Figure 6. FE-SEM images of the fabricated 25.5 cm2 Ag GDE (Figure 5) according to the position on the electrode. Ag deposition was performed with different working–counter electrode distances: (a) 1 cm, (b) 2 cm, (c) 4 cm, and (d) 5 cm.
Coatings 10 00341 g006aCoatings 10 00341 g006b
Figure 7. (a) Total electrolysis current density and CO production current density of the 25.5 cm2 Ag GDE according to the position and (b) the corresponding FE for CO and H2. Ag deposition was performed at 0.83 mA/cm2 for 5 min with different working-counter electrode distances: 1, 2 and 4 cm. The CO2 reduction was performed at a constant voltage of −1.5 V (vs. SCE) in a laboratory-made H-type cell. 0.5 M KHCO3 was used for both the anolyte and the catholyte.
Coatings 10 00341 g007
Figure 8. FE-SEM images of the fabricated 25.5 cm2 Ag GDE (Figure 7) according to the position on the electrode. Ag deposition was performed at 0.83 mA/cm2 for 5 min with different working-counter electrode distances: (a) 1 cm, (b) 2 cm, and (c) 4 cm.
Coatings 10 00341 g008
Figure 9. (a) FE-SEM images of the fabricated 136 cm2 Ag GDE according to the position on the electrode. Ag deposition was performed at 0.83 mA/cm2 for 50 min with a working-counter electrode distance of 4 cm. (b) Total electrolysis current density and CO production current density of the 136 cm2 Ag GDE according to the position and (c) the corresponding FE for CO and H2. The CO2 reduction was performed at a constant voltage of −1.5 V (vs. SCE) in a laboratory-made H-type cell. 0.5 M KHCO3 was used for both the anolyte and the catholyte.
Coatings 10 00341 g009
Figure 10. Performance of large area (107.44 cm2) MEA-type CO2 electrolyzer according to the applied cell potential (1.8 to 3.4 V) under pressurized condition at 4 bar; (a) total reduction current density and (b) CO ratio over other gaseous products. The 136 cm2 large area Ag GDE fabricated by the optimized electrodeposition method (Figure 9) was cut to make 107.44 cm2 Ag GDE. 10 mL/min of 1.0 M KHCO3 solution and 100 mL/min of 1.0 M KOH solution were fed and circulated as the catholyte and anolyte, respectively, using flow fields at both electrodes. Gaseous CO2 at a rate of 150 mL/min were also fed to the cathode using a separated flow field.
Coatings 10 00341 g010

