Article

Modeling of Erosion Response of Cold-Sprayed In718-Ni Composite Coating Using Full Factorial Design

1
Department of Management and Production Engineering, Politecnico di Torino, Corso Duca degli Abruzzi 24, 10129 Torino, Italy
2
Mechanical and Industrial Engineering Department, University of Rome “ROMA TRE”, Via Vasca Navale 79, 00146 Rome, Italy
3
Department of Mechanical and Manufacturing Engineering, Trinity College Dublin, The University of Dublin, Parsons Building, Dublin 2 D02 PN40, Ireland
*
Authors to whom correspondence should be addressed.
Coatings 2020, 10(4), 335; https://doi.org/10.3390/coatings10040335
Submission received: 9 March 2020 / Revised: 25 March 2020 / Accepted: 27 March 2020 / Published: 1 April 2020
(This article belongs to the Special Issue Cold Gas Spray Coatings: Fundamentals and Applications)

Abstract

:
In this work, the cold-spray technique was used to deposit Inconel 718–nickel (1:1) composite coatings on stainless steel substrate. A general full factorial design was adopted to identify the statistically significant operating variables, i.e., impingement angle, erodent size, and feed rate on the coating erosion response. Erodent feed rate, impingement angle, and the interaction between impingement angle and erodent size were identified as the highly significant variables on the erosion rate. Then, a model correlating the identified variables with the erosion rate was derived. The best combination of control variables for minimum erosion loss with respect to erodent feed rate, erodent size, and impingement angle was 2 mg/min, 60 μm, and 90°, respectively. To analyze the erosion mechanism, the erodent samples were finally observed using Scanning Electron Microscope (SEM).

1. Introduction

Solid Particle Erosion (SPE) is the loss of material resulting from the repeated impact of small solid particles. Although in some cases SPE is a beneficial phenomenon, such as in high-speed abrasive waterjet cutting and sandblasting, it can cause damage in many engineering systems, including aircraft engines, steam and jet turbines, and pipelines [1]. The gradual material removal from surfaces may lead, in the worst cases, to the entire replacement of the damaged or degraded component, entailing a considerable replacement expense, which may exceed half of the production cost [2,3,4]. Among the several methods available, surface coating is one of the most effective technologies that has been extensively used for reducing the detrimental effect of SPE and improving components’ erosion resistance [5,6,7,8]. Several coating techniques have been studied and adopted to this aim, including cold spray (CS). CS is a low-temperature particle deposition process that has emerged as a powerful technique for its several advantages over other thermal spray processes including the minimization of potential phase changes, the preservation of the original feedstock properties, and the prevention of coating defects such as surface oxides and other inclusions [9,10,11,12]. In the CS technique, microscale powder particles are accelerated to a high velocity (300 to 1200 m/s) through a De-Laval nozzle dragged by a high-pressure propelling gas (commonly nitrogen or helium) toward a target substrate [13].
Nickel-based superalloys are commonly used in applications where stability at elevated temperatures, high long-time creep strength, and corrosion resistance in aggressive environments are required [10,14]. Among them, Inconel 718 (IN718) is commonly applied due to its high tensile, fatigue, and creep-rupture strength; the excellent erosion and oxidation resistance; as well as the outstanding resistance to post-weld cracking in a service temperature range from −257 to 704 °C [15,16]. Despite its many advantages, the fabrication of thick cold-sprayed IN718 coatings encounter problems such as the nozzle clogging, the high critical particle velocity, and the insufficient metallurgical cohesion between the particles [12,17,18,19,20]. Several attempts have been made to improve plastic deformation and particle bonding by increasing the particle velocity or by the implementation of annealing strategies on the particles, with a corresponding cost increase [12,21,22,23]. In a recent study, IN718 was mixed with a low melting point Ni-based braze alloy powder (MAR-M 002) to form a composite coating via a high-pressure cold spray process. The following heat treatment at a temperature near the liquidus temperature of the braze alloy enhanced the chemical diffusion between the braze and matrix alloys, thus improving the interparticle bonding strength [19].
Despite solid particle erosion having been widely investigated in the past years, there is no standard method to predict the SPE resistance of coatings due to the complex nature of the mechanism, involving several variables and their combinations, and to the different properties of the material used [8,24]. Several attempts have been made in the scientific literature to identify the significant control variables and to model the erosion response of coatings produced using thermal spray technologies by means of Design of Experiment (DoE) techniques [25]. Sahu et al. [8] studied the erosion wear behavior of a plasma-sprayed fly ash–aluminum coating using the Taguchi technique. In their study, the selected control factors were the impingement angle, impact velocity, erodent size, stand-off-distance, and aluminum content in the feedstock. Impact velocity was proved to be the most significant factor influencing the erosion wear rate [8]. In the work of Praveen et al. [7], the erosion resistance of a NiCrSiB/WC–Co HVOF coating was investigated using the Taguchi method and considering the oxygen flow rate, fuel flow rate, powder feed rate, and standoff distance as factors. The standoff distance and powder feed rate were identified as the highest contributing parameters on the erosion wear loss [7]. The slurry wear behavior of a TiAlN HVOF coating was tested by varying the impact velocity, erodent size, impingement angle, and erodent feed rate following the Taguchi method [6]. The results indicated that, depending on the aluminum alloy substrate used, AA1050 and AA5083, the important sequences of the control parameters changed. In both cases, the impact velocity was recognized as the highest contributing parameter, followed by the impingement angle [6]. Recently, Alidokht et al. [26] studied the erosive wear performance of Ni and Ni-WC composite coatings produced by cold-spray; however, they did not follow a planned experimentation. They found that (i) both Ni and Ni-WC coatings exhibited ductile erosion, (ii) the higher erosion resistance of coatings under normal angle compared to oblique angle was related to the formation of a protective tribolayer, and (iii) the incorporation of 10.5 vol% WC into Ni deteriorated the Ni erosion resistance [26]. Apart from the research of Alidokht et al. [26], a systematic understanding of erosion response of cold-sprayed coatings is still lacking.
In this paper, a planned experimentation that is capable of creating reproducible results was performed in order to assess the erosion performance of a cold sprayed IN718-Ni composite coating. This particular composite coating was selected to investigate its SPE response since in a recent study of Kazasidis et al. [27], it revealed a promising resistance against another type of erosion: the cavitation erosion. The composite IN718–Ni coating was deposited onto substrates via high-pressure CS using nitrogen as the propulsive gas, with inlet pressure at 3.0 MPa and gas temperature at 1000 °C. The effect of the impingement angle, the erodent size, and the erodent feed rate on the erosion rate of the coating was investigated by following a General full factorial design (GFFD). Factorial design is a statistical technique that is used in the design of experiments to study the effects that several controlled factors, and their interaction, may have on a response, by varying the levels of all the factors at the same time instead of one at a time [25]. General full factorial [25] is the appropriate design when several factors are varied on multiple levels [25]. It is widely recognized as a more appropriate method than other experimental designs for modeling complex multivariate systems due to its application flexibility [25,28,29].

2. Materials and Methods

2.1. Coating Deposition and Characterization

The cold-sprayed coating was fabricated by using pure Ni (−45/+16 μm, Praxair Surface Technologies, Inc., USA) and IN718 (−45/+15 μm, LPW Technology Ltd., UK) powders with spherical morphology. The size distributions of Ni and IN718 powders are illustrated in Figure 1b,d, respectively. The chemical composition of LPW IN718 powder was determined using Inductively Coupled Plasma Mass Spectrometry (ICP-MS) in conjunction with Inert Gas Fusion (IGF) methods (see Table 1). Figure 1 shows the spherical morphology of Ni and IN718 powders, as observed by scanning electron microscopy (Carl Zeiss ULTRA, Oberkochen, Germany), alongside with their powder size distributions. Before being sprayed, the two powders were mechanically mixed at a 1:1 weight ratio. The coating was deposited on a stainless steel (SS) plate, reaching a thickness of 2 mm. The methodology adopted to deposit the coatings followed a two-layer strategy, in which the spacing between adjacent passes was 3.3 mm. The custom-made cold spray system (Trinity College Dublin, Ireland) [30] consists of the following components: high-pressure nitrogen gas from cylinders, a gas heater, a powder feeder (PF100WL, Uniquecoat Technologies LLC, Oilville, VA, USA) a computer numeric control working platform, a De-Laval nozzle, and a computer control system [9]. The main parameters used to produce the IN718-Ni composite coating are reported in Table 2. Powders were injected axially into the nozzle, and both the powders and the substrate were not preheated.
The microstructure characterization was performed on a cross-section of the coating that was prepared using standard metallographic procedures, with a final polishing of 0.06 μm colloidal silica (Silco Colloidal Silica, MetPrep Ltd., Coventry, UK). The coating microstructure was examined both by optical microscope (OM–Leica DM LM, Wetzlar, Germany) and SEM. The coating average porosity value was evaluated by image analysis software (ImageJ, NIH, Bethesda, Md.) based on five different images of the cross-section of the polished coating at 100× magnification. The retention of IN718 in the final coating was calculated after the etching of the sample, using the Kalling reagent No. 2 (5 g CuCl, 100 ml HCl, 100 ml ethanol). Subsequently, the etched sample was analyzed with OM and SEM. The retention of the IN718 mass fraction in the coating was measured by binary image analysis, which was performed on five micrographs of 100× magnification using the ImageJ software. The microhardness of the coating was measured using a Vickers microhardness tester (Mitutoyo, Kanagawa, Japan) with a 3 N load and a dwell time of 10 s. The mean microhardness of the coating was measured on the cross-sectional area of the polished specimen by averaging 10 measurements.

2.2. Erosion Test

Laboratory-scale erosion tests are performed for several purposes: (i) to obtain data on absolute and relative erosion rates under certain conditions, (ii) to substantiate theoretical models, and (iii) to investigate erosion mechanisms. The erosion rate can be estimated by measuring the mass loss of the samples (usually determined by accurate weighing) after exposure to the erosion test [31]. To establish a value for the erosion rate, it is essential to measure the mass loss of the specimen. The methods commonly used for erosion testing in the laboratory can be divided into those where particles are accelerated in a gas stream and those where circular motion is used to achieve the impact velocity (e.g., the gas jet test rig and the centrifugal accelerator) [32]. In this paper, the first method was used. In most, the erodent particles are consumables, thus overcoming any problem of degradation of the particles after impact. The cold-spray system that was used to produce the coating was employed as the erosion test apparatus. The erosion tests were performed onto the as-sprayed CS coated samples, according to the basic guidelines of the ASTM G76 standard [33]. The erosion test apparatus consists of an air compressor, an air particle mixing chamber, and an accelerating chamber. Erodent particles, loaded into a particle feeder, were mixed with compressed air coming from the compressor. Finally, the particle impinges on the cold-sprayed samples were fixed on the sample holder. These particles impact the specimens that can be held at different angles (in this work, respectively 30°, 60°, and 90°) with respect to the direction of erodent flow, by using a clamp and an adjustable sample clip. The feed rate of the erodent particles is determined by varying the speed of the disc placed inside the powder feeder. By setting the wheel speed as a percentage of its maximum speed, the powder feed rate can be set to the selected value (in this study, 2 g/min and 5 g/min). In this study, the powder feed rate was selected as the control factor instead of the particle velocity because in the erosion test apparatus, it is not possible to directly control the speed of the compressed air, whereas only the pressure at the inlet of the nozzle may be set. Dry alumina sharp-edged particles of different particle sizes (60, 90, and 200 μm) were used in the experiments as the erodent, as shown in Figure 2. In general, smaller particles cause lower rates of erosion because they have less kinetic energy and less impact force to erode the surface. However, in addition to particle size, particle density, shape, and hardness are factors that influence erosivity [24]. The list of parameters set to perform the erosion tests are listed in Table 3. The specimens of the coating, on which the erosion tests were performed, were extracted from the coated plate (see Section 2.1). This plate was cut into 18 equal parts, obtaining square-shaped samples of 6 cm2 sections. Every single test (18 in total) was performed on a single sample. Prior to each measurement, the samples were cleaned with ethanol and dried with compressed air. Then, the samples were weighed before and after the erosion tests using a precision electronic balance (METTLER TOLEDO AB204-S/FAC) with 0.1 mg resolution. In order to consider the variability of the measurement procedure, two measurements for each specimen were taken, and the average value was examined. Each erosion test was performed for a total duration of 12 minutes. At the end, for each test, the erosion rate was calculated by exploiting the measured mass loss, according to ASTM G-76, as follows [33]:
Erosion   rate   [ mg min ] = mass   loss   [ mg ] time   [ min ]

2.3. Experimental Design and Analysis Methodology

In this section, the experimental design adopted for arranging the tests and the methodology used to analyze the experimental data for modeling and optimizing the erosion rate is presented. Design of Experiment (DoE) is an effective statistical approach to optimize the process when a combination of different process variables and their interactions affect selected responses [34]. In this context, general full factorial design (GFFD) is adopted when dealing with multiple levels of several factors [25]. The first stage in the DoE concerns the selection of the control factors. Extensive studies on the erosive performance of coatings reveal that variables such as impact velocity, impingement angle, standoff distance, erodent particle size and feed rate, feed material composition, etc., largely influence the erosion rate [8,26]. Thus, in the present study, the effect of the impingement angle, the erodent size, and the feed rate on the erosion rate of a cold-sprayed IN718-Ni composite coating is investigated using GFFD. The levels of the process variables used in the planned experimentation are reported in Table 4. Accordingly, the total number of tests performed, which were randomized, was 18.
The analysis of variance (ANOVA) is used to estimate the statistical significance of variables’ effects with respect to the observed differences in the response. In the ANOVA, the total variability is partitioned into its component parts. Specifically, the main components of the ANOVA are [25]:
  • Source: indicates the source of variation, either from the factor, the interaction, or the error. The total is a sum of all the sources.
  • DF: degrees of freedom associated with each source.
  • SS: sum of squares deviations. SS Total is the total variation in the model. The SS of a factor is the deviation of the estimated factor level mean around the overall mean (also known as the SS between groups). SS Error is the deviation of an observation from its corresponding factor level mean (also known as SS within groups). Adjusted sum of squares (Adj SS) is the SS determined by adding each particular factor to the model given the other factors that are already in the model. Accordingly, it does not depend on the order in which the factors are entered into the model.
  • MS: mean squares, obtained by dividing the sum of squares by the degrees of freedom.
  • F-value: calculated by dividing each Source MS by the Error MS. This ratio should be compared against the theoretical F-value found in a table to determine whether a factor is significant; alternatively, the p-value can be used.
  • p-value: probability of obtaining a test statistic that is at least as extreme as the actual calculated value if the null hypothesis is true (in this case, the null hypothesis is the absence of difference in group means). It is used to determine whether a factor is significant by comparing it against an α value, which is typically 0.05. If the p-value is lower than the α value, then the factor is significant.
During the exploratory stages of model building, the best subset of predictors may be identified through the stepwise regression [35]. It is an automatic technique that is implemented in several statistical software programs such as MINITAB®, which both adds and removes predictors at each step by comparing the p-value with the selected Alpha-to-Enter and Alpha-to-Remove values [35]. The ANOVA related to the stepwise regression is used to estimate the statistical significance of the variables’ effects on the erosion rate. The diagnostic checking tests, such as the coefficients of determination and the residual plots, are then used to demonstrate the adequacy of the obtained model. Finally, the regression model obtained is optimized to define the combination of variables that lead to the minimum erosion rate.

3. Results and Discussion

3.1. Cold-Sprayed Coating

Table 5 summarizes the properties of the IN718–Ni composite coating. Figure 3 shows the OM and SEM images of the coating cross-section. In Figure 3a, cold-spray coating exhibits a crack-free feature and a relatively high density (the porosity rate obtained is 0.84% for such coating). The low porosity of the composite coating (see Figure 4) resulted from the addition of the ductile and soft γ-phase nickel. The impact of the high-velocity IN718 particles that did not consolidate may also have had a beneficial effect by densifying the underlying coating (tamping effect) [26,36]. As shown in the SEM cross-section image of the coating after etching of Figure 3b, where the dark particles correspond to IN718 particles and regions in bright contrast correspond to the nickel matrix, the particles of IN718 are uniformly distributed within the coating. The porosity of the coating is indicated by the red rows in Figure 3c and is mainly caused by the difference in plastic deformation between Ni and IN718 powders. Indeed, the low deformation of IN718 particles produces a weak interfacial bond between the nickel matrix and IN718 particles. Thus, as it is evident from Figure 3b,c, Ni particles are highly deformed in some areas, completely losing their spherical shape, while IN718 particles did not undergo significant plastic deformation and remained almost spherical. The interparticle boundary between IN718 and nickel could be distinguished, which suggests no good bonding between IN718 and nickel.
The IN718 retention in the final coating, i.e., the actual IN718 mass fraction in the coating, is shown in Table 5. The value reached is about 30%, which means an IN718 loss during deposition of about 20%. A percentage of the IN718 powders tends to rebound due to the insufficient adhesion, resulting in a poor metallurgical bond. Besides, the rebounded IN718 particles act as in situ shot-peening particles which can further increase the plastic deformation of the previously deposited layers. Work hardening by these particles will adversely affect the subsequent deposition of the same particles.
Vickers hardness was measured in order to characterize the mechanical behavior of the coating. The obtained hardness average value (243 HV 0.3) was compared with the microhardness of a pure nickel coating deposited with the same process parameters in previous work [27]. The increase in hardness of the composite coating is of about 30%, which is due to the relatively uniform dispersion of IN718 hard particles.

3.2. Coating Erosion Response

3.2.1. Erosion Rates Analysis

The results of the 18 erosion tests, which are given in Table 6, are statistically analyzed using the software MINITAB®. 
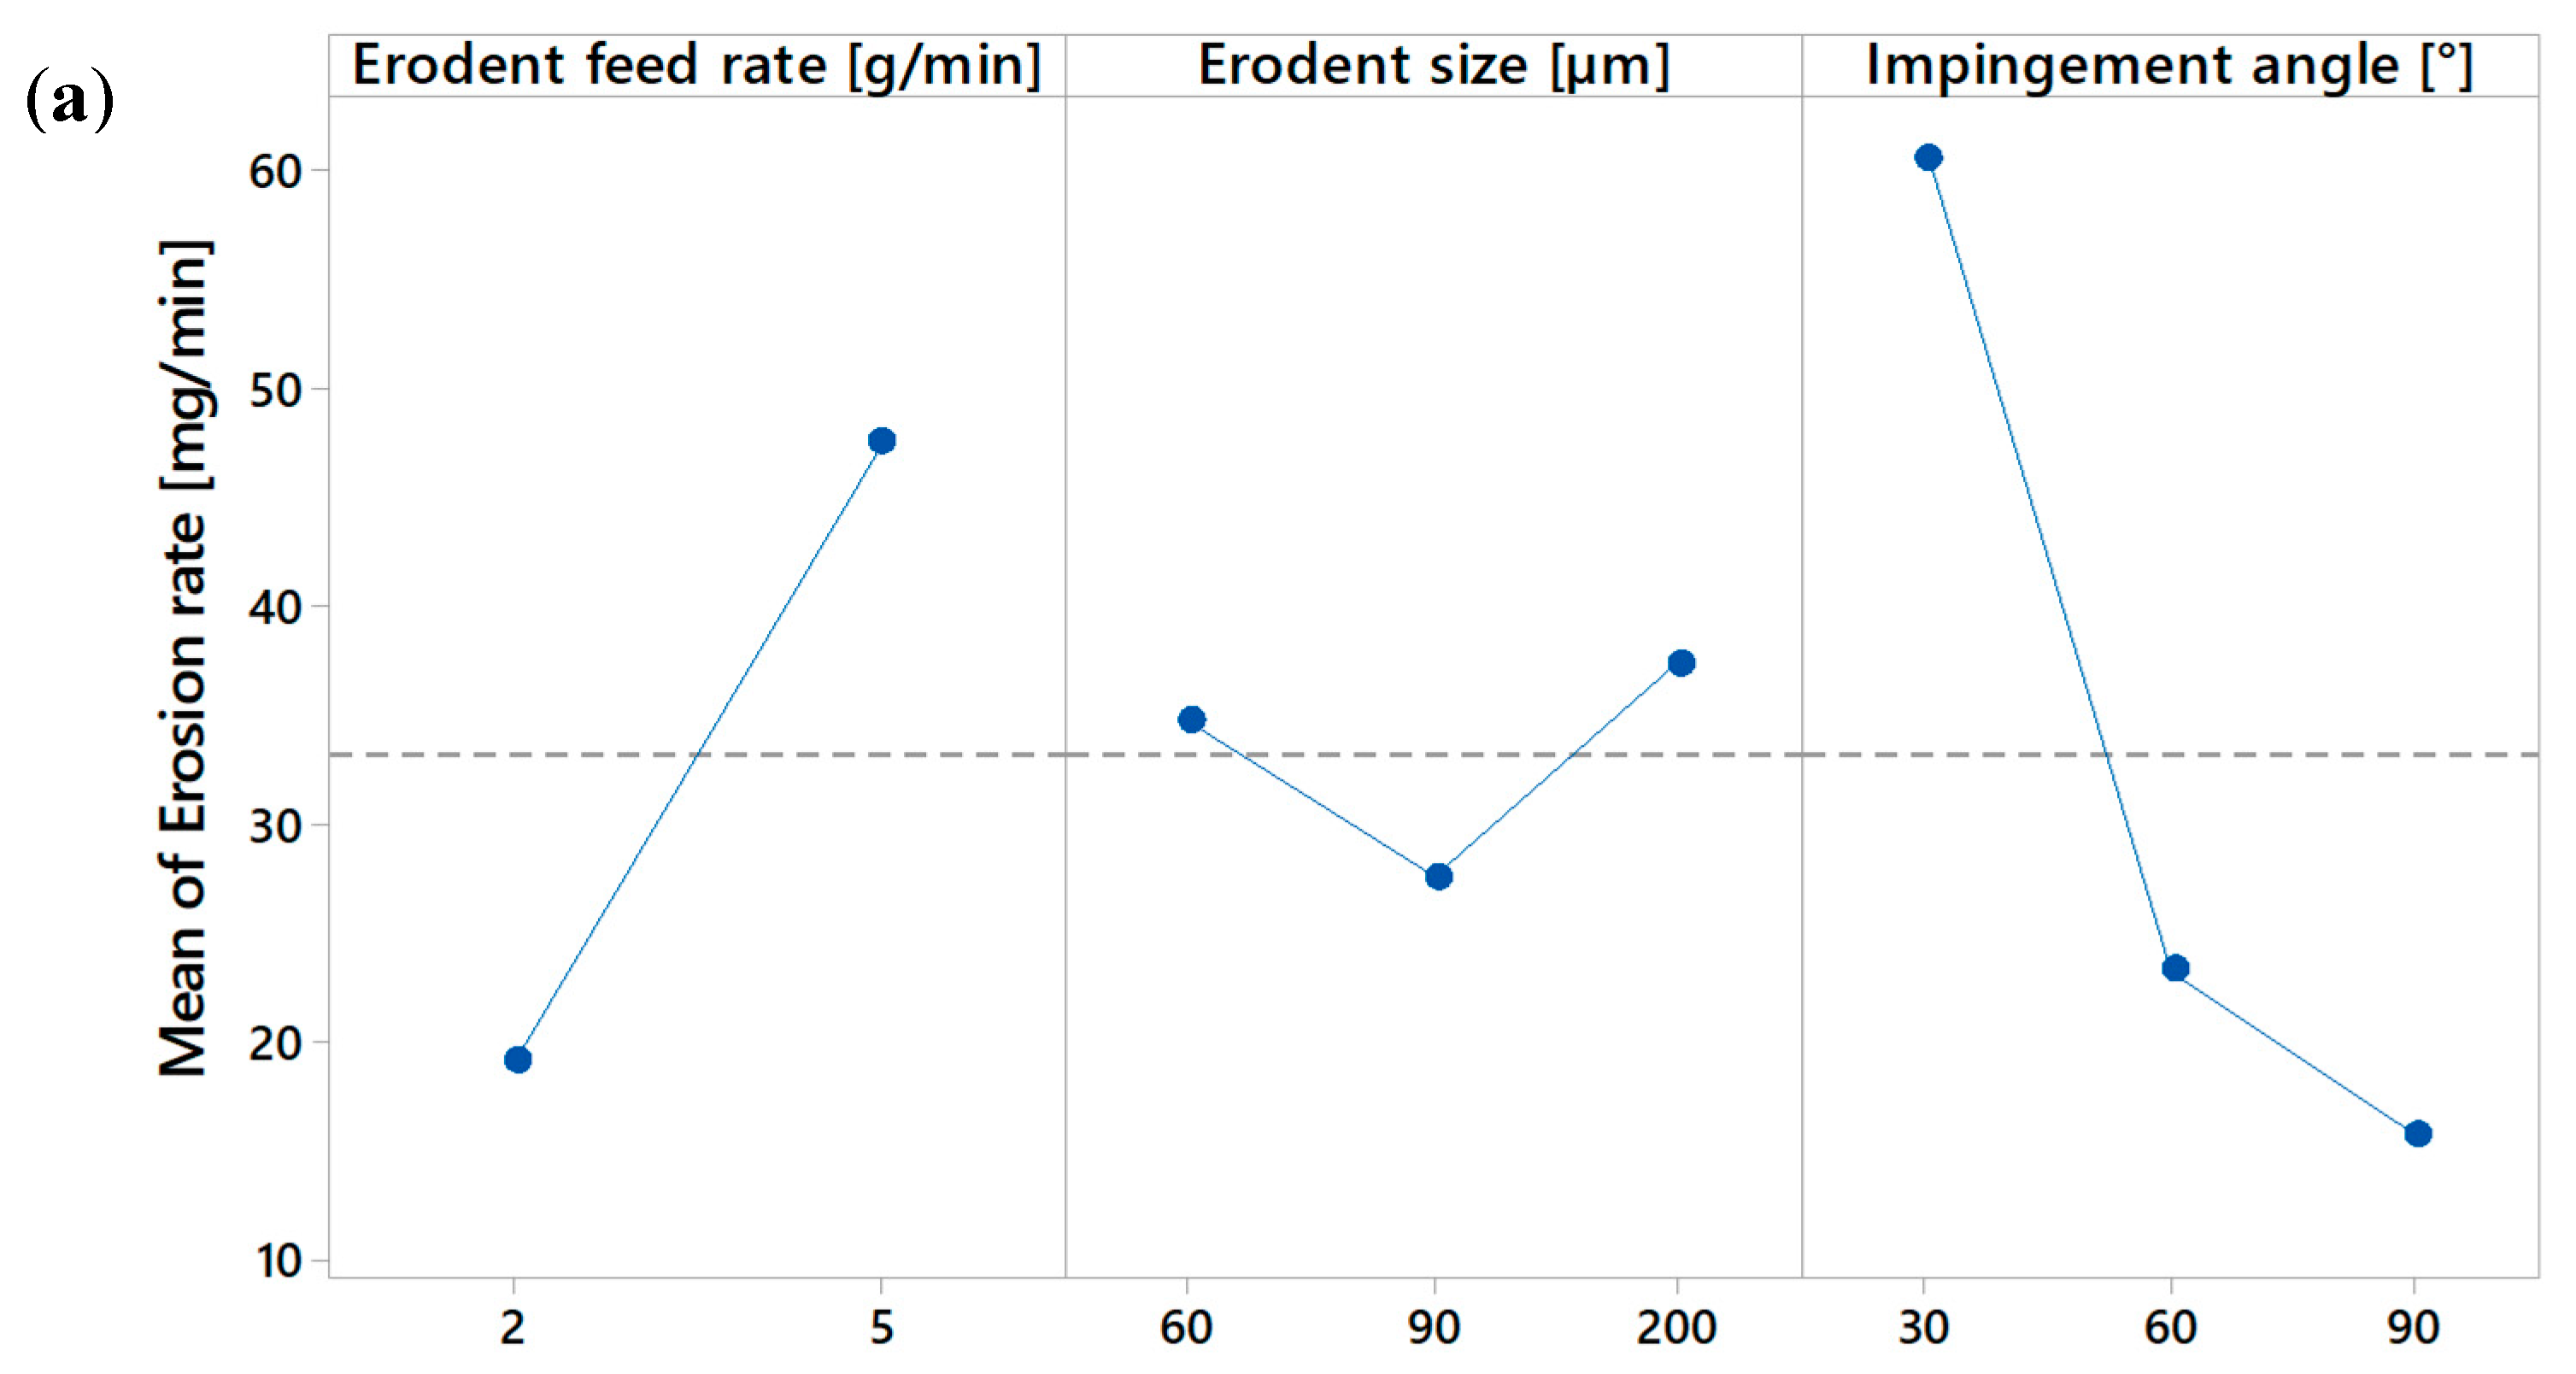
Table 7 shows the ANOVA for the Erosion rate. In addition, the main effect and the interaction plots are reported in Figure 5. A first qualitative analysis may be performed by analyzing the main effect plot of Figure 5, in which the higher the slope of the line that connects the levels of the process variables, the greater the influence of each variable [25]. It is evident from Figure 5 that the impingement angle has the highest effect on the Erosion rate, followed by the Erodent feed rate, while the lowest effect is due to the Erodent size. Specifically, an angle of 90° produces an erosion rate of about 16 mg/min; conversely, using an angle of 30°, the erosion rate is slightly above 60 mg/min. Using the intermediate angle, 60°, the erosion rate is reduced to about 23 mg/min. Moreover, an erodent feed rate of 2 g/min causes an erosion rate of about 19 mg/min, while with its increase to 5 g/min, the corresponding erosion rate reaches 47.5 mg/min. It should be noted that this linear trend, as shown in Figure 5a, represents a first approximation of the dependence between the Erosion rate and the Erodent feed rate. In order to define this dependence with more accuracy, further erosion tests would be necessary, e.g., by including a third level within the erodent feed rate range of 2–5 g/min. As far as the erodent size is concerned, it produces the weakest effect on the erosion rate (60 μm, 90 μm, and 200 μm corresponds to 34.6 mg/min, 27.6 mg/min, and 37.5 mg/min, respectively) with respect to the other two process variables. It should be highlighted that the trend of the impingement angle on the response is of indirect proportionality, whereas that of the erodent feed rate is of direct proportionality. A case apart is that of the erodent size, because from 60° to 90° the erosion rate decreases, while between 60° and 90°, a growing positive trend is exhibited. These results are in accordance with other previous studies [24,37,38,39,40]. However, they strongly depend on the impacting particle properties (density, hardness, size, and shape), target materials, temperature, and velocity of abrasive particles. In agreement with the main effect plot of Figure 5a, in the ANOVA, see Table 7, it emerges that the erodent feed rate and the impingement angle are significant, i.e., their p-values are less than 5%.
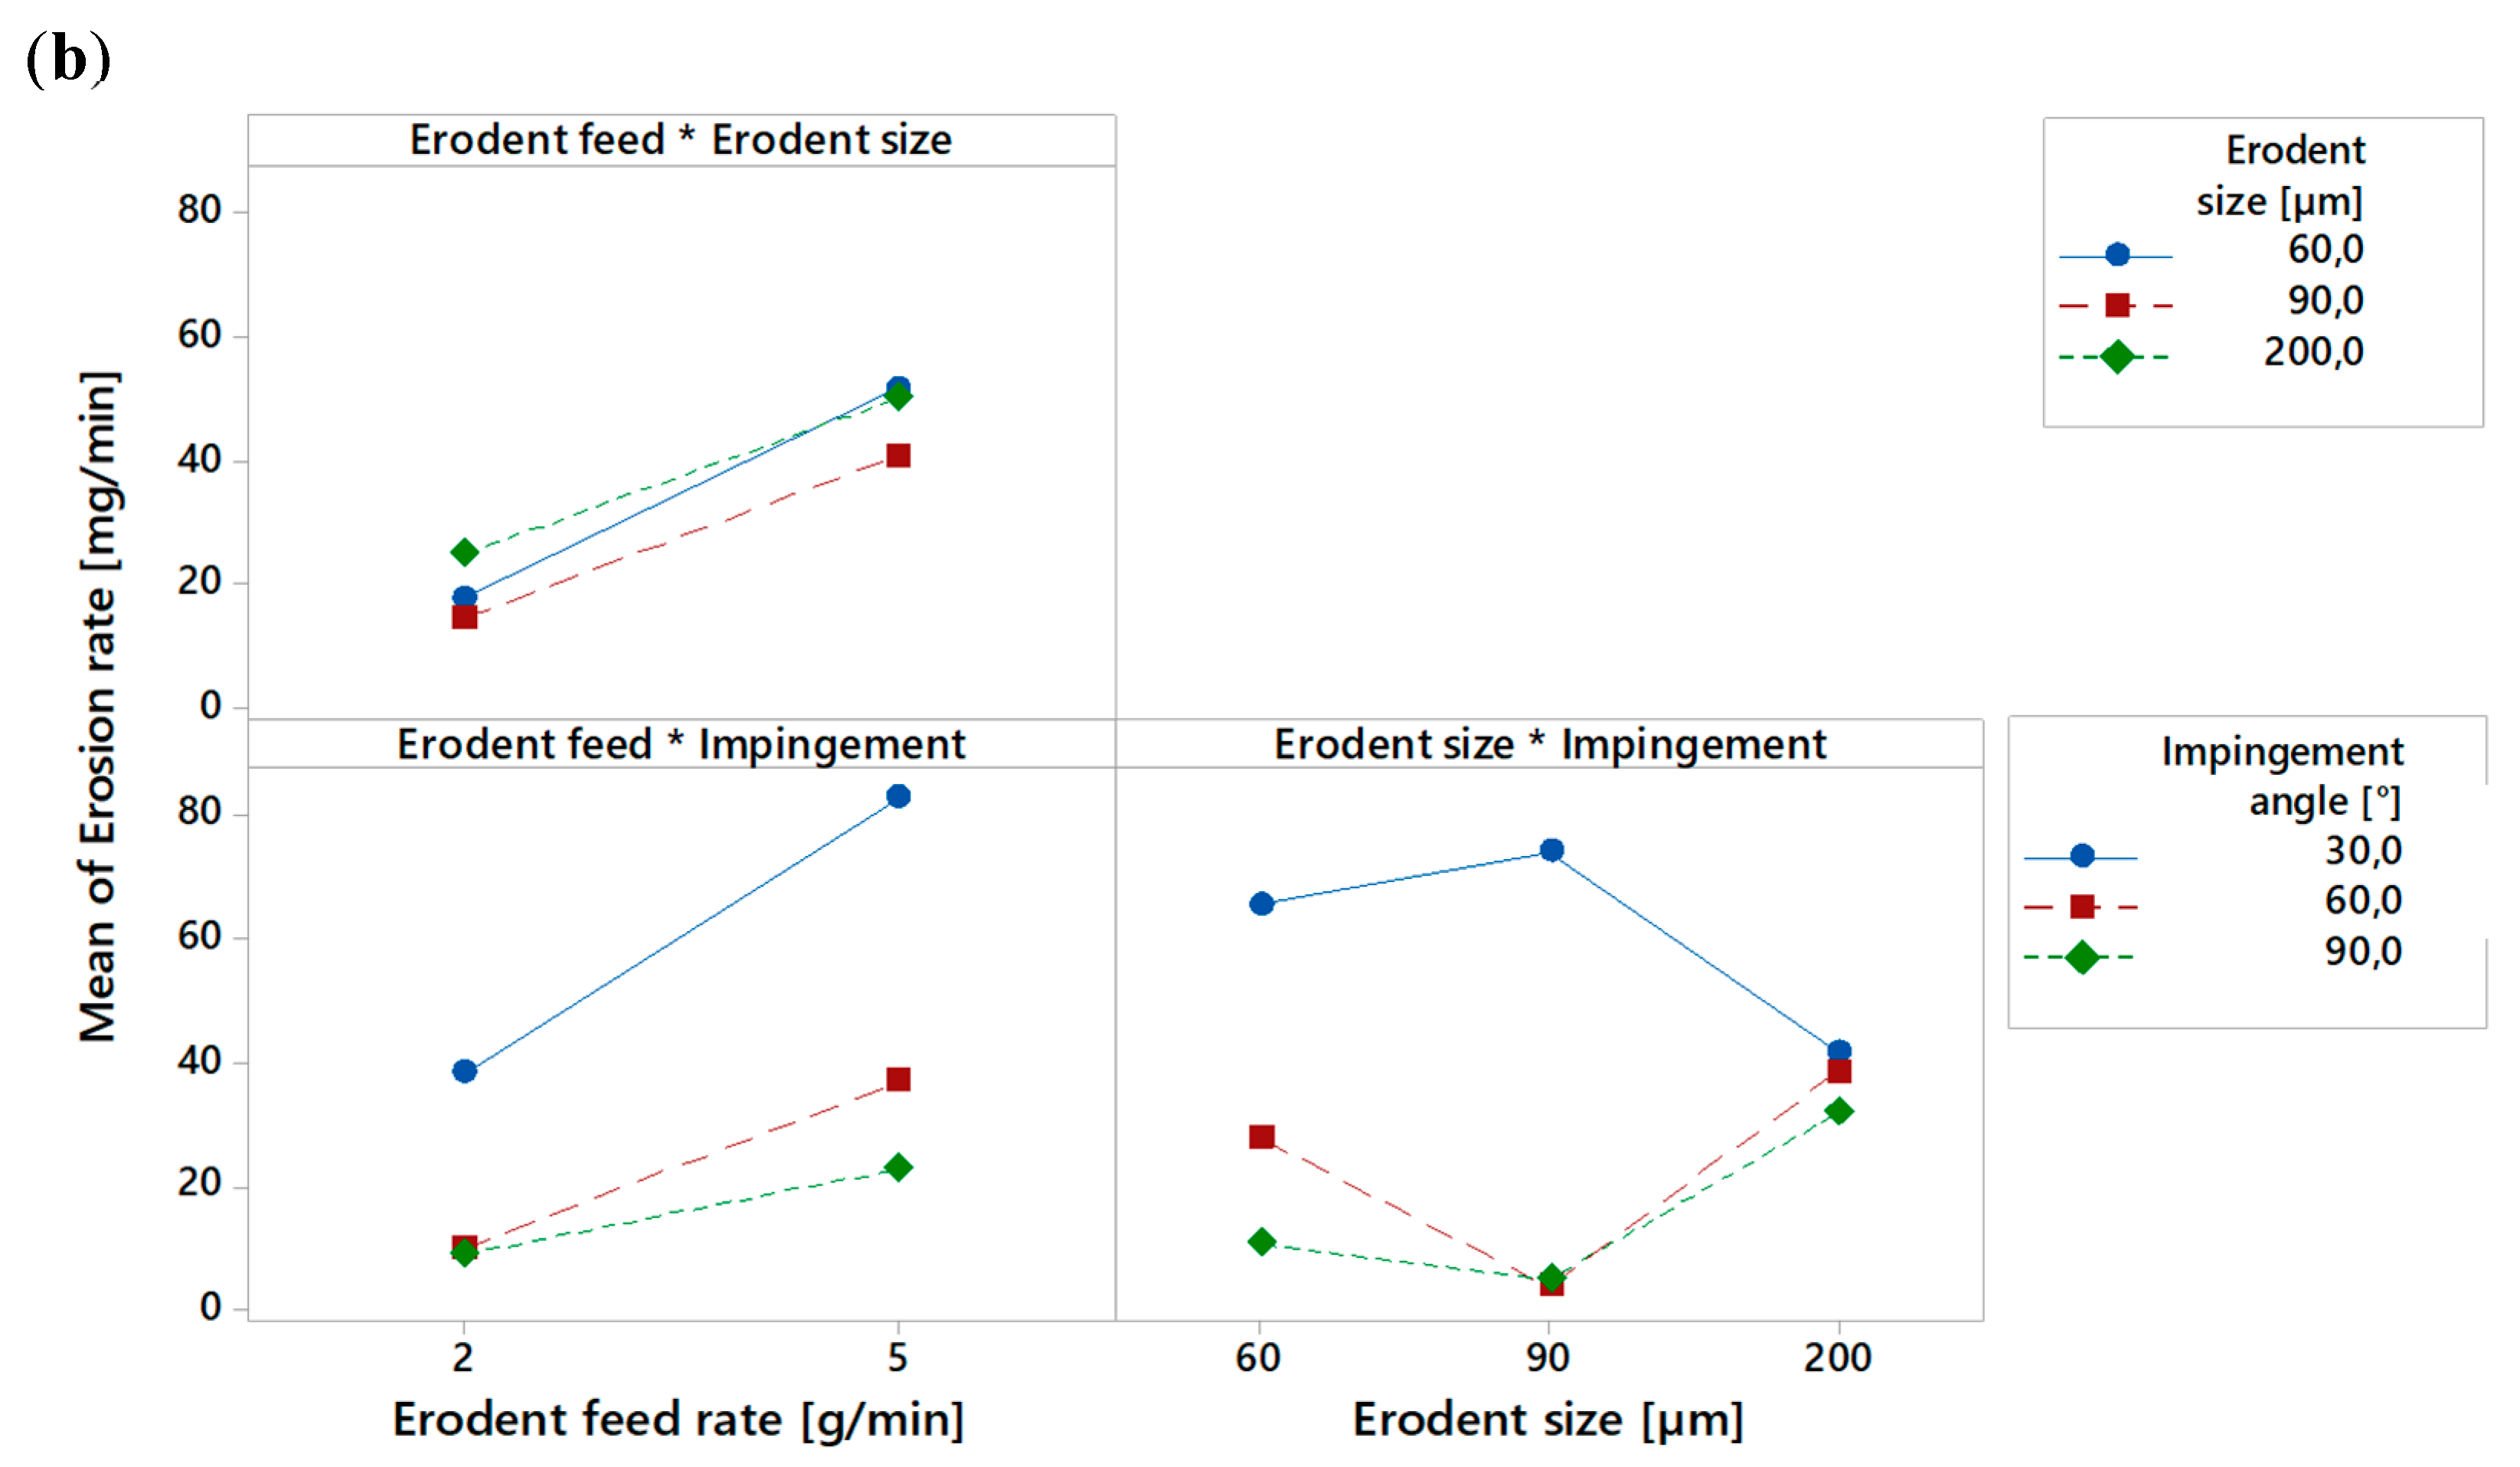
The interactions between the process variables may be evidenced by using the interaction plot (see Figure 5). Parallel lines in an interaction plot indicate no interaction, while the greater the deviation of the lines from the parallel state, the higher the degree of interaction [25]. In the plot, interactions between the erodent feed rate and size are shown, as well as between the erodent feed rate and impingement angle. However, the most evident interaction is the one between the erodent size and impingement angle. With a particle size of 200 μm, the erosion rate is almost the same when using the three different impact angles. When, on the other hand, the particle size ranges from 60 to 200 μm, the mass loss is greater at 30° than at the other two impact angles. In this range of erodent size, at 90°, the erosion rate is always lower than using an angle of 30°, except for particles of 90 μm, where no significant difference between the two angles is found. In the ANOVA, although the p-value of the interaction between erodent size and impingement angle is greater than the other two interactions, neither is nevertheless statistically significant at a level of significance of 5%. As explained hereafter, excluding from the analysis some non-significant factors, the significance of the last interaction of Table 7 will be highlighted.
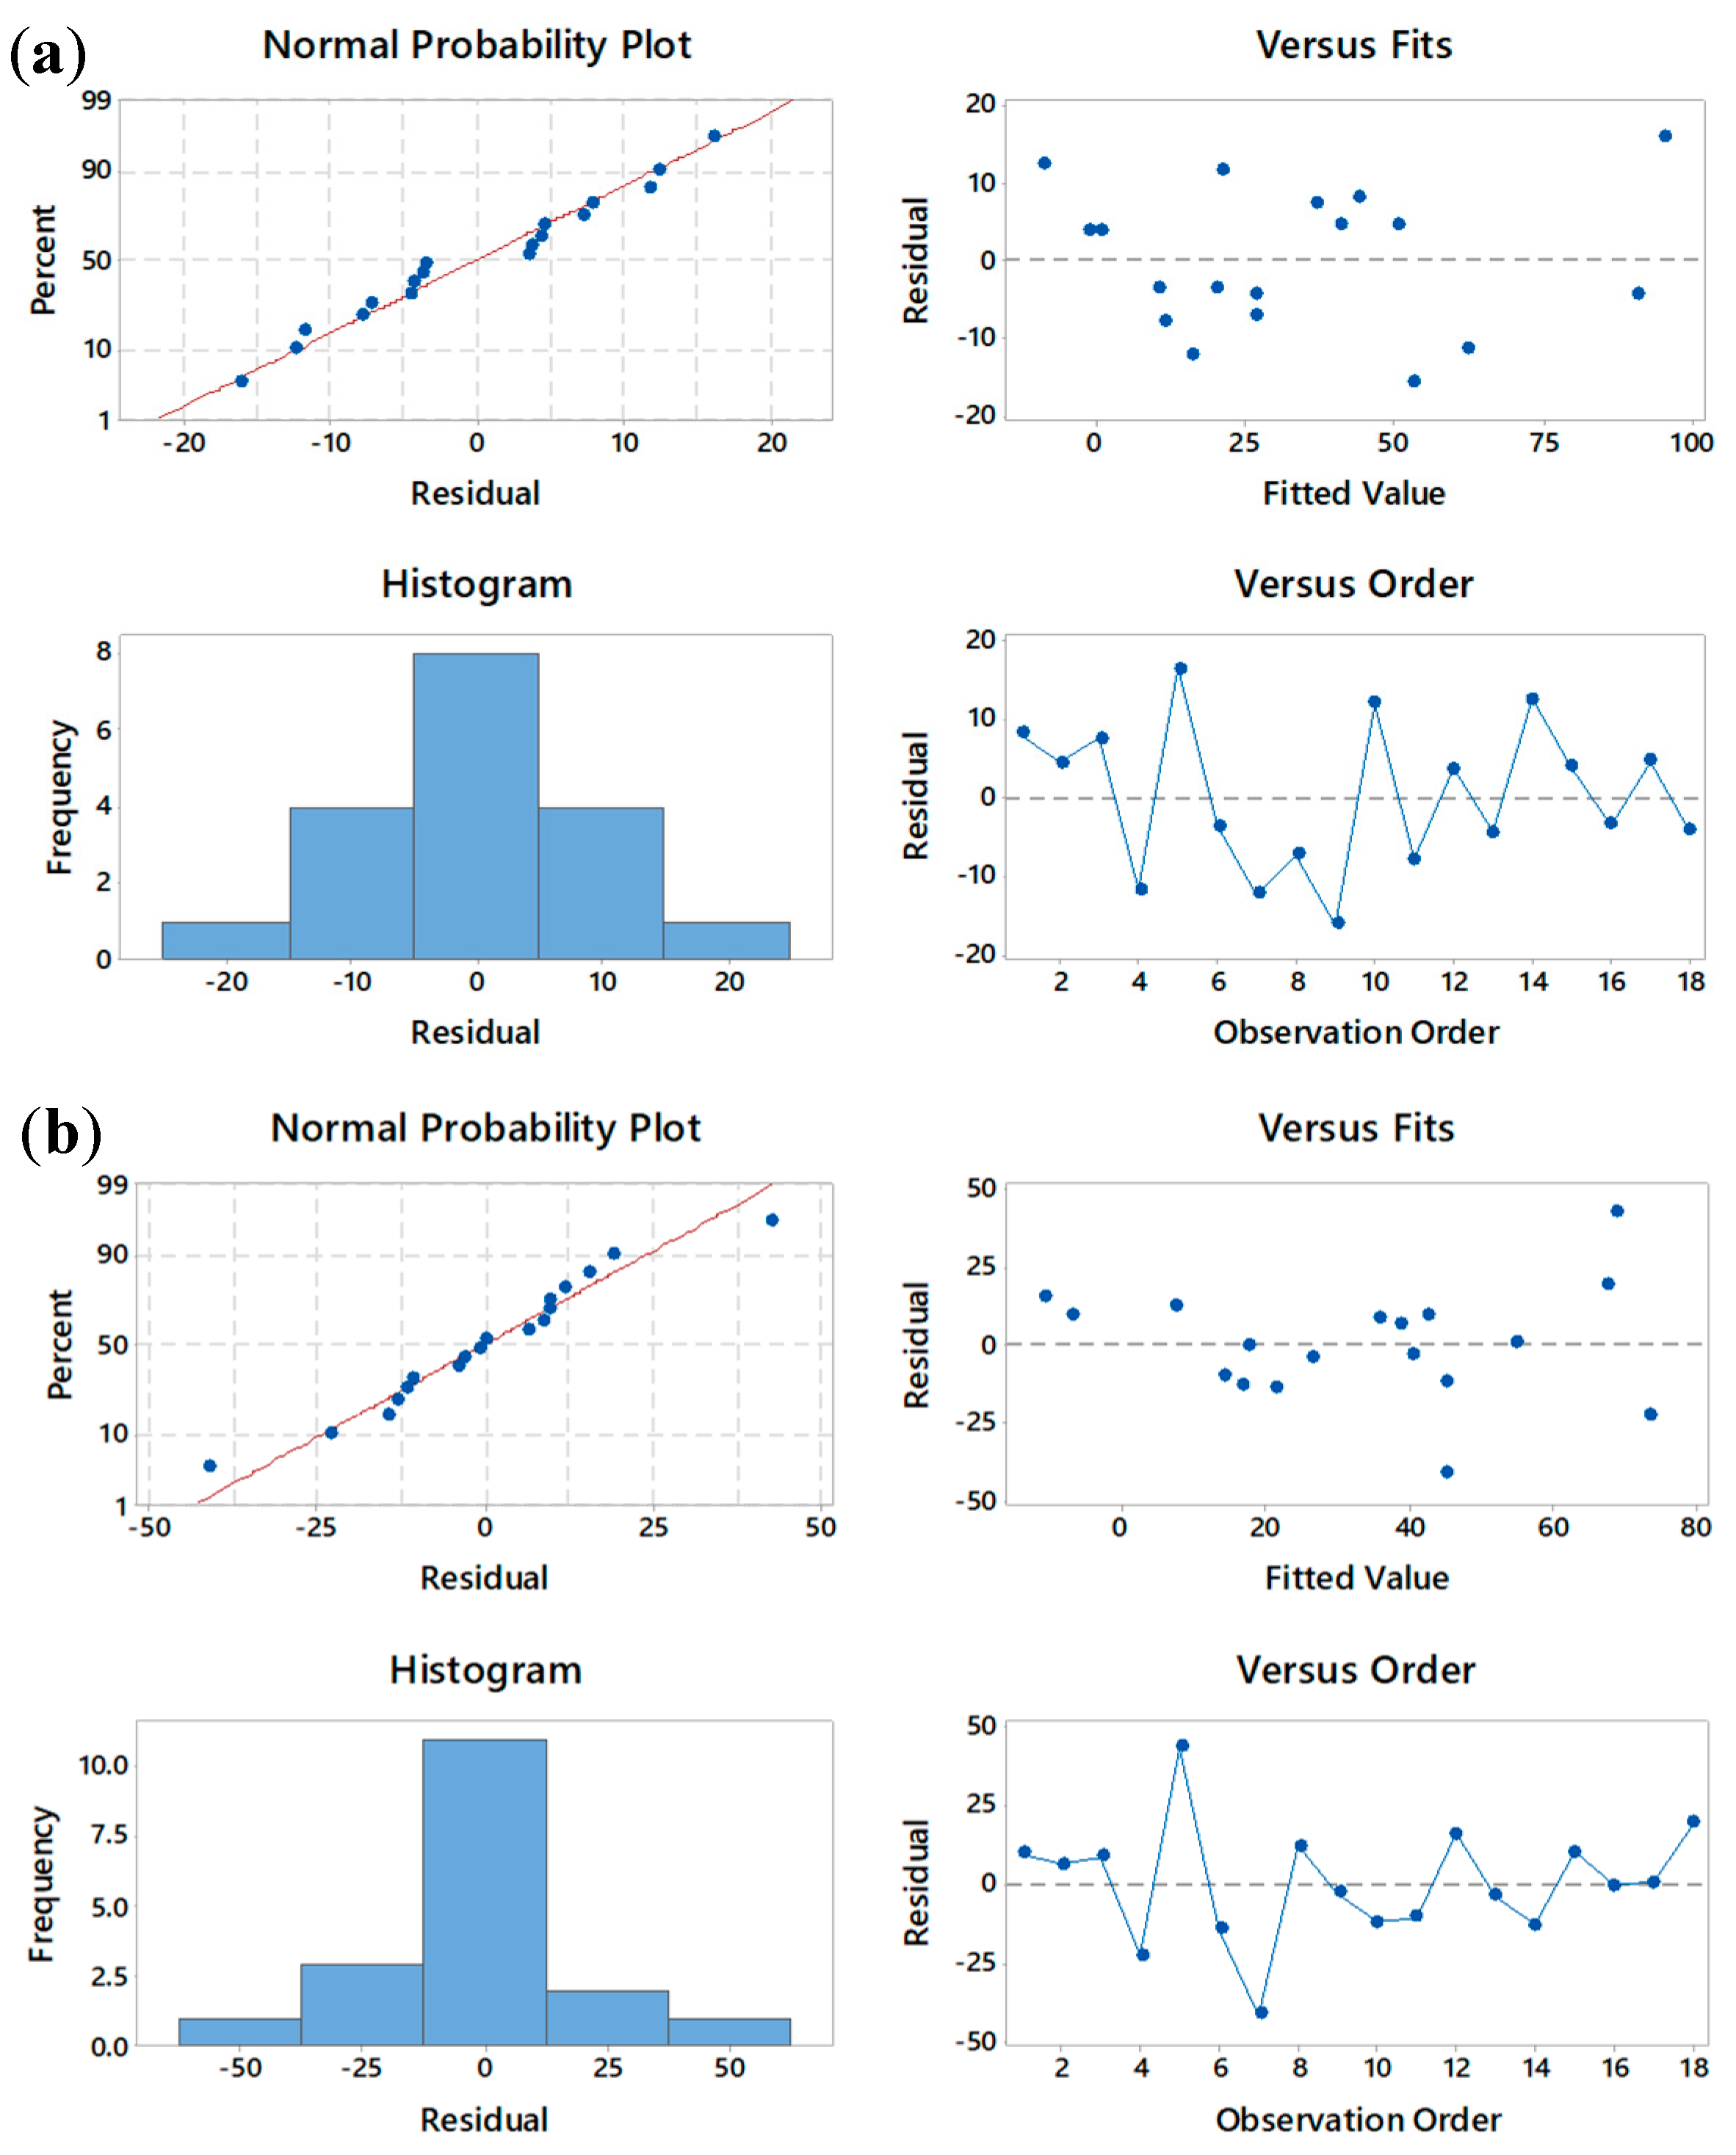
In Figure 6a, the residual plots for the response Erosion rate are reported. As evidenced in Figure 6a, the normality of the residuals, which are defined as the differences between the observed and the corresponding fitted, i.e., predicted, values, is graphically confirmed by the Normal Probability Plot (NPP), in which the experimental values are placed approximately along a straight line, and by the histogram. The normality of residuals is also statistically confirmed by performing the Anderson–Darling test, in which the null hypothesis, i.e., that the residuals follow a normal distribution, cannot be rejected with a p-value of 0.59 [41]. The residuals versus fitted values plot shows a horizontal band around the residual line (value 0), and no recognizable patterns are evidenced. The residuals versus order plot also does not reveal non-random errors, especially concerning time-related effects. The coefficient of determination, R2, which is a goodness of fit measure of the model, reveals that the observed variation in the Erosion rate explained by the model is 90.95%.
In order to obtain a model that contains exclusively significant predictors, the factorial design was analyzed using the stepwise method. The stepwise method both adds and removes predictors at each step, according to selected α to enter and α to remove values [41]. In line with the literature, the α to enter and α to remove values were set to 0.15 in this study [42]. The new ANOVA table obtained from the stepwise method is shown in Table 8. As expected, only significant terms are present in Table 8. Specifically, the Erodent feed rate and the Impingement angle are highly significant (p-value ≤ 0.01), while the interaction between the Erodent size and Impingement angle is significant at an α level of 0.10. The R2 value decreases to 84.27%. However, the R2 adjusted increases from 61.54% (model containing all predictors) to 73.27% (model containing only significant predictors). Indeed, the R2 value always increases when adding additional predictors to a model, whereas the R2 adjusted shows as a percentage how much the model explains the variance of the response considering the numbers of predictors [35].
The analysis of residuals obtained with the stepwise method is shown in Figure 6b and suggests, again, that the model fits the data well. However, examining the residuals versus the fitted values plot, slight heteroscedasticity is highlighted, i.e., the residuals in correspondence to the higher fitted values have a greater variance than the lower fitted values. In order to overcome this problem, a weighted regression is implemented. Indeed, when the least squares assumption of constant variance in the residuals is violated, a weighted regression can be adopted to produce residuals with constant variance (homoscedasticity) [41]. Consequently, in order to estimate the coefficients of the model containing the significant process variables exclusively (see Table 8), the weighted regression reported in Equation (2) was implemented:
Erosion   rate   = c 0 + c 1 E f r + c 2 I a + c 3 E s I a .
Therefore, the predicted response, the Erosion rate, was related to the set of regression coefficients (c): the intercept (c0), linear (c1 and c2), and interaction (c3). The regression weights used are the reciprocal of the variance of each Erosion rate value and then normalized. The regression implemented provided the coefficients of the regression model, which are reported in Table 9.
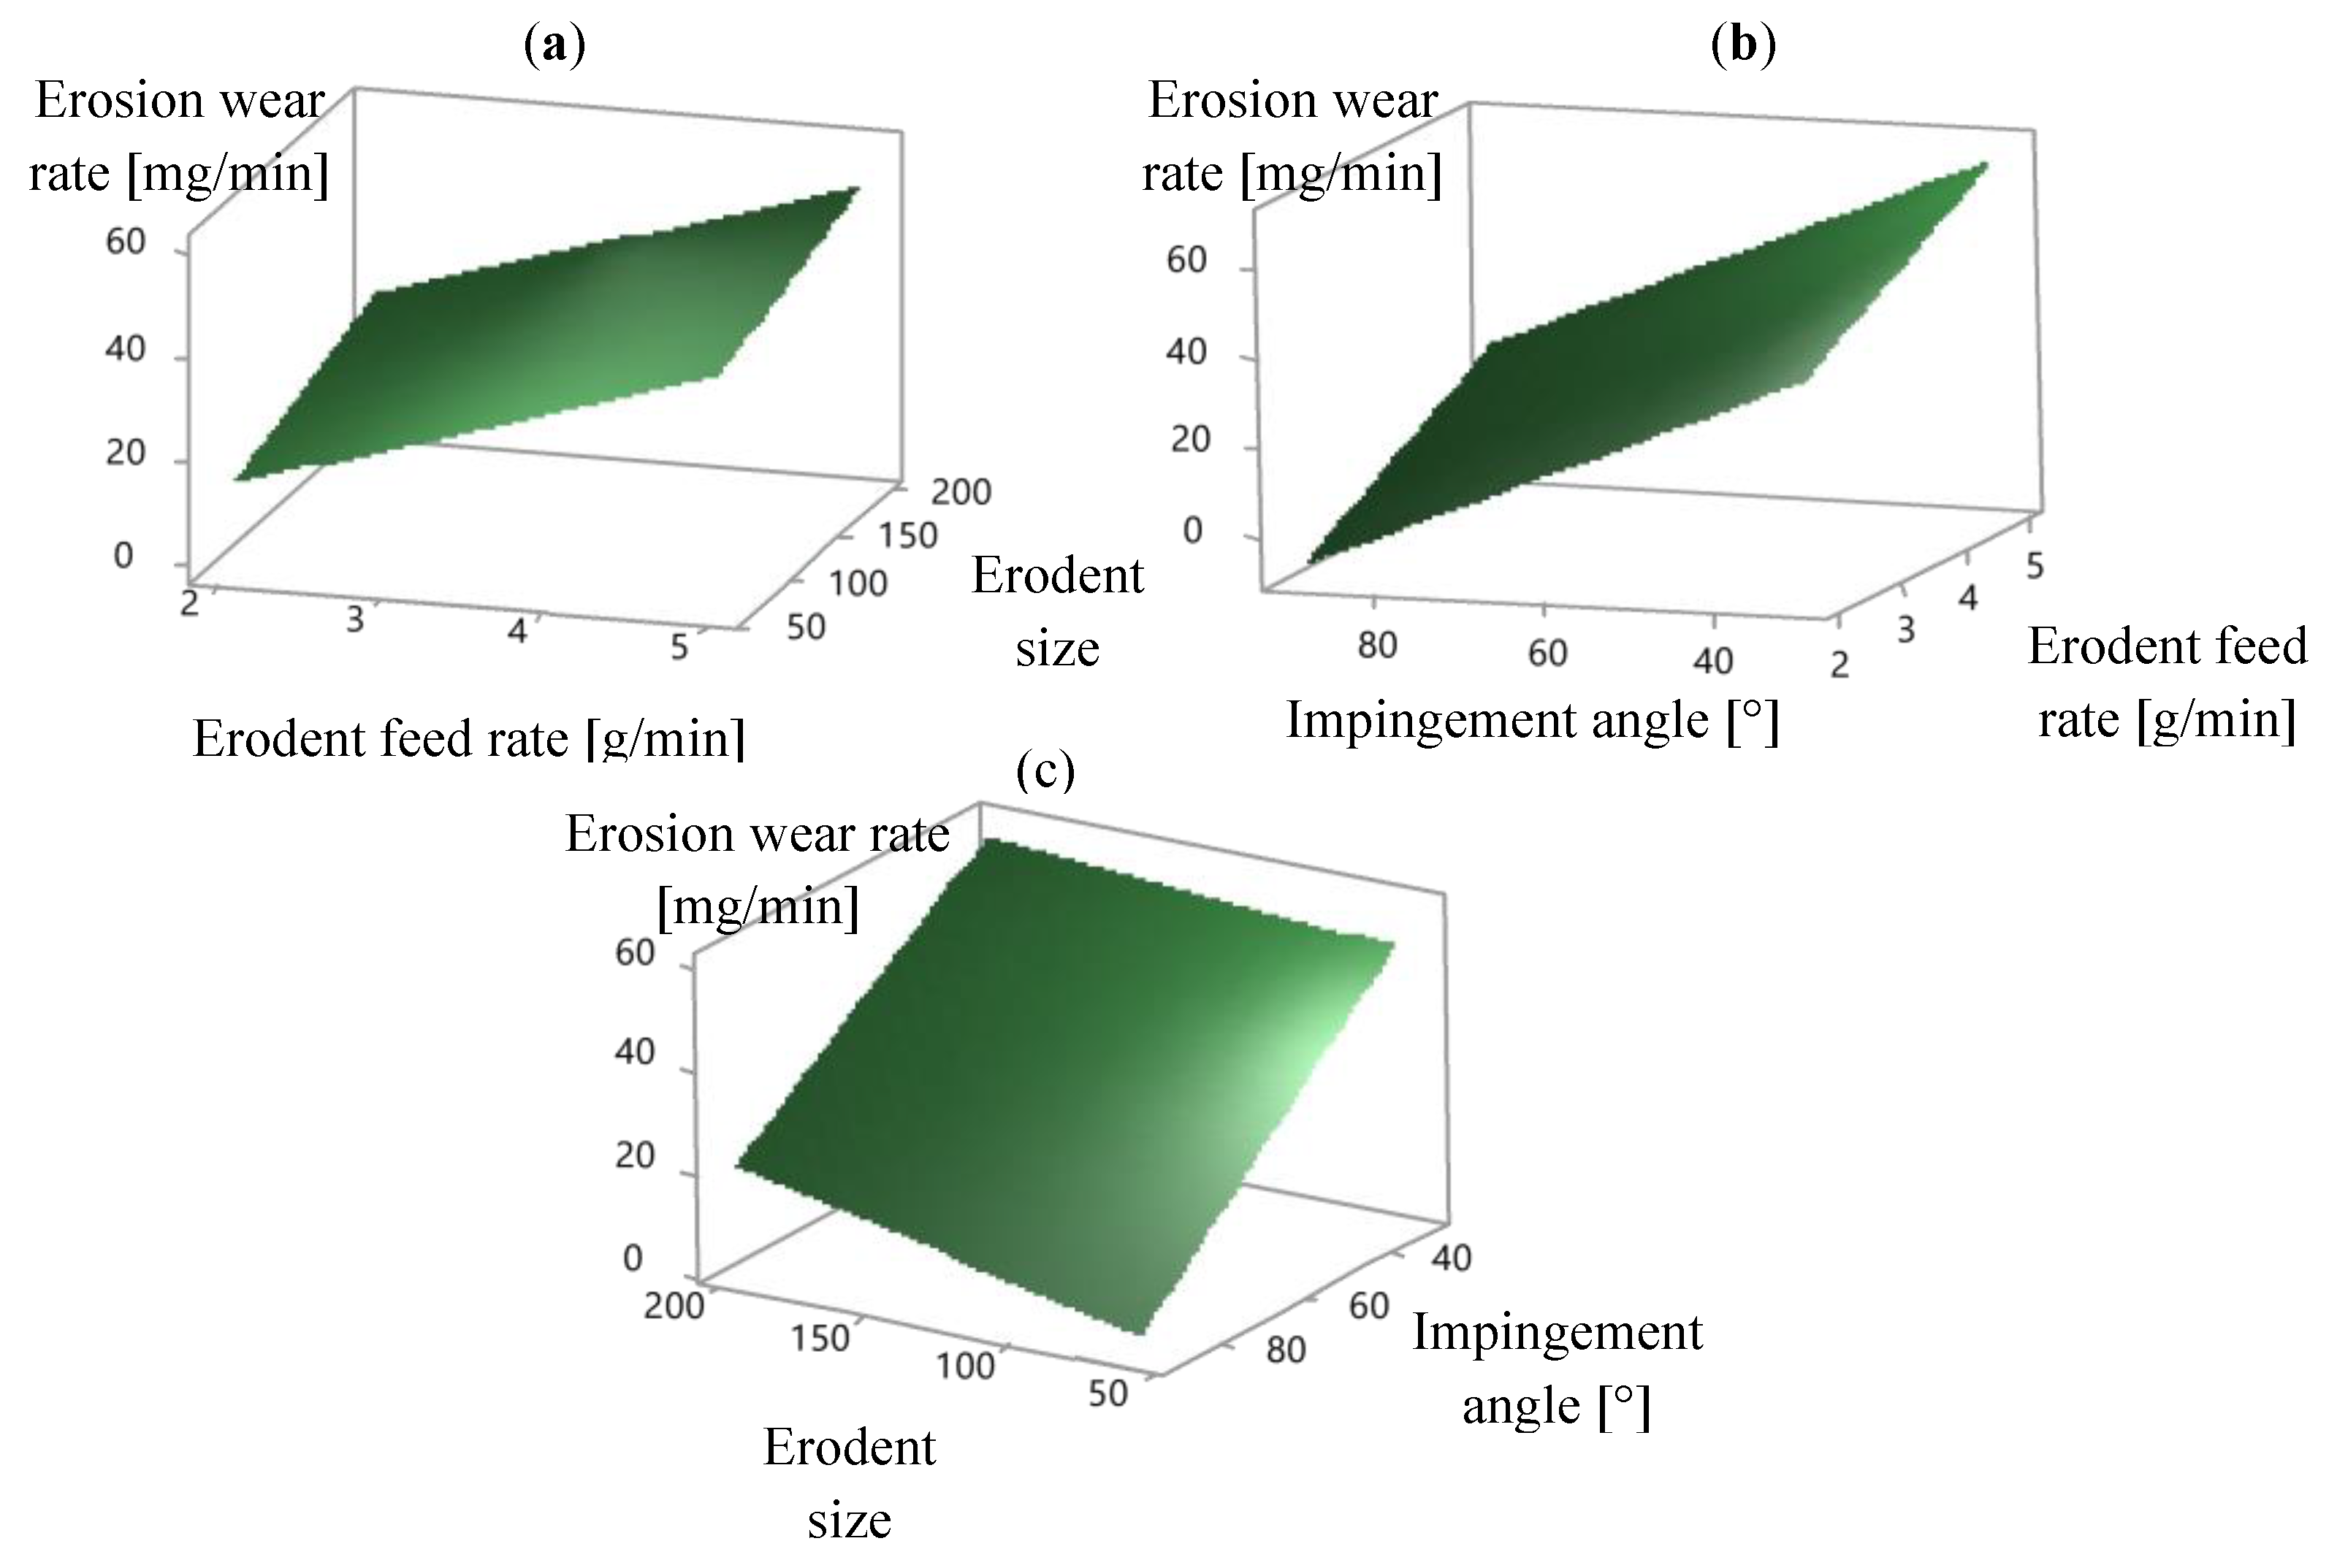
In order to visualize the trend of the response as a function of the variations of the process variables, Figure 7 is provided. In Figure 7, the surface plots relating the fitted response to the three pairs of independent variables are reported. A surface plot displays the three-dimensional relationship with the independent variables on the x-axis and y-axis, and the response (z) variable represented by a smooth surface. The graphs are generated by calculating the fitted responses using the independent variables and keeping the third control variable constant at a specified value.

3.2.2. Optimization

From the analysis and optimization of the model reported in Equation (2) and the related surface plots illustrated in Figure 7, the combination of process variables optimizing the response for the cold-sprayed IN718-Ni composite coating was obtained. Indeed, the model identified (see Equation (2) and Table 9) has the dual purpose of (i) predicting the erosion performance of the real component deposited with IN718-Ni coating under the working conditions, and of (ii) properly designing the in-service conditions of the new cold-sprayed component. Specifically, the objective function was the minimization of the response, i.e., the Erosion rate. Such a process variables setup is summarized in Table 10, together with the predicted value of the Erosion rate. To validate the optimized parameter settings, four erosion tests were performed using the optimal set of process variables, and the average value of the Erosion rate obtained in such tests is reported in Table 10. The result shows that the average value for the Erosion rate falls within the prediction interval, with a deviation from the model prediction of 7.47%.
It should be highlighted that the optimal set of process variables reported in Table 10 is the same used in Run 12 of Table 6, but the erosion rates obtained are slightly different. Indeed, the experimental and predicted values (reported in Table 10) and the erosion rate of Run 12 (shown in Table 6) are respectively 3.31 mg/min, 3.08 mg/min, and 3.49 mg/min. Such differences in the erosion rate are to be attributed to the intrinsic variability of the erosion process (random effects). Besides, the minimum value of the Erosion rate obtained in the experiments (see Table 6) was achieved in test no. 15, by setting the Erodent feed rate and the Impingement angle at the same value reported in Table 10, using however an Erodent size of 90 μm instead of 60 μm. This result should not be surprising, because the predicted value of the response using the same parameters set of the test no. 15 is 3.12 mg/min, which is slightly higher than the minimum value reached by the prediction model. These conclusions are in accordance with what has been discussed in relation to Figure 7.

3.2.3. Worn Surface Analysis

To investigate the erosion mechanism caused by the erodent particles on the surfaces of the Ni-INC718 coating, the worn surfaces were analyzed by SEM. The worn surfaces of the coatings tested using the optimal set of parameters reported in Table 10 were analyzed and then compared with the worst-case scenario obtained in the planned experimentation, i.e., the test performed using an impingement angle of 30°, erodent size of 90 μm, and erodent feed rate of 5 g/min. The analysis performed on the two cases show a significant difference in mass loss, and both were consistent with the characteristics of particle erosion of ductile materials [43]. In the case of low impact angles, when erosion resistance increases with increase in hardness and the mechanism of micro-cutting is dominant, the structure with a high hard phase content, as in the case of IN718 particles in the Ni matrix, is preferable. In the case of 90° impact, the structure with medium-hard phase content but higher hardness shows better erosion resistance. Particle velocity also has a key role in the erosion process. When the velocities are high, the eroded material may be plastically deformed, but if the particles are sharp, then other erosion mechanisms such as cutting and brittle fragmentation are more likely to occur [
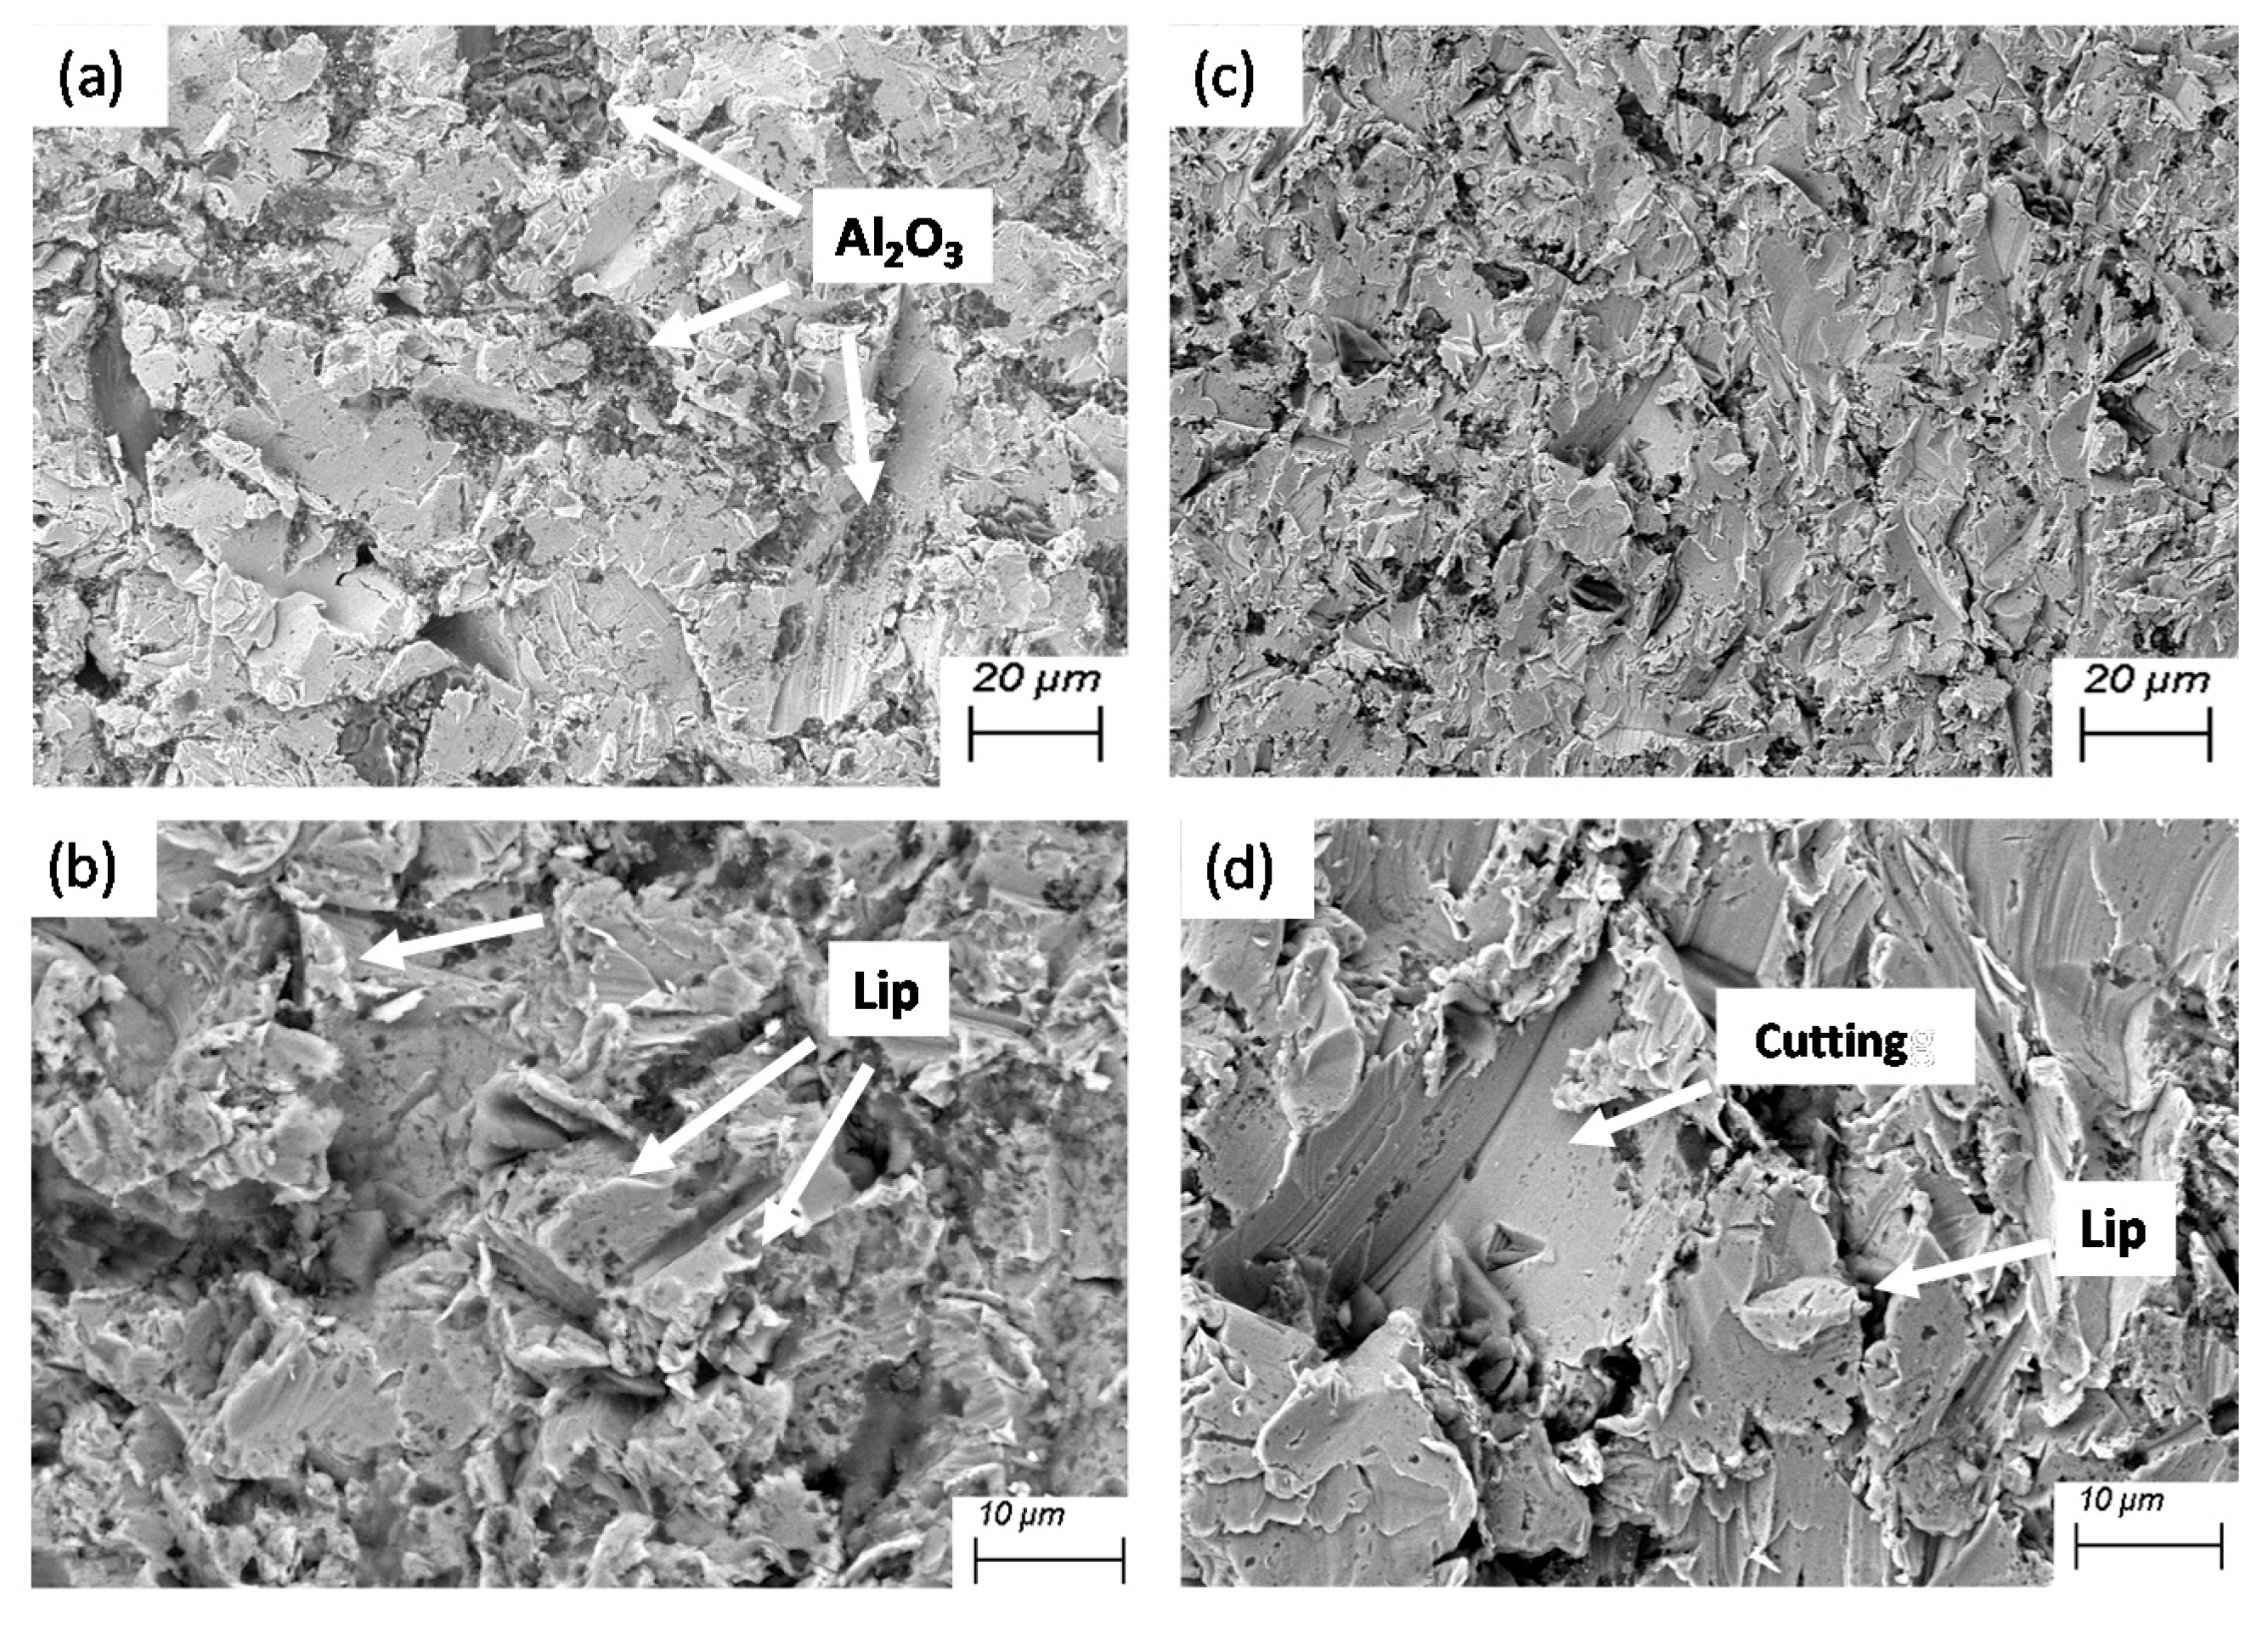
44]. The eroded surface under the optimal condition of erosion rate is illustrated in Figure 8a,b. The surface was not cut, but it was deeply perforated, and the coating underwent a surface extrusion forming erosion lips. Figure 8a shows how the erodent particles that hit the coating surface at high velocities split into small fragments. Alumina fragments embedded in the coating, which have been detected more frequently at 90° than at 30°, can provide a surface shielding effect against further material loss and thus decrease the erosion rate [26]. Erodent particle fragmentation becomes more probable at high velocities and at a 90° impact angle. The dissipation of kinetic energy at impact did not result in any evident surface crack. In the case in which the erodent particles impacted on the coating surface at 30°, it is evident from Figure 8c,d that the cutting mechanism and chip removal are dominant. In such a case, it was observed that the alumina erodent particles generated plastic scratches because, according to Hutchings [40], the ratio Ha/Hs >1.2 (where Ha is the hardness of abrasive particles and Hs is the harness of the surface) and therefore abrasive erosion mechanism occurred. Figure 8c shows the erosion track caused by the erodent particle. At a 30° impact angle, the size of the craters is larger than at a 90° angle, suggesting higher erosion rates. Such erosion morphologies produced by erodent particles at oblique angles have also been observed in other studies, see e.g., [26,45].

4. Conclusions

In this paper, a composite IN718-Ni coating was fabricated via conventional high-pressure cold spray using the following working conditions: nitrogen as carrier gas, pressure of 3.0 MPa, and temperature of 1000 °C. The feedstock was obtained by mechanically mixing IN 718 powders and Ni powders at the same mass fraction, resulting in 30 wt % IN718 retention into the final coating. The coating was characterized in terms of porosity and micro-hardness. Then, to investigate the effects of some operating variables on the erosion rate of the coating, a general full factorial design was adopted. The variables chosen were the impingement angle, the erodent size, and the erodent feed rate. It was found that the erodent feed rate and the impingement angle have a statistically significant effect on the erosion rate, as well as the interaction between erodent size and impingement angle. Then, a mathematical model relating such variables with the erosion rate was identified by weighted regression analysis. The identified model effectively allows to predict the erosion performance of the real component deposited with IN718-Ni coating under the working conditions and to properly design the in-service conditions of new cold-sprayed component. The set of parameters optimizing the erosion rate was accordingly derived by performing an optimization. It was found that the erosion rate is minimized when:
  • the erodent feed rate is 2 g/min;
  • the erodent size is 60 μm;
  • the impingement angle is 90°.
Finally, the worn surfaces of the coatings were observed by SEM in order to understand the erosion mechanism.

Author Contributions

Conceptualization, E.V., R.B., M.K. and R.L.; Methodology, E.V., M.K. and R.L.; Software, E.V., R.B. and M.K.; Validation, E.V. and R.B.; Formal analysis, E.V. and R.B.; Investigation, E.V.; Resources, R.L.; Data curation, E.V. and R.B.; Writing—original draft preparation, E.V. and R.B.; Writing—review and editing, E.V., M.K., M.G., E.B. and R.L.; Visualization, E.V.; Supervision, M.K., M.G., E.B. and R.L.; Project administration, R.L.; Funding acquisition, R.L. All authors have read and agreed to the published version of the manuscript.

Funding

This research was funded by Enterprise Ireland (EI) and SchuF Valve Technology GmbH (grant no. IP2018 0730).

Acknowledgments

The authors would like to thank the CRANN Advanced Microscopy Laboratory (AML) of Trinity College Dublin for its assistance in the section of microscopy, as well as Enterprise Ireland (EI) and SchuF Valve Technology GmbH (IP2018 0730) for their financial support.

Conflicts of Interest

The authors declare no conflict of interest.

References

  1. Totten, G.E. ASM Handbook, Volume 18: Friction, Lubrication, and Wear Technology; ASM International: Materials Park, OH, USA, 1992. [Google Scholar]
  2. Grewal, H.S.; Agrawal, A.; Singh, H.; Shollock, B.A. Slurry Erosion Performance of Ni-Al2O3 Based Thermal-Sprayed Coatings: Effect of Angle of Impingement. J. Therm. Spray Technol. 2014, 23, 389–401. [Google Scholar] [CrossRef]
  3. Peat, T.; Galloway, A.; Toumpis, A.; Harvey, D.; Yang, W.-H. Performance evaluation of HVOF deposited cermet coatings under dry and slurry erosion. Surf. Coat. Technol. 2016, 300, 118–127. [Google Scholar] [CrossRef] [Green Version]
  4. Hidalgo, V.H.; Varela, J.B.; Menendez, A.C.; Martınez, S.P. High temperature erosion wear of flame and plasma-sprayed nickel–chromium coatings under simulated coal-fired boiler atmospheres. Wear 2001, 247, 214–222. [Google Scholar] [CrossRef]
  5. Thakur, L.; Arora, N.; Jayaganthan, R.; Sood, R. An investigation on erosion behavior of HVOF sprayed WC–CoCr coatings. Appl. Surf. Sci. 2011, 258, 1225–1234. [Google Scholar] [CrossRef]
  6. Kiragi, V.R.; Patnaik, A.; Singh, T.; Fekete, G. Parametric optimization of erosive wear response of TiAlN-coated aluminium alloy using Taguchi method. J. Mater. Eng. Perform. 2019, 28, 838–851. [Google Scholar] [CrossRef]
  7. Praveen, A.S.; Sarangan, J.; Suresh, S.; Channabasappa, B.H. Optimization and erosion wear response of NiCrSiB/WC–Co HVOF coating using Taguchi method. Ceram. Int. 2016, 42, 1094–1104. [Google Scholar] [CrossRef]
  8. Sahu, S.P.; Satapathy, A.; Patnaik, A.; Sreekumar, K.P.; Ananthapadmanabhan, P.V. Development, characterization and erosion wear response of plasma sprayed fly ash–aluminum coatings. Mater. Des. 2010, 31, 1165–1173. [Google Scholar] [CrossRef]
  9. Yin, S.; Ekoi, E.J.; Lupton, T.L.; Dowling, D.P.; Lupoi, R. Cold spraying of WC-Co-Ni coatings using porous WC-17Co powders: Formation mechanism, microstructure characterization and tribological performance. Mater. Des. 2017, 126, 305–313. [Google Scholar] [CrossRef]
  10. Singh, R.; Rauwald, K.-H.; Wessel, E.; Mauer, G.; Schruefer, S.; Barth, A.; Wilson, S.; Vassen, R. Effects of substrate roughness and spray-angle on deposition behavior of cold-sprayed Inconel 718. Surf. Coat. Technol. 2017, 319, 249–259. [Google Scholar] [CrossRef]
  11. Zhang, L.; Yang, S.; Lv, X.; Jie, X. Wear and Corrosion Resistance of Cold-Sprayed Cu-Based Composite Coatings on Magnesium Substrate. J. Therm. Spray Technol. 2019, 28, 1212–1224. [Google Scholar] [CrossRef]
  12. Wong, W.; Irissou, E.; Vo, P.; Sone, M.; Bernier, F.; Legoux, J.-G.; Fukanuma, H.; Yue, S. Cold spray forming of Inconel 718. J. Therm. Spray Technol. 2013, 22, 413–421. [Google Scholar] [CrossRef]
  13. Chen, C.; Xie, Y.; Xie, X.; Yan, X.; Huang, R.; Wang, J.; Ren, Z.; Deng, S.; Liao, H. Effects of substrate heat accumulation on the cold sprayed Ni coating quality: Microstructure evolution and tribological performance. Surf. Coat. Technol. 2019, 371, 185–193. [Google Scholar] [CrossRef]
  14. Chang, K.-M.; Henry, M.F.; Benz, M.G. Metallurgical control of fatigue crack propagation in superalloys. JOM 1990, 42, 29–35. [Google Scholar] [CrossRef]
  15. Qi, H.; Azer, M.; Ritter, A. Studies of standard heat treatment effects on microstructure and mechanical properties of laser net shape manufactured Inconel 718. Metall. Mater. Trans. A 2009, 40, 2410–2422. [Google Scholar] [CrossRef]
  16. Xu, X.; Ding, J.; Ganguly, S.; Williams, S. Investigation of process factors affecting mechanical properties of INCONEL 718 superalloy in wire+ arc additive manufacture process. J. Mater. Process. Technol. 2019, 265, 201–209. [Google Scholar] [CrossRef]
  17. Tokarev, A.O. Structure of aluminum powder coatings prepared by cold gasdynamic spraying. Met. Sci. Heat Treat. 1996, 38, 136–139. [Google Scholar] [CrossRef]
  18. Marrocco, T.; McCartney, D.; Shipway, P.; Sturgeon, A.J. Comparison of the microstructure of cold sprayed and thermally sprayed IN718 coatings. In Thermal Spray 2006: Building on 100 Years of Success, Proceedings of the 2006 International Thermal Spray Conference, Seattle, WA, USA, 15–18 May; ASM International: Materials Park, OH, USA, 2006; pp. 15–18. [Google Scholar]
  19. Sun, W.; Bhowmik, A.; Tan, A.W.Y.; Xue, F.; Marinescu, I.; Li, F.; Liu, E. Strategy of incorporating Ni-based braze alloy in cold sprayed Inconel 718 coating. Surf. Coat. Technol. 2019, 358, 1006–1012. [Google Scholar] [CrossRef]
  20. Levasseur, D.; Yue, S.; Brochu, M. Pressureless sintering of cold sprayed Inconel 718 deposit. Mater. Sci. Eng. A 2012, 556, 343–350. [Google Scholar] [CrossRef]
  21. Chaudhuri, A.; Raghupathy, Y.; Srinivasan, D.; Suwas, S.; Srivastava, C. Microstructural evolution of cold-sprayed Inconel 625 superalloy coatings on low alloy steel substrate. Acta Mater. 2017, 129, 11–25. [Google Scholar] [CrossRef]
  22. Li, Y.; Li, C.-J.; Yang, G.-J.; Xing, L.-K. Thermal fatigue behavior of thermal barrier coatings with the MCrAlY bond coats by cold spraying and low-pressure plasma spraying. Surf. Coat. Technol. 2010, 205, 2225–2233. [Google Scholar] [CrossRef]
  23. Yin, S.; Wang, X.; Suo, X.; Liao, H.; Guo, Z.; Li, W.; Coddet, C. Deposition behavior of thermally softened copper particles in cold spraying. Acta Mater. 2013, 61, 5105–5118. [Google Scholar] [CrossRef]
  24. Parsi, M.; Najmi, K.; Najafifard, F.; Hassani, S.; McLaury, B.S.; Shirazi, S.A. A comprehensive review of solid particle erosion modeling for oil and gas wells and pipelines applications. J. Nat. Gas Sci. Eng. 2014, 21, 850–873. [Google Scholar] [CrossRef]
  25. Montgomery, D.C. Design and Analysis of Experiments, 9th ed.; John Wiley & Sons: New York, NY, USA, 2017; ISBN 1119113474. [Google Scholar]
  26. Alidokht, S.A.; Vo, P.; Yue, S.; Chromik, R.R. Erosive wear behavior of cold-sprayed Ni-WC composite coating. Wear 2017, 376, 566–577. [Google Scholar] [CrossRef]
  27. Kazasidis, M.; Yin, S.; Cassidy, J.; Volkov-Husović, T.; Vlahović, M.; Martinović, S.; Kyriakopoulou, E.; Lupoi, R. Microstructure and cavitation erosion performance of nickel-Inconel 718 composite coatings produced with cold spray. Surf. Coat. Technol. 2020, 382, 125195. [Google Scholar] [CrossRef]
  28. Rafidah, A.; Nurulhuda, A.; Azrina, A.; Suhaila, Y.; Anwar, I.S.; Syafiq, R.A. Comparison design of experiment (doe): Taguchi method and full factorial design in surface roughness. In Applied Mechanics and Materials; Trans Tech Publications Ltd.: Zürich, Switzerland, 2014; Volume 660, pp. 275–279. [Google Scholar]
  29. Das, D.; Dwivedi, A. Parametric optimization of heat transfer from triangular fin array within a rectangular enclosure using design of experiment (DOE): A comparative analysis. J. Inst. Eng. Ser. C 2013, 94, 335–343. [Google Scholar] [CrossRef]
  30. Stenson, C.; McDonnell, K.A.; Yin, S.; Aldwell, B.; Meyer, M.; Dowling, D.P.; Lupoi, R. Cold spray deposition to prevent fouling of polymer surfaces. Surf. Eng. 2018, 34, 193–204. [Google Scholar] [CrossRef]
  31. Zum Gahr, K.-H. Wear by hard particles. Tribol. Int. 1998, 31, 587–596. [Google Scholar] [CrossRef]
  32. Hutchings, I.M. Solid particle erosive wear testing. In ASM Handbook. Mechanical Testing and Evaluation; Kuhn, H., Medlin, D., Eds.; ASM International: Materials Park, OH, USA, 2000; pp. 338–345. [Google Scholar]
  33. ASTM G76—18 Standard Test Method for Conducting Erosion Tests by Solid Particle Impingement Using Gas Jets; ASTM International: West Conshohocken, PA, USA, 2018.
  34. Mason, R.L.; Gunst, R.F.; Hess, J.L. Statistical Design and Analysis of Experiments: With Applications to Engineering and Science, 2nd ed.; John Wiley & Sons: New York, NY, USA, 2003. [Google Scholar]
  35. Montgomery, D.C.; Runger, G.C.; Hubele, N.F. Engineering Statistics; John Wiley & Sons: Hoboken, NJ, USA, 2009. [Google Scholar]
  36. Champagne, V.K. The Cold Spray Materials Deposition Process; Woodhead Publishing: Cambridge, UK, 2007; ISBN 1845693787. [Google Scholar]
  37. Sheldon, G.L.; Kanhere, A. An investigation of impingement erosion using single particles. Wear 1972, 21, 195–209. [Google Scholar] [CrossRef]
  38. Yabuki, A.; Matsuwaki, K.; Matsumura, M. Critical impact velocity in the solid particles impact erosion of metallic materials. Wear 1999, 233, 468–475. [Google Scholar] [CrossRef]
  39. Liebhard, M.; Levy, A. The effect of erodent particle characteristics on the erosion of metals. Wear 1991, 151, 381–390. [Google Scholar] [CrossRef]
  40. Hutchings, I.M. Mechanisms of the erosion of metals by solid particles. In Erosion: Prevention and Useful Applications; ASTM International: West Conshohocken, PA, USA, 1979. [Google Scholar]
  41. Devore, J.L. Probability and Statistics for Engineering and the Sciences; Cengage Learning: Boston, MA, USA, 2011; ISBN 978-0-538-73352-6. [Google Scholar]
  42. Wiegand, R.E. Performance of using multiple stepwise algorithms for variable selection. Stat. Med. 2010, 29, 1647–1659. [Google Scholar] [CrossRef] [PubMed]
  43. Shimizu, K.; Noguchi, T.; Seitoh, H.; Muranaka, E. FEM analysis of the dependency on impact angle during erosive wear. Wear 1999, 233, 157–159. [Google Scholar] [CrossRef]
  44. Yust, C.S.; Crouse, R.S. Melting at particle impact sites during erosion of ceramics. Wear 1978, 51, 193–196. [Google Scholar] [CrossRef]
  45. Hu, H.X.; Jiang, S.L.; Tao, Y.S.; Xiong, T.Y.; Zheng, Y.G. Cavitation erosion and jet impingement erosion mechanism of cold sprayed Ni–Al2O3 coating. Nucl. Eng. Des. 2011, 241, 4929–4937. [Google Scholar] [CrossRef]
Figure 1. (a) Morphology and (b) size distribution of IN718 particle; (c) morphology and (d) size distribution of nickel particle.
Coatings 10 00335 g001
Figure 2. SEM micrographs of the three different sizes of sharp-edged alumina particles: (a) 60 μm, (b) 90 μm, and (c) 200 μm.
Coatings 10 00335 g002
Figure 3. Cross-sectional images of the cold spray 50% IN718 – 50% Ni coating: (a) OM image; (b) OM image after etching; (c) SEM image.
Coatings 10 00335 g003
Figure 4. OM image of cold-sprayed (a) IN718 coating, adapted from [20], (b) 50% IN718 – 50% Ni coating produced for this study.
Coatings 10 00335 g004
Figure 5. Main effect plot (a) and interaction plot (b) for Erosion rate [mg/min].
Coatings 10 00335 g005aCoatings 10 00335 g005b
Figure 6. Residual plots for Erosion rate [mg/min] when considering (a) all predictors (see Table 7), (b) only significant predictors (see Table 8).
Coatings 10 00335 g006
Figure 7. Surface plot of Erosion rate [mg/min] versus: (a) erodent feed rate [g/min] and size [μm] (impingement angle is set to 60°); (b) Impingement angle [°] and erodent feed rate [g/min] (erodent size is set to 90 μm); (c) erodent size [μm] and impingement angle [°] (Erodent feed rate is set to 3.5 g/min).
Coatings 10 00335 g007
Figure 8. Worn surface of the IN718-Ni coating. Erosion test process variables used: (a,b) erodent feed rate = 2 g/min, erodent size = 60 μm, impingement angle = 90° (parameters setup obtained in the optimization, see Table 10); (c,d) erodent feed rate = 5 g/min, erodent size = 90 μm, impingement angle = 30°.
Coatings 10 00335 g008
Table 1. Chemical composition of LPW IN718 powder (weight %).
ElementAlBCCaCoCrCuFeMgO
Wt %0.50.0010.04<0.010.0718.99<0.1Bal<0.010.02
ElementMnMoNb+TaNiPSSeSiTiN
Wt %0.013.05.0653.08<0.0050.002<0.0010.050.920.01
Table 2. Process parameters values of the cold-spray system.
ParameterValue
Carrier gasNitrogen
Pressure3 MPa
Temperature1000 °C
Nozzle standoff distance30 mm
Nozzle traversal speed35 mm/s
Table 3. Parameters setup.
Control FactorsSymbolFixed ParametersValue
Impingement angle [°]IaErodentAlumina
Erodent size [μm]EsCarrier gasDry compressed air
Erodent feed rate [g/min]EfrTest temperatureRT
Nozzle diameter [mm]6
Length of nozzle [mm]210
Nozzle inlet pressure [MPa]0.3
Table 4. Process variables’ levels used in the planned experimentation.
Process VariablesLevels
Impingement angle (Ia) [°]30–60–90
Erodent size (Es) [μm]60–90–200
Erodent feed rate (Efr) [g/min]2–5
Table 5. Coating properties: IN718 retention in the final coating, porosity, and hardness.
CoatingIN718 Mass Fraction in the Feedstock (wt %)IN718 Mass Fraction in the Coating (wt %)Porosity (%)Hardness (HV 0.3)
50% IN718—50% Ni50300.84243
Table 6. Arrangement of the general full factorial design (GFFD) for the three independent variables and experimental values of the Erosion rate.
Run OrderIa [°]Es [μm]Efr [g/min]Erosion Rate E [mg/min]
16060551.95
23060245.17
390200544.47
430200550.69
530905111.59
6909056.90
7609053.77
890200219.40
93090237.16
1030200233.12
11606023.40
12906023.49
1360200222.21
14609023.67
15909022.74
169060516.83
1760200554.97
183060586.55
Table 7. Analysis of variance (ANOVA) for Erosion rate [mg/min], with indication of the source of variation, degrees of freedom (DF), Adjusted sum of squares (Adj SS), F-value, and p-value [35].
SourceDFAdj SSF-Valuep-Value
Erodent feed rate [g/min]13679.610.090.034
Erodent size [μm]2306.60.420.683
Impingement angle [°]26976.69.570.030
Erodent feed rate [g/min] * Erodent size [μm]277.30.110.902
Erodent feed rate [g/min] * Impingement angle [°]2691.80.950.460
Erodent size [μm] * Impingement angle [°]42925.12.010.258
Error41458.5
Total1716115.5
Table 8. Analysis of variance (ANOVA) after the stepwise regression for the Erosion rate [mg/min], with an indication of the source of variation, degrees of freedom (DF), Adjusted Sum of Squares (Adj SS), F-value, and p-value [35].
SourceDFAdj SSF-valuep-value
Erodent feed rate [g/min]1368014.520.003
Impingement angle [°]2697713.760.001
Erodent size [μm] * Impingement angle [°]429252.890.079
Error102534--
Total1716116--
Table 9. The regression model coefficients as obtained by Equation (2).
CoefficientEstimate
c0 [mg/min]5.70 × 101
c1 [mg/g]6.42 × 100
c2 [mg/(min·°)]–7.43 × 10–1
c3 [mg/(min·μm·°)]1.66 × 10–5
Table 10. Process variables setup (minimum Erosion rate), predicted response value, and experimental value.
Control FactorsResponse Predicted and Experimental Value
Erodent Feed Rate [g/min]Erodent Size [μm]Impingement Angle [°]Response Value
Erosion Rate [mg/min]
Experimental Value
Erosion Rate [mg/min]
Deviation
[%]
260903.083.317.47

