Article

Texture Evaluation of Automotive Coatings by Means of a Gonio-Hyperspectral Imaging System Based on Light-Emitting Diodes

by
Francisco J. Burgos-Fernández
1,*,
Jaume Pujol
1,
Esther Perales
2,
Francisco M. Martínez-Verdú
3 and
Meritxell Vilaseca
1
1
Centre for Sensors, Instruments and Systems Development, Universitat Politècnica de Catalunya, Rambla de Sant Nebridi 10, 08222 Terrassa, Spain
2
Department of Optics, Pharmacology and Anatomy, University of Alicante, San Vicente del Raspeig Road, 03690 San Vicente del Raspeig, Spain
3
Global Innovation Center, Axalta Coating Systems, 1050 Constitution Avenue, Philadelphia, PA 19112, USA
*
Author to whom correspondence should be addressed.
Coatings 2020, 10(4), 320; https://doi.org/10.3390/coatings10040320
Submission received: 28 February 2020 / Revised: 19 March 2020 / Accepted: 26 March 2020 / Published: 27 March 2020
(This article belongs to the Special Issue Visual Appearance of Transportation Coatings)

Abstract

:
Sparkle and graininess are textural effects that appear as intrinsic spatial features of coatings containing goniochromatic pigments, whereas others such as mottling are undesired outcomes. In this study, we present new methods for the evaluation of sparkle, graininess and mottling of automotive coatings through images acquired with a novel gonio-hyperspectral imaging system based on light-emitting diodes with extended spectral sensitivity beyond the visible range (368–1309 nm). A novel analysis of sparkle that considered the amount of sparkling spots was used. Graininess was quantified through a novel statistical descriptor based on the energy descriptor computed from the histogram. A new index was proposed for an enhanced detection of mottling based on the analysis of striping, which was better observed and quantified in the infrared range. Spectral assessments showed a strong relationship with color and spectral reflectance for graininess and mottling. In conclusion, the results showed that these new spatial and spectral methods are a suitable, alternative and potential approach for the assessment of these textural features.

1. Introduction

The appearance of objects has become more complex with the emergence of special effect pigments. The automotive sector has been responsible for the huge production and evolution of these pigments due to the need to constantly launch vehicles with impressive innovations. An example of this can be found in the use of vivid car finishes using these special effect pigments, which produce a dynamic appearance, far different from the solid finishes obtained with traditional solid coatings.
Gloss and color are already insufficient to accurately describe the texture of a surface [1,2]. According to image processing, texture is defined as the variation of gray tones and the spatial distribution of them over an area [3,4]. An example of this can be found in pigments known as goniochromatic, gonioapparent or effect pigments that show appearance variations as a function of the illumination and observation angles. They are classified into pearlescent pigments, which mainly exhibit hue and chroma shifts, and metallic pigments, which show lightness variations. Moreover, the goniochromatic particles inside the pigment can generate specific spatial distributions that create additional optical effects dependent also upon the angular configuration [5,6].
Sparkle causes a material to seem to emit bright, minuscule spots of light strikingly brighter than their immediate surroundings under direct illumination and more evident when at least one of the contributors (observer, specimen or light source) is moved (Figure 1a). Sparkle is also conditioned by the intensity (sparkle-intensity) and area (sparkle-area) of the bright spots. The illuminated portion of an object surface with spots that are strikingly brighter than their immediate surrounding is the sparkle-area, while the contrast between the appearance highlights on the particles of a gonio-apparent pigment and their immediate surroundings is the sparkle-intensity [2,7]. Furthermore, sparkle is also determined by the reflectivity, size, orientation and density of goniochromatic particles [1,2,8,9,10]. Although some authors follow other approaches [11,12], one of the first expressions commonly used for the assessment of the sparkle grade (SG) was determined as the geometric mean of sparkle-intensity (IS) and sparkle-area (AS) for each measurement geometry as follows [2]:
S G = I S A S
Graininess, also called texture coarseness, is the contrast of the light/dark irregular pattern exhibited when the same type of sample is exposed to diffuse illumination, with a pattern scale typically <100 μm (Figure 1b) [7]. The conditions at which graininess is revealed are diffuse illumination and close observation distance. Graininess is independent of the observation angle, since it is only perceived at distances close to the coating’s surface. The physical factors that contribute to graininess are the type, size, disorientation and agglomeration of gonioapparent particles [2,8,13]. While there is no consensus regarding the analysis of graininess, some authors have proposed the use of radiometry and the combination of various parameters such as pigment concentration, scattering, absorption and lightness for this purpose [13,14,15].
The mottling effect is scarcely reported in the literature. It is described as cloudiness or local perturbations on the surface of a paint coating (Figure 1c). This phenomenon is mainly produced by thickness variations of the base coat and conglomeration of particles when the coating is not properly applied. Mottling perception also depends on direct illumination, observation angle, measurement distance and size of perturbations, and it is especially noticeable in large panels and on light metallic finishes. A specific condition of mottling is striping, manifested as a banding impression through the coating [2,16]. Some authors have evaluated this effect in other fields, such as the printing industry [17], through the quantification of the spatial variations computed from the color coordinates in the CIELAB color space [18] from an RGB image and the power spectra weighted by means of the contrast sensitivity functions of the human eye.
The broad range of optical effects supplied by these pigments has attracted the interest of the plastics [19,20], cosmetics [21], ceramics [22,23], textiles [24,25], printing inks [26,27,28], paper and board [29,30] and paints and coatings [31,32,33,34] industries, the latter showing a constant growth in the automotive sector. This increasing demand requires the characterization of these novel pigments by means of new instruments, since the accuracy provided by the single measurement geometry of traditional spectrometers is considered insufficient. As a result, all large companies involved in color measurement (Datacolor, Konica Minolta, GretagMacbeth, X-Rite, BYK Additives & Instruments and Hunterlab) have launched desktop or portable gonio-spectrophotometers to perform spectral and colorimetric evaluations at different angular configurations. However, only one commercial instrument provides sparkle and graininess information: the BYK-mac® from BYK Additives & Instruments. BYK Additives & Instruments also developed the cloud-runner®, an optical scanner to quantify mottling.
Gonio-spectrophotometers perform precise evaluations, but are restricted to areas of just a few millimeters, which limits the assessment of materials with a non-uniform spatial distribution and angular-dependent appearance that changes all over the sample. In addition, these devices operate only in the visible (VIS) range of the electromagnetic spectrum (400 to 700 nm) and use exclusively broad-band light sources for the analysis of texture. Expanding the spectral range to the infrared (IR) range would result in a more accurate analysis of the goniochromatic particles located at deeper layers thanks to the higher penetration of this radiation and would contribute to quantify their influence on the total appearance of the pigment. Moreover, the use of narrow-band illumination would contribute to evaluating the spectral behavior of textural effects, which has not been widely studied.
In order to overcome the limitations of currently existing instruments, we propose the evaluation of sparkle, graininess and mottling by means of novel parameters extracted from a gonio-hyperspectral imaging system based on light-emitting diodes (LEDs) previously applied to the colorimetric and spectral evaluation of goniochromatic coatings [35]. This system can assess texture over a large area and from the ultraviolet (UV) to the IR range, thereby providing pixel-wise spectral information. Sparkle was assessed under directional light at three geometries and quantified by an algorithm based on the Weber’s contrast [36]. A single geometry and diffuse illumination were employed to evaluate graininess by means of statistical descriptors. Mottling was also analyzed under directional light and at three geometries different from those used in sparkle assessments; those being studied afterwards through image profile analysis.

2. Experimental Setup

While measurements of sparkle, graininess and mottling are as yet not regulated by any standards, the proposed setup followed those applied to multi-angle color measurements issued by the German Institute for Normalization (Deutsches Institut für Normung, DIN, Berlin, Germany) and the American Society for Testing Materials (ASTM, West Conshohocken, United States): DIN 6175-2, ASTM E2194-09 and ASTM E2539-08 [37,38,39]. This decision was made because these effects were analyzed through a device previously developed for spectral and colorimetric assessments (Figure 2) [35].
Essentially, this device (GOHYLED system, Centre for Sensors, Instruments and Systems Development – Universitat Politècnica de Catalunya, Terrassa, Spain) was composed of a spectrally tunable light source based on LEDs and two monochromatic cameras that covered the range from 368 to 1309 nm; and two rotation stages, one to control the observation and the other the illumination directions. Twenty-seven narrow-band LED clusters were employed for the spectral range described while one additional cluster including white LEDs was incorporated to analyze texture under a broad-band light source, as it is commonly measured; a motorized linear actuator sequentially positioned each LED cluster in front of the sample. One of the cameras was based on a Charge-Coupled Device (CCD) sensor with enhanced sensitivity in the UV range (200–1000 nm) and a size of 1392 × 1040 pixels; the other camera used an InGaAs sensor to work from 900 to 1650 nm with lower resolution, 320 × 256 pixels. In order to produce a uniform diffuse illumination for the evaluation of graininess, the lens that guided the light from the LEDs to the sample was removed and a 250 mm × 250 mm 220 Grit Ground Glass Diffuser from Edmund Optics (Barrington, United States) was used.
The aperture angle (2σ) is defined in the aforementioned standards as the angle subtended by the sensor or the light source with respect to the center of the sample. For the ASTM E2194 and ASTM E2539, it should be 2σ < 8° in any geometry. The aperture angle for the DIN 6175-2 varies depending on the measurement configuration: in a constant direction (fixed element) it should be 2σ ≤ 5°, and in the variable directions it should show values 2σ ≤ 4° for observation angles less than 0°, and 2σ ≤ 10° for those larger than 0°.
In order to conform to the standards, for sparkle evaluation the UV–VIS camera was positioned at 218.0 mm from the sample to achieve an aperture angle of 0.56°. The IR camera was placed closer, at 129.0 mm, with an aperture angle of 1.83°. With regard to the graininess assessments, the adjustments for the UV–VIS camera were preserved, whereas the IR camera was placed closer, at 88.2 mm from the sample, to compensate for the low spatial resolution. The aperture angle for this new configuration was 2.90°. A longer arm was used for the analysis of mottling because this effect is mainly visible from large distances. The UV–VIS camera was placed at 419.1 mm, thereby obtaining an aperture angle of 0.31°, while the IR camera was located at 164.7 mm with an aperture angle of 1.55°.
All these aperture angles satisfied the three standards, since they were lower than the minimum tolerance established by the DIN 6175-2 (4°). Although a measurement area or region of interest (ROI) of 50 mm × 37 mm was available for the UV–VIS camera, only a field of view of 23 mm × 23 mm was finally considered to match that of commercial systems available, i.e., the BYK-mac®, and conduct valid comparisons of the results; the ROI for the IR camera was kept at 23 mm × 23 mm for further comparison among spectral ranges. For mottling, a larger ROI was set at 92 mm × 68 mm to capture the effect as a whole.

3. Methods

3.1. Samples

A total of 25 pearlescent, 25 metallic and 25 solid samples of automotive coatings were selected to measure sparkle and graininess (AUDI AG, Ingolstadt, Germany; BASF SE, Ludwigshafen, Germany; and PPG Industries Inc., Pittsburgh, United States). A reduced set was used to evaluate mottling, including a light gray and a light blue metallic sample with striping, in addition to two pearlescent, two metallic and two solid samples without this effect. Each of the last subsets contained a light blue and a light gray sample for a more accurate comparison. All samples consisted of 90 mm × 150 mm or 100 mm × 200 mm plates.

3.2. Measurements Settings

The analysis of texture in goniochromatic pigments is not as well established as color evaluation, and thus, no standard exists in this case to define a set of geometries. In contrast, specific geometries are commonly used for sparkle, graininess and mottling analysis [2,8,16,40].
Sparkle geometries tend to be situated at illumination angles of 15°, 45° and 75° with respect to the normal to the sample, and the observation at 0° (−15°x: 0°, 45°x: 0° and 75°x: 0°; x: refers to directional illumination) [2,16,40]. These three angles imitate the effect of solar radiation under a cloudless sky.
In contrast, analysis of graininess presents few restrictions, since the angle of observation is not critical due to the closeness to the sample and the use of diffuse illumination [2,8,16]. However, the distance to the sample is subject to the imaging system to ensure a proper capture of this effect. Consequently, the diffuser was placed as far as possible from the light source (393.0 mm) to increase its diffusing effect; the d:12.5° geometry was found to produce the most uniform illumination over the sample.
Since mottling appears under direct illumination at different angular configurations, the geometries selected were 15°x: 0°, 15°x: 30° and 15°x: 45°.
All samples were measured with the GOHYLED system and the BYK-mac® for further comparisons. At this stage of the study, this gonio-spectrophotometer was chosen as a reference because it has become one of the standards in the automotive industry for spectral, colorimetric, sparkle and graininess quantification. Since the BYK-mac® works in the VIS, only the results obtained in this range were compared. The input data for all the assessments were reflectance images as in reference [35].

3.3. Sparkle Quantificacion

A sparkle index was developed in this work based on the geometric mean, like that of Equation (1), and computed from the acquired images. Firstly, an intensity threshold was established to detect the bright pixels. The thresholding algorithm was based on the triangle method proposed by Zack et al. [41], particularly effective on skewed histograms. Next, a new image was created for the analysis of the sparkle-area, AS, and the sparkle-intensity, IS. The sparkle-area was estimated by means of a binary image that only considered the sparkling regions above the intensity threshold with dimensions of 4 by 20 pixels and a connectivity of 4 chosen according to experimental evaluations. Afterwards, this image was used for the estimation of sparkle-intensity. The AS index was calculated as the mean area of these regions.
With regard to sparkle-intensity IS, it was derived from the Weber’s contrast [36], which describes the contrast between bright spots and their surroundings. However, the indices used in this study replaced the luminance by reflectance values, r, with the purpose of expanding these evaluations beyond the VIS range and for spectral assessments:
I S = r s r b r b .
In accordance with the previous threshold, the image reflectance values were divided into two categories (bright spots and background) and respectively averaged. The parameters rs accounted for the mean reflectance value of the bright spots, while rb referred to the mean reflectance value of the background.
Next, the sparkle-area and sparkle-intensity indices were combined to obtain a unique sparkle grade, SG. In order to weight this parameter by the number of sparkling spots, a quantification factor, QS, was added to Equation (1), as shown in Equation (3). It represents the ratio between the amount of bright pixels and the total amount of pixels of the image.
S G = Q S I S A S

3.4. Graininess Quantificacion

First order statistical descriptors were used in this study as metrics for graininess determination. In fact, first and second order descriptors, which extract information from the histogram and the image itself, have already been proposed to evaluate the spatial distribution of an image and previously applied to aerial and satellite images [42,43], images of the human iris [44] and images of sand paper [45].
Statistical moments such as the mean, standard deviation and third central moment provide information about the average intensity and contrast, and the skewness of the histogram, respectively [43,44,46]. However, this information did not describe precisely enough, the graininess effect. Therefore, other textural descriptors computed from of the image histogram were employed, such as the energy, En. It is a numerical descriptor of the image uniformity that ranges between 0 and 1, reaching the maximum value for a constant image [43,44,46] and is computed as follows:
E n = i = 0 N 1 P ( i ) 2 ,
where P(i) is the value (frequency) of the intensity element i (bin) of the histogram and N is the number of levels that the histogram is divided into.

3.5. Mottling Quantificacion

The macroscopic features of mottling required a different interpretation, since statistical descriptors are specifically suitable for textural effects of microscopic size. This new index focuses on the analysis of striping, a type of mottling that presents a banding impression over the coating (Figure 3a).
This approach considered the profile of three equidistant rows perpendicular to the stripes present in the reflectance images (Figure 3a). They were averaged and smoothed to generate one single profile representing the striping effect of the whole image and to remove the sparkle peaks. Next, a linear fitting was applied to the smoothed profile and the resulting fitted curve was then subtracted. As a result of their lower reflectance, the stripes became more evident (Figure 3b). Finally, the mottling-striping index, MSt, was computed as the difference of the maximum and minimum values of the subtraction profile DSt and multiplied by 50 to obtain values within the same scale as sparkle and graininess.
M S t = 50 [ max ( D S t ) min ( D S t ) ] .

4. Results and Discussion

The evaluation of sparkle and graininess with the new indices computed from the images acquired with the GOHYLED system was divided into two stages. Firstly, their performance was assessed considering only the images acquired under white light, since this is the commonly used approach; at the same time, these results were compared to those given by the gonio-spectrophotometer BYK-mac®. For this purpose, statistical analysis was performed using IBM SPSS® v25.0 software (IBM Corp.). To determine the correlation between the measurements of the two instruments, bivariate correlations were carried out and quantified using Pearson’s (r) or Spearman (ρ) coefficients for parametric or nonparametric variables, respectively. Bland and Altman analysis [47] was also used to analyze agreement between measurements. This method studies the degree of agreement between two sets of data by plotting the mean difference and the corresponding 95% confidence limits (CL), defined as 1.96 times the standard deviation of the mean difference, within which 95% of the differences measurements are expected to lie. Secondly, the proposed textural indices were implemented into the different spectral channels in the VIS and IR range. Mottling was also firstly analyzed considering the results for the white LED cluster, and afterwards, spectrally.

4.1. General Assessment of Sparkle

This section shows the sparkle results of area, intensity and total sparkle indices. Other approaches for quantifying sparkle apart from those previously explained, such as local contrast for sparkle-intensity, were also implemented although with less accurate results, and therefore, they are not shown here.
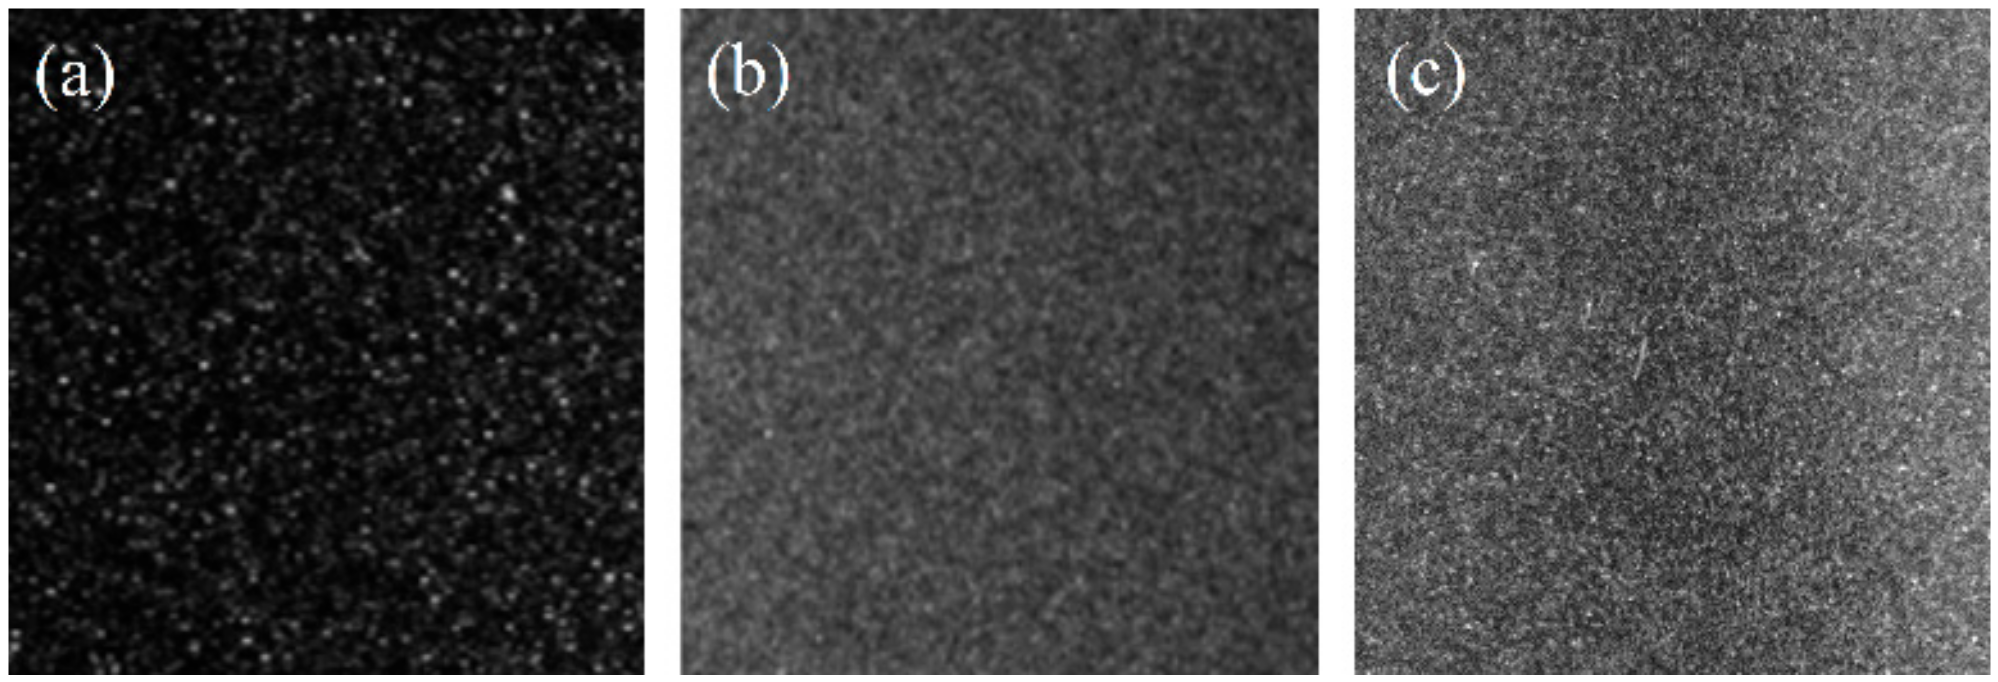
As an example, Figure 4 shows images acquired at the −15°x: 0° geometry of representative individual samples, one for each of the three types of pigments analyzed, when illuminated with the white LED cluster. Sparkle is clearly revealed for the pearlescent (Figure 4a) and metallic (Figure 4b) samples, with values of 0.052 and 0.137, respectively. On the contrary, the solid sample (Figure 4c) reaches a sparkle grade of almost zero (0.002) due to the lack of goniochromatic pigments. The range of sparkle grades measured for the entire sample set covered from 0 to 0.140, being minimal for solid samples.
The statistical comparison performed between sparkle parameters of the GOHYLED system and the BYK-mac® is summarized in Table 1. The correlation analysis provided good results for those geometries closer to the specular reflection (−15°x: 0° and 45°x: 0°) with correlation coefficients above 0.870 and very similar outcomes for the sparkle grade (>0.930); all correlations found were statistically significant (p < 0.001). The 75°x: 0° configuration produced the results that differed the most from those provided by the BYK-mac®. As aforementioned, the settings for textural effects measurement with the GOHYLED system were adjusted according to the standards for multi-angle color measurements, and this, together with the mechanical and optical features of the device, led to a large illumination distance (≈600 mm). This fact caused less reflected light to reach the camera at the geometry further away from the specular reflection, and hence, the sparkle grades at this geometry were more sensitive to show larger differences when compared to the BYK-mac®.
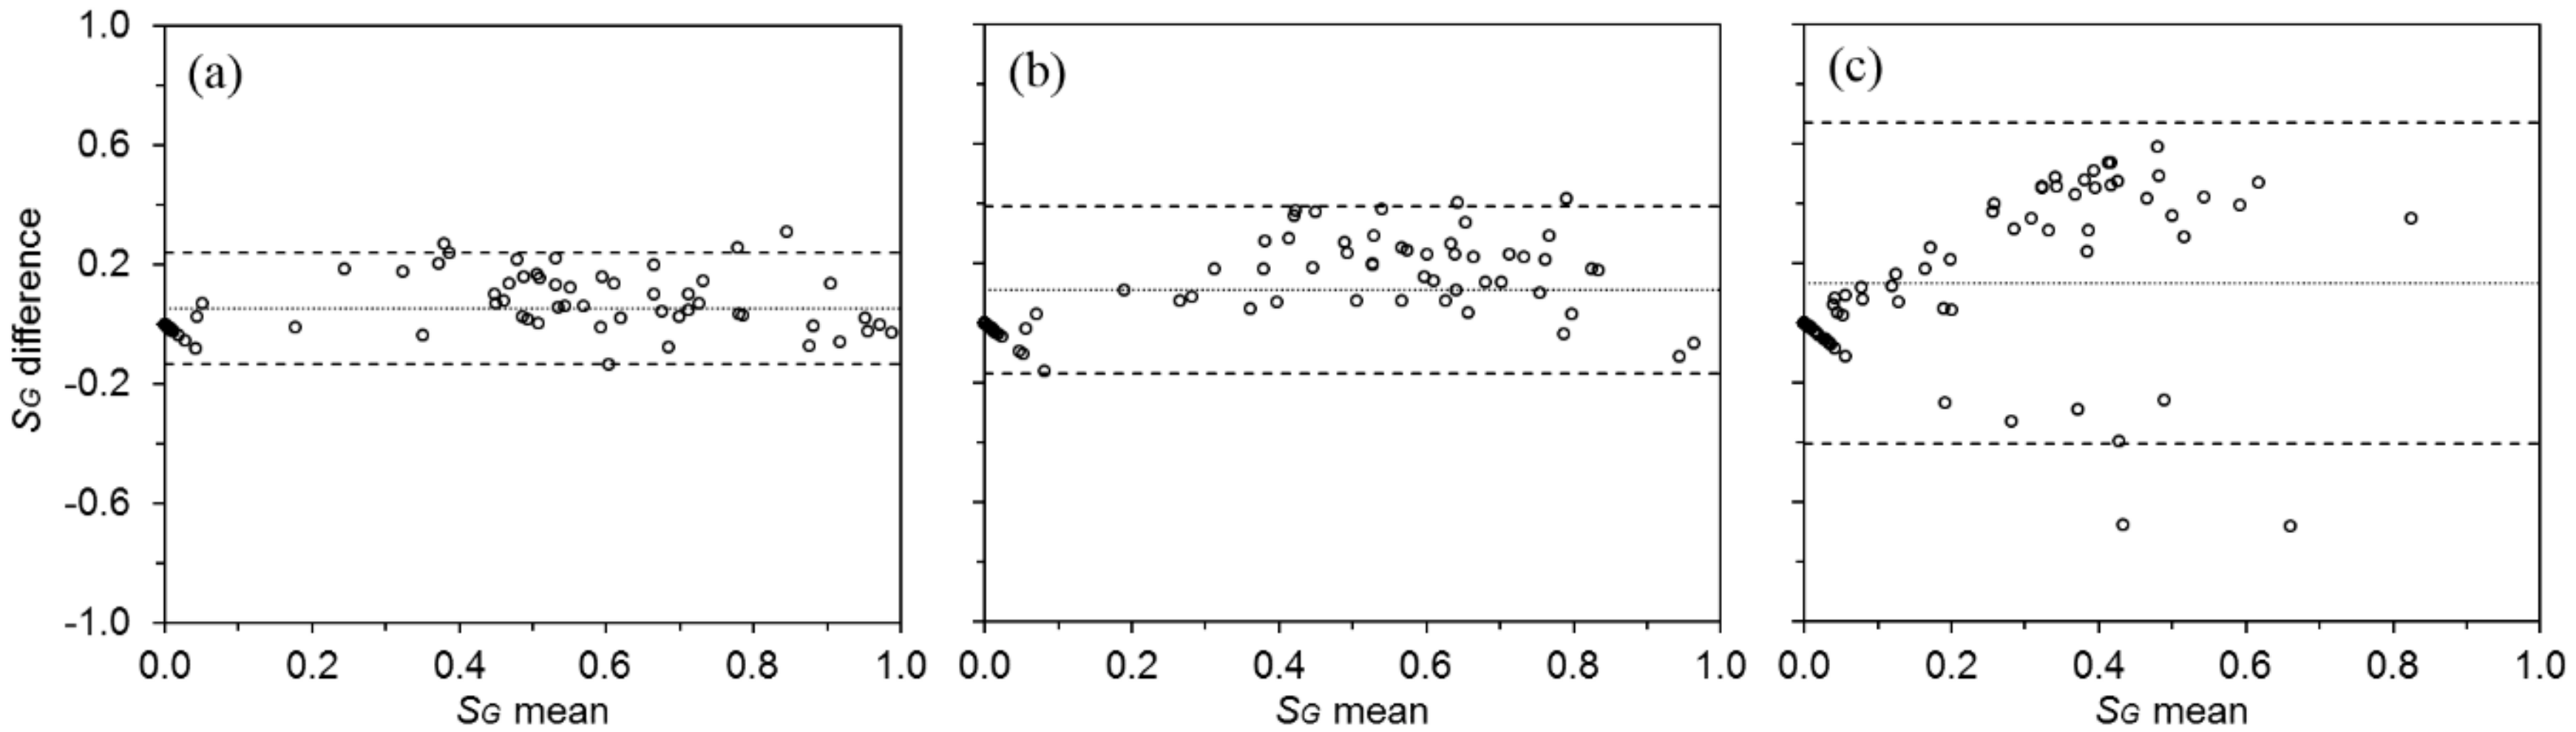
The degree of agreement between the two instruments was assessed by means of the Bland and Altman method to gather more information that proved or rejected the similarity of the sparkle grades provided by the two devices (Table 1 and Figure 5). The mean of the differences for the three sparkle parameters was closer to zero for the two geometries next to the specular reflection, which confirmed the behavior previously observed; the 95% CLs were also smaller for these configurations, encompassing most of the values in a very narrow region. Again, it is remarkable that the geometry further away from the specular reflection is that including more outliers due to the darker images available in this geometry, and thus, worse signal-to-noise ratio. This especially occurred for very dark coatings, as can be observed in Figure 5c, wherein two samples fall out of the lower CL. To increase the signal captured by the camera, a more powerful light source and/or a more sensitive camera should be used. It is also noticeable that the mean sparkle grade (SG mean) for solid samples is almost zero in all plots, since they do not contain goniochromatic pigments.

4.2. Spectral Assessment of Sparkle

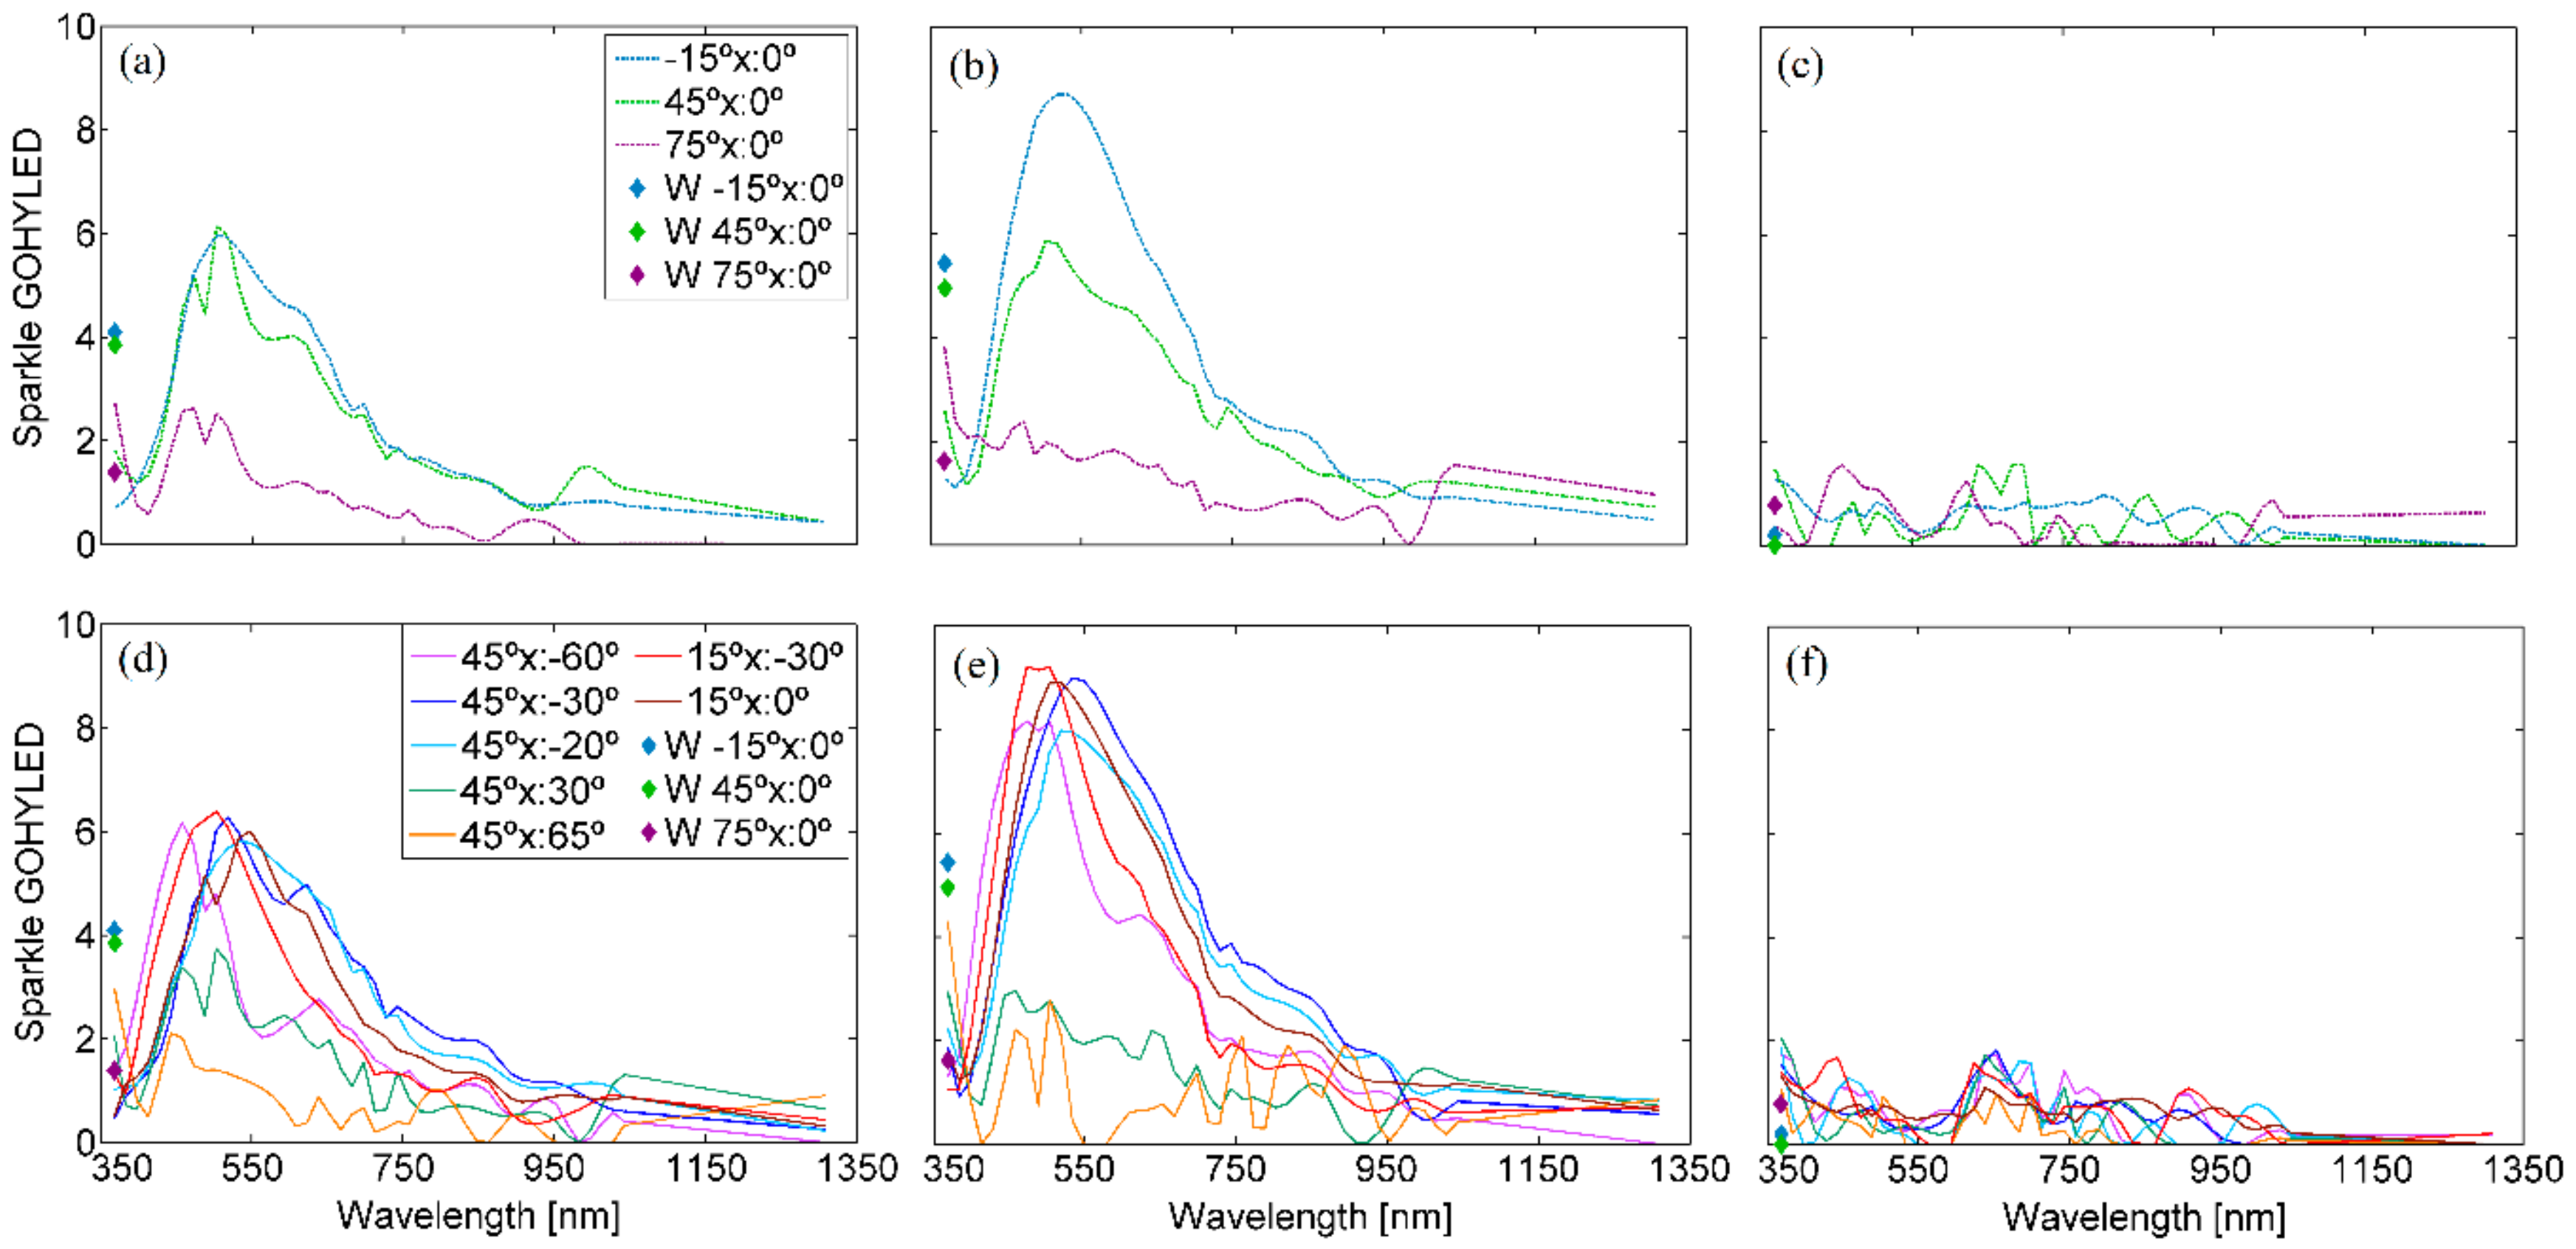
Additionally, the sparkle grade of the GOHYLED system was tested throughout the whole spectral range (368–1309 nm) at the three sparkle geometries (−15°x: 0°, 45°x: 0° and 75°x: 0°) and at the geometries for spectral and colorimetric analysis (45°x: −60°, 45°x: −30°, 45°x: −20°, 45°x: 30°, 45°x: 65°, 15°x: −30° and 15°x:0°) [37,38,39]. Figure 6 illustrates the spectral performance of the GOHYLED sparkle grade for blue pearlescent, gray metallic and green solid samples.
As it can be seen, the highest sparkle values were found between 450 and 600 nm for pearlescent and metallic samples, the values being larger than those obtained under white light. Spectral shifts only arose in this range at geometries for spectral and colorimetric analysis with the same aspecular angle (Figure 6d,e), which is the angle between the specular reflection and the observation direction (45°x: −60° and 45°x: −30°, and 15°x: −30° and 15°x: 0°). From 750 to 1309 nm, the sparkle grades decreased substantially for all samples and no additional significant information was obtained. Accordingly, the most relevant spectral range for sparkle evaluation spans from 450 to 600 nm.
The geometries of −15°x: 0° and 45°x: 0° produced similar spectra for some samples (e.g., Figure 6a), which could be explained by the orientations of the goniochromatic particles. That is, at random orientations, different geometries can cause similar amounts and distributions of reflected light.
Additionally, it was observed that the color of the sample did not determine the spectral sparkle; i.e., blue and gray paints originated spectra with similar peak wavelengths even with different sparkle grades. Indeed, while the color of these coatings is mainly provided by the substrate, the sparkle is entirely caused by the goniochromatic particles. On the other hand, solid samples exhibited very low values for all wavelengths and geometries (Figure 6c), with sparkle grades slightly above zero due to coating impurities and scratches.

4.3. General Assessment of Graininess

As described, graininess was quantified by means of the energy (En) statistical descriptor computed from the histogram. Although other descriptors were also tested, such as the mean, standard deviation, skewness and entropy; 
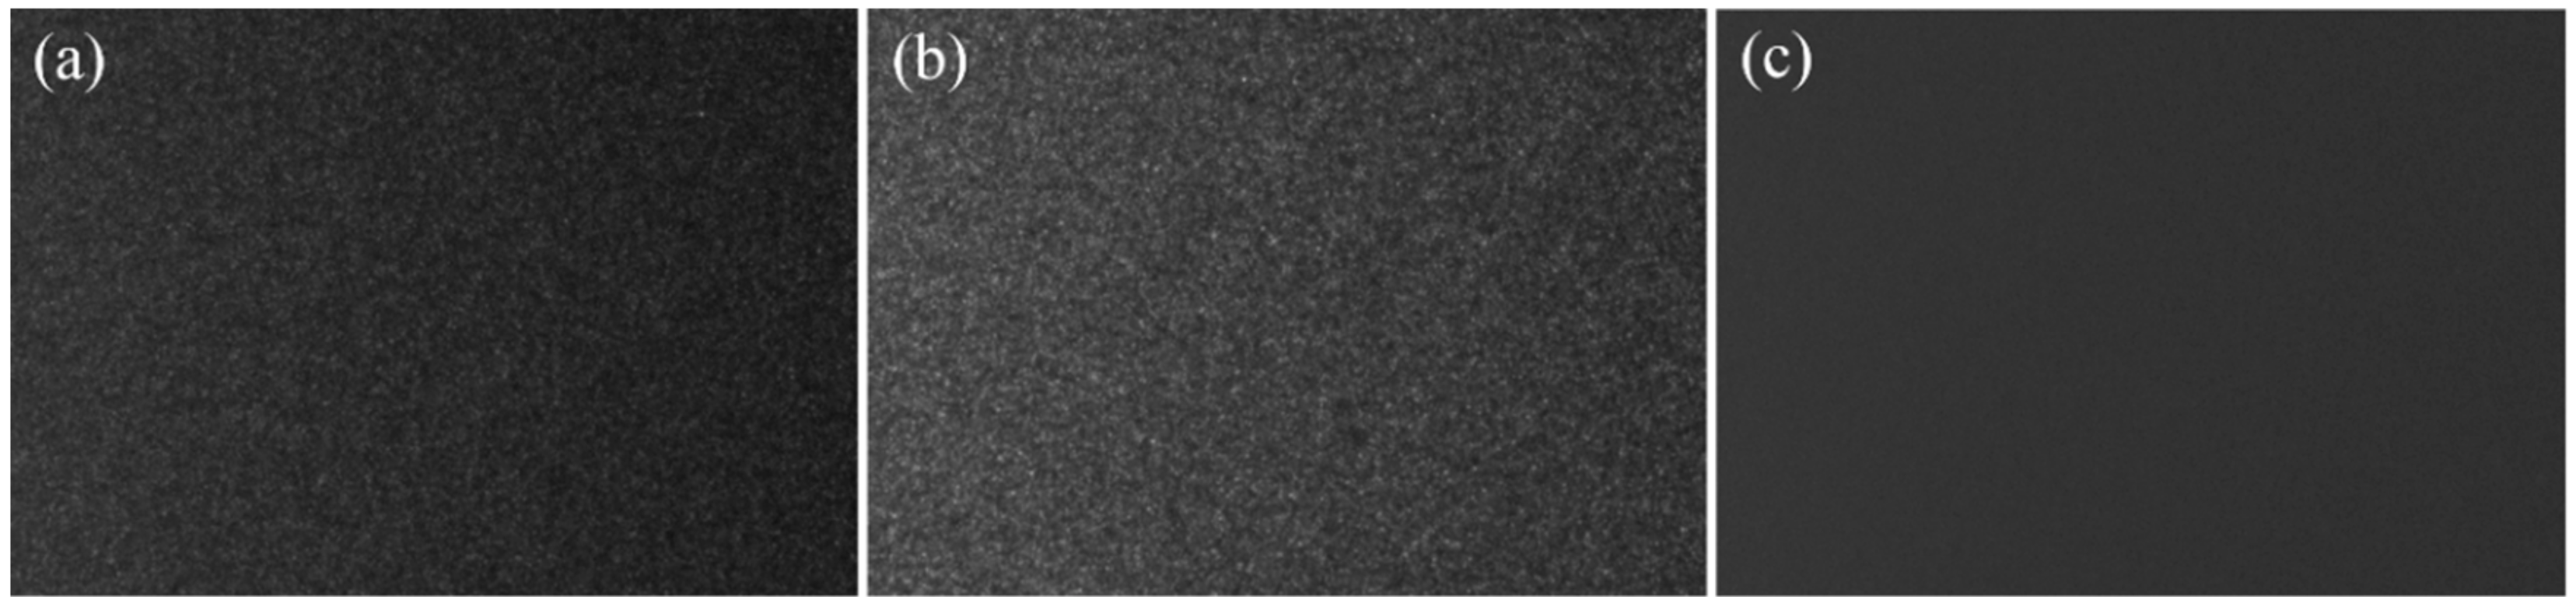
En provided the most reliable results. It was computed from images such as those in Figure 7, where a grainy pattern can be observed for both the pearlescent and metallic samples, whereas the solid one is completely uniform. These images are shown as examples and extracted from representative individual samples, one for each type of pigment, when illuminated with the white LED cluster.
The En descriptor reached the highest values for surfaces with a very homogeneous distribution, which means very low graininess, and therefore, an opposite relationship between both parameters. In order to avoid this effect and for a better comparison, 1-En was computed and a linear transformation was finally applied to generate values within the range of the BYK-mac®. By doing so, the pearlescent, metallic and solid samples in Figure 7 reached graininess values of 4.56, 6.47 and 2.06, respectively. The whole set of samples exhibited graininess values from 0.11 to 6.74.
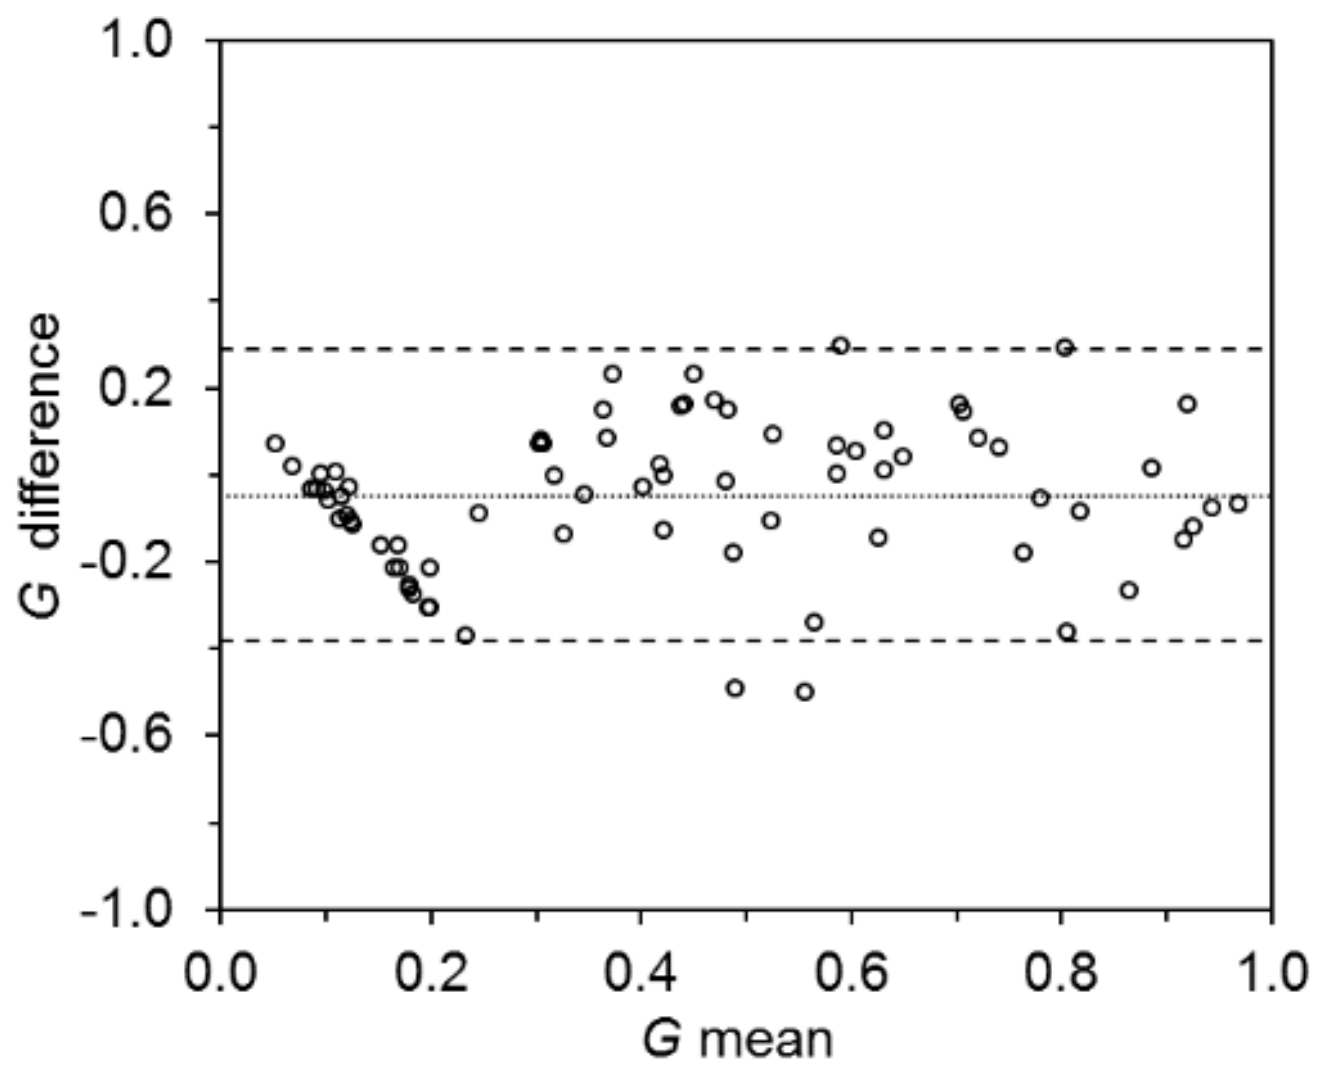
The quantification of graininess by the GOHYLED system compared to the BYK-mac® led to a Pearson’s correlation coefficient of 0.820 (p < 0.001). The evaluation through the Bland and Altman method (Figure 8) led to a mean difference of −0.05, very close to zero, and narrow 95% CLs (−0.38, 0.29) with very few outliers, indicating good agreement between devices; these outliers were produced by a weak signal reaching the camera when measuring very dark coatings. Although the illumination is more uniform over the sample for graininess evaluations, the total amount of light decreases when compared with sparkle assessments close to the specular reflection. As mentioned in the general assessment of sparkle, this could be improved by increasing the signal-to-noise ratio of the system.

4.4. Spectral Assessment of Graininess

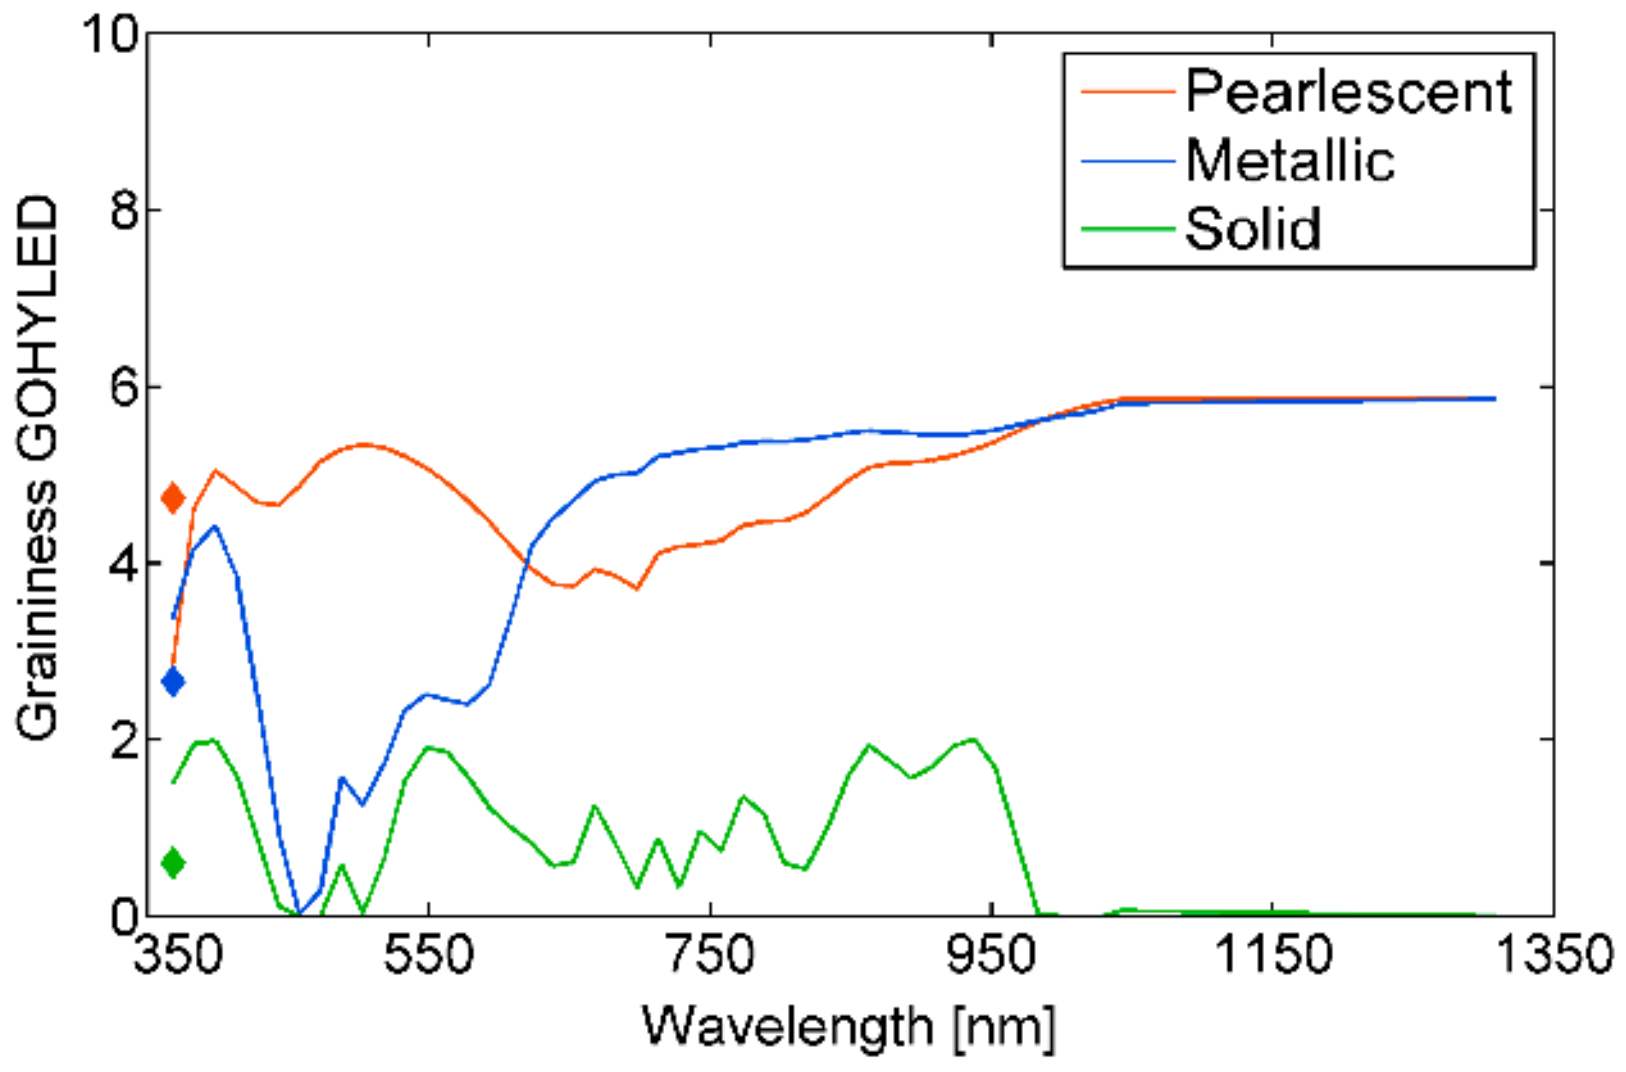
Similarly to sparkle, the graininess values obtained through the GOHYLED were spectrally characterized from 368 nm to 1309 nm. The relationship observed between spectral reflectance and graininess was stronger than for sparkle, indicating that, even if graininess is caused by goniochromatic particles, the influence of the substrate is more noticeable when sparkle is eliminated by the use of diffuse light. In this case, pearlescent and metallic samples (orange and blue lines in Figure 9, respectively) reached the highest graininess values for wavelengths with higher reflectance. The graininess peak found between 525 and 575 nm reached values close to those obtained with the white LED cluster (diamond markers in Figure 9). Another characteristic peak was observed in all samples between 380 and 430 nm. With regard to the IR, very small variations were detected above 850 nm among goniochromatic pigments, where a flat spectrum was found. On the other hand, lower values of graininess and more fluctuating spectra were found in solid pigments (i.e., green line in Figure 9). In general, the graininess peaks were located in the VIS range, while beyond 850 nm this effect decreased substantially, reaching values of zero for most solid samples. In other words, higher graininess values were found at wavelengths where the reflectance was also high. Additionally, no distinctive data were obtained for graininess in the IR range among the samples analyzed.

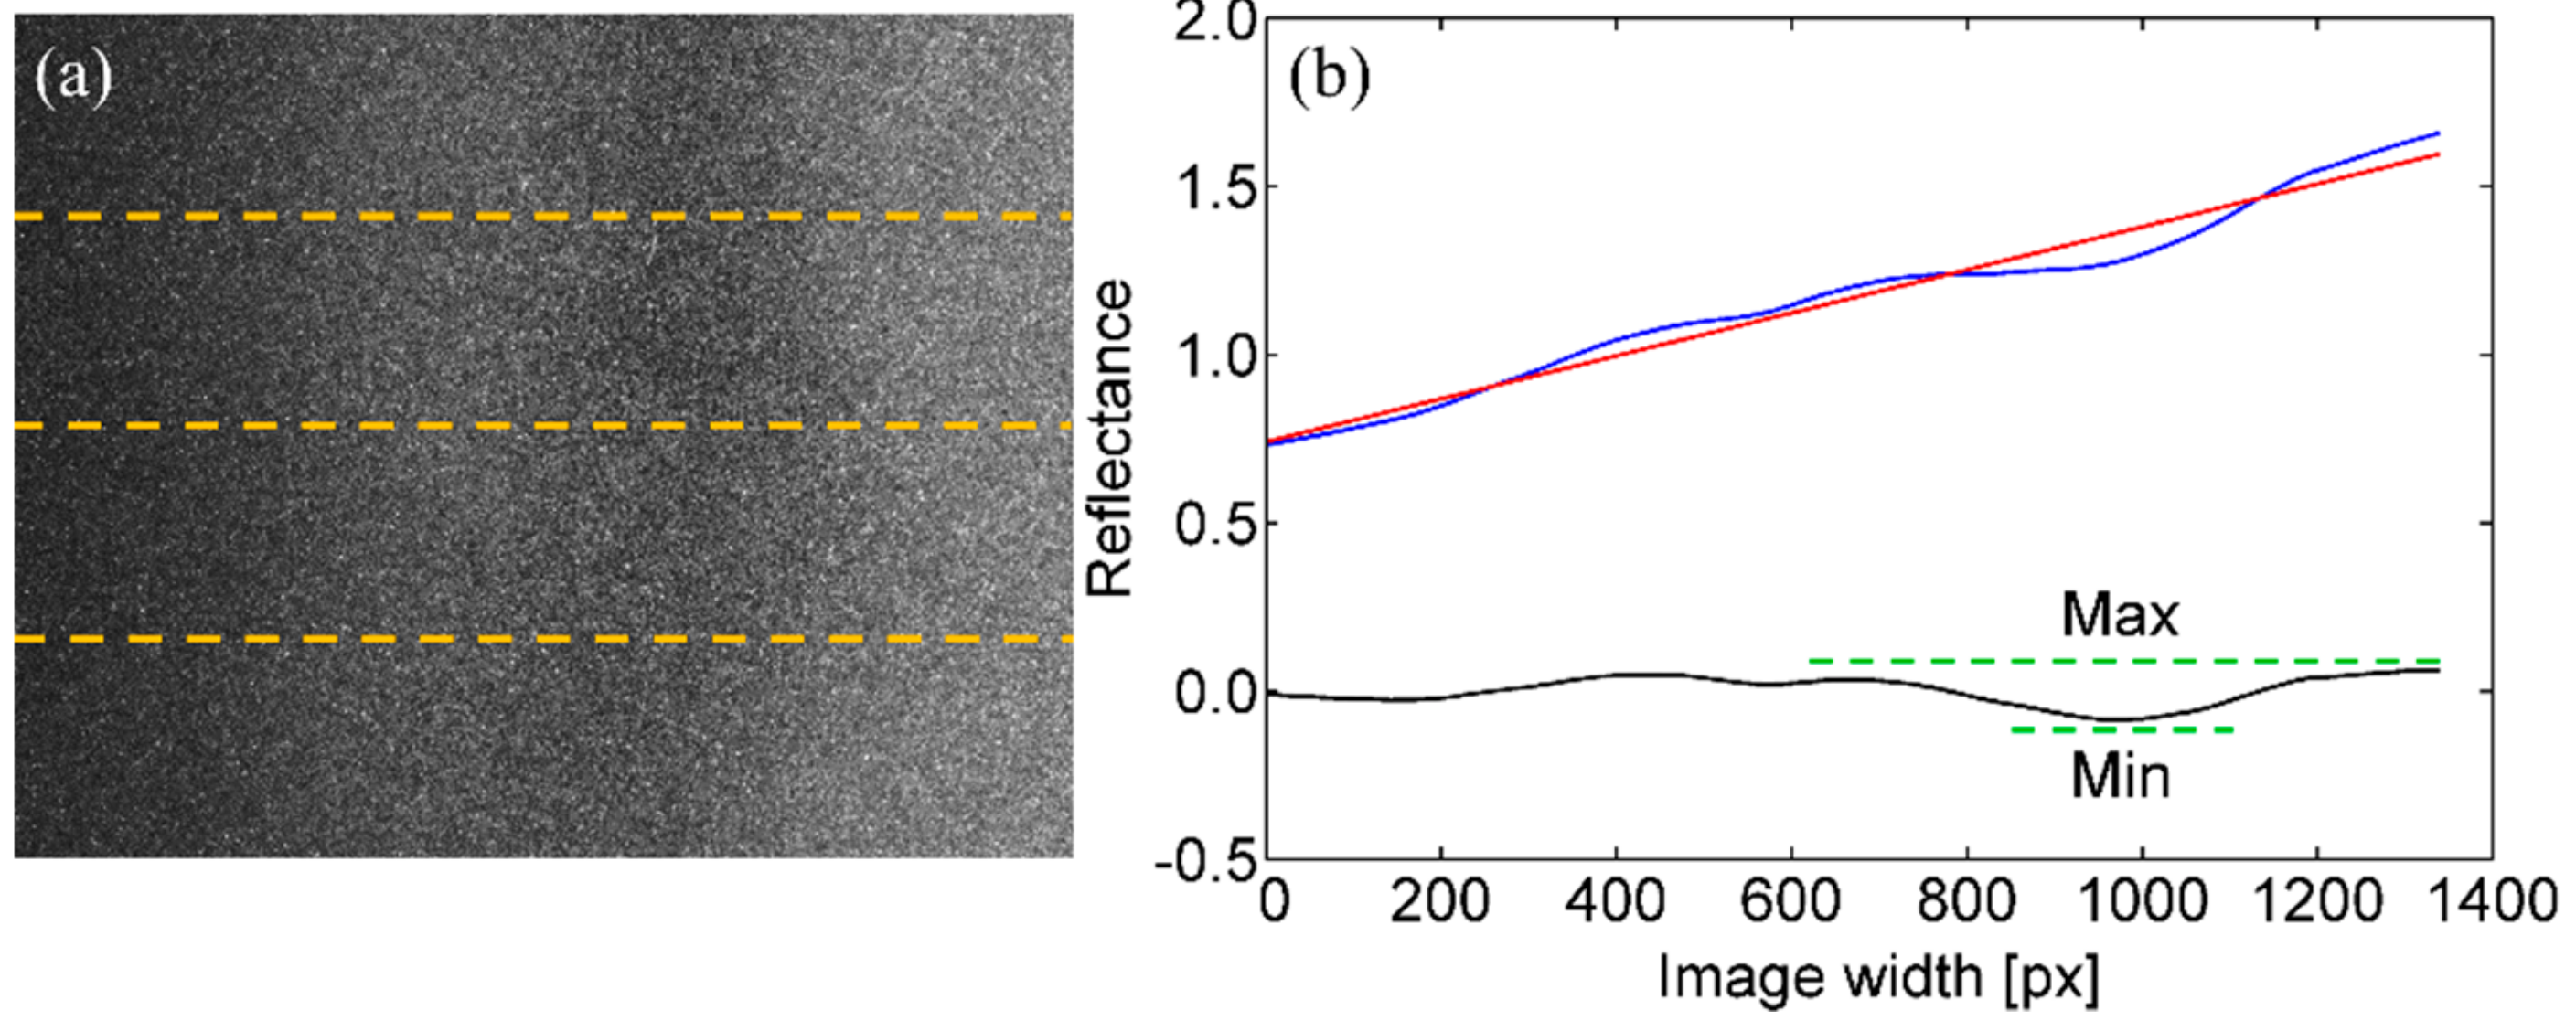
4.5. General Assessment of Mottling

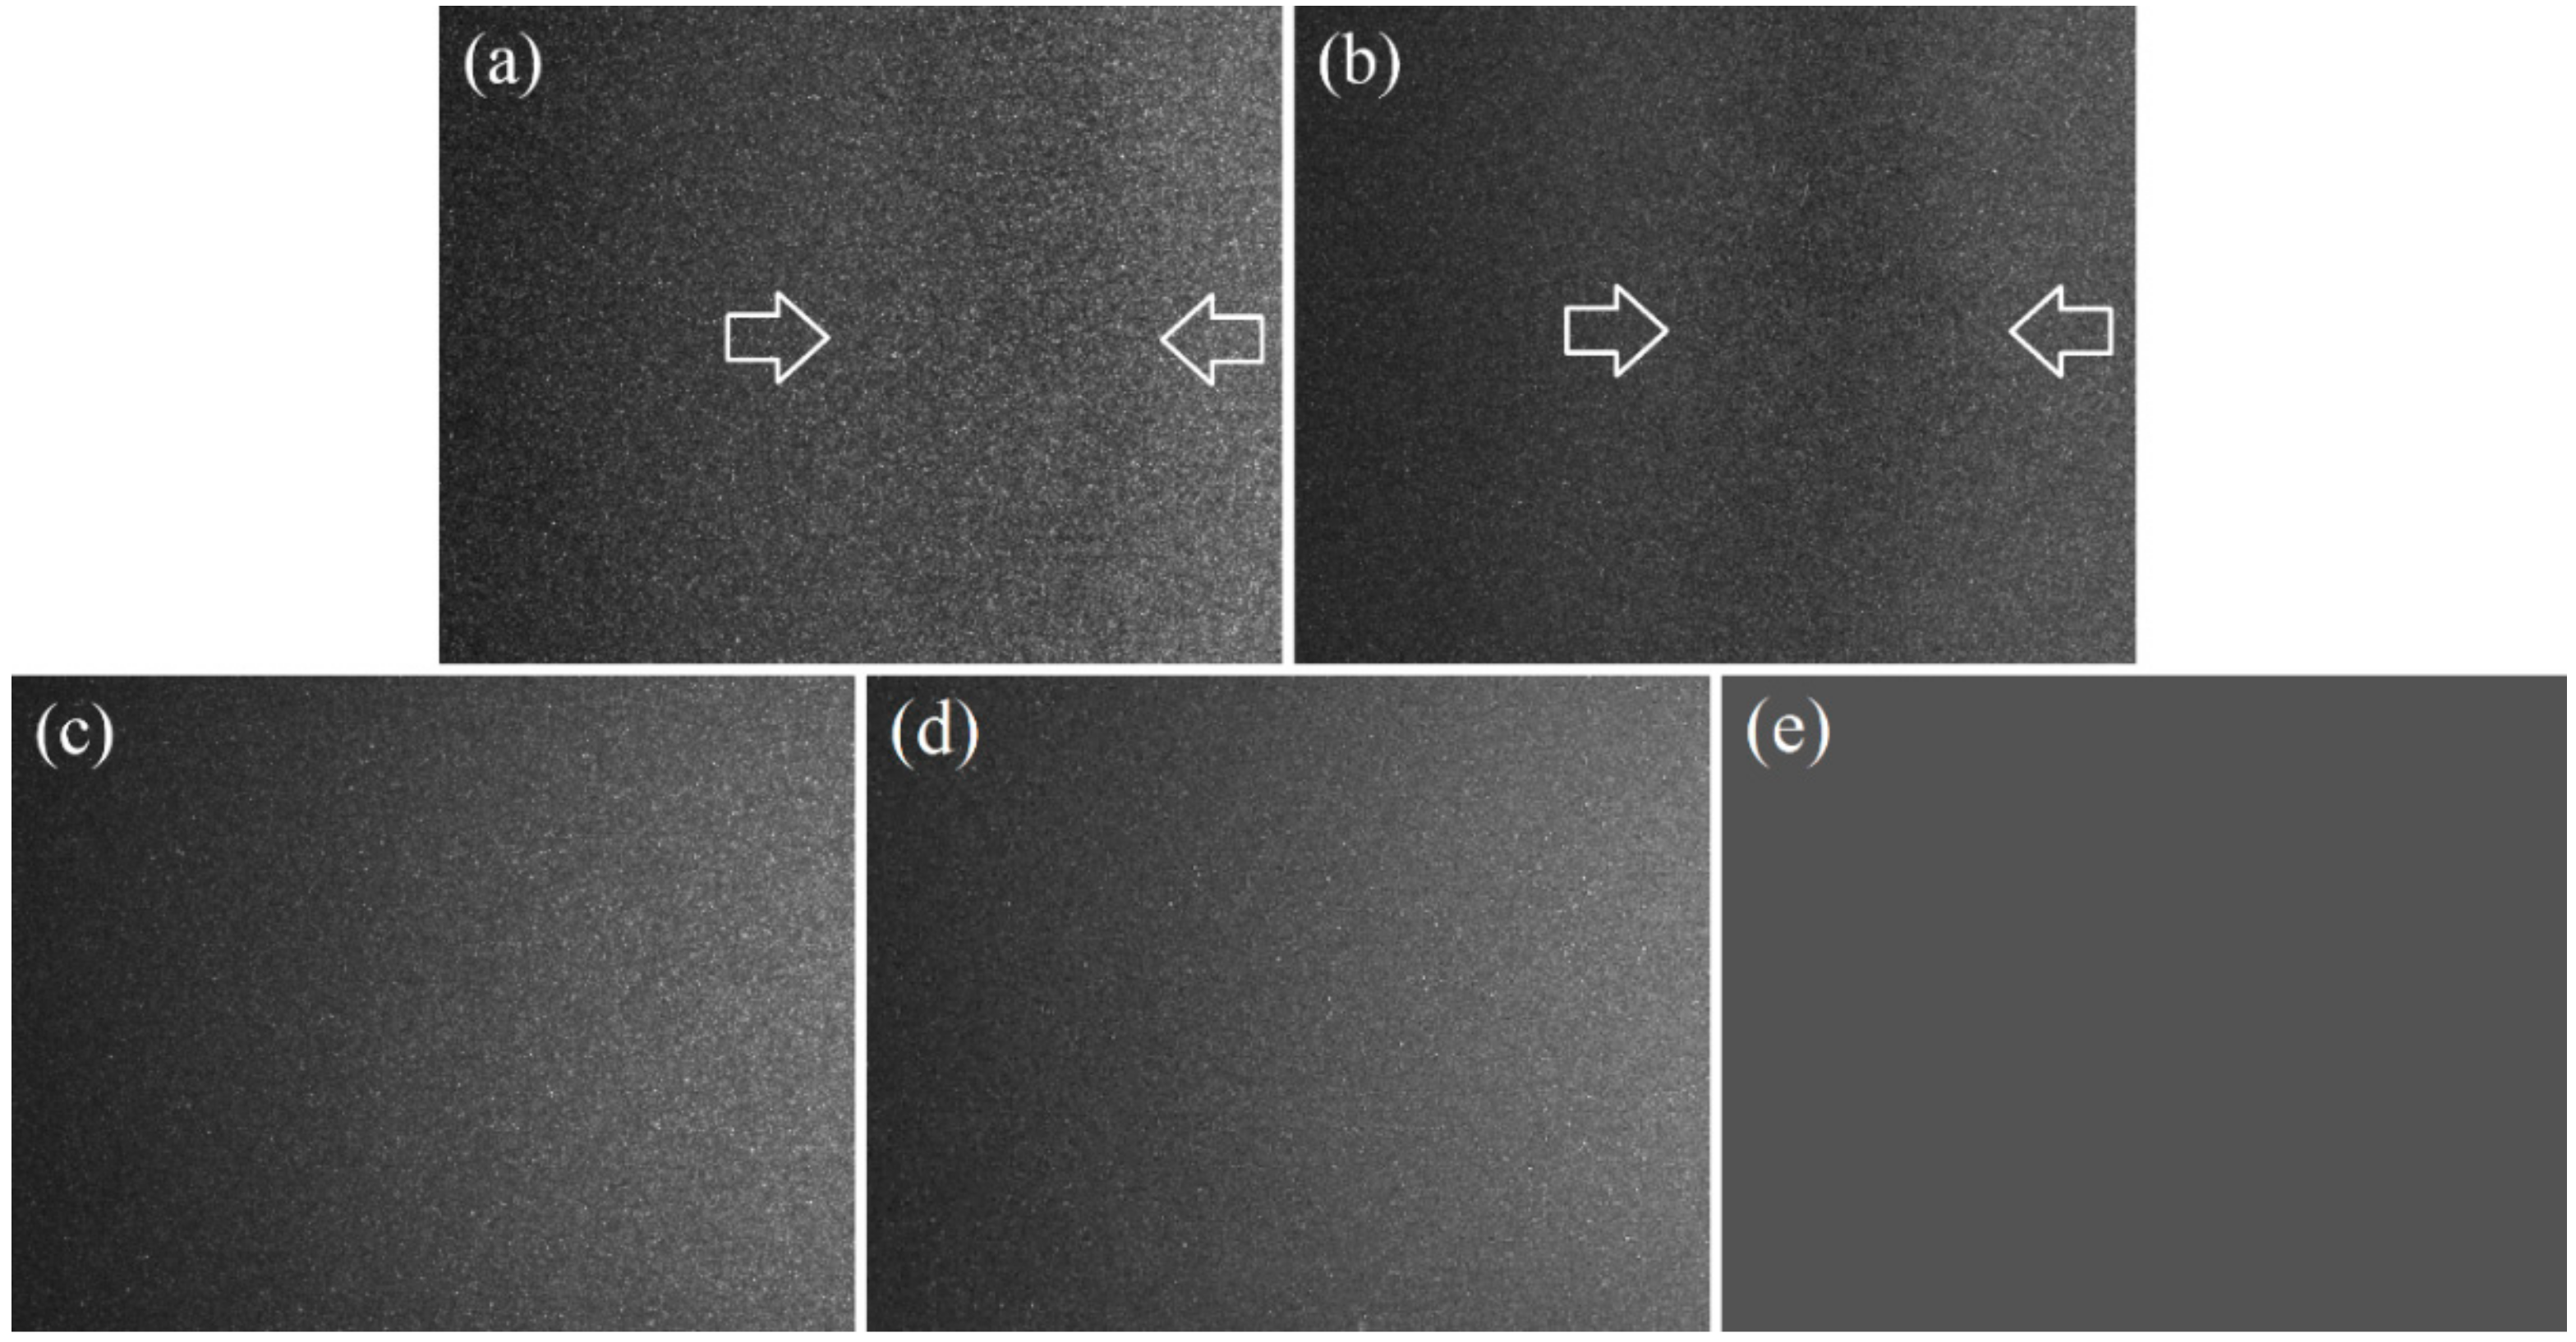
The evaluation of mottling was carried out by means of the novel MSt index proposed, extracted from the GOHYLED system. Images taken at the 15°x: 0° geometry of the two samples affected by this effect and three without are shown in Figure 10, all of them when being illuminated by the white LED cluster; white arrows point to the vertical stripes. As anticipated, the two samples with stripes reached the highest values of this index for all geometries, which are shown in Table 2. The strongest mottling-striping effect was found at 15°x: 0° because the acquisition took place closer to the specular reflection. The largest acquisition distance especially affected the geometries further away from the specular reflection (15°x: 30° and 15°x: 45°).
For the geometry 15°x: 0°, the samples with stripes reached values above 4, while the remaining samples were scored with lower values; at 15°x: 30°, the threshold was circa 0.5 and at 15°x: 45° approximately 0.2. These results suggested that the methodology proposed is relevant for the evaluation of mottling and striping.

4.6. Spectral Assessment of Mottling

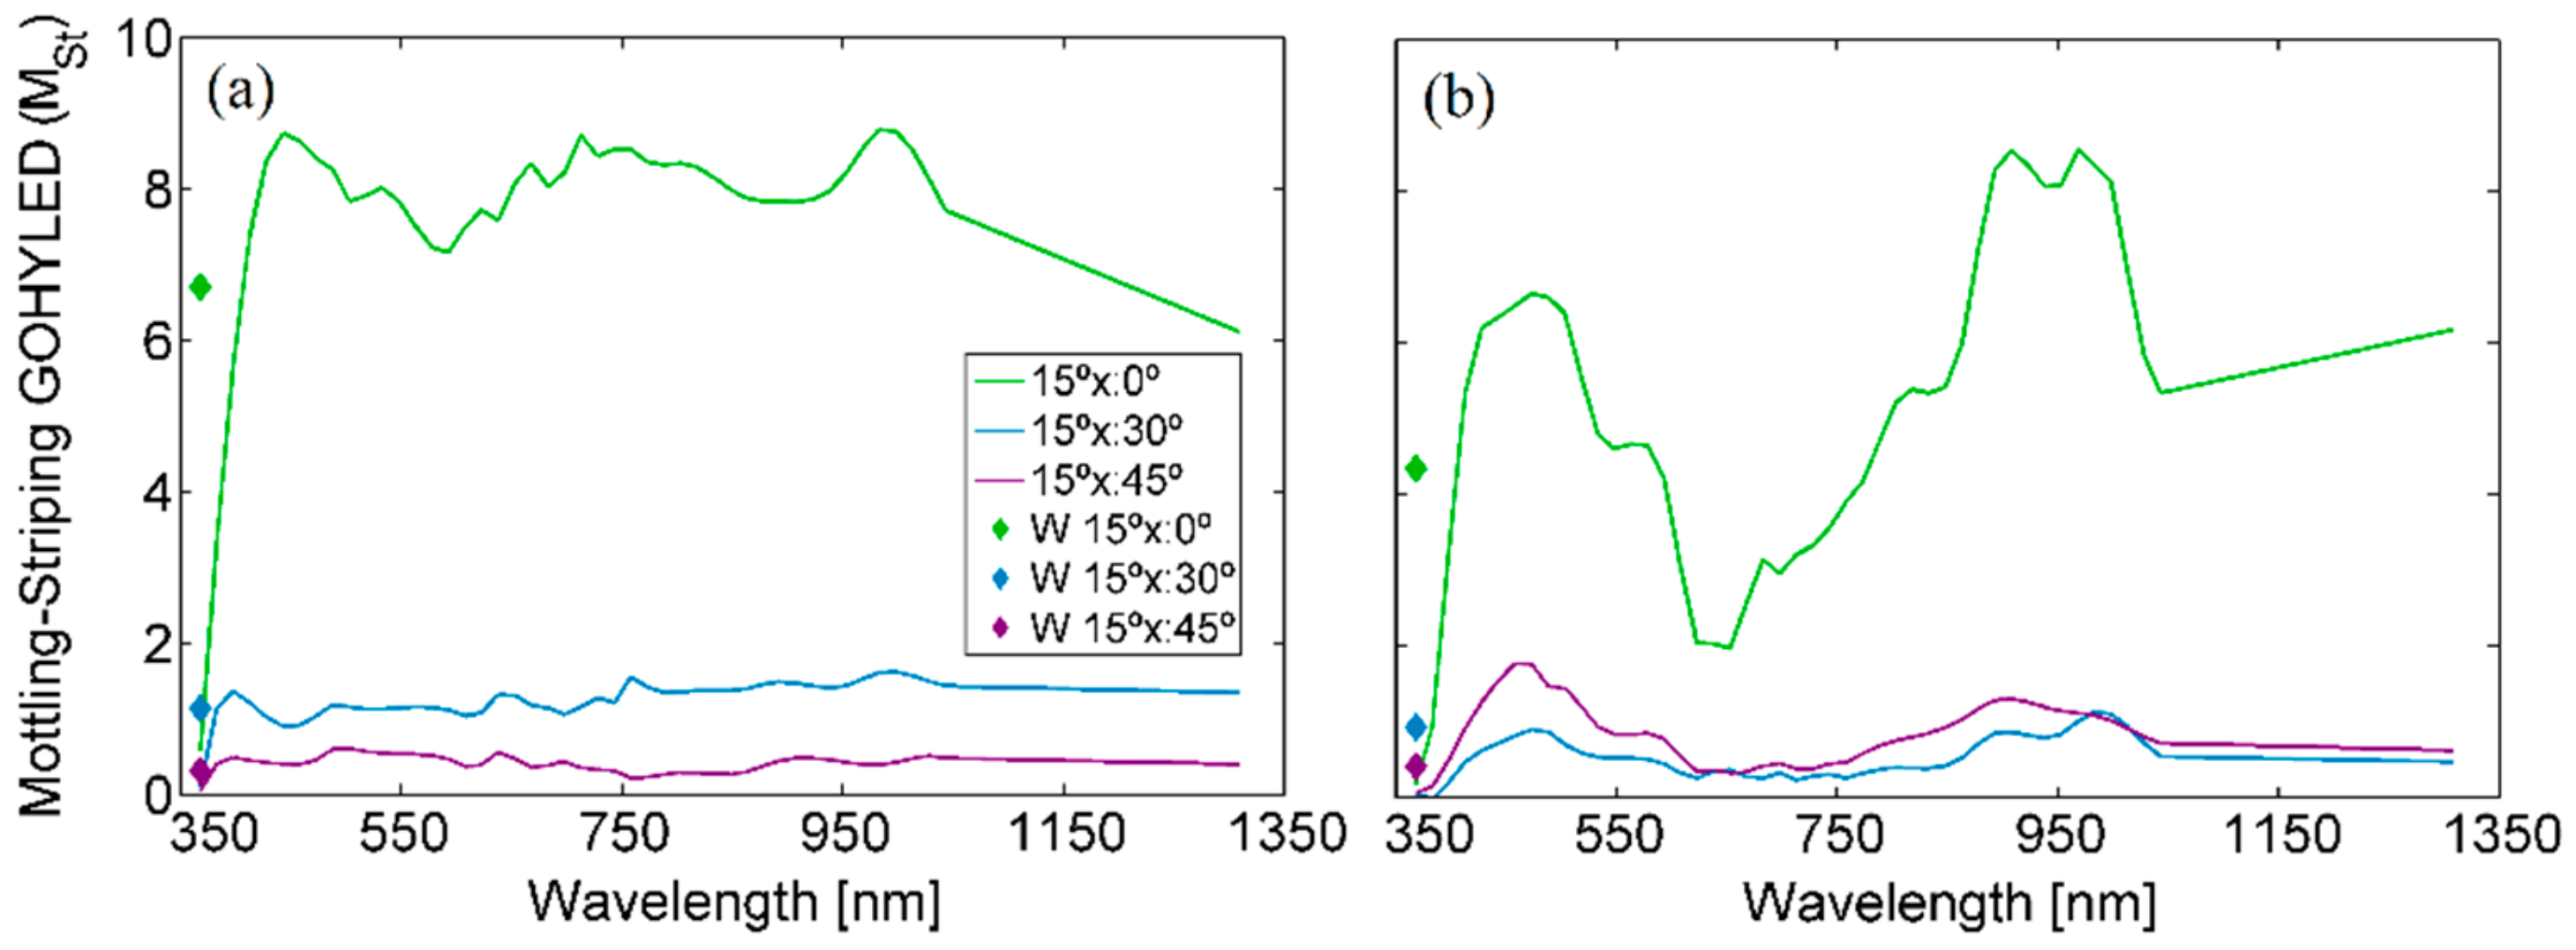
Mottling was also analyzed spectrally from 368 to 1309 nm. Figure 11 shows the MSt spectra for the two samples with striping. The spectra of samples without striping resulted in substantially smaller values.
The samples with striping were also related to the largest MSt grades for the spectral assessment, particularly at 15°x: 0°. The greatest response to mottling at longer wavelengths was observed for both samples with stripes, partly because of the diminished sparkle at the end of the VIS range. The better performance in the IR could also be caused by the thickness variations of the base coat, where the goniochromatic particles are immersed. In this case, the distance among particles increases, to the extent that regions where the deepest layers of the coating are more visible with IR light appear free from these particles. Consequently, the evaluation of mottling-striping beyond 750 nm, particularly from 900 to 1000 nm, is of great interest in addition to the VIS range. Moreover, the measurement of mottling in the IR range would simplify the mathematics behind this index because the removal of sparkle prior calculations by smoothing of the curves would not be critical.
The MSt values of the remaining geometries were lower than the 15°x: 0° values but still slightly above the geometries of samples without stripes. Finally, a connection between the spectral/colorimetric features and mottling-striping was observed, similarly to the spectral evaluation of graininess. It was therefore inferred that once the influence of sparkle is removed, textural effects in goniochromatic pigments are strongly related to the spectrum of the sample.

5. Conclusions

New methods and indices for the analysis of sparkle, graininess and mottling of automotive coatings were developed using a novel gonio-hyperspectral imaging system based on LEDs that operates from 368 to 1309 nm. This work could have a great impact on the automotive industry due to its interest in improving the quality control of car finishes, and because it is the sector wherein the demand for goniometric analysis is stronger.
A sparkle evaluation method including a quantification index was proposed and proved to be particularly suitable for geometries close to the specular reflection. The spectral assessments of sparkle showed that this textural effect does not depend on the color or reflectance spectra of the substrate of a sample, since it was found to be mainly determined by the goniochromatic particles. This fact could help manufacturers to produce new sparkling effects by focusing their efforts on improving the intrinsic features of these bright particles instead of modifying the substrate. Quality control processes could also benefit from this by assessing how goniochromatic particles are settled in the base coat. Additionally, the spectral region from 450 to 600 nm was shown to be the most relevant.
An index based on the first order statistics of the energy descriptor computed from the histogram of the images taken with the gonio-hyperspectral imaging system was employed for graininess assessments. The spectral analysis of graininess showed a strong relationship with spectral reflectance up to 850 nm, unlike sparkle. Therefore, graininess seems to depend on both the goniochromatic particles and the substrate. Accordingly, the selection of the substrate should be done considering the targeted graininess rather than the desired sparkle effect, in terms of spectral reflectance. Beyond 850 nm, no remarkable differences were found among samples.
The new mottling-striping index MSt was found to be very useful, as it revealed a dissimilar behavior between samples with and without striping and geometries, particularly at that of 15°x:0°. Spectral differences were mainly observed between 900 and 1000 nm, as a consequence of sparkle removal and higher penetration of IR light. In fact, this IR analysis could be easily implemented in current devices by simply adding IR illumination, since most of them use sensors with sensitivities up to 1000 nm. The relationship between mottling-striping and spectral reflectance would not be critical in this case, because this effect is mainly caused by thickness variations of the coating.
Future work will focus on improving the performances of sparkle and graininess evaluations for dark samples and expanding the set of samples with mottling, comparing the results obtained by means of the GOHYLED system with other instruments.

Author Contributions

Conceptualization, F.J.B.-F., M.V. and F.M.M.-V.; methodology, F.J.B.-F., M.V. and E.P.; software, F.J.B.-F.; validation, F.J.B.-F. and E.P.; formal analysis, F.J.B.-F. and M.V.; investigation, F.J.B.-F., M.V. and E.P.; resources, M.V., J.P. and F.M.M.-V.; data curation, F.J.B.-F. and E.P.; writing—original draft preparation, F.J.B.-F. and M.V.; writing—review and editing, E.P., J.P. and F.M.M.-V.; visualization, F.J.B.-F., J.P., E.P., F.M.M.-V. and M.V.; supervision, M.V. and J.P.; project administration, M.V.; funding acquisition, M.V., J.P. and F.M.M.-V. All authors have read and agreed to the published version of the manuscript.

Funding

Ministerio de Ciencia e Innovación (MICINN, DPI2011-30090-C02-01) and Ministerio de Economía y Competitividad (MINECO, DPI2014-56850-R); and the European Union.

Acknowledgments

Francisco J. Burgos-Fernández thanks the Government of Catalonia for his Ph.D. grant.

Conflicts of Interest

The authors declare no conflict of interest. The funders had no role in the design of the study; in the collection, analyses, or interpretation of data; in the writing of the manuscript, or in the decision to publish the results.

References

  1. Patzlaff, J.; Rösler, M. Sparkle effects in thin layers. Eur. Coat. J. 2006, 49, 1–3. [Google Scholar]
  2. Klein, G.A. Industrial Color Physics. In Springer Series in Optical Sciences; Rhodes, W.T., Ed.; Springer: New York, NY, USA, 2010; Volume 154. [Google Scholar] [CrossRef] [Green Version]
  3. Haralick, R.M. Statistical and structural approach to texture. Proc. IEEE 1979, 67, 786–804. [Google Scholar] [CrossRef]
  4. Cula, O.G.; Dana, K.J. Compact Representation of Bidirectional Texture Functions. In Proceedings of the 2001 IEEE Computer Society Conference on Computer Vision and Pattern Recognition (CVPR 2001), Kauai, HI, USA, 8–14 December 2001; Jacobs, A., Baldwin, T., Eds.; IEEE: Piscataway, NJ, USA, 2001; pp. 1041–1047. [Google Scholar] [CrossRef]
  5. Maile, F.J.; Pfaff, G.; Reynders, P. Effect pigments—Past, present and future. Prog. Org. Coat. 2005, 54, 150–163. [Google Scholar] [CrossRef]
  6. Buxbaum, G.; Pfaff, G. Industrial Inorganic Pigments, 3rd ed.; Wiley-VCH: Weinheim, Germany, 2005. [Google Scholar] [CrossRef]
  7. ASTM International. ASTM Standard E284-13b—Standard Terminology of Appearance; ASTM International: West Conshohocken, PA, USA, 2013. [Google Scholar]
  8. Kirchner, E.J.J.; van den Kieboom, G.J.; Njo, L.; Supèr, R.; Gottenbos, R. Observation of visual texture of metallic and pearlescent materials. Color Res. Appl. 2007, 32, 256–266. [Google Scholar] [CrossRef]
  9. McCamy, C.S. Observation and measurement of the appearance of metallic materials. Part I. Macro appearance. Color Res. Appl. 1996, 21, 292–304. [Google Scholar] [CrossRef]
  10. Durikovic, R.; Martens, W.L. Simulation of Sparkling and Depth Effect in Paints. Assoc. Comput. Mach. 2003, 19, 193–198. [Google Scholar] [CrossRef]
  11. Huang, Z.; Xu, H.; Luo, M.R. Camera-based model to predict the total difference between effect coatings under directional illumination. Chin. Opt. Lett. 2011, 9, 093301. [Google Scholar] [CrossRef]
  12. Ferrero, A.; Bayón, S. The measurement of sparkle. Metrologia 2015, 52, 317–323. [Google Scholar] [CrossRef]
  13. Kirchner, E.; Ravi, J. Predicting and Measuring the Perceived Texture of Car Paints. In Predicting Perceptions, Proceedings of the 3rd International Conference on Appearance, 1st ed.; Padilla, S., Ed.; Lulu Press: Edinburgh, Scotland, 2012; pp. 2–4. [Google Scholar]
  14. Ferrero, A.; Campos, J.; Rabal, A.M.; Pons, A. A single analytical model for sparkle and graininess patterns in texture of effect coatings. Opt. Express 2013, 21, 26812–26819. [Google Scholar] [CrossRef] [Green Version]
  15. Perales, E.; Burgos, F.J.; Vilaseca, M.; Viqueira, V.; Martínez-Verdú, F.M. Graininess characterization by multidimensional scaling. J. Modern Opt. 2019, 66, 929–938. [Google Scholar] [CrossRef] [Green Version]
  16. BYK Additives & Instruments. Available online: https://www.byk.com (accessed on 13 February 2020).
  17. Fahlcrantz, C.-M. On the Evaluation of Print Mottle. Ph.D. Thesis, Kungliga Tekniska Högskolan, Stockholm, Sweden, 9 December 2005. [Google Scholar]
  18. Schanda, J. Colorimetry: Understanding the CIE System; John Wiley & Sons, Inc.: Hoboken, NJ, USA, 2007. [Google Scholar]
  19. Charvat, R.A. Coloring of Plastics: Fundamentals, 2nd ed.; John Wiley & Sons, Inc.: Hoboken, NJ, USA, 2004. [Google Scholar] [CrossRef]
  20. Harris, R.M. Coloring Technology for Plastics; William Andrew, Inc.: Norwich, UK, 1999. [Google Scholar]
  21. Valet, B.; Mayor, M.; Fitoussi, F.; Capellier, R.; Dormoy, M.; Ginestar, J. Colouring Agents in Decorative and other Cosmetics. Analytical Methods. In Analysis of Cosmetic Products, 1st ed.; Salvador, A., Chisvert, A., Eds.; Elsevier: Amsterdam, The Netherlands, 2007; pp. 141–152. [Google Scholar] [CrossRef]
  22. Mirhabibi, A.R. Ceramic Coatings for Pigments. In Ceramic Coatings—Applications in Engineering; Shi, F., Ed.; IntechOpen: London, UK, 2012; pp. 237–258. [Google Scholar] [CrossRef]
  23. Tenorio Cavalcante, P.; Dondi, M.; Guarini, G.; Barros, F.; Benvindo da luz, A. Ceramic application of mica titania pearlescent pigments. Dyes Pigments 2007, 74, 1–8. [Google Scholar] [CrossRef] [Green Version]
  24. Topp, K.; Haase, H.; Degen, C.; Illing, G.; Mahltig, B. Coatings with metallic effect pigments for antimicrobial and conductive coating of textiles with electromagnetic shielding properties. J. Coat. Technol. Res. 2014, 11, 943–957. [Google Scholar] [CrossRef]
  25. Sekar, N. Optical Effect Pigments for Technical Textile Applications. In Advances in the Dyeing and Finishing of Technical Textiles; Gulrajani, M.L., Ed.; Elsevier: Amsterdam, The Netherlands, 2013; pp. 37–46. [Google Scholar] [CrossRef]
  26. Tyagi, D.; Granica, L.; Lofftus, K. Novel Electrophotographic Toners for Providing Metallic Effects. In Proceedings of the NIP & Digital Fabrication Conference, Seattle, WA, USA, 29 September–3 October 2013; Society for Imaging Science and Technology: Springfield, MO, USA, 2013; pp. 462–465. [Google Scholar]
  27. Kehren, K.; Urban, P.; Dörsam, E. Visual Appearance of Printed Special Effect Colors. In Proceedings of the 20th Color and Imaging Conference, Los Angeles, CA, USA, 12–16 November 2012; Society for Imaging Science and Technology: Springfield, MO, USA, 2012; pp. 200–205. [Google Scholar]
  28. Arney, J.S.; Anderson, P.G.; Franz, G.; Pfeister, W. Color Properties of Specular Reflections. J. Imaging Sci. Technol. 2006, 50, 228–232. [Google Scholar] [CrossRef] [Green Version]
  29. Debeljak, M.; Hladnik, A.; Černe, L.; Gregor-Svetec, D. Use of effect pigments for quality enhancement of offset printed specialty papers. Color Res. Appl. 2013, 38, 168–176. [Google Scholar] [CrossRef]
  30. Schuman, T.; Karlsson, A.; Larsson, J.; Wikström, M.; Rigdahl, M. Characteristics of pigment-filled polymer coatings on paperboard. Prog. Org. Coat. 2005, 54, 360–371. [Google Scholar] [CrossRef]
  31. Chorro, E.; Perales, E.; Burgos, F.J.; Gómez, O.; Vilaseca, M.; Viqueira, V.; Pujol, J.; Martínez-Verdú, F.M. The minimum number of measurements for colour, sparkle, and graininess characterisation in gonio-apparent panels. Color. Technol. 2015, 131, 303–309. [Google Scholar] [CrossRef]
  32. Amookht, S.; Kandi, S.G.; Mahdavian, M.; Moradian, S. The effect of clear coat and basecoat interdiffusion on the appearance of automotive coating system. Prog. Org. Coat. 2013, 76, 1325–1328. [Google Scholar] [CrossRef]
  33. Dekker, N.; Kirchner, E.J.J.; Supèr, R.; van den Kieboom, G.J.; Gottenbos, R. Total appearance differences for metallic and pearlescent materials: Contributions from color and texture. Color Res. Appl. 2011, 36, 4–14. [Google Scholar] [CrossRef]
  34. Streitberger, H.J.; Dossel, K.F. Automotive Paints and Coatings, 2nd ed.; Wiley-VCH: Weinheim, Germany, 2008. [Google Scholar] [CrossRef]
  35. Burgos-Fernández, F.J.; Vilaseca, M.; Perales, E.; Chorro, E.; Martínez-Verdú, F.M.; Fernández-Dorado, J.; Pujol, J. Validation of a gonio-hyperspectral imaging system based on light-emitting diodes for the spectral and colorimetric analysis of automotive coatings. Appl. Opt. 2017, 56, 7194–7203. [Google Scholar] [CrossRef] [Green Version]
  36. Pelli, D.G.; Bex, P. Measuring contrast sensitivity. Vis. Res. 2013, 90, 10–14. [Google Scholar] [CrossRef] [Green Version]
  37. DIN Deutsches Institut für Normung. DIN 6175-2—Tolerances for Automotive Paints—Part 2: Goniochromatic Paints; DIN Deutsches Institut für Normung: Berlin, Germany, 2001. [Google Scholar]
  38. ASTM International. ASTM Standard E2194-09—Standard Practice for Multiangle Color Measurement of Metal Flake Pigmented; ASTM International: West Conshohocken, PA, USA, 2009. [Google Scholar]
  39. ASTM International. ASTM Standard E2539-08—Standard Practice for Multiangle Color Measurement of Interference Pigments; ASTM International: West Conshohocken, PA, USA, 2008. [Google Scholar]
  40. Kirchner, E.; van der Lans, I.; Perales, E.; Martínez-Verdú, F.M.; Campos, J.; Ferrero, A. Visibility of sparkle in metallic paints. J. Opt. Soc. Am. A 2015, 32, 921–927. [Google Scholar] [CrossRef] [PubMed] [Green Version]
  41. Zack, G.W.; Rogers, W.E.; Latt, S.A. Automatic measurement of sister chromatid exchange frequency. J. Histochem. Cytochem. 1977, 25, 741–753. [Google Scholar] [CrossRef] [PubMed]
  42. Haralick, R.M.; Shanmugam, K.; Dinstein, I. Textural Features for Image Classification. IEEE Trans. Syst. Man Cybern. 1973, SMC-3, 610–621. [Google Scholar] [CrossRef] [Green Version]
  43. Gonzalez, R.C.; Woods, R.E.; Eddins, S.L. Digital Image Processing Using MATLAB, 1st ed.; Prentice Hall: Upper Saddle River, NJ, USA, 2004. [Google Scholar]
  44. Herrera, J.A.; Vilaseca, M.; Düll, J.; Arjona, M.; Torrecilla, E.; Pujol, J. Iris color and texture: A comparative analysis of real irises, ocular prostheses, and colored contact lenses. Color Res. Appl. 2011, 36, 373–382. [Google Scholar] [CrossRef]
  45. Ghodrati, S.; Mohseni, M.; Kandi, S.G. A Histogram-Based Image Processing Method for Visual and Actual Roughness Prediction of Sandpapers. In Proceedings of the 6th International Color & Coating Congress, Tehran, Iran, 10–12 November 2015; Institute for Color Science and Technology: Tehran, Iran, 2015; pp. 10–12. [Google Scholar]
  46. Ritter, G.; Wilson, J. Handbook of Computer Vision Algorithms in Image Algebra, 2nd ed.; CRC Press: Boca Raton, FL, USA, 2000. [Google Scholar]
  47. Bland, J.M.; Altman, D.G. Statistical methods for assessing agreement between two methods of clinical measurement. Int. J. Nurs. Stud. 2010, 47, 931–936. [Google Scholar] [CrossRef]
Figure 1. Illustrations of sparkle (a), graininess (b) and mottling (c) effects of goniochromatic automotive coatings.
Coatings 10 00320 g001
Figure 2. Developed gonio-hyperspectral imaging system based on LEDs represented in (a) a layout and in (b) a picture: 1. UV–VIS camera, 2. sample holder, 3. 8MR191-30 rotation stage, 4. 8MR191-30-28 rotation stage, 5. rotation stages controller, 6. linear actuator, 7. lens, 8. LED clusters, 9. light source controller and power supply and 10. IR camera, which is not represented in (a). θ refers to the illumination angle controlled by the 8MR151-30 rotation stage and α to the observation angle handled by the 8MR191-30-28 rotation stage. Figure adapted with permission from [35]. © The Optical Society.
Coatings 10 00320 g002
Figure 3. (a) Image of a sample with striping, and (b) a plot with the averaged and smoothed image profile (blue line), the linearly fitted curve (red line) and the subtraction profile DSt (black line).
Coatings 10 00320 g003
Figure 4. GOHYLED sparkle images of (a) a pearlescent, (b) a metallic and (c) a solid sample for the −15°x:0° geometry when illuminated with the white LED cluster.
Coatings 10 00320 g004
Figure 5. Bland and Altman plots for the sparkle grade (SG) at the three sparkle geometries: (a) −15°x: 0°, (b) 45°x: 0° and (c) 75°x: 0°. Dashed lines indicate the 95% limits of agreement and dotted lines denote the mean difference value.
Coatings 10 00320 g005
Figure 6. GOHYLED sparkle spectra of (a) a pearlescent, (b) a metallic and (c) a solid sample for the −15°x: 0°, 45°x: 0° and 75°x: 0° geometries of sparkle, and GOHYLED sparkle spectra of (d) a pearlescent, (e) a metallic and (f) a solid sample for the geometries of spectral/colorimetric measurements 45°x: −60°, 45°x: −30°, 45°x: −20°, 45°x: 30°, 45°x: 65°, 15°x: −30° and 15°x: 0°. The sparkle grade related to the white LED cluster (W) is represented by diamond markers (−15°x: 0° in blue; 45°x: 0° in green; 75°x: 0° in purple).
Coatings 10 00320 g006
Figure 7. GOHYLED graininess images of (a) a pearlescent, (b) a metallic and (c) a solid sample for the −15°x: 0° geometry when illuminated with the white LED cluster.
Coatings 10 00320 g007
Figure 8. Bland and Altman plot of the GOHYLED graininess.
Coatings 10 00320 g008
Figure 9. GOHYLED graininess spectra of a pearlescent (orange), a metallic (blue) and a solid (green) sample for the geometry of d: 12.5°. The graininess value corresponding to the white LED cluster is represented in each graph with a diamond marker.
Coatings 10 00320 g009
Figure 10. Images of (a) the grey and (b) the blue samples with stripes, and (c) the grey metallic, (d) the grey pearlescent and (e) the grey solid samples without striping for the white LED cluster at the geometry of 15°x: 0°. The arrows indicate the stripes in samples with mottling-striping.
Coatings 10 00320 g010
Figure 11. Mottling-striping spectra MSt of (a) the grey and (b) the blue sample with striping. The MSt related to the white LED cluster (W) is represented by diamond markers.
Coatings 10 00320 g011
Table 1. Pearson or Spearman correlation coefficients, and corresponding p-values; and Bland and Altman analysis (mean of the differences, MD, and the corresponding confidence limits, CL) between the sparkle-area (AS), sparkle-intensity (IS) and sparkle grade (SG) of the GOHYLED and the BYK-mac®.
Sparkle ParametersPearson or Spearman
Correlation Coefficient
p-ValueMDCL
AS -15°x:0°0.931 <0.001 1−0.07−0.39 to 0.26
AS 45°x:0°0.884 <0.001 1−0.13−0.51 to 0.26
AS 75°x:0°0.725 <0.001 1−0.21−0.68 to 0.27
IS -15°x:0°0.910 <0.001 1−0.24−0.48 to 0.01
IS 45°x:0°0.872 <0.001 1−0.14−0.46 to 0.17
IS 75°x:0°0.788 <0.001 1−0.26−0.61 to 0.08
SG -15°x:0°0.963 <0.001 10.05−0.13 to 0.24
SG 45°x:0°0.933 <0.001 10.11−0.17 to 0.39
SG 75°x:0°0.739 <0.001 10.13−0.41 to 0.67
1 Statistically significant correlations.
Table 2. Mottling-striping indices MSt for the gray and blue samples with stripes; and the pearlescent, metallic and solid samples without striping at the geometries of 15°x:0°, 15°x:30° and 15°x:45°, and under white LED illumination.
GeometryGrey StripingGrey PearlescentGrey MetallicGrey Solid
15°x: 0°6.703.733.520.12
15°x: 30°1.130.170.410.15
15°x: 45°0.320.110.160.17
GeometryBlue StripingBlue PearlescentBlue MetallicBlue Solid
15°x: 0°4.333.213.430.34
15°x: 30°0.930.360.250.16
15°x: 45°0.400.060.090.09

