1. Introduction
Nowadays, different industrial applications, such as textile, cosmetic, automotive, etc., attempt to draw users’ attention by using special coatings on their products. In this way, a product’s visual appearance is essential for choosing it in texture, color and brightness terms, among many other characteristics. For this reason, industry needs to establish scales to characterize the total visual appearance [
1,
2].
Interest in special-effect pigments has increased in recent years [
3,
4,
5,
6]. These pigments offer attractive visual features, such as changes in color and lightness of finishes with viewing and illumination direction (goniochromatism). Special-effect pigments also exhibit a visually complex texture. Indeed it can take a distinct spatial appearance depending on a finish’s properties and the viewing and illumination conditions [
7,
8]. Under bright direct illumination conditions, such as sunlight, coatings with special-effect pigments exhibit tiny bright points compared to their surroundings. This effect is known as sparkle. Conversely with diffuse illumination, e.g., a cloudy sky, coatings with special-effect pigments take on a salt-and-pepper appearance. This effect is referred to as graininess or coarseness. Thus, to perceive the graininess effect, it is necessary to use diffuse illumination and to cut the observation distance. However, this effect is independent of the observation angle. Both sparkle and graininess depend on flake size, orientation and distribution [
9,
10,
11]. Metallic finishes with larger coarse flakes show intense sparkle and/or graininess, while those with very fine flakes appear uniform and seem almost solid in color.
Despite these special-effect pigments being frequently used, there are no standards like ISO, ASTM or DIN to propose the mathematical and optical algorithms required to measure and calculate these texture effects. This means that no visual scales exist to corroborate such algorithms. In fact, currently two instruments exist with which to measure texture effects despite the importance of the complete characterization (color and texture) of coatings. The multi-angle spectrophotometer BYK-mac-i includes a CCD monochrome camera for measuring texture effects [
12]. To measure the sparkle effect, the sample is illuminated directionally at 15°, 45° and 75°, and counted to the normal direction from the sample surface. Three parameters are obtained to characterize sparkle: sparkle intensity (Si), sparkle area (Sa) and sparkle grade (S
G) [
7,
8,
13]. To measure the graininess effect, the sample is diffusely illuminated by an integrating sphere. To evaluate or measure graininess, the non-uniformity of light/dark areas is evaluated, and these areas are recorded by the CCD camera to provide a gray-scale picture. The uniformity of this image is a measurement of graininess [
8]. Recently, X-Rite launched the MA-T12 multi-angle spectrophotometer [
14]. It has an RGB color camera coupled with 12 measurement angles to characterize color and texture effects. This instrument provides a parameter to measure the non-uniformity of light/dark areas but, in this case, this parameter is called diffuse coarseness. This disagreement in the nomenclature is because normative or standards for these texture effects are lacking. This is why a technical committee of CIE exists, namely JTC 12 [
15]. Its main purpose is to provide a methodology that measures sparkle and graininess, and to develop a measurement scale so that different instruments can provide the same spectrophotometric data from the same specimen by validating the proposal with visual data taken from psychophysical methods.
However, few works about establishing a graininess scale have been published. One previous work applied multidimensional scaling [
16] and conducted a specific visual experiment. The results showed that two dimensions were necessary to characterize the graininess effect. The first dimension correlated well with the graininess value provided by the BYK-mac-i instrument, but it was not possible to find a relation with dimension 2 and any parameter measured by this instrument. The graininess attribute was found to depend on the lightness value. In addition, a methodology for traceable graininess measurements was evaluated in [
17], whose results indicated that the higher the concentration of effect pigments, the higher the average luminance factor, and the lower the graininess, and the bigger the average size of pigments, the higher the graininess became. However, it claimed more visual data. Nevertheless, other algorithms to analyze the graininess property of metallic coatings have been studied by image processing techniques and texture analysis methods [
18]. The results were also evaluated by visual experiments. Therefore, the instrumental and visual graininess evaluation is an interesting topic and a much demanded one in industrial sectors because it is essentially a reliable methodology to apply good quality product control.
Measuring consists of assigning numbers to objects according to rules. In line with this idea, it is possible to specify different types of measurements scales [
19], of which five are worth highlighting: nominal, ordinal, interval, ratio and absolute. The nominal scale consists of giving different labels to each item; that is, it uses numbers instead of names to distinguish among members of a group. The ordinal scale involves ordering items in progressing intensities without considering the meaning of the distances along it. An interval scale establishes orders together with ratios of differences. A ratio scale determines orders, ratios of differences and ratios of magnitudes. Finally, an absolute scale also defines magnitudes that can be done by counting or convention. However, the choice of experimental method can determine the visual scale obtained from data. For this reason, it is interesting to evaluate whether different visual judgments about the same specimen can provide several visual scales.
Therefore, the purpose of this work was to evaluate the influence of two different psychophysical methods, “rank-order method” and “paired-comparison method”, on the visual measurement of the graininess effect to compare it with the most widespread instrumental scale.
2. Materials and Methods
To conduct the visual experiment, a set of samples was first selected, which comprised 10 samples (
Figure 1) belonging to the Effect Navigator® chart of Standox [
20]. This chart was developed to select the exact flake size (texture effect) for color matching in the car refinishing industry.
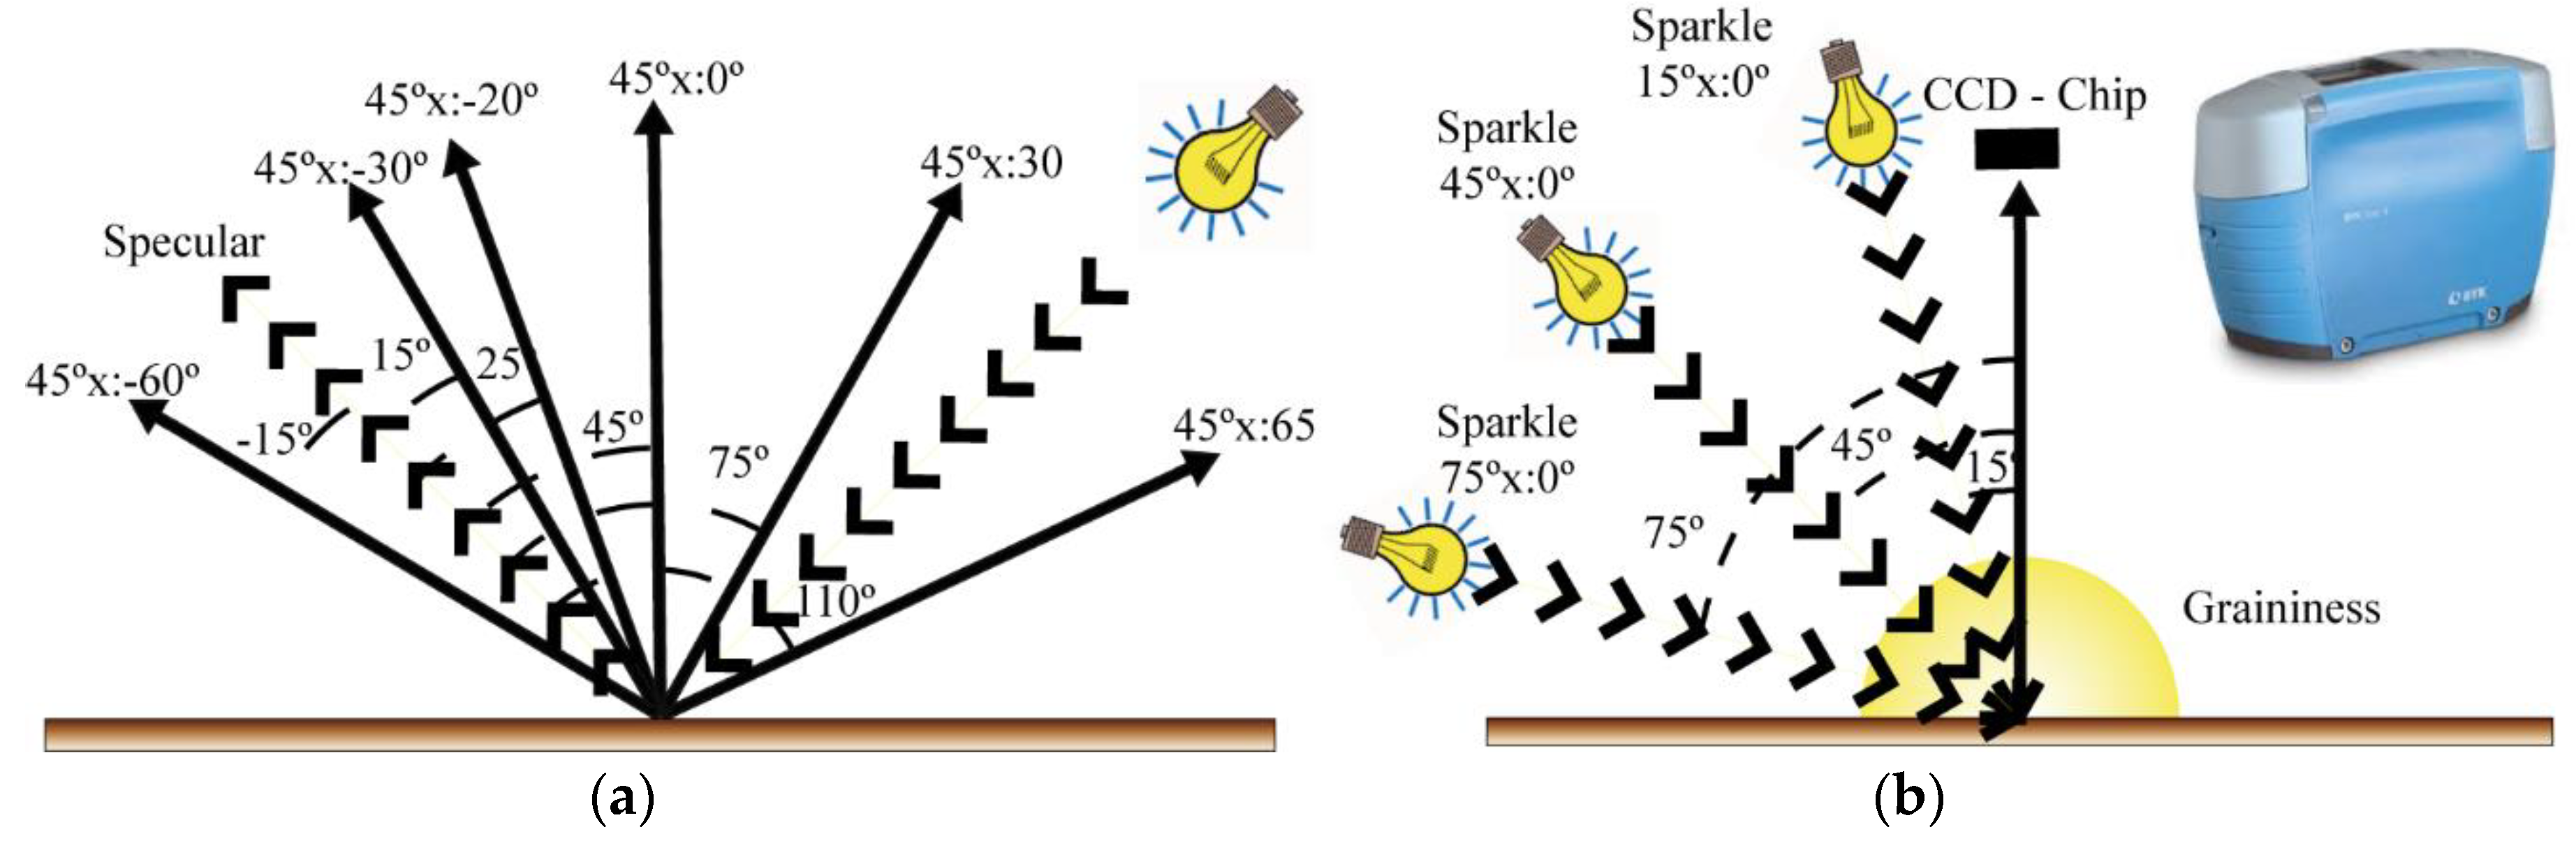
To characterize samples, the BYK-mac-i multi-angle spectrophotometer was used to obtain CIELAB values under the D65 illuminant with six different measurement geometries and texture parameters (sparkle and graininess). As previously mentioned, the BYK-mac-i instrument is a device used to perform multi-angle color measurements and flake characterization. On the one hand, color measurements are taken at an illumination angle of 45° and at six detection angles: −15°, 15°, 25°, 45°, 75°, 110° (regarding the specular direction). Following CIE standards, these geometries are represented as 45°x: −60°, 45°x: −30°, 45°x: −20°, 45°x:0°, 45°x:30° and 45°x:65°, respectively (
Figure 2a). On the other hand, it includes a CCD monochrome camera that performs a camera analysis. To measure the sparkle effect, the sample is illuminated directionally at 15°, 45° and 75°, and counted to the normal direction from the sample surface (
Figure 2b). Three parameters are obtained to characterize sparkle: sparkle intensity (Si), sparkle area (Sa) and sparkle grade (SG). Sparkling area is detected, but not the size of the individual effect pigment. Sparkling intensity is measured as how strong the light flash of the effect pigment is. Finally, the total sparkle grade is determined as according to sparkle area and sparkle intensity. To measure the graininess effect, the sample is diffusely illuminated by an integrating sphere (
Figure 2b). To evaluate or measure graininess, the non-uniformity of light/dark areas is evaluated. These areas are recorded by the CCD camera to provide a gray-scale picture. The algorithms implemented to determine sparkle and graininess values are unknown, and no more details are available.
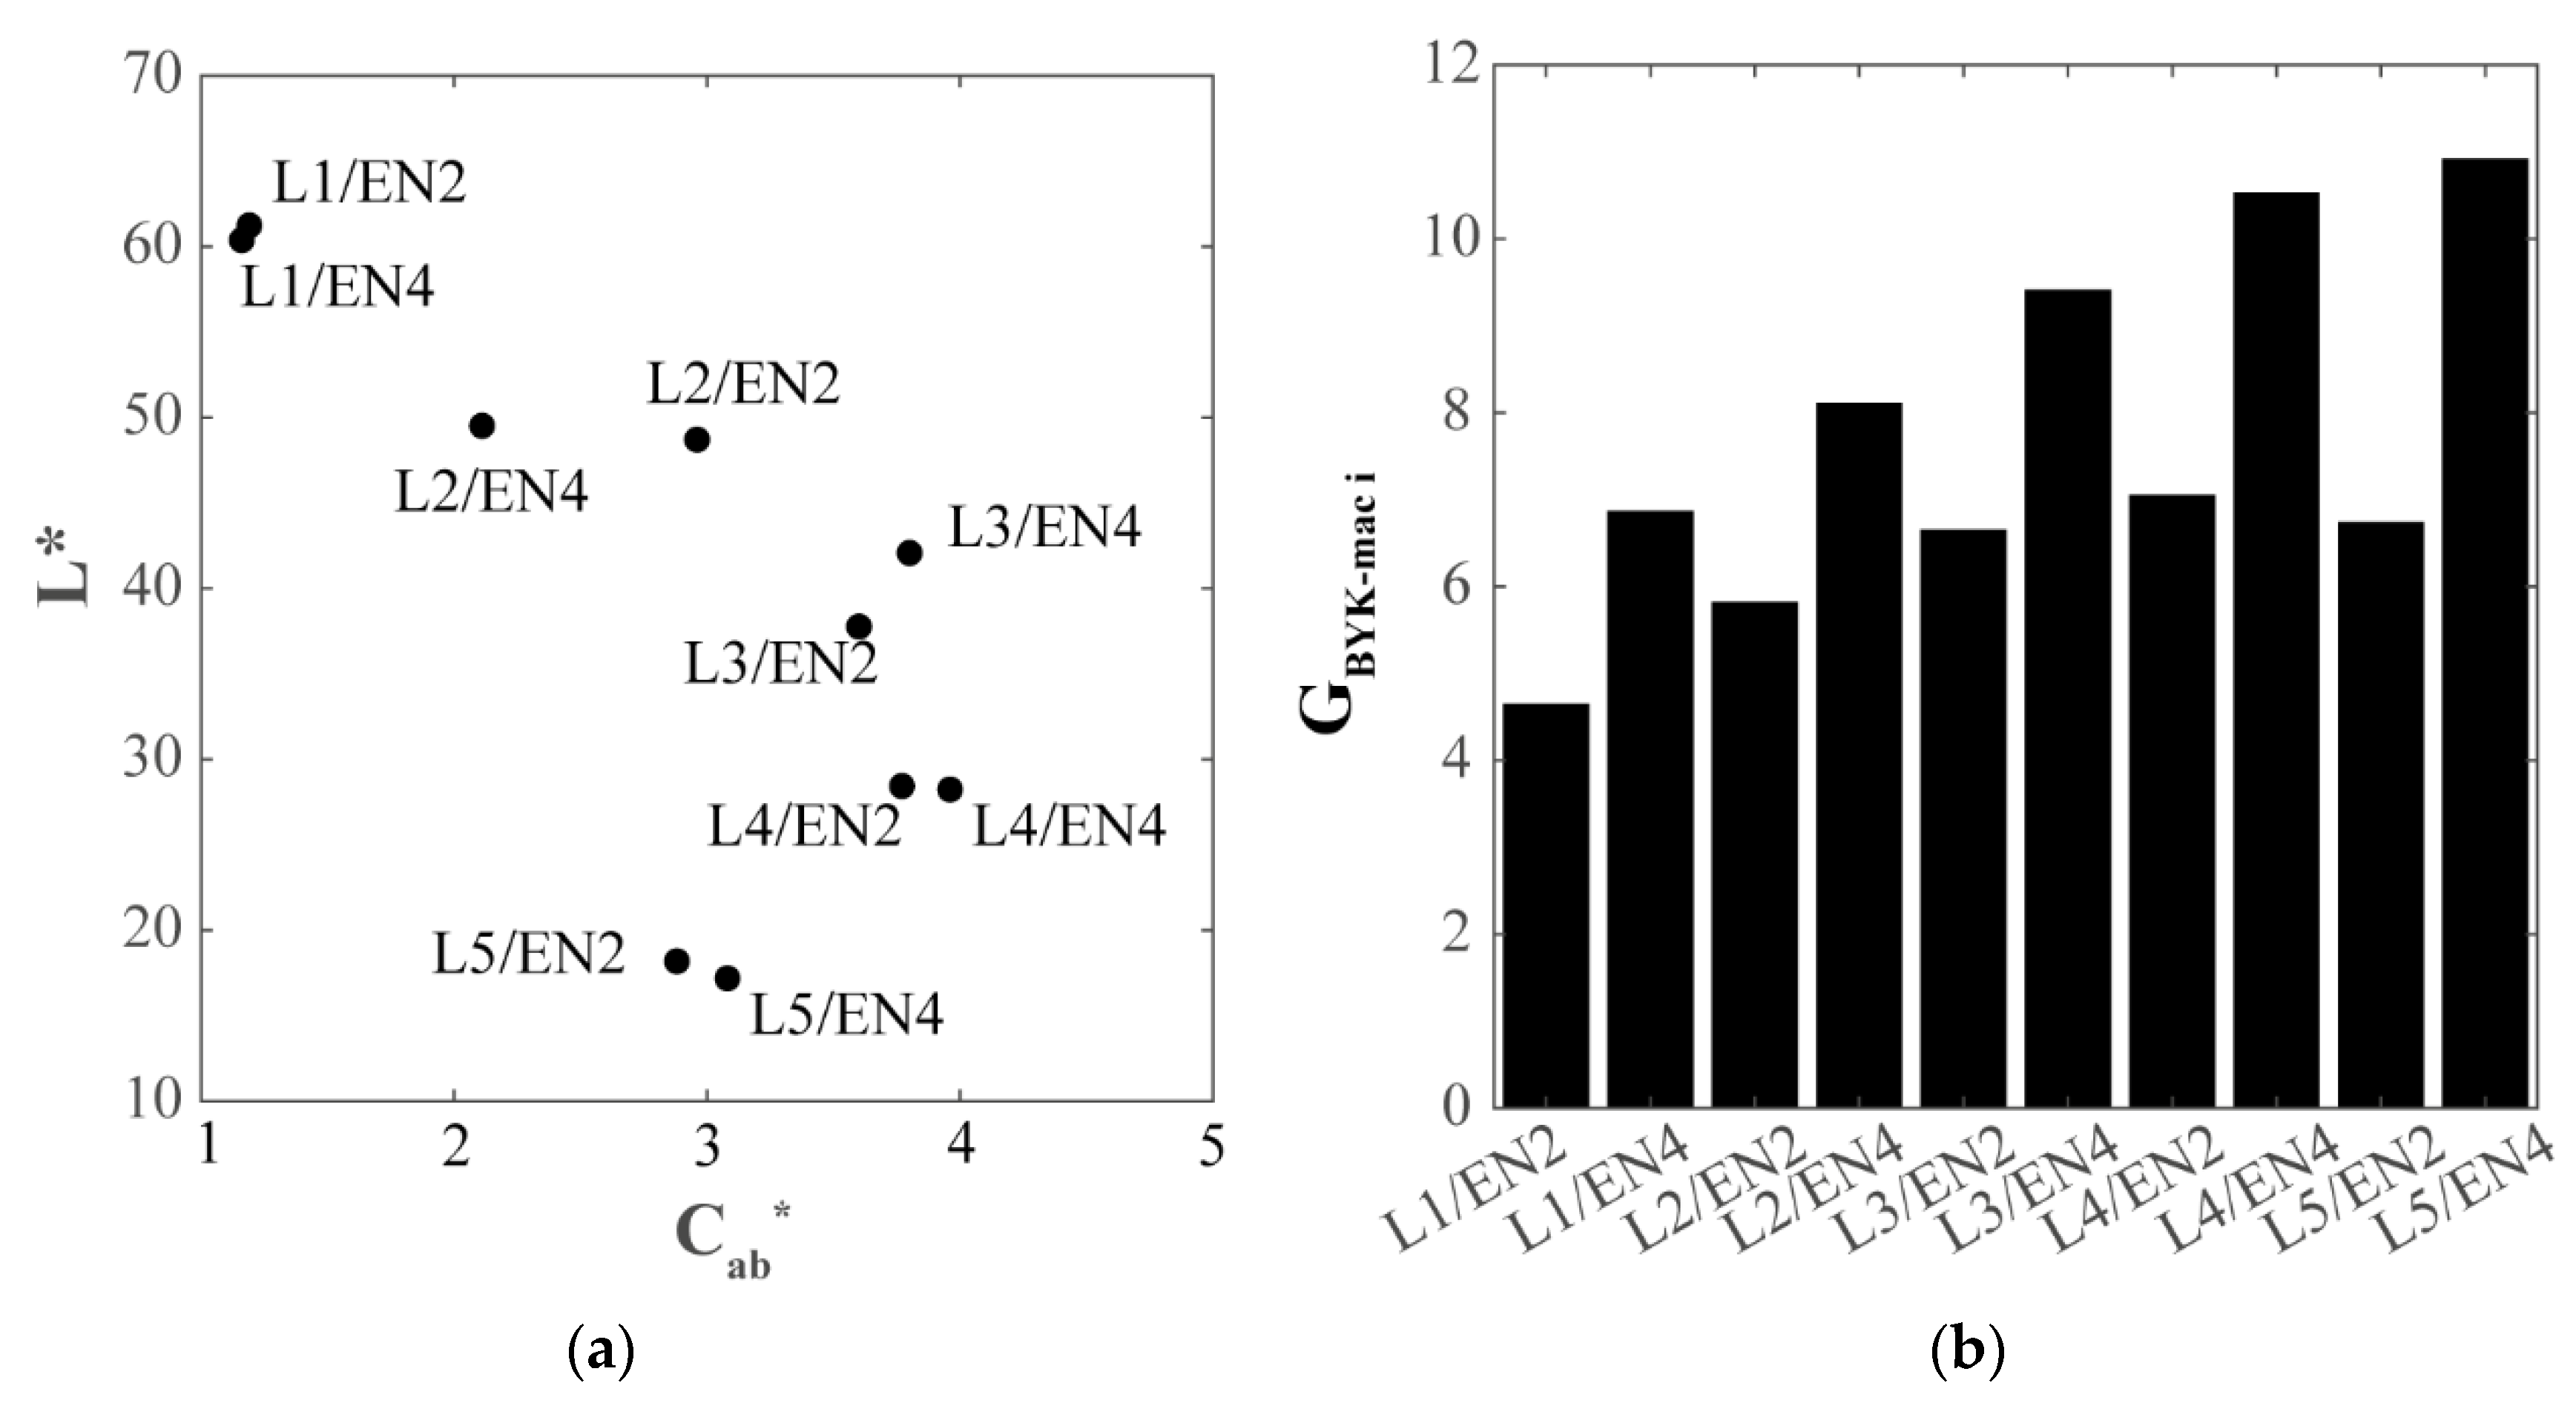
Regarding measurements, each sample is labeled with an L number and an EN number. The L number is related to the concentration of effect pigments, whereas the EN number is related to the average size of pigments. From
Figure 3, it is clear that the higher the L number, the lighter the sample. So, this parameter is related to the concentration of effect pigments, and the larger the EN number, the stronger the perceived graininess effect.
A light booth was used to run the experiment: VeriVide CAC 150 (Alicante, Spain). This viewing booth has good diffuse illumination and, therefore, sparkle perception is canceled and only the graininess effect is perceived (− +). The colorimetric properties of the used light source were measured by a Photo Research PR-650 tele-spectroradiometer. The measured chromatic coordinates were x = 0.3127 and y = 0.3383. The correlated color temperature equaled 6439 K, with a color rendering index, Ra, of around 95 units.
Twenty-six observers (23 women, 3 men) voluntarily collaborated in this work. Their age range covered 21–40 years. Checks were previously made to ensure that all the observers had normal chromatic vision according to the Ishihara test, and their visual acuity exceeded or equaled 20/20. When carrying out measurement sessions, the observers made optical corrections whenever necessary. Sessions were held in the Physiological Optics Laboratory of the Department of Optics, Pharmacology and Anatomy at the University of Alicante (Spain). The experimental session lasted 15–20 min depending on each observer’s responses. Each observer conducted three measurement sessions, but never consecutively. The experiment was conducted in a dark room. Before each observer took measurements, they were allowed 3 min to adapt to the cabin light and the lightness conditions inside the cabin. This process was followed to ensure a controlled state adaptation and this time was employed to explain to the observers the task to be performed.
As previously mentioned, two psychophysical experiments were designed. Both methods were based on the law of comparative judgments as stated by Thurstone [
19,
21,
22]. The law of comparative judgment is implied in both Weber’s law and Fechner’s law. This law is based on an equation that relates the number of times that any stimulus is judged greater regarding an attribute than for any other stimulus in terms of the discriminal differences of the two stimuli in a judgment continuum. The first one was the rank-order method [
19]. This method consists of placing all samples in front of the observers in random order. Then the observers are asked to place samples in order according to the perceived graininess from left (less graininess) to right (more graininess). The observers’ responses were recorded in terms of the number of times that a rank appeared (frequency). After recording all the observers’ data, the way to determine the rank order and to establish a scale were as follows. First, the mean rank (M
R) was calculated by multiplying ranks and frequencies, and by summing each column and dividing by the number of stimuli. Then rank order (R) was determined by ordering mean ranks and assigning the corresponding integer. Then the mean choice (M
C) was calculated as:
where n is the number of stimuli. From this point, it is possible to estimate an interval scale by following the comparative judgment method. This method is based on the assumption that to order samples, the observers must compare each sample either directly or indirectly to the other samples. Therefore, it is possible to compute the probability of choice from the data as:
From the probability data, conversion from probability into standard normal (z) deviation is done. The z scale is considered a scale of intervals or differences to be a scale with an equal interval, or a difference is that with the same probability or area under a normal curve, which is the meaning of the standard normal deviation.
The second method designed to obtain a graininess scale was the paired-comparison method, based also on [
19]. In this method, the observers were asked to state which sample in a pair had more graininess. The same samples as in the previous visual experiment were compared in pairs with all the possible combinations (45 pairs of samples). All the combinations were presented to the 26 observers as random-ordered pairs. The experimental conditions were the same as those described for the rank-order method. Data were recorded as the number of the preferred samples in each pair. Then a matrix of frequencies was computed. To estimate scale values for the graininess attribute, a logistic function was applied:
where n is the number of times the pair was judged, and f is the previously calculated frequency, and the arbitrary additive constant (0.5) simply prevents zeros from being present in the frequency matrix. Obviously, the more observers involved, the less this constant contributed.
The graininess scale obtained from both methodologies was transformed to be compared to the instrumental scale. The Procrustes function of Matlab® was used. In our case, the aim to use this function was to establish a similar visual scale to the instrumental scale (same order). Thus, matrix Y is the visual scale for the graininess attribute obtained after processing the visual experiment following the law of comparative judgments; matrix X is the instrumental graininess measured by the BYK-mac i instrument. The goodness-of-fit criterion is the sum of squared errors, so the employed transformation is as follows:
where:
Afterward, the instrumental and the visual scales obtained following both methodologies were compared to find if any correlation appeared between both magnitudes.
3. Results
The results are shown in this section. As previously mentioned, the methodology applied to obtain a graininess scale was based on the law of comparative judgments. The main hypothesis of this method is that the observers do not make consistent comparative judgments from one occasion to the next. That is, they provide different comparative judgments (or answers) during distinct sessions about the same pair of stimuli. Therefore, the visual scale is defined by assuming a normal distribution of the frequencies of the comparative processes of stimuli. So, it is not important or relevant to study the intra- or inter-observer variability in this experimental design because this variability is necessary to properly apply the method.
The first analyzed methodology was the rank-order method.
Table 1 shows the frequency at which each sample was placed in every possible position (from 1 to 10). That is, each entry in the table represents the number of times that a sample (shown at the top as columns) was placed in a specific rank (shown on the left as rows). For instance, sample 1 was placed in the first position 52 times or sample 3 in the first position 21 times. Since the 26 observers participated and they all performed three repetitions, 78 observations were recorded.
From these data, it was possible to compute a scale of equal intervals, represented by the standard normal deviation by following the methodology explained in the previous section. Therefore, it was possible to compare our visual scale from the psychophysical experiment to the instrumental data provided by the BYK-mac-i multi-angle spectrophotometer to see how well they correlated.
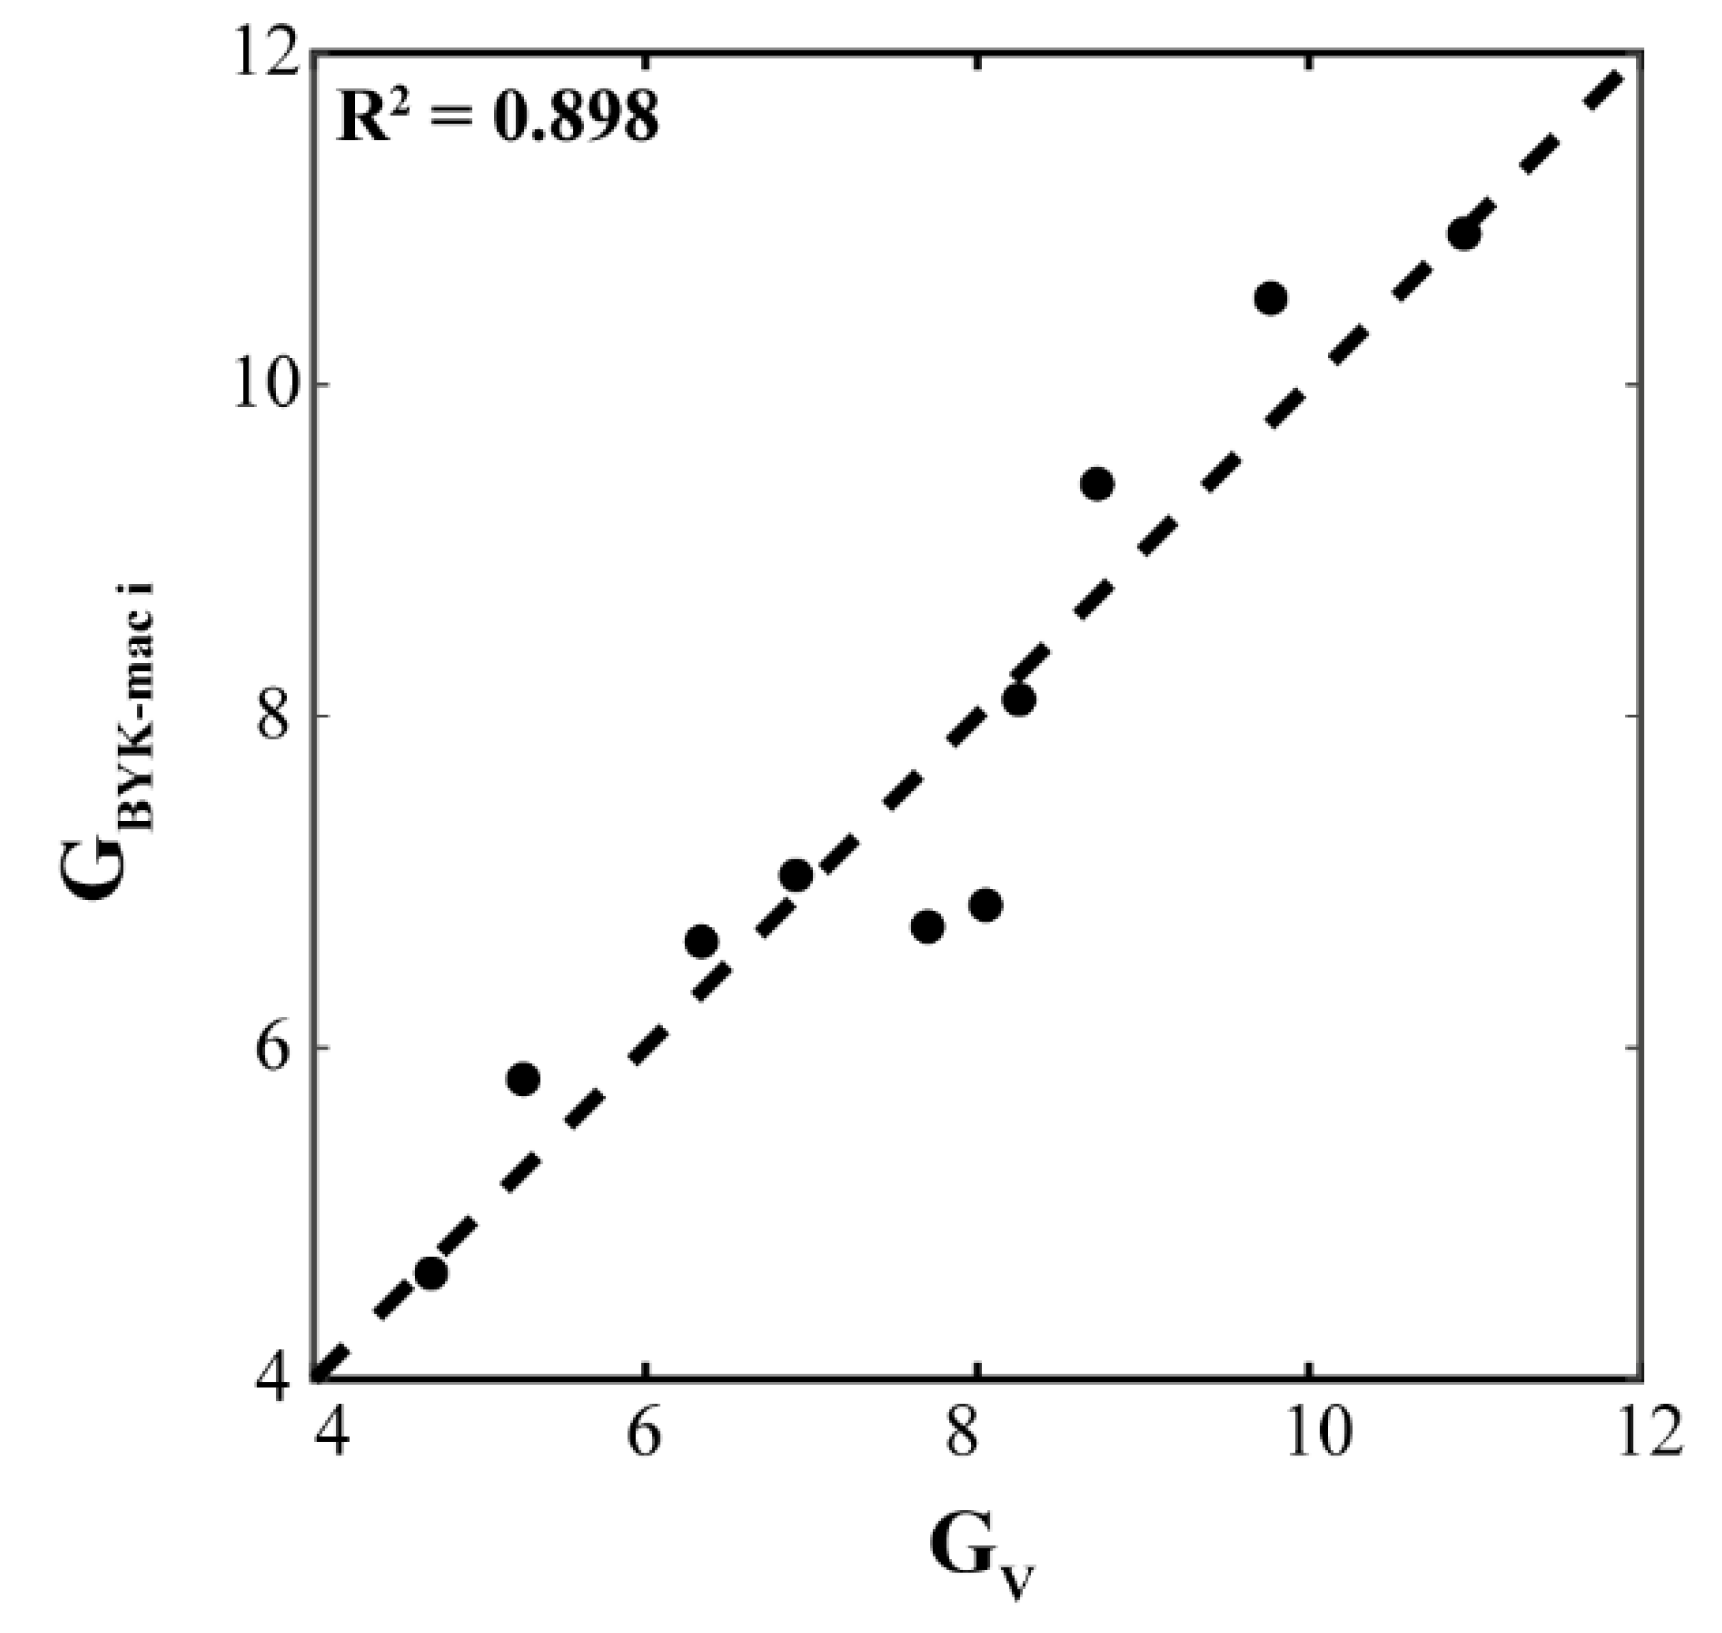
Figure 4 shows a graph of the visual scale (G
V), which once again plotted instrumental graininess (G). As seen in
Figure 4, a linear correlation appeared between both magnitudes. Equation (5) presents the obtained linear fit. In this case, a correlation coefficient of R
2 = 0.898 was obtained. It would have been desirable to obtain a coefficient above 0.9 when dealing with linear adjustment. However, a slope near the unit was obtained, as was an order at the origin of around 0, which indicated that the correlation between both magnitudes was very good.
However, it is worth mentioning that the chosen psychophysical experiment was one of the simplest and was not designed to obtain a similar scale to other more complex algorithms. Therefore, after considering these results, we can state that the instrumental scale, that is, the algorithm designed by the company BYK Gardner, quite well fitted the perception of this texture attribute (graininess) by the human visual system.
The results of the paired-comparison method are shown below. This experiment involved comparing 10 samples per pair in all the possible combinations to, thus, evaluate which member of the pair had more graininess. The experiment was repeated 3 times per observer, which meant that 78 measurements/judgments were recorded.
Table 2 represents the raw experimental data and shows the number of times a sample was preferred in a pair. For example, sample 1 was chosen 77 times compared to sample 2.
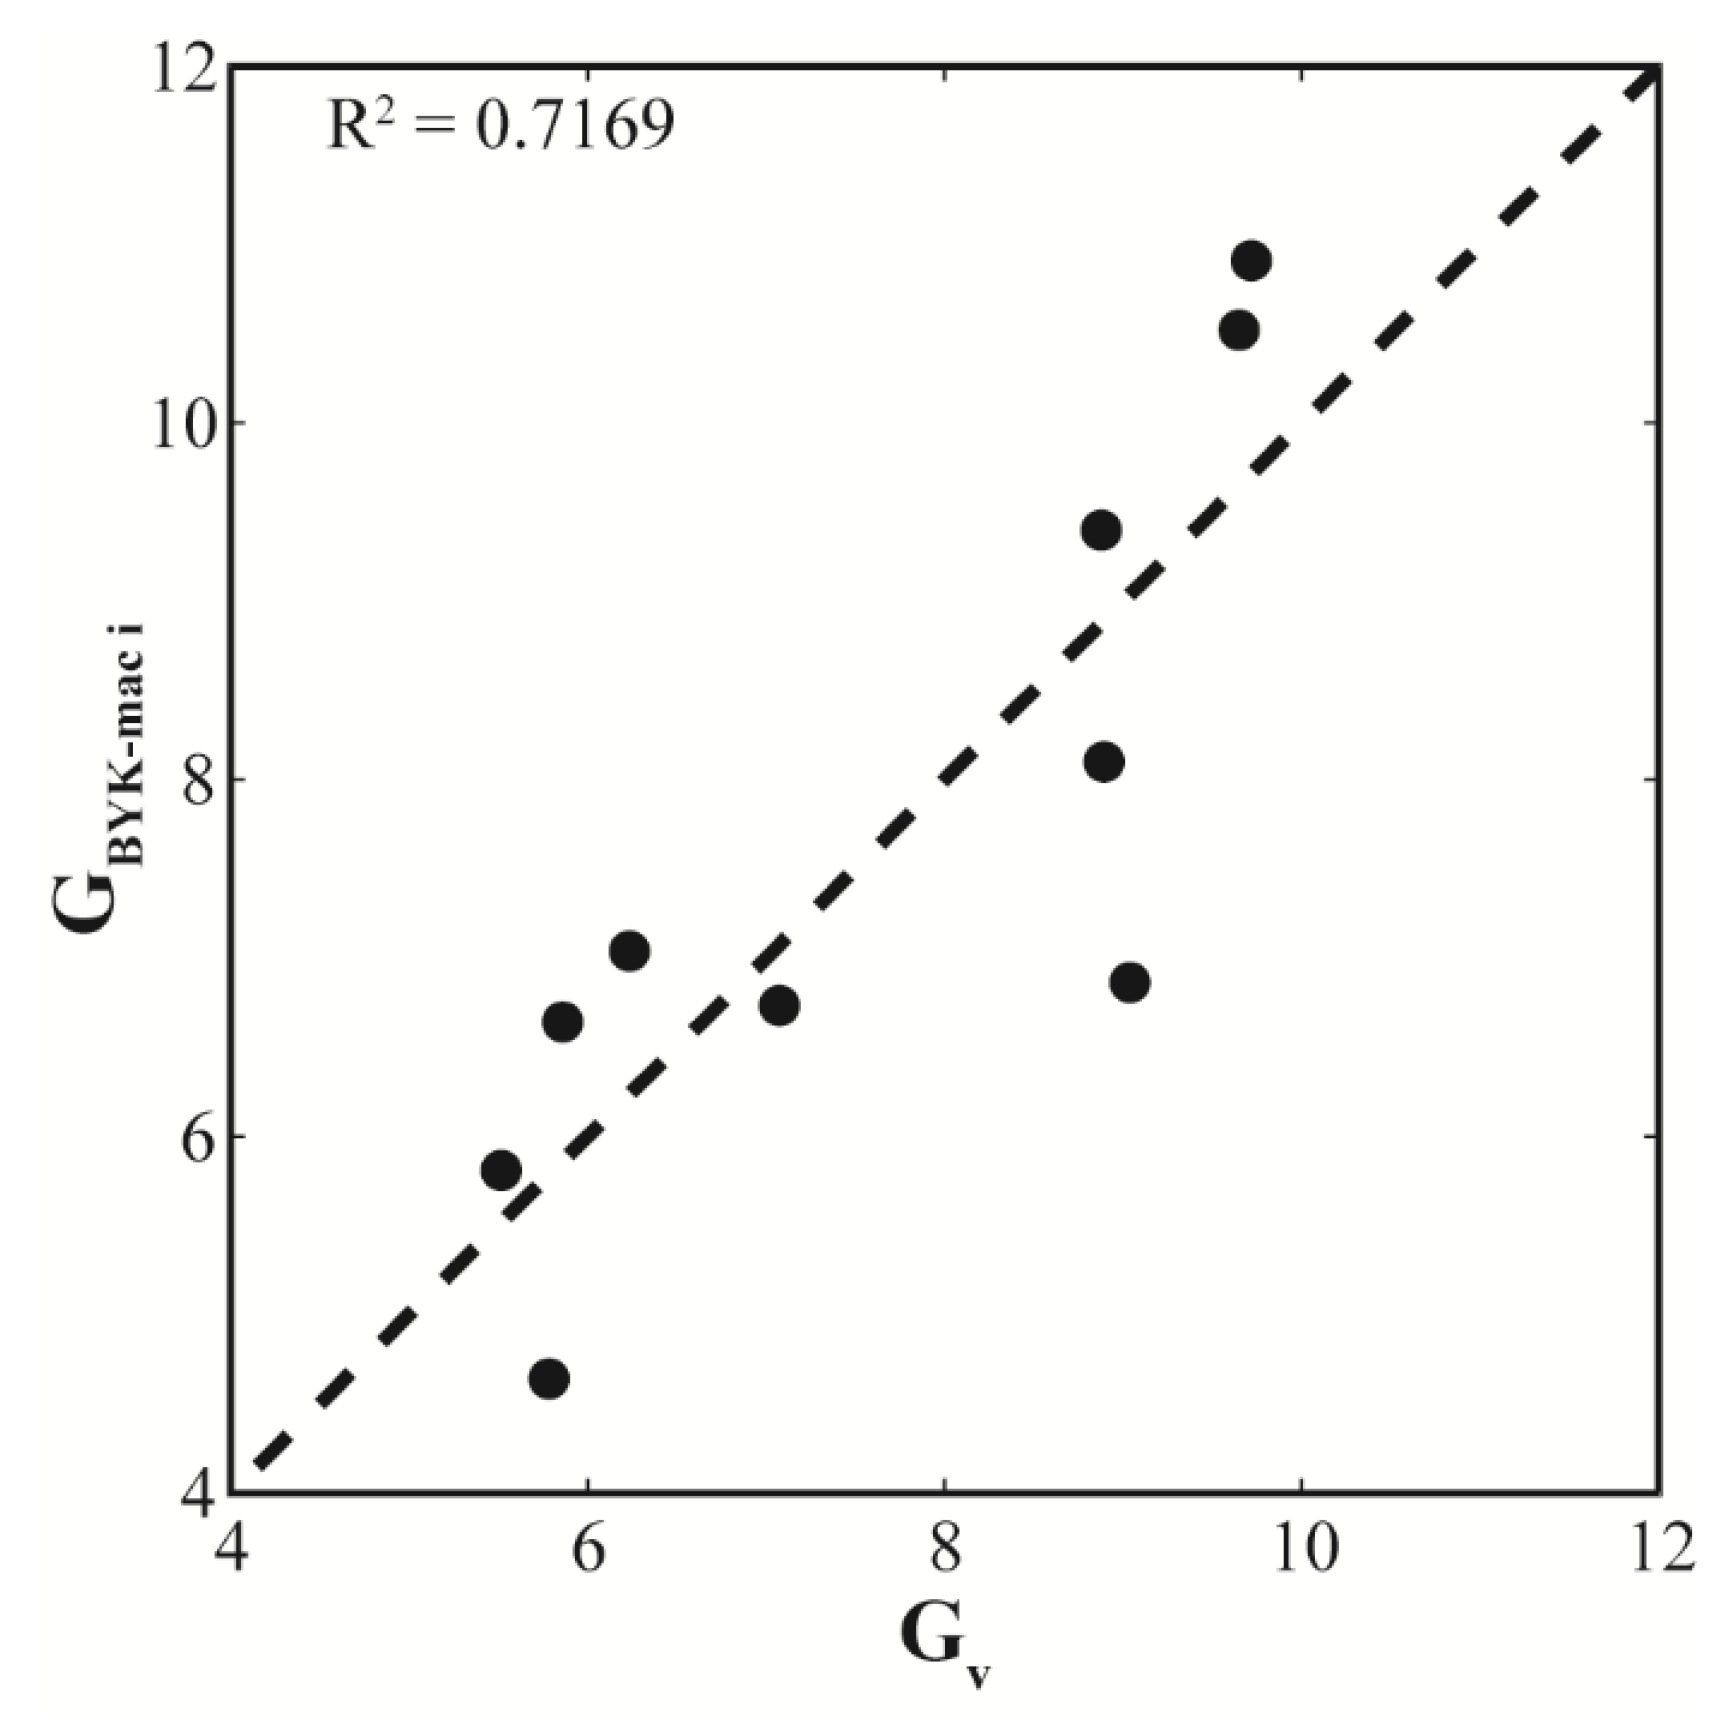
By applying Equation (3), it was possible to obtain the visual scale for the graininess attribute. Likewise, the agreement between the instrumental and visual scales was checked. As seen in
Figure 5, a low correlation coefficient appeared after taking into account the linear adjustment because, in this case, the correlation coefficient was R
2 = 0.7169. Equation (6) presents the obtained linear fit.
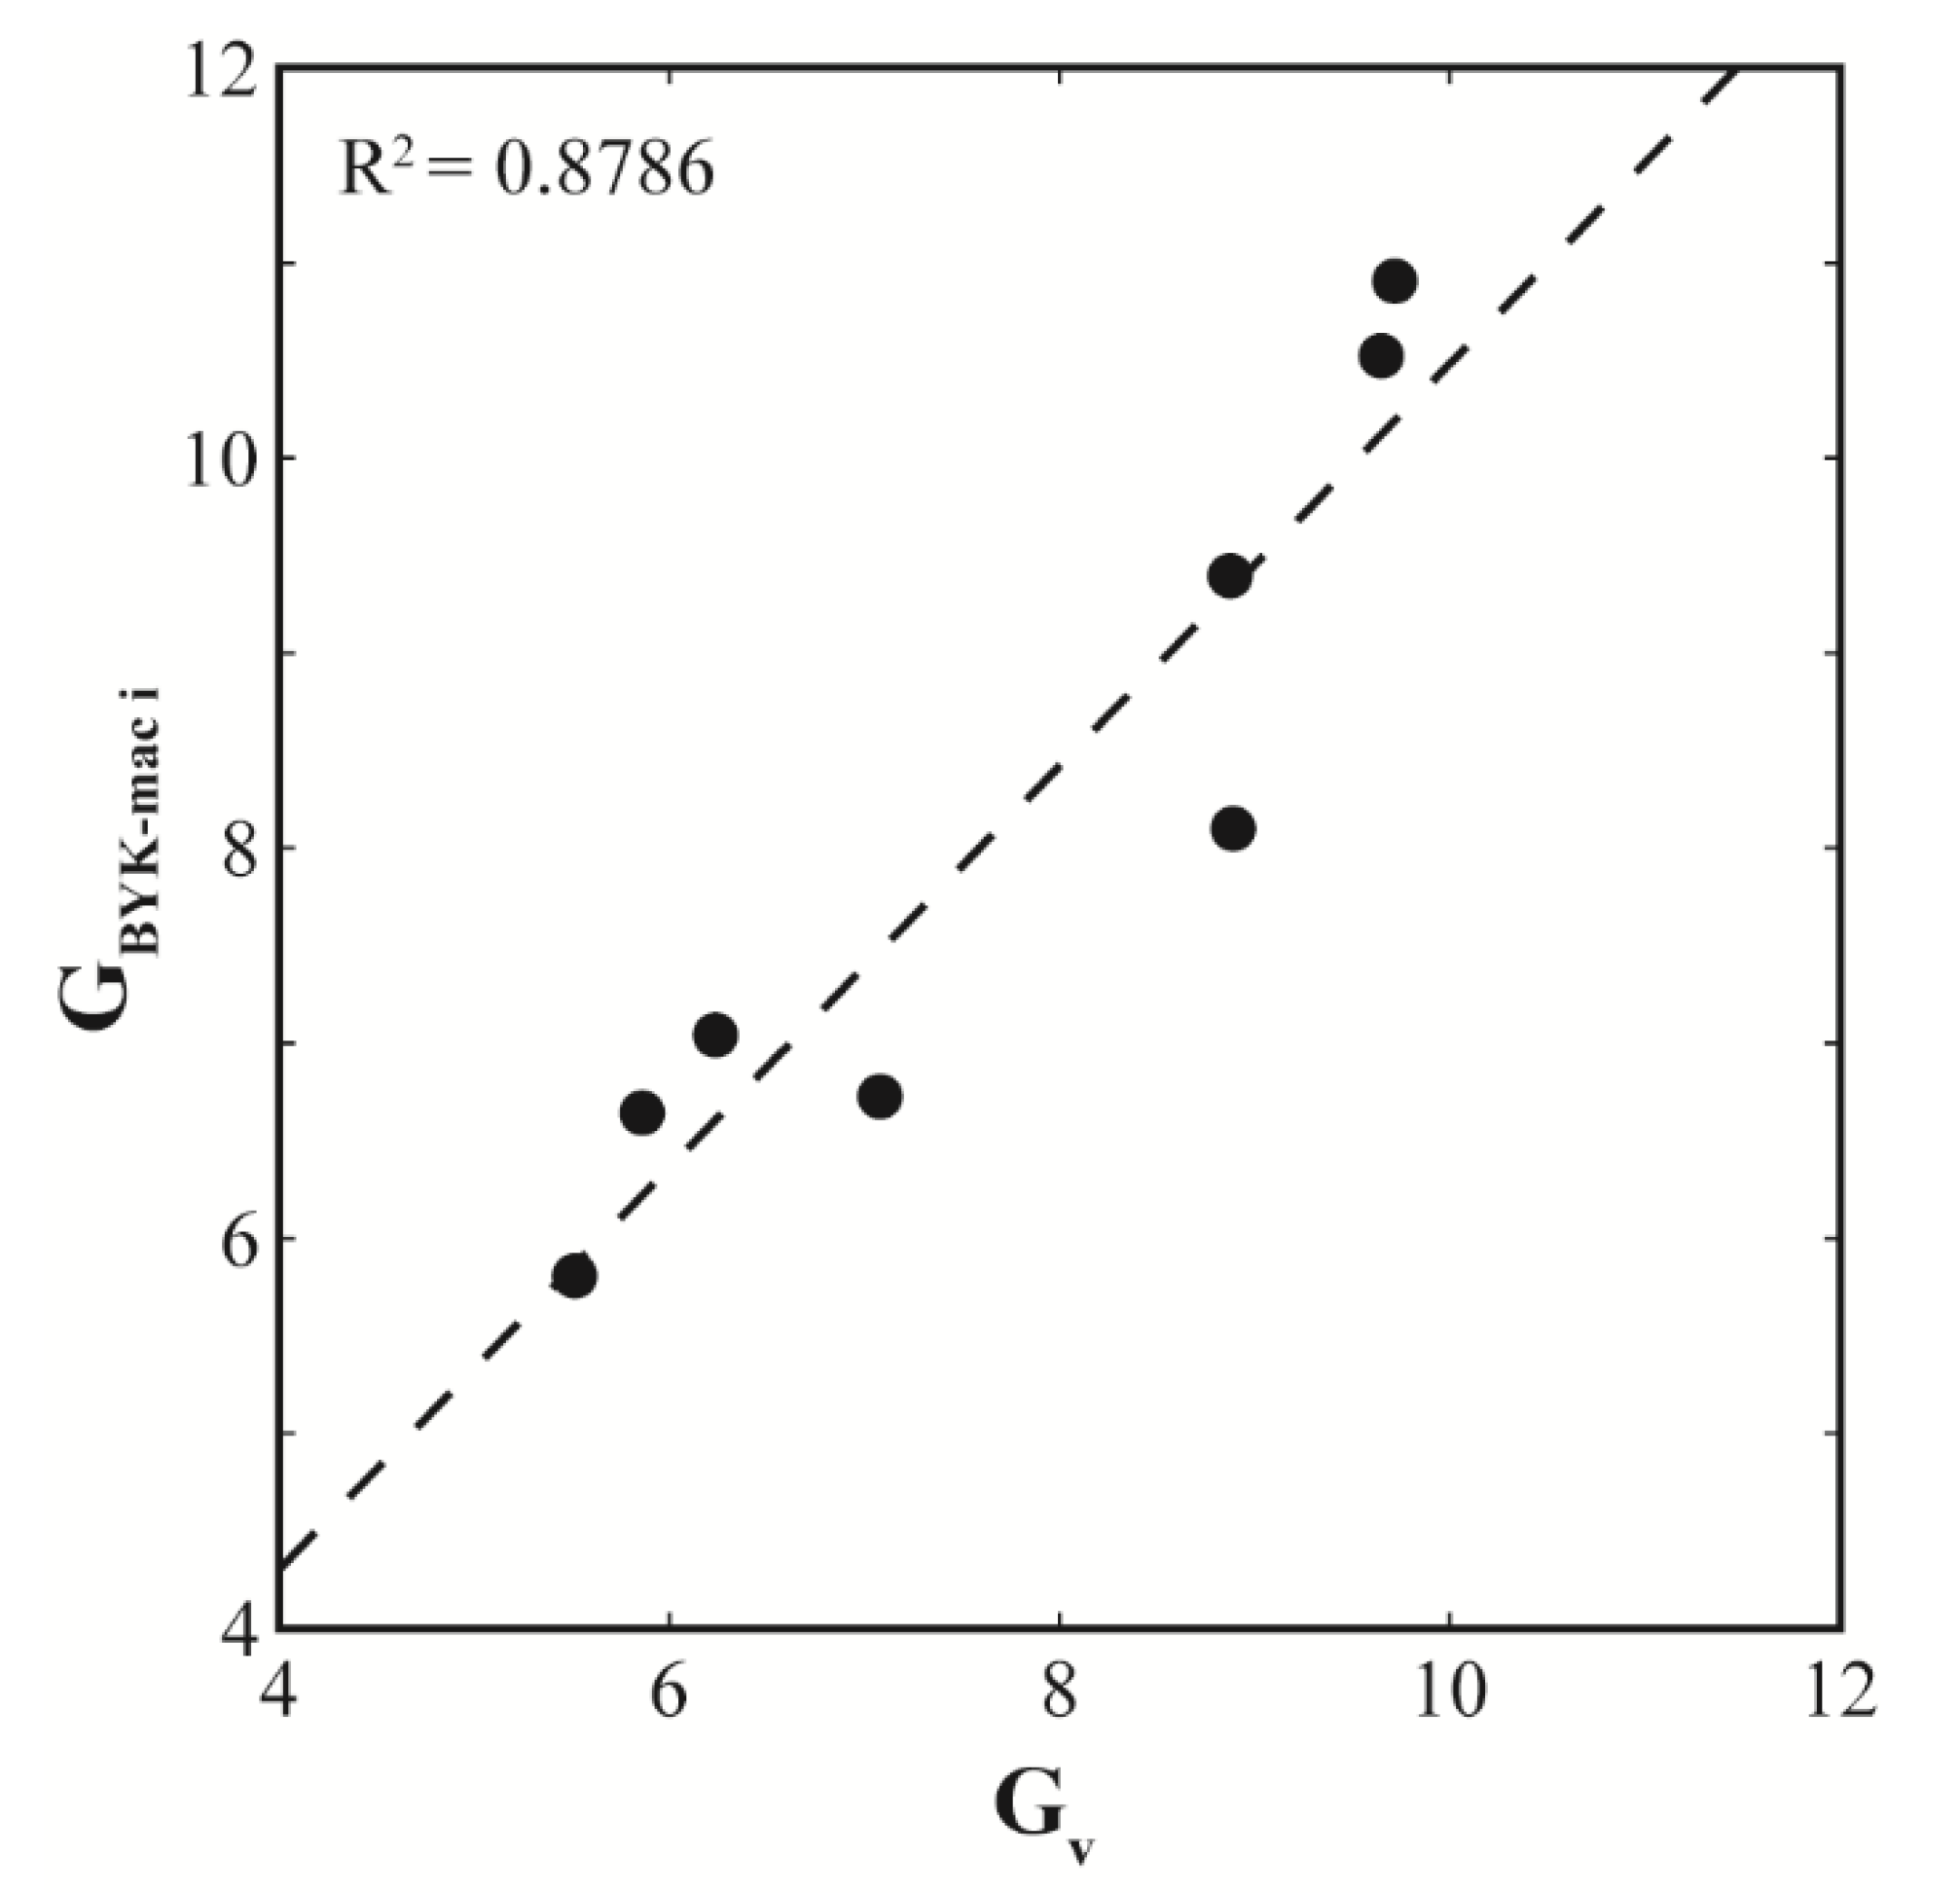
After checking the results, samples 1 and 2 were evaluated by the observers to have more graininess than the graininess that the instrument claimed these samples actually had. These samples’ main characteristic was their high lightness value (L*). In the first method, the observers were instructed to place the stimuli in order according to the graininess attribute, then an indirect comparison was made. However, in the pair-comparison method, a direct comparison was made because the observers were asked to indicate which member of the pair had more graininess by showing all the possible pairs of samples. Therefore, when the observers were able to directly compare samples, their judgment can be influenced by the lightness perception, which is why judgments differed from the rank-order evaluation. As a first assumption could be that the instrument underestimated the graininess value for those samples with high lightness, the correlation was studied without considering these two samples.
Figure 6 depicts the new linear adjustment, which shows how the correlation coefficient increased and an improvement was established in the linear correlation of both magnitudes. In this case, the correlation coefficient was R
2 = 0.8786. Once again, a slope near the unit was obtained, as was an order at the origin of around 0, which means that the correlation between both magnitudes was good.
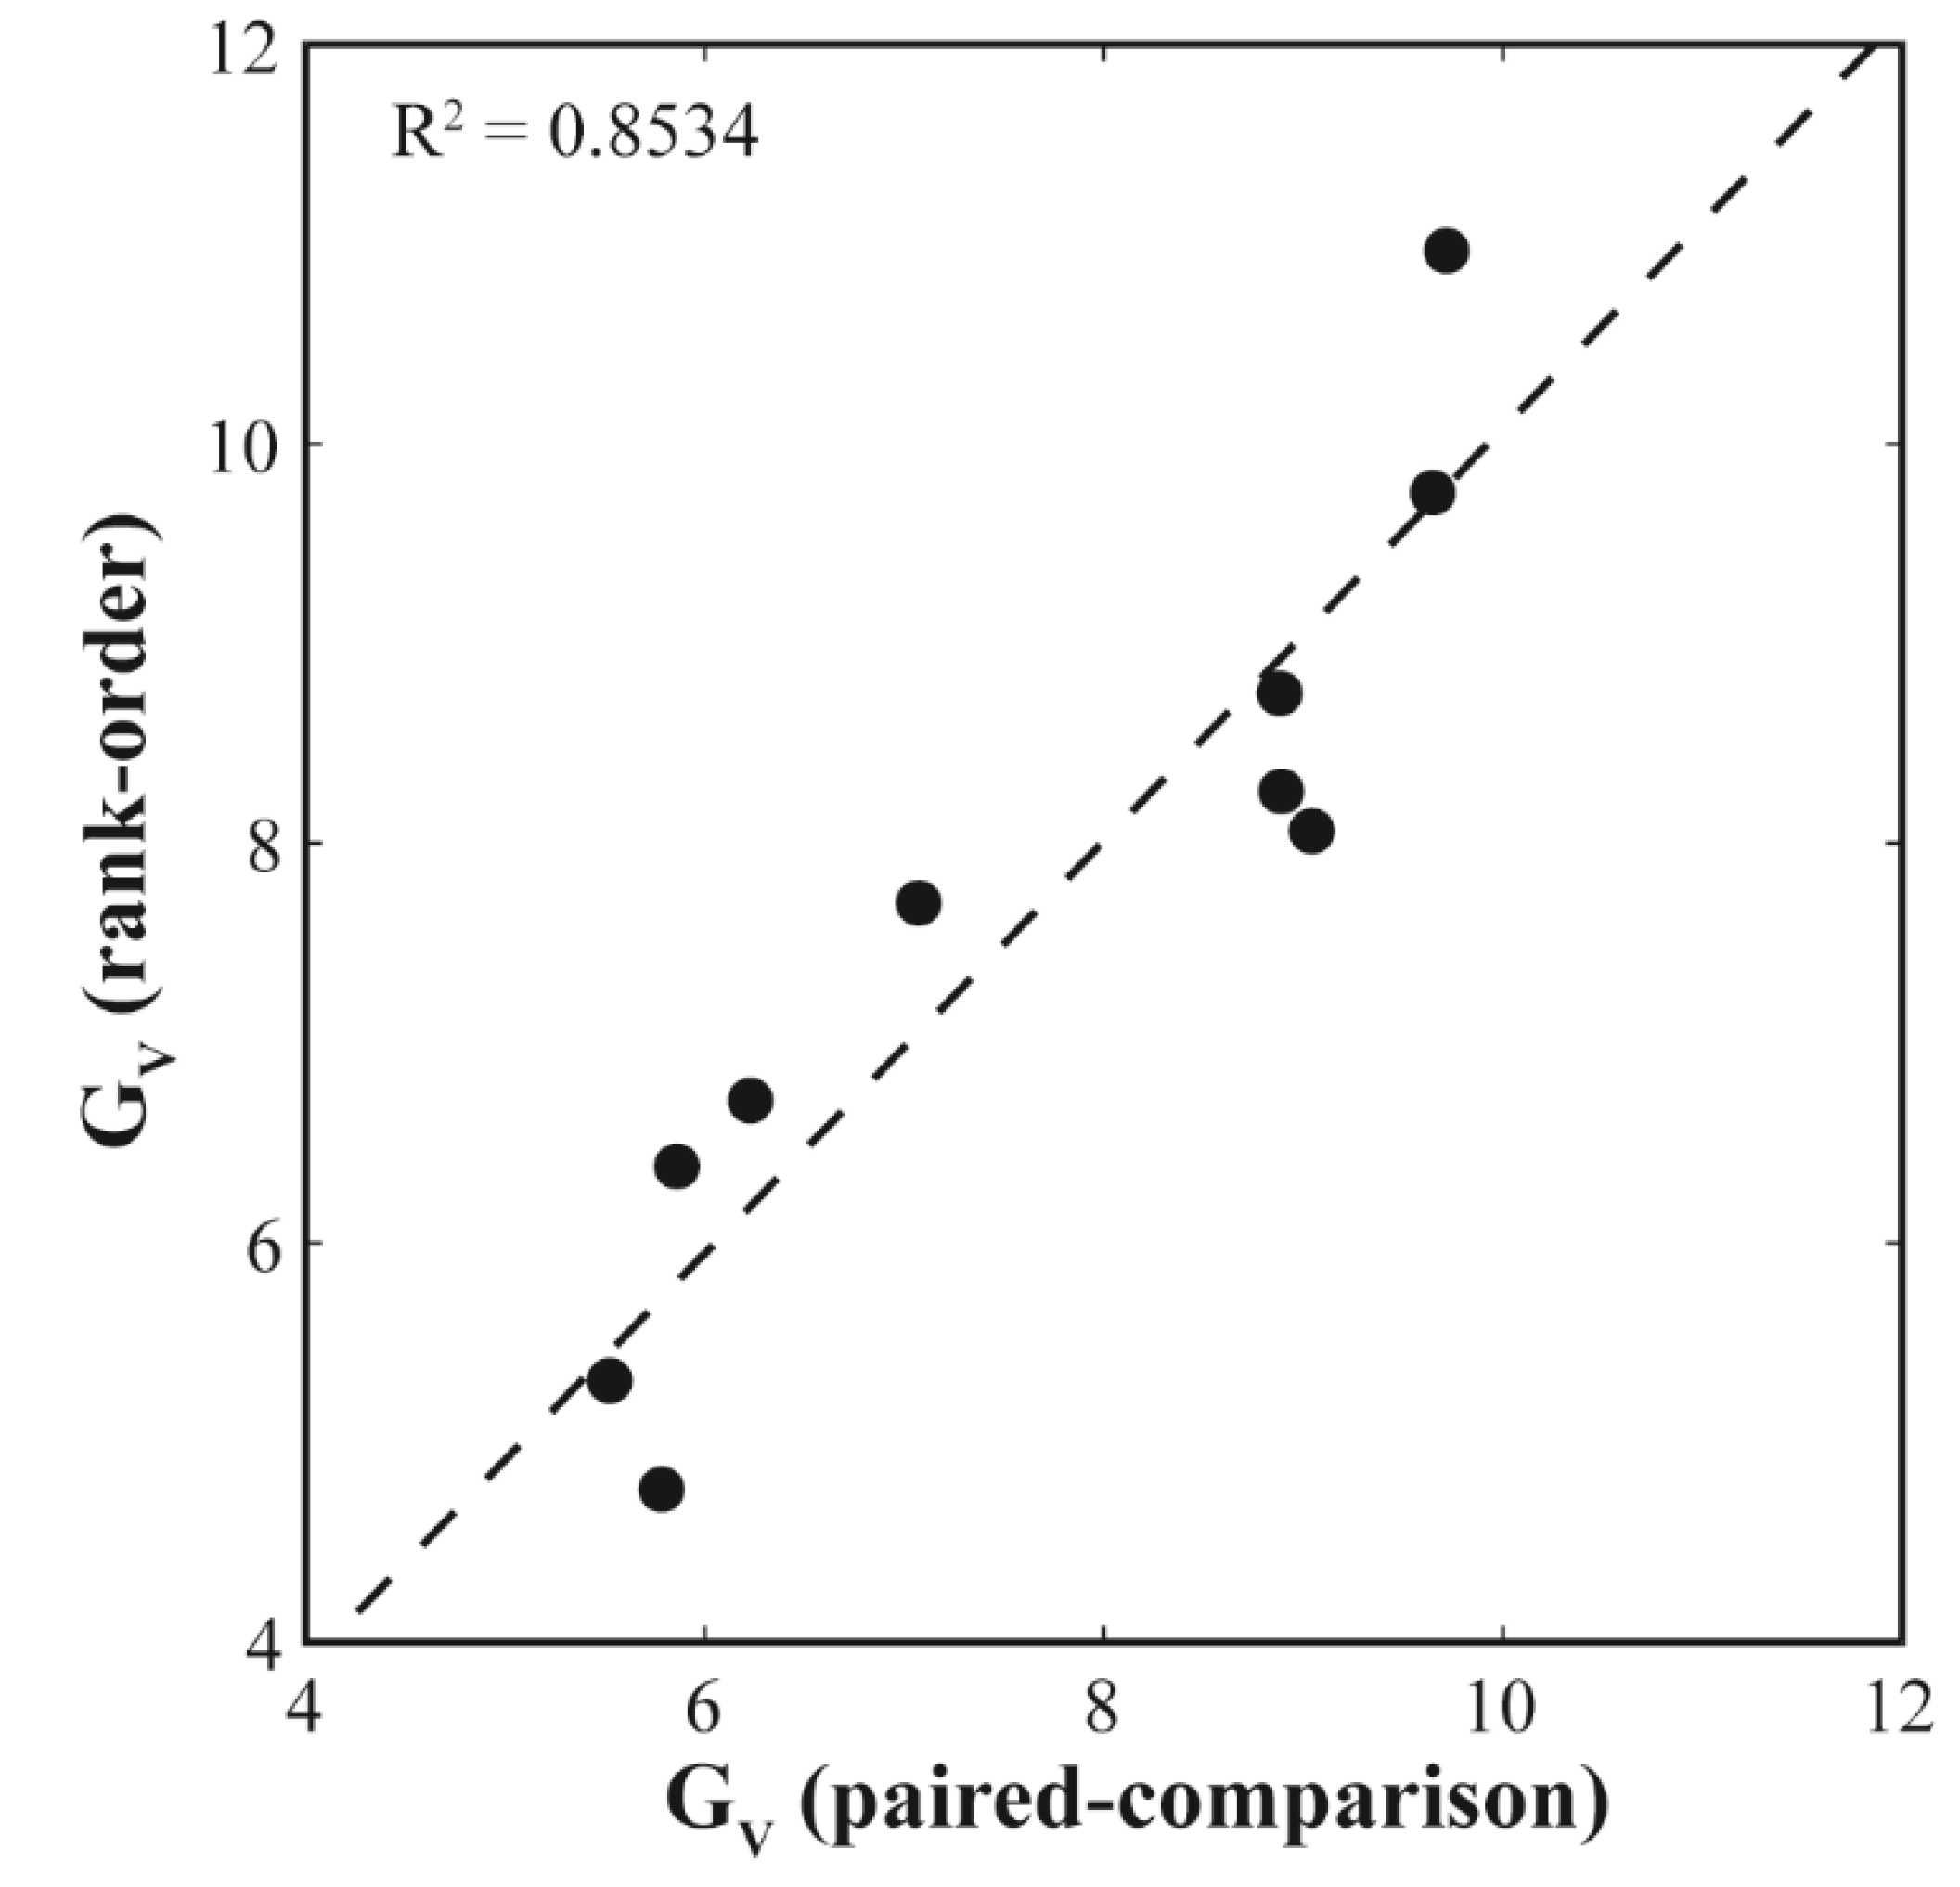
The agreement reached between the visual scales obtained from both methodologies was studied.
Figure 7 shows the correlation between both scales. In this case, the found correlation was good with a correlation coefficient close to 0.9.
These results guaranteed the reliability of both psychophysical methods to determine the graininess scale, despite them being basic methods for this purpose and, in both cases, because more specific algorithms exist to determine scales, such as the magnitude estimation method or the multidimensional scaling algorithm.
4. Discussion
This work analyzed the graininess attribute by a commercial instrument, the multi-angle spectrophotometer (BYK-mac i), to check if a correlation would appear through the visual perception of this attribute. The visual perception of this attribute was evaluated by two different psychophysical experiments: the rank-order method and the paired-comparison method. After analyzing all the results of both methodologies and obtaining the visual scale, a good correlation between both magnitudes was verified by the first method, which guaranteed the good quality control of these materials if the instrument is taken into account, because it represents a good degree of graininess perceived by the human visual system. A correlation appeared between both magnitudes with the second method, but it was much lower than with the first method. For the samples with high lightness values, the instrument provided lower graininess values than those visually perceived. To ensure that what actually occurred in the second method was true, it would be necessary to repeat the same method with more observers or to estimate the graininess scale by other psychophysical methods.
Therefore, the present work allows us to state that the instrumental measurements made by the BYK-mac multi-angle spectrophotometer guarantee good quality control of such materials because of the high correlation with the visually perceived graininess values. However, in view of the results, future lines will continue this work. It is desirable to firstly increase the number of observers and to choose another set of samples to confirm the found results, and secondly to select other techniques designed for scaling magnitudes, e.g., multidimensional scaling (MDS), to define a graininess scale with more rigor and reliability.
Finally, both experimental methodologies provide useful results because of the reasonable correspondence between them. This correspondence among different experimental approaches to evaluate the same perceptual attribute is a good guarantee to accept the results as being valid, which is the main problem with psychophysical experiments.


