Article

Molecular Dynamics Simulations of DNA Adsorption on Graphene Oxide and Reduced Graphene Oxide-PEG-NH2 in the Presence of Mg2+ and Cl ions

by
Sebastian Muraru
1,
Cosmin Gabriel G. Samoila
2,
Emil I. Slusanschi
2,
Jorge S. Burns
1,3 and
Mariana Ionita
1,*
1
Faculty of Medical Engineering, University Politehnica of Bucharest, Gh Polizu 1-7, 011061 Bucharest, Romania
2
Computer Science Department and Engineering, Faculty of Automatic Control and Computers, University Politehnica of Bucharest, 060042 Bucharest, Romania
3
Laboratory of Cellular Therapies, Department of Medical and Surgical Sciences for Children & Adults, University Hospital of Modena and Reggio Emilia, 41121 Modena, Italy
*
Author to whom correspondence should be addressed.
Coatings 2020, 10(3), 289; https://doi.org/10.3390/coatings10030289
Submission received: 6 February 2020 / Revised: 8 March 2020 / Accepted: 13 March 2020 / Published: 20 March 2020
(This article belongs to the Special Issue Advances in Graphene Based Composite for Bio-Applications)

Abstract

:
Graphene and its functionalised derivatives are transforming the development of biosensors that are capable of detecting nucleic acid hybridization. Using a Molecular Dynamics (MD) approach, we explored single-stranded or double-stranded deoxyribose nucleic acid (ssDNA or dsDNA) adsorption on two graphenic species: graphene oxide (GO) and reduced graphene oxide functionalized with aminated polyethylene glycol (rGO-PEG-NH2). Innovatively, we included chloride (Cl) and magnesium (Mg2+) ions that influenced both the ssDNA and dsDNA adsorption on GO and rGO-PEG-NH2 surfaces. Unlike Cl, divalent Mg2+ ions formed bridges between the GO surface and DNA molecules, promoting adsorption through electrostatic interactions. For rGO-PEG-NH2, the Mg2+ ions were repulsed from the graphenic surface. The subsequent ssDNA adsorption, mainly influenced by electrostatic forces and hydrogen bonds, could be supported by π–π stacking interactions that were absent in the case of dsDNA. We provide a novel insight for guiding biosensor development.

1. Introduction

Graphene represents a flat honeycomb lattice monolayer of sp2-hybridized carbon atoms with exceptional electronic, magnetic, optical, mechanical and thermal properties [1,2,3]. Consequently, graphene and its derivatives were found to be useful in a wide array of applications with advantages such as low fabrication costs, fast detection times and point-of-care functionality [4]. In particular, biosensors incorporating oligonucleotide aptamers were designed for prompt, sensitive and specific detection of genetic target molecules [5,6] to be used in lieu of conventional RT-qPCR gene expression assays in situations requiring portability and minimum output time. However, the commercial development of graphene/oligonucleotide-based biosensors has been relatively slow to date, in part reflecting the variation in fabricated graphene flake products, the need for rigorous quality standards for the diverse forms of graphene and its derivatives [7,8] and headlining a need for a better understanding of the interaction mechanisms occurring between the molecules of interest.
In the case of graphene oxide (GO), the original concept behind nucleic acid biosensor development relies on the preferential binding of single-stranded DNA (ssDNA) as compared to double-stranded DNA (dsDNA). Typically, when a ssDNA aptamer hybridizes with a complementary DNA molecule (cDNA) to form a duplex, the inner bases become shielded by the negatively charged phosphate backbone. The resulting charge repulsion lowers the binding affinity of the dsDNA to the negatively charged oxygen atoms on the GO surface. Both experimental and computational studies have investigated the different aspects regarding the effect of using nucleic acids and different graphenic molecules [9,10,11,12,13]. Experimental studies showed that both Mg2+ ions and functionalized derivatives of graphene, in particular an aminated polyethylene glycol-functionalized reduced graphene oxide (rGO-PEG-NH2), markedly influenced detection of DNA hybridization [12,13]. Previous computational studies investigated the mechanism of adsorption between DNA molecules and graphene only in the presence of Na+ ions and indicated it is governed by π–π stacking between the aromatic rings of the graphene layer and the exposed bases of the oligonucleotides, hydrogen bonds and electrostatic interactions [9,10,11].
Molecular Dynamics (MD) simulations can provide sophisticated information regarding molecular interactions at a nano-perspective, currently unachievable by other means. Here, we aimed to advance the existing MD studies regarding the dynamic process of oligonucleotide adsorption on GO [9,10,11], for both the ssDNA and dsDNA molecules, that have yet to assess the influence of ions and further graphene derivatives in a more complex milieu due to the addition of ions. Thus, we provide a computational nano-perspective with the purpose of generating new insights to help explain and complement experimental observation.
Therefore, we explored the dynamic process of the adsorption of ssDNA and dsDNA on GO and rGO-PEG-NH2 under the influence of Mg2+ and Cl ions to better understand their impact [12,13]. Notably, we confirmed that for GO, the addition of Mg2+ ions critically contributed to dsDNA adsorption and provided an atomistic perspective for the adsorption process. However, for rGO-PEG-NH2, the PEG chains interfered with the ability of the Mg2+ ions to act as a bridge between the negatively charged phosphate groups of the oligonucleotide backbone and the rGO-PEG-NH2 graphenic surface. Insights from MD data regarding how the key parameters specific to different functionalized forms of graphene and ionic contexts may influence oligonucleotide interactions can guide rational biosensor design.

2. Materials and Methods

2.1. Generation of the DNA Molecules

For both the double-stranded and single-stranded DNA molecules we used the Dickerson–Drew dodecamer [14] with the following sequence, 5‘-CGCGAATTCGCG-3’, which has been extensively used in similar MD studies [9,10,11,15]. The choice was motivated from an aim to advance the results of previous studies [9,10,11] with direct comparison to their findings. The double-stranded B-DNA structure was generated using the Nucleic Acid Builder (NAB), part of the AmberTools18 package [16], and converted into GROMACS [17] topology using the tools Leap and Parmed, components of AmberTools18. Visual representations of the two DNA molecules are presented in Figure 1.

2.2. Generation of the Graphene Topologies

The two graphenic species were built stepwise, as shown in Figure 2. Initially, a pristine 5.0 nm × 6.5 nm graphene layer was generated in an armchair configuration using the NanoTube plugin of the visual molecular dynamics (VMD) suite [18], totalling 988 carbon atoms. Parameters for the carbon atoms were taken from previous studies [9,10] and the aromatic carbon (CA) present in Amber force fields. Thus, the carbon atoms belonging to the graphene molecule were considered uncharged Lenard–Jones (LJ) spheres with a cross section σ = 0.34 nm; a potential well depth ε = 0.36 kJ mol−1; C–C bond length of 1.42 Å; C–C–C bending angle of 120°; and C–C–C–C planar angles maintained by harmonic potentials with spring constants of 322.55 kcal mol−1 A-2, 53.35 kcal mol−1 rad−2 and 3.15 kcal mol−1 [9,10], respectively.
Subsequently, the GO species was generated with the formula C10O1OH1COOH0.5, meaning that for every twenty carbon atoms present in the pristine graphene layer, one carboxyl group was added on the edges, and for every ten carbon atoms present in the pristine graphene layer, one epoxy and one hydroxyl group were added on the surface of the new GO layer. The formula reflects a typical and likely outcome of the oxidation process [19], leading to a C/O ratio of 1.9, making it compatible with GO flakes synthesized through a modified Hummer’s oxidation method [20]. A total of 988 carbon atoms formed the graphene layer, and 487 atoms formed the functional groups. All functional groups were added in a random manner, both above and below their corresponding surface. Parameters and charges for the epoxy, carboxyl and hydroxyl groups adopted existing Amber parameters for glutamic acid, dialkyl ether and serine [9,10].
The rGO-PEG-NH2 species was built according to the manufacturer’s description [21] by randomly removing two-thirds of all carboxyl groups present in the GO species and replacing all of the epoxy and hydroxyl groups with -NH-PEG-NH2 chains. The chemical formula used for the chain molecules was –NH-(C2H4O)2-NH2. For a graphical representation, see Supplementary Figure S1. Thus, the generated model contained 988 carbon atoms forming the graphene layer and 2196 atoms forming the functional groups. Initially, the geometry of a chain was optimised according to the Universal Force Field [22]. Charges were then obtained through Antechamber using the AM1-BCC charge model, while considering the PEG molecule to be electrically neutral and the NH2 group as having a positive +1 charge. Atom types for the –NH-(C2H4O)2-NH2 chains were assigned manually from the parmbsc1 force field [23].

2.3. Simulation Parameters

All simulations were run using GROMACS 2018.5 and the Parmbsc1 force field [23]. Given that most force fields are parametrised for the dsDNA molecules with inner hydrophobic bases shielded away from most interactions by the outer hydrophilic backbones [10], the parameters were unaltered. For ssDNA, the force field in use was modified according to a previous study [24] to better suit ssDNA interactions. The Mg2+ ions were characterised by σ = 1.41 × 10⁻¹ nm and ε = 3.74 kJ mol−1, whereas the Cl ions were characterised by σ = 4.40 × 10⁻¹ nm and ε = 4.18 × 10⁻¹ kJ mol−1.
Three different set-ups were considered: (1) GO with Mg2+ and Cl ions, (2) rGO-PEG-NH2 with Mg2+ and Cl ions and (3) rGO-PEG-NH2 with Cl, but without Mg2+ ions (Note: For the third set-up see Supplementary Material). All set-ups used both dsDNA and ssDNA. The net charges of the systems were neutralized using either Mg2+ or Cl ions. The specific ion information for each simulation is available in Supplementary Table S1.
All setups were solvated inside a 7.5 nm × 8.5 nm × 13 nm cubical box and contained roughly 80,000 atoms. The water model used was TIP3P. The initial position of the graphene layer was parallel to the x–y plane. All carbon atoms constituting the graphene layer were positionally restrained with a spring constant of 1000 kJ mol−1 nm−2 in all three directions throughout the whole simulation. The DNA molecules were placed at a distance of 2–4 nm from the graphene layer in a parallel orientation. Each simulation was performed in triplicate, changing the initial orientation of the DNA molecule each time. Although the intermediary steps were not necessarily identical, the initial conditions and the final outcome were consistently similar. SETTLE and LINCS algorithms were used for constraining bond lengths, and periodic boundary conditions were applied in all three directions. For long-range electrostatic interactions, Particle Mesh Ewald (PME) was used. The Coulomb and van der Waals (VdW) cut-off values were set at 1.4 nm.
The steepest descent algorithm was used for energy minimisation. Following energy minisation, an NVT equilibration was performed for 500ps using the modified Berendsen thermostat V-rescale at 310K to bring the system at the usual human body temperature (37°C). During this step, both the DNA atoms and the atoms making up the graphene layer were positionally restrained as previously described. This allowed the ions to reposition themselves from their initial random generation with gmx genion, while the distance between the DNA and graphene molecules remained constant. Production was run under NPT conditions using the Berendsen thermostat at 310K, a pressure of 1 bar for 300 ns with a step size of 2 fs and using the LeapFrog algorithm. Simulations were run on a Linux (CentOS) machine equipped with 2x Intel Xeon CPU E5-2670 v2 @ 2.50GHz and 2x Nvidia Tesla K40m GPUs.

2.4. Data Analysis Methods

To help interpret interaction phenomena throughout the MD simulations, we compiled graphs for the following; (I) electrostatic interactions between the DNA molecule and the graphene molecule (including functional groups); (II) van der Waals (VdW) interactions between the same two molecules; (III) Σ interaction energy as the sum between the previous two values to determine whether the two molecules attract or repel each other (only for GO as graphs I and II displayed comparable values of opposite signs); (IV) the number of hydrogen bonds formed between the two molecules; (V) the contact surface area (CSA), defined as half the difference between the sum of the solvent accessible surface areas (SASA) of the DNA molecule and the graphene molecule and the SASA of the DNA – the graphene complex, as displayed in the formula below,
( S A S A DNA + S A S A Graphene ) S A S A DNA : Graphene 2
(VI) the distance between the centre of the geometry of the DNA backbone and the centre of the geometry of the carbon atoms constituting the graphene layer, calculated using the RMSD module of the MDAnalysis package [25,26], taking into account only the Z-coordinates of the two geometrical centres; (VII) the angle formed by the two structures, calculated using the cosine rule after performing linear regression on the XZ coordinates of the atoms composing the backbone of the DNA molecule and the carbon atoms of the graphene molecule; (VIII) π–π stacking interactions between the two molecules; (IX) electrostatic interactions between the DNA molecule and the Mg2+ ions situated within 1.4 nm of both the DNA and graphene molecules.
We used gmx energy for energy extraction and gmx hbond for hydrogen bond calculations. The hydrogen donor acceptor (H-D-A) cut-off angle for hydrogen bond identification was set at 30° and the H-A cut-off radius was set at 0.35 nm. π–π stacking was determined using a script developed in-house, which makes use of the MDAnalysis package. The criteria used to determine the occurrence of π–π stacking [27] was as follows. (1) The minimum distance between any pair of heavy atoms in the two rings had to be less than 0.4 nm; (2) the distance between the centre of mass of each rings had to be less than 0.5 nm; (3) the angle described by the normal to the planes of the two rings had to take values between 0 and 45° and 135 and 180°. Additionally, we also consider angles with values of 90° ± 10°. For determining dynamic indices, we used gmx select. For the distance and angle parameters, in-house scripts were developed. Xmgrace was used for plotting graphs. Scripts are available at https://github.com/Iourarum/GO-Py (Accessed on 5 March 2020).

3. Results and Discussion

3.1. Single-Stranded DNA Adsorption on GO in the Presence of Mg2+ and Cl Ions

After the equilibration step, Mg2+ ions were found adsorbed on the GO surface, near oxidised functional groups or associated with the oligonucleotide negatively charged backbone. Cl ions could also interact closely with the DNA molecule and influence its behaviour through electrostatic interactions. Divalent Mg2+ ions effectively blanketed the negatively charged oxygen atoms present on the GO surface (see Supplementary Figure S2) and helped stabilize the tertiary structure of the ssDNA molecule. No such specific pattern of distribution was observed in the case of the Cl ions. These results were consistent with simulations, indicating that a low-mobility layer of counterions could compensate for the graphenic surface charge and influence oligonucleotide interaction [28].
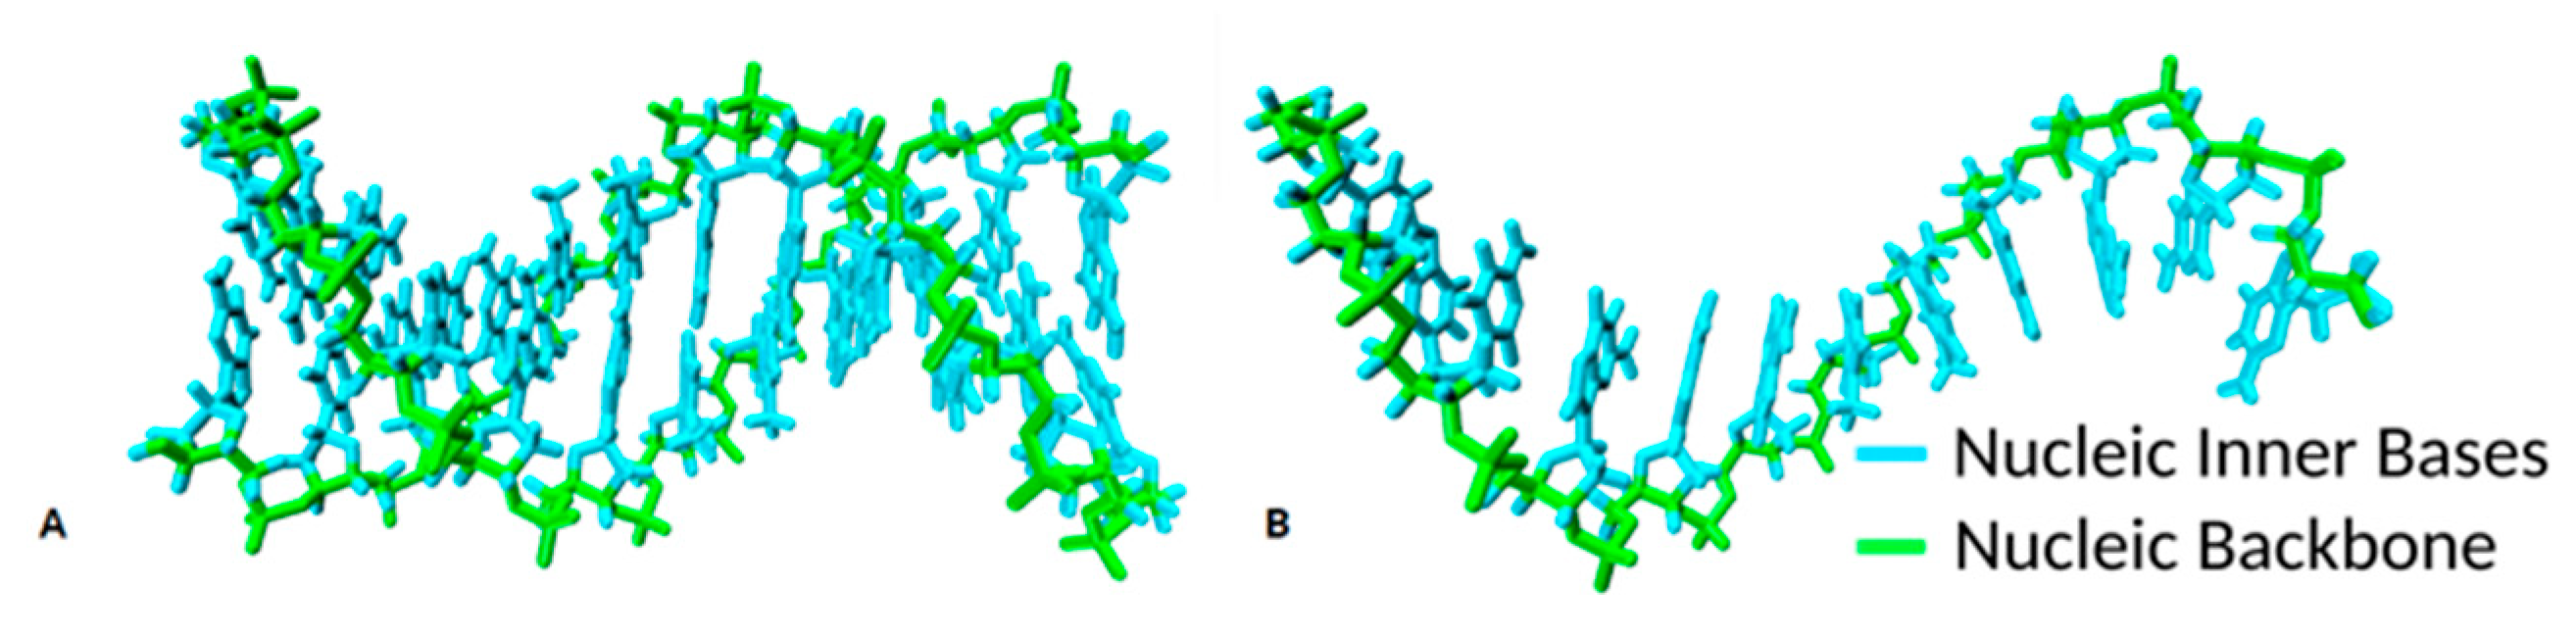
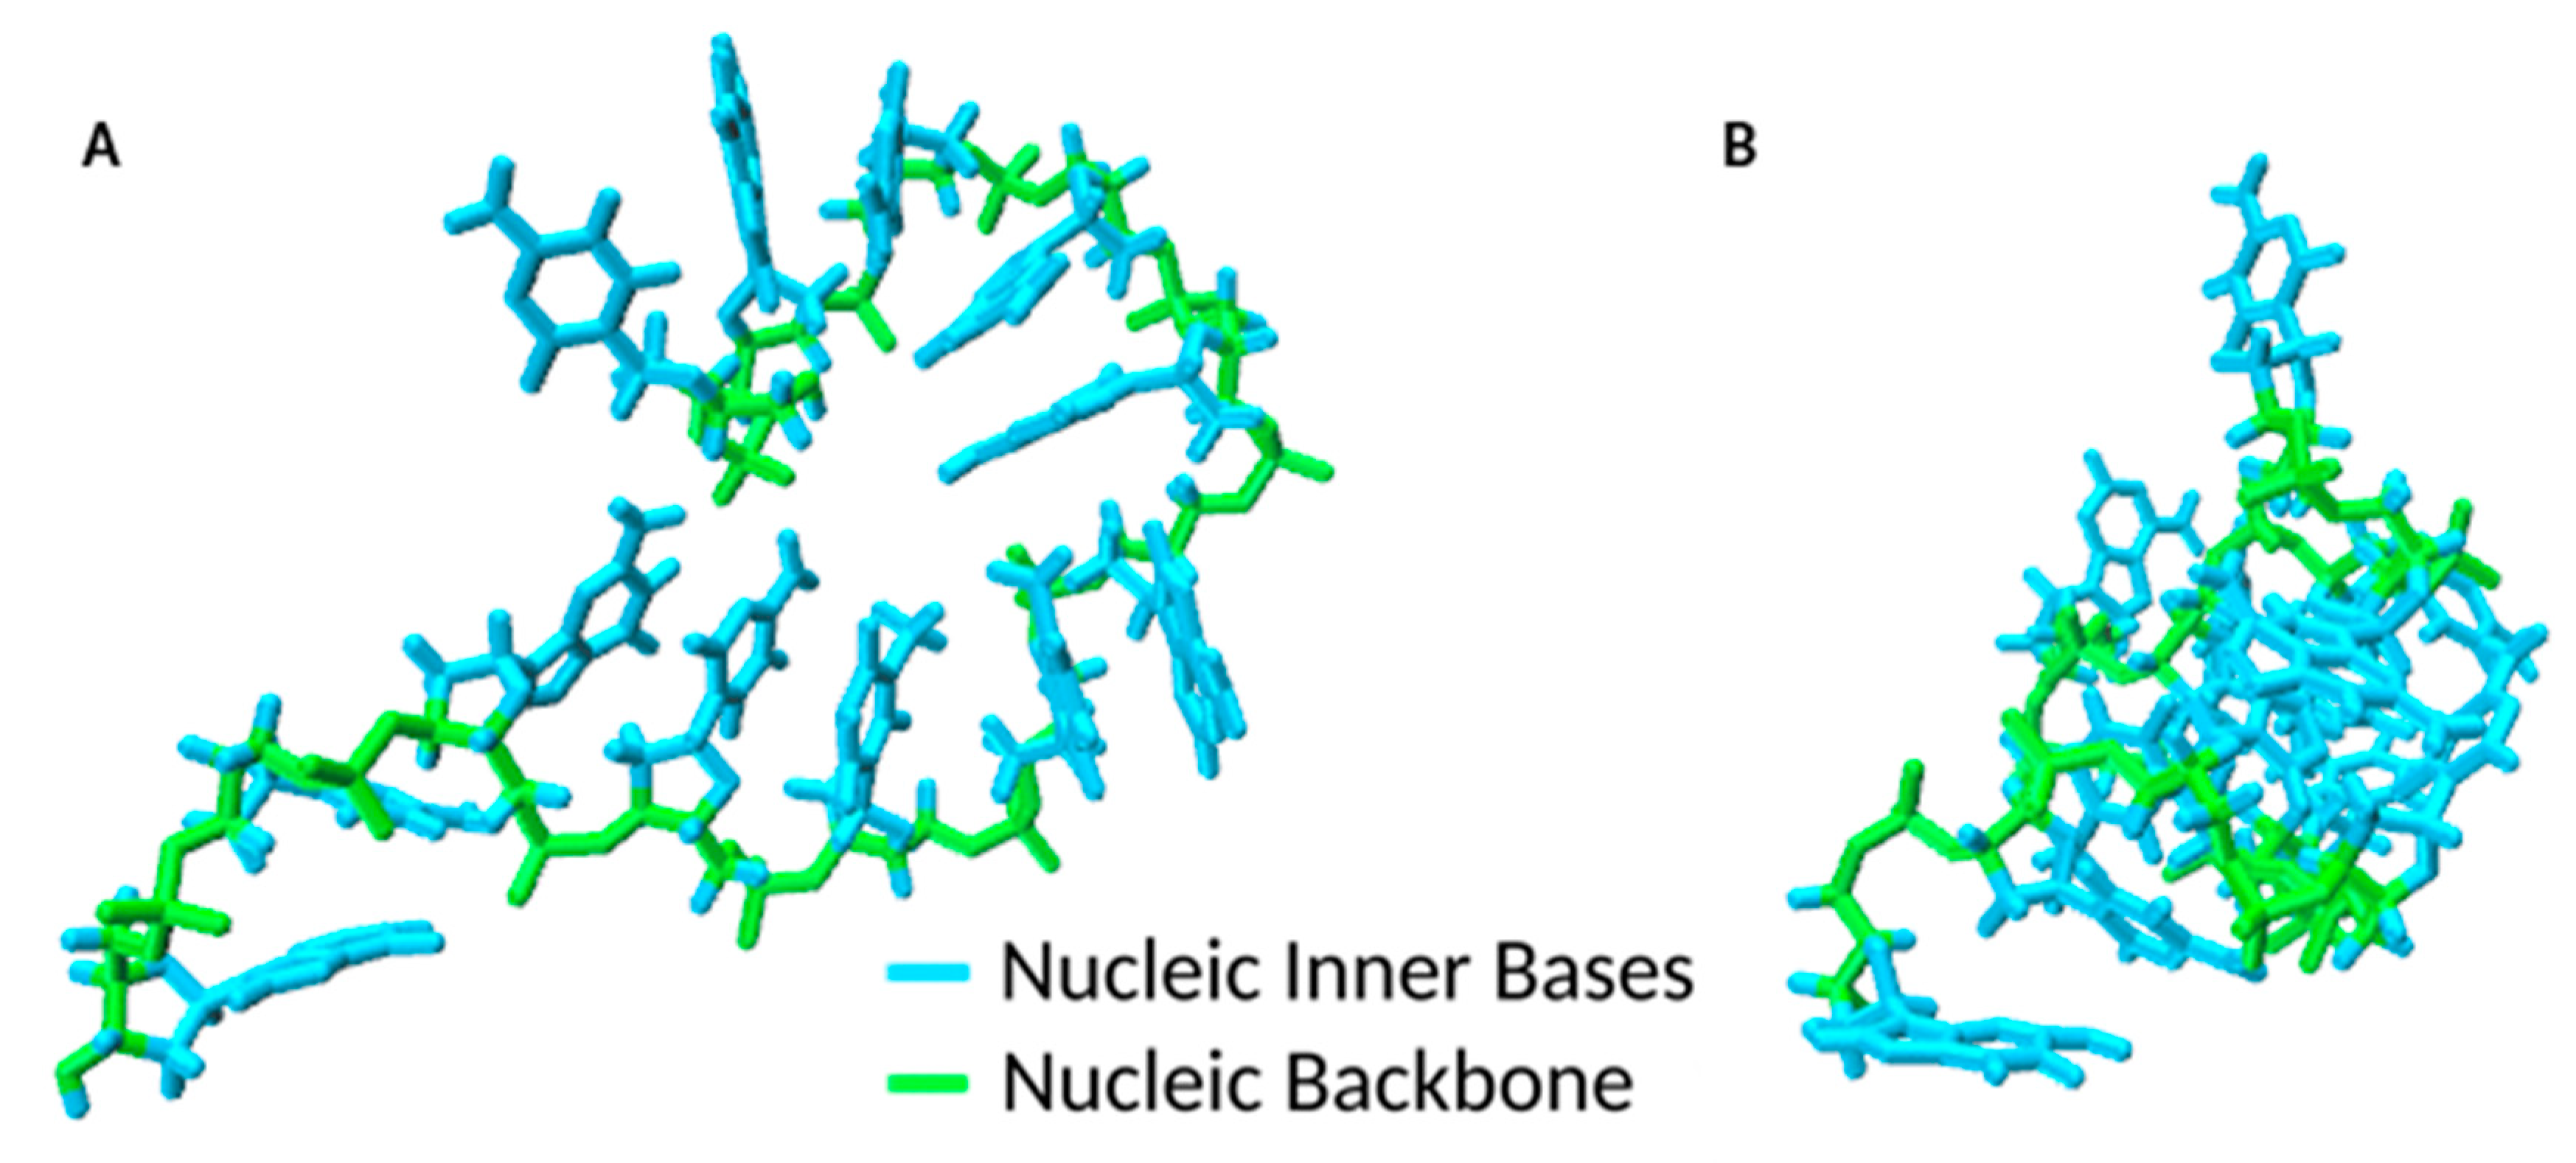
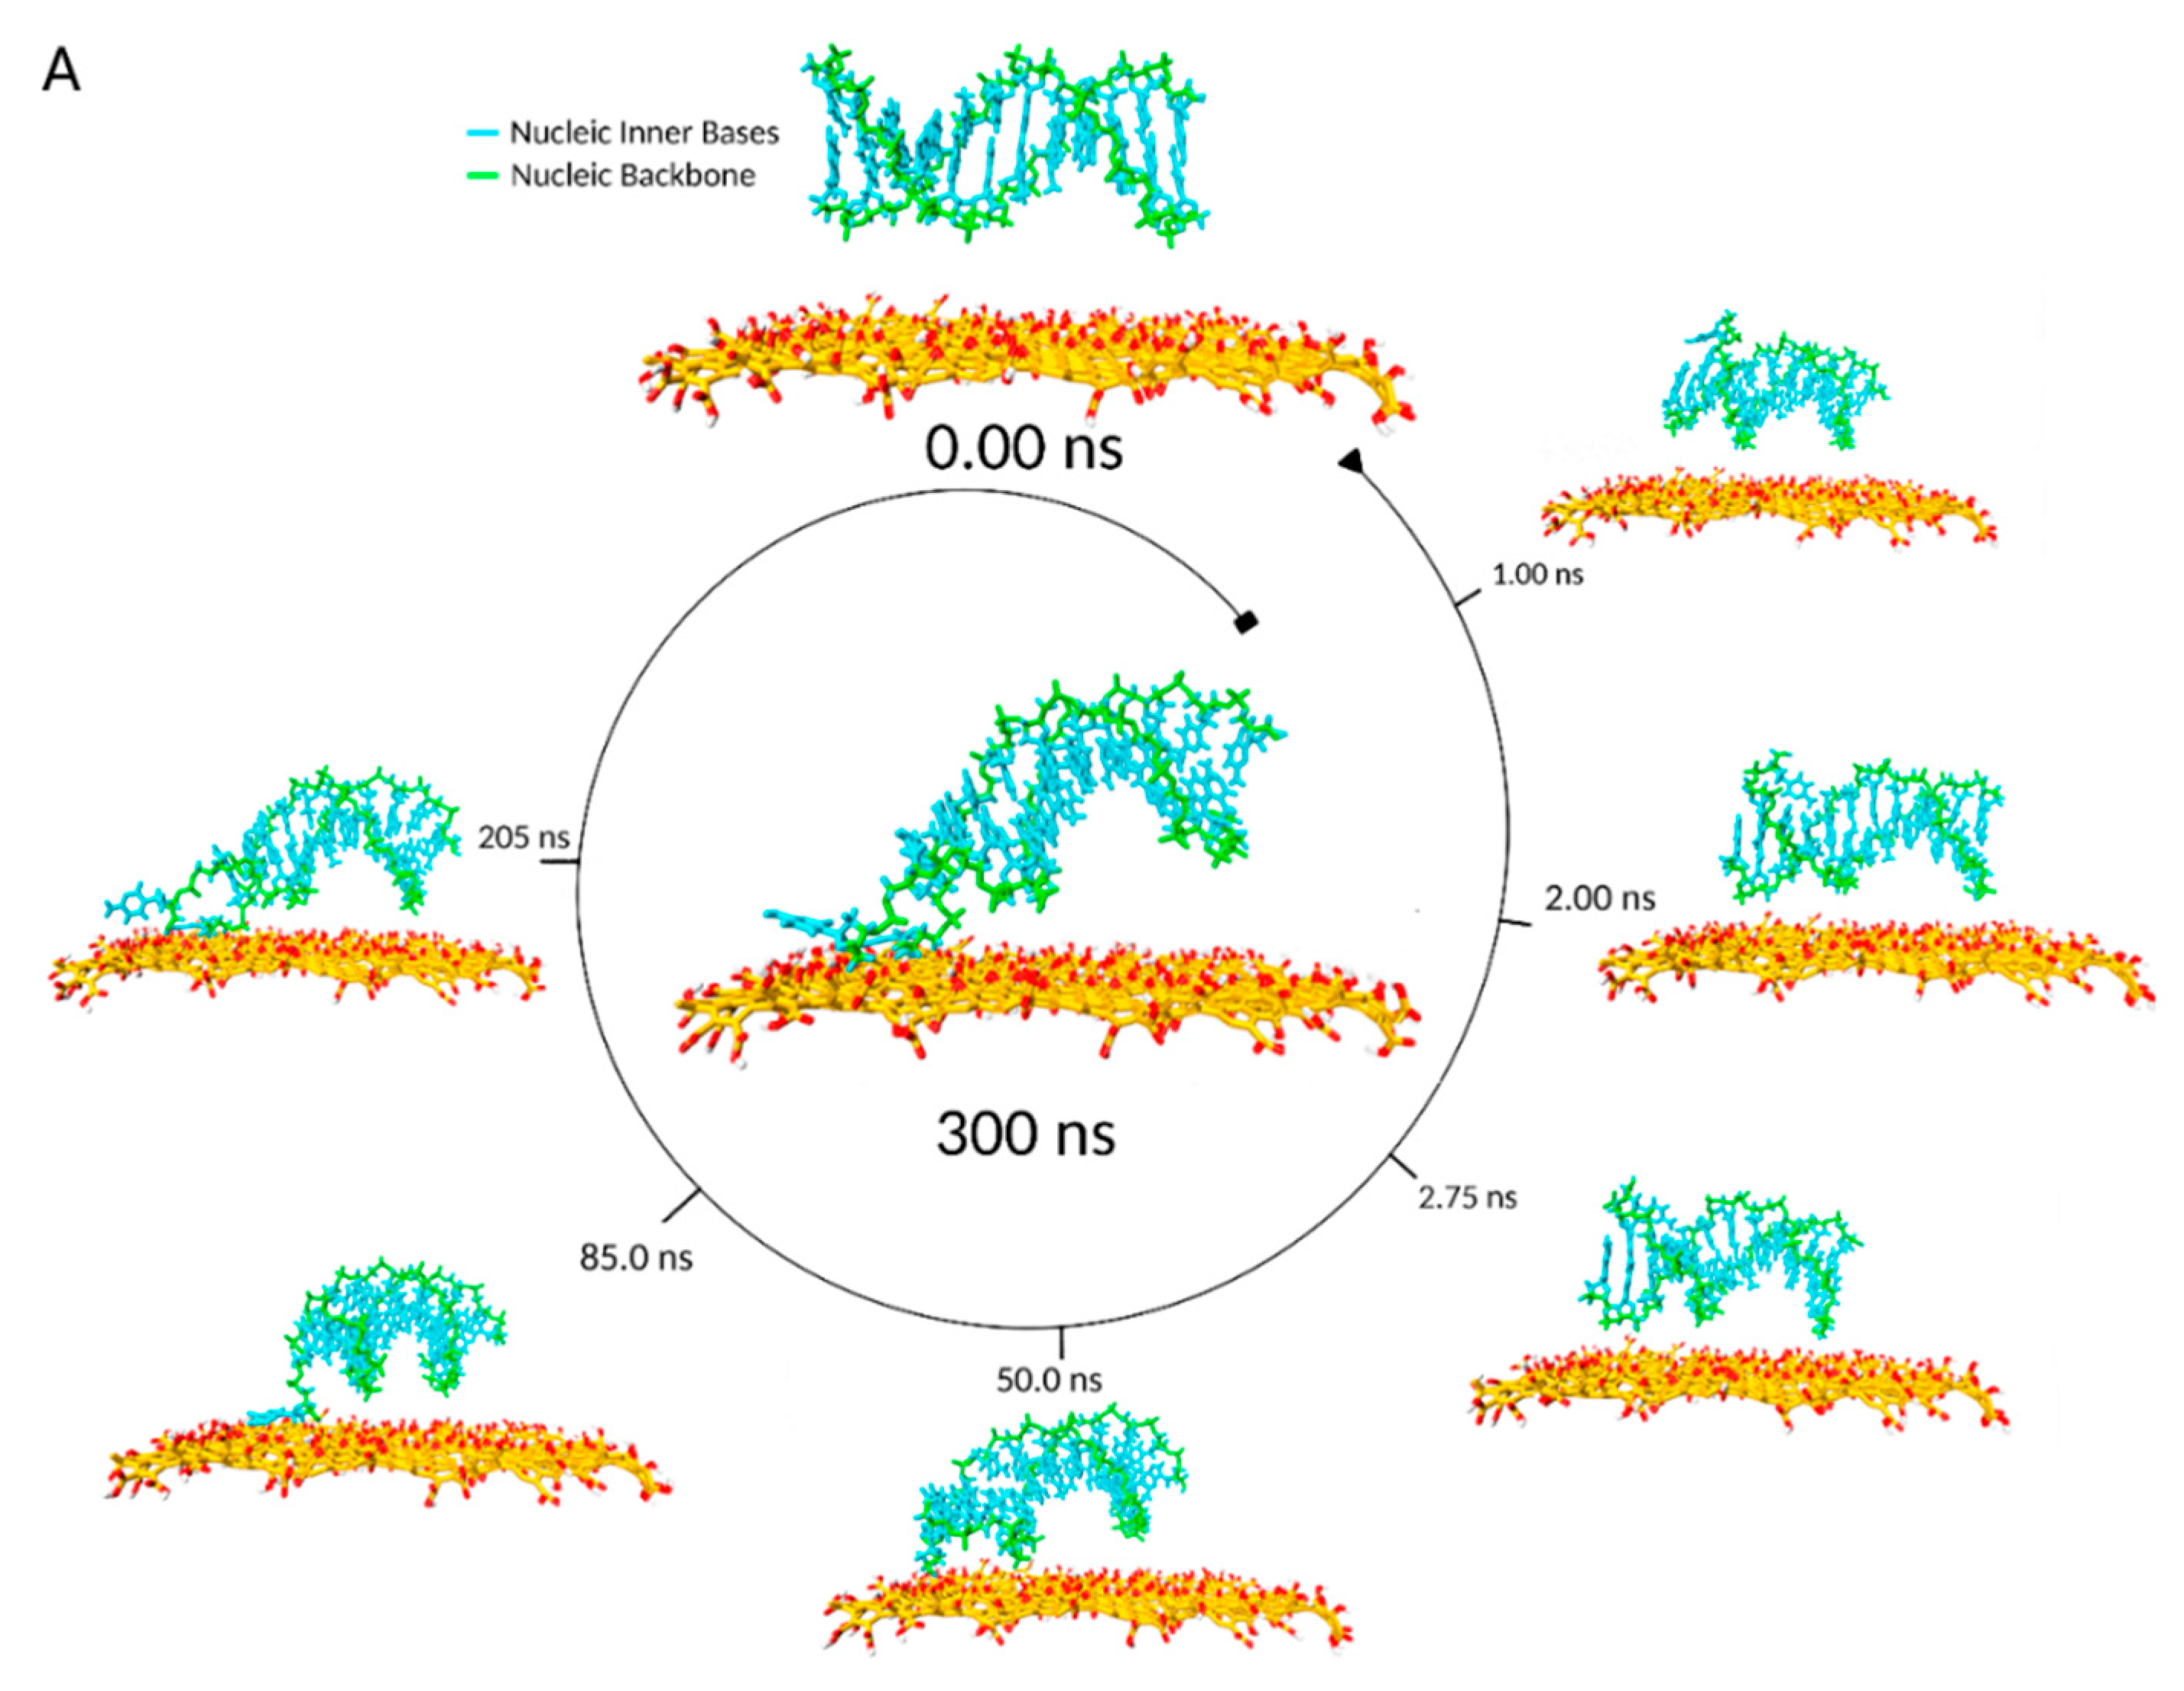
As anticipated, the ssDNA had inherent complexity arising from diverse local conformations such as loops, hairpins and pseudoknots [29], and different ssDNA molecular conformations (
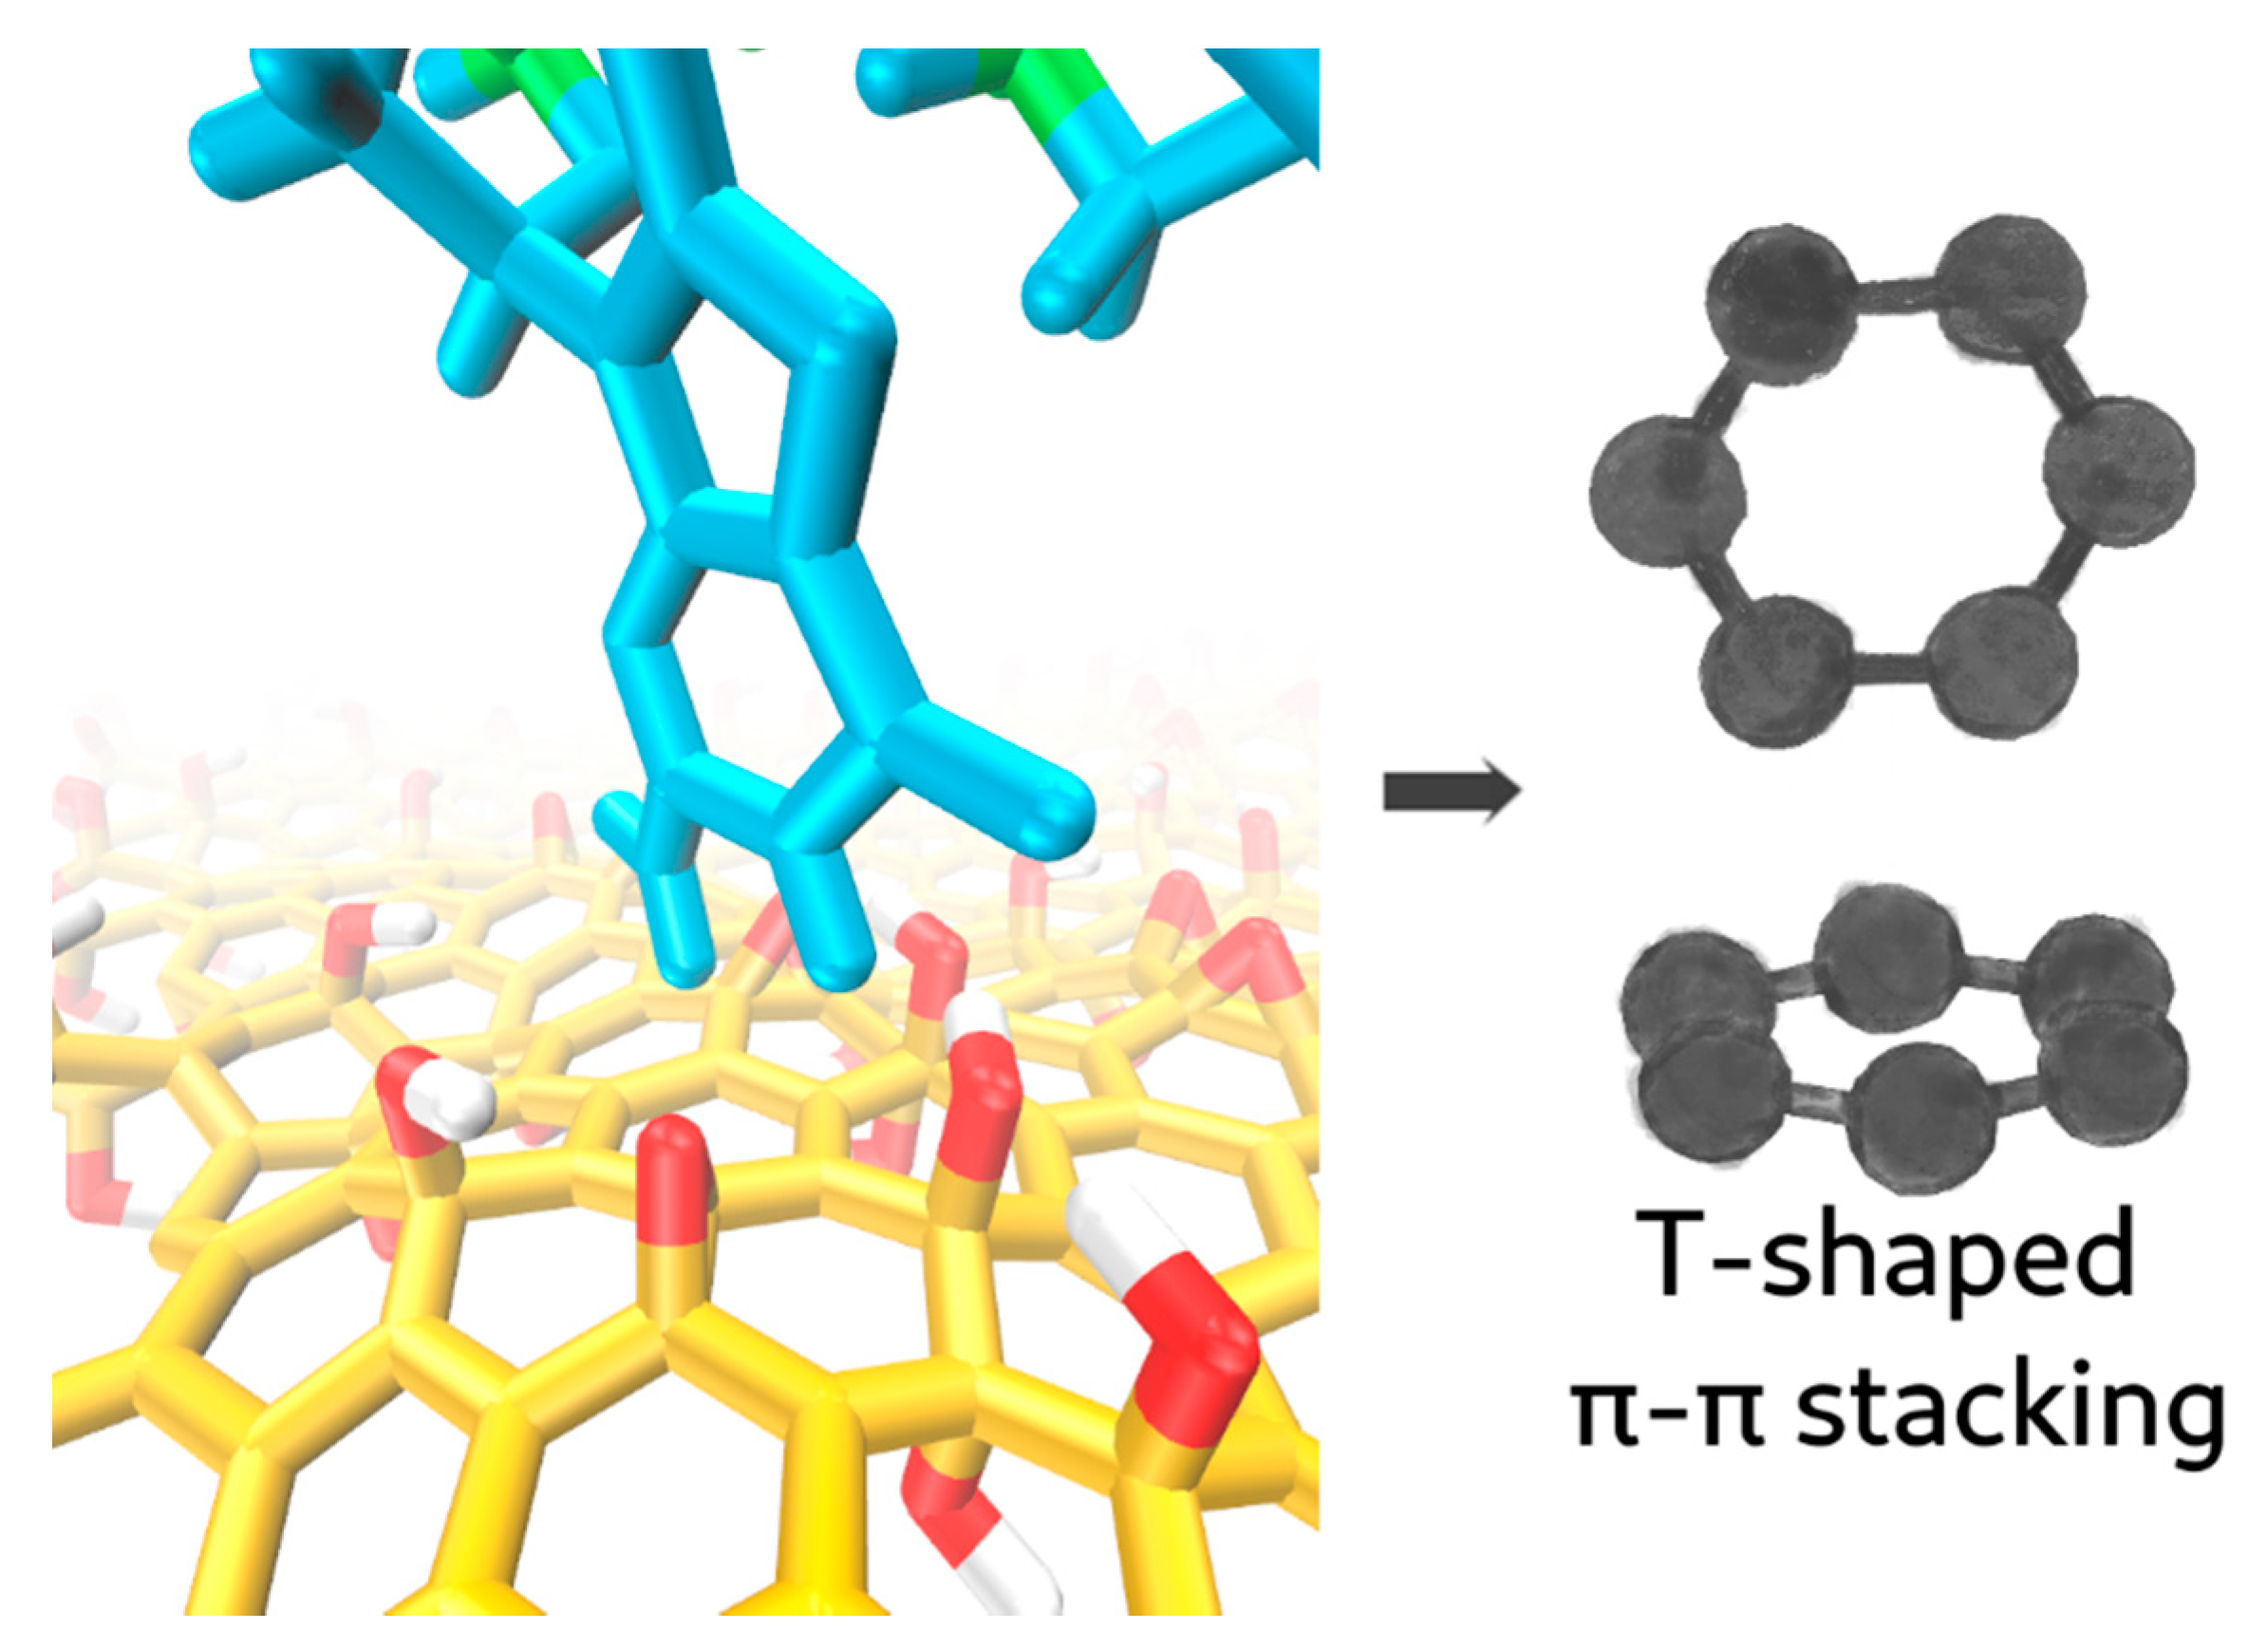
Figure 3) could be adsorbed on GO through a process of dynamic interactions. This process reflected the high flexibility of the ssDNA conformations in solution with exposed nucleobases orientated in all directions as the oligonucleotide chain continuously altered its ionic interactions and conformation. In addition, a more peculiar type of π–π stacking (T-shaped) was observed. The event is shown in Figure 4 and described later in the manuscript.
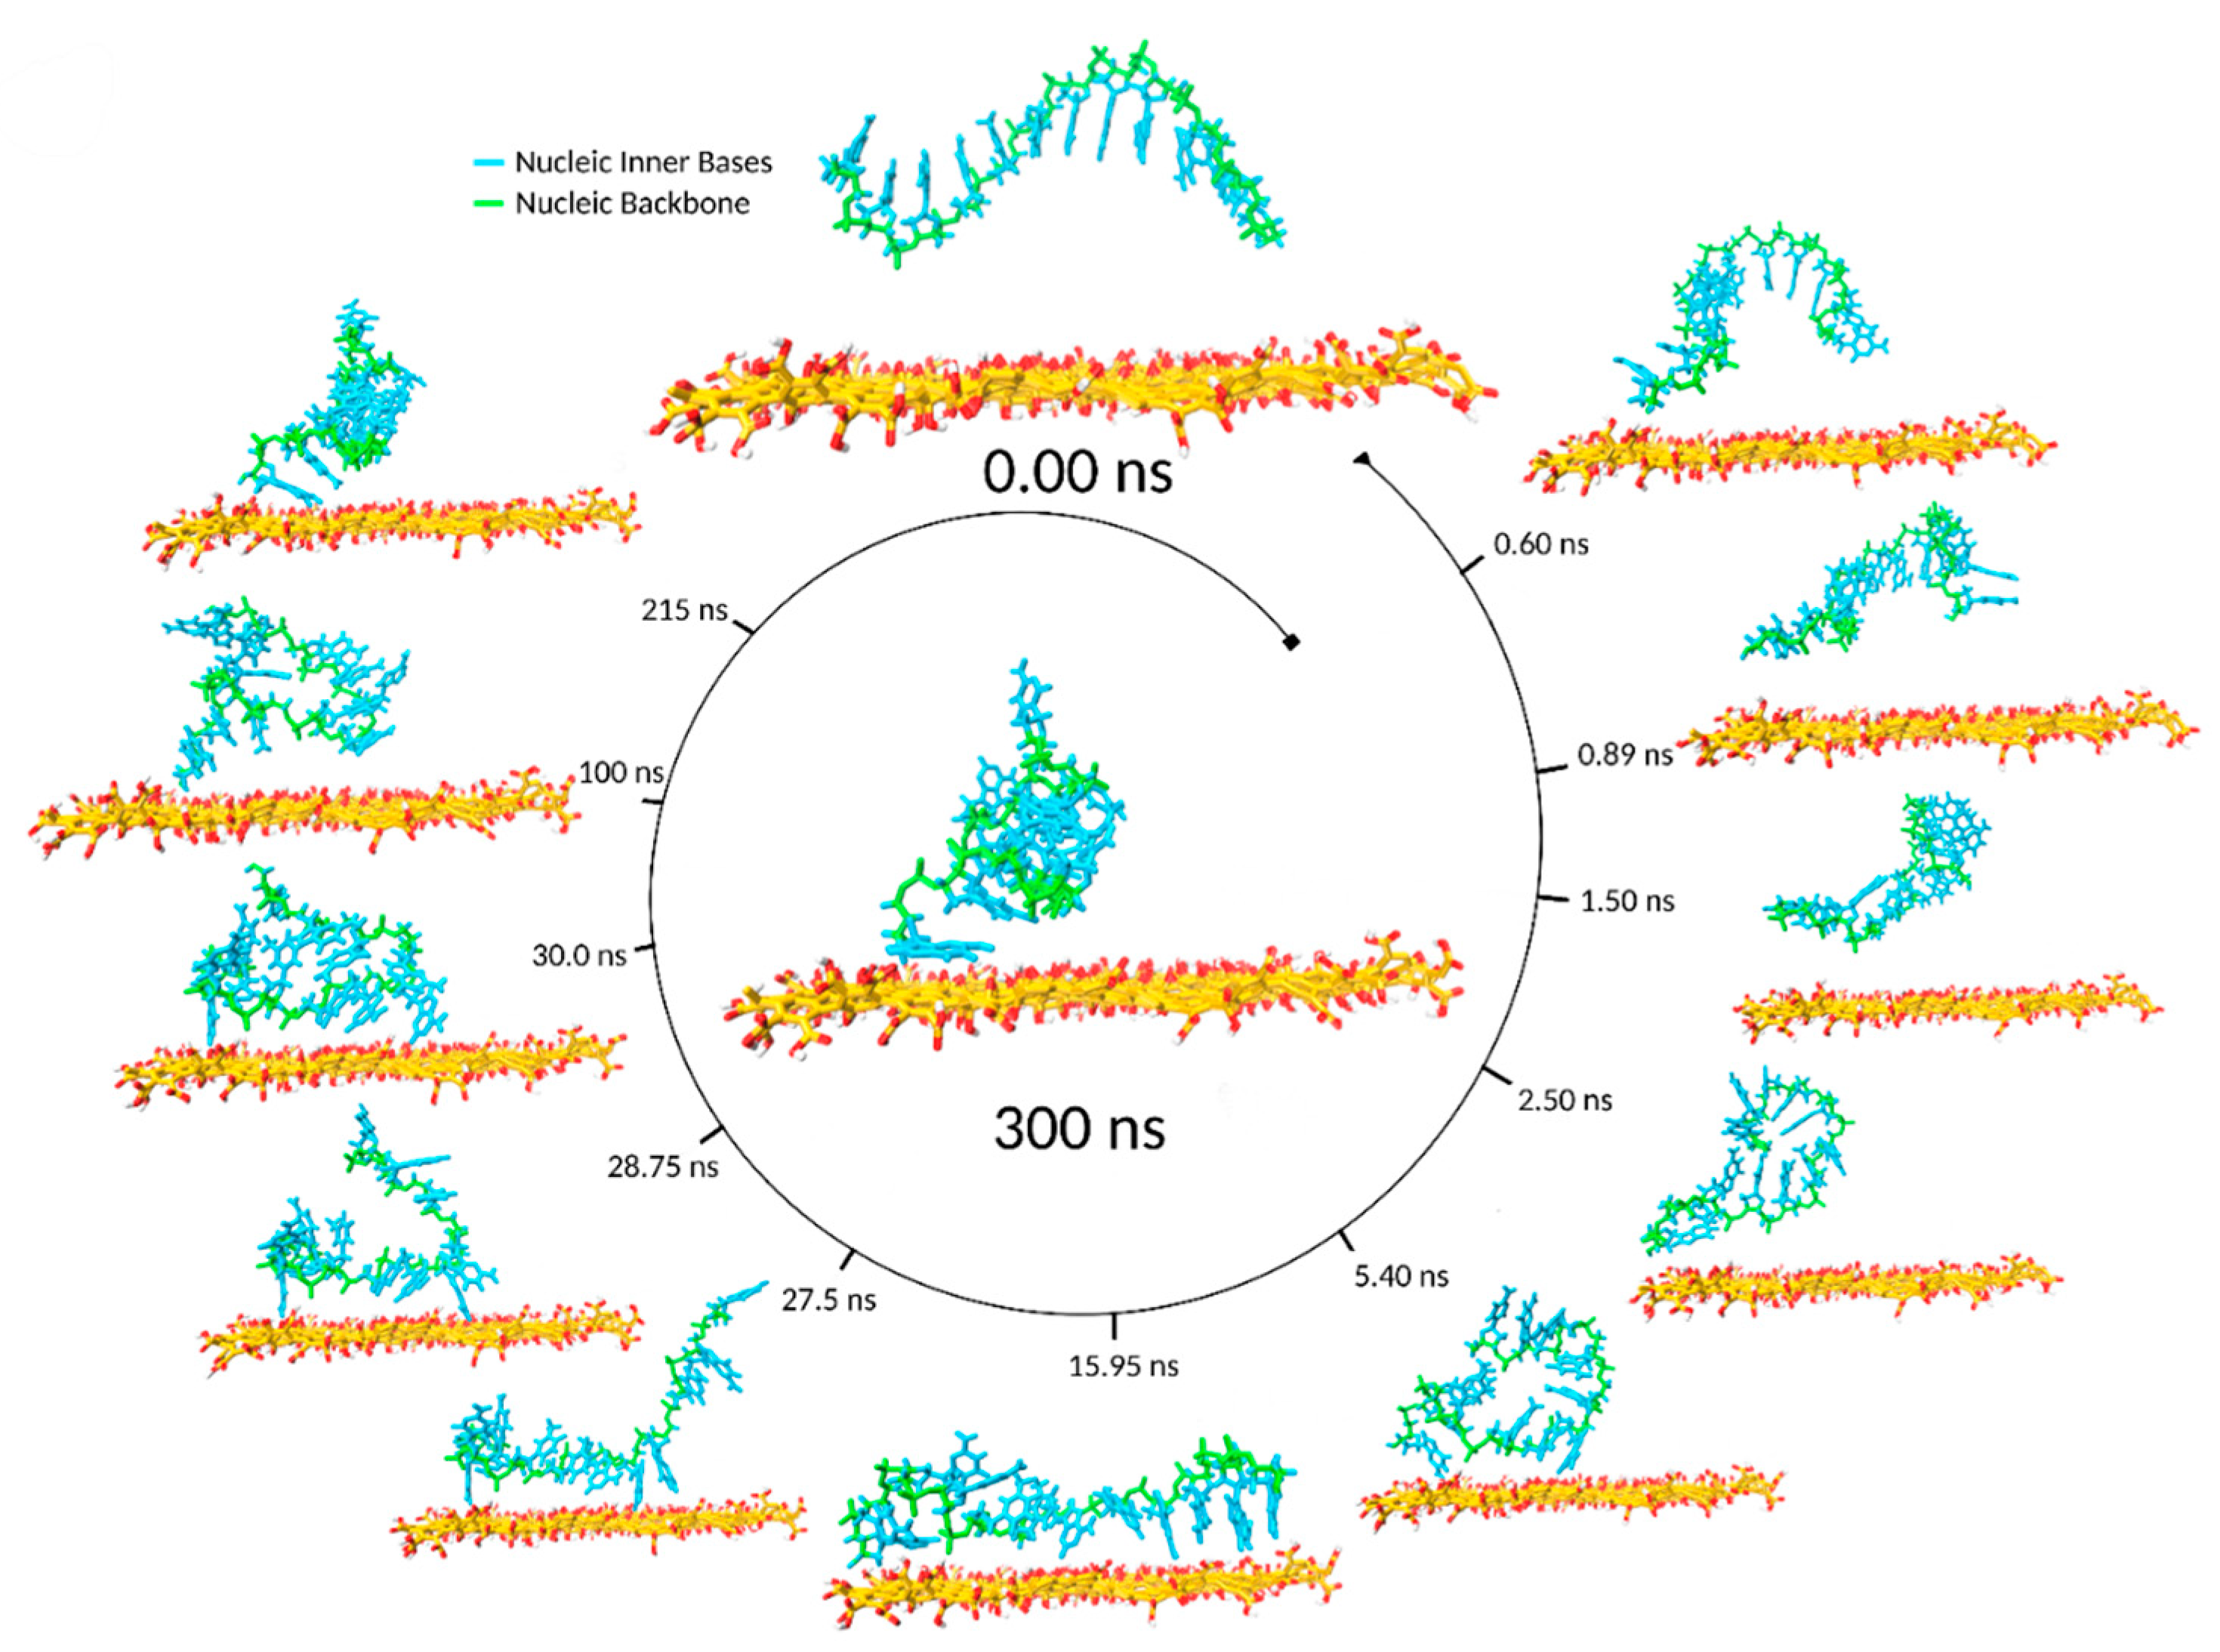
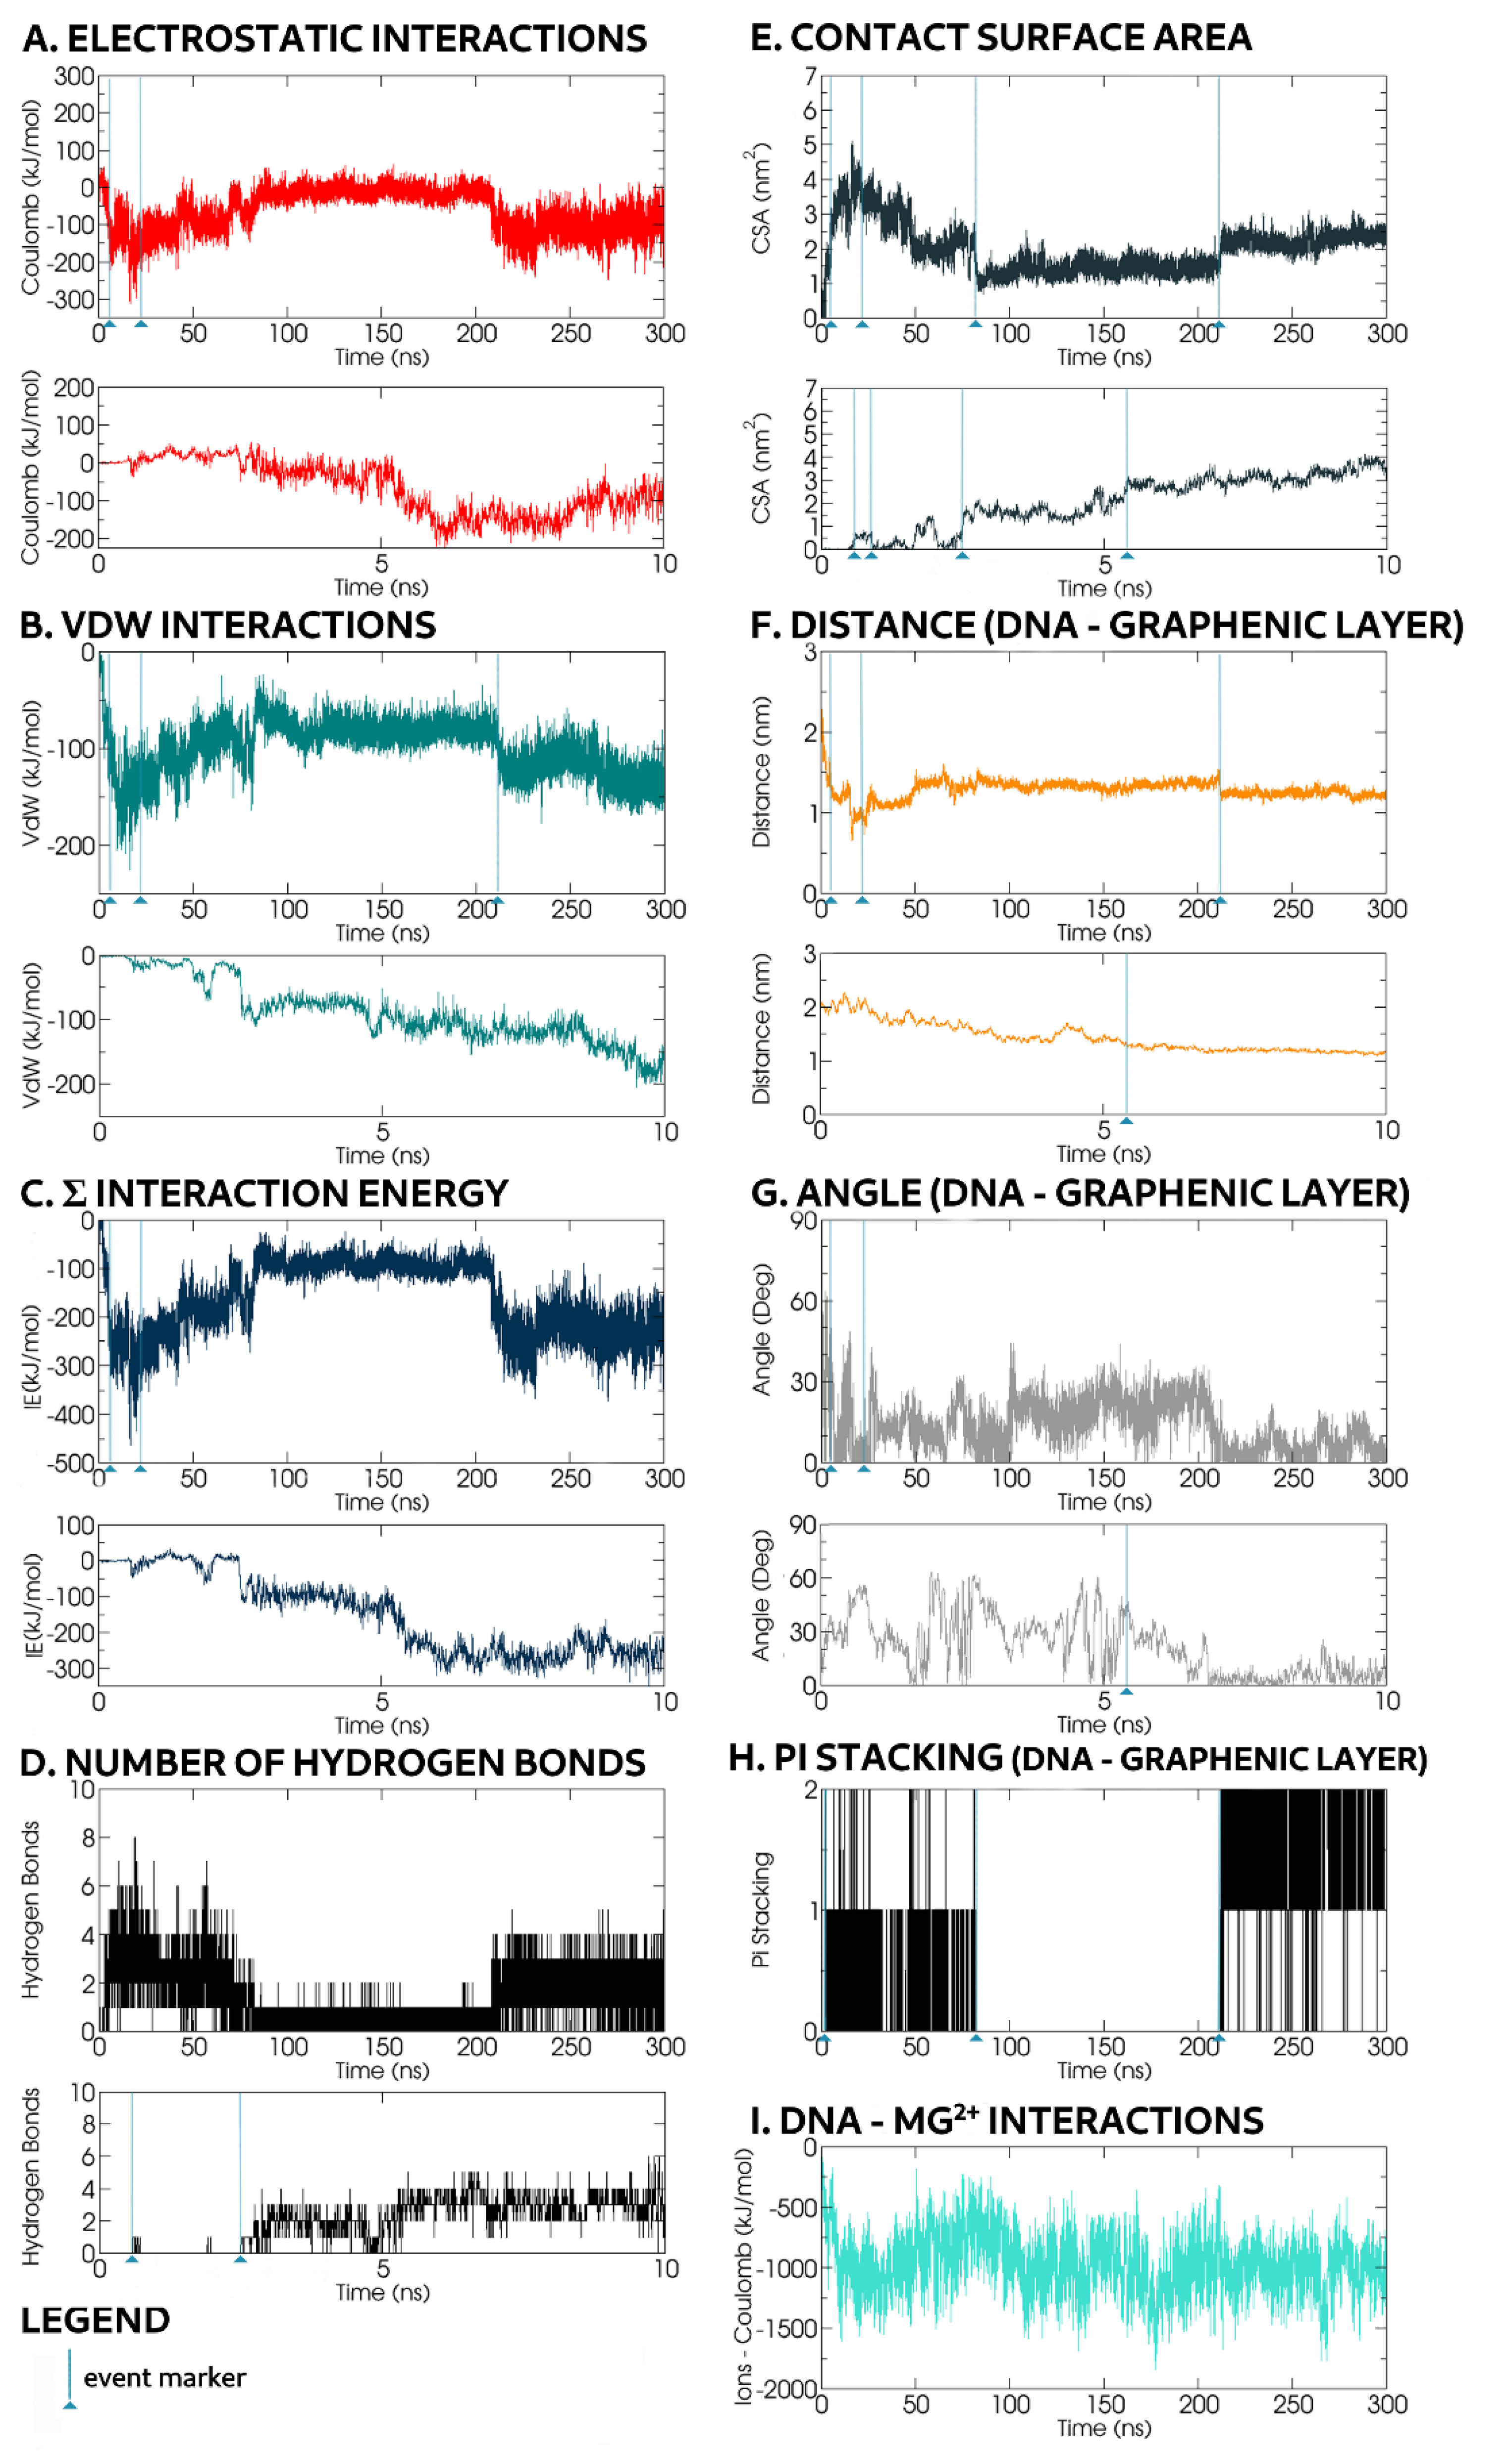
During a typical MD timeline, starting from the ssDNA backbone axis parallel to the GO surface plane (Figure 5), one or both ssDNA chain ends approached the graphene surface. Given a more energetically favourable location, one end reached the GO surface faster, and at t = 0.6 ns, the first hydrogen bond was formed (Figure 6D). Concurrently, the contact surface area increased to 0.64 nm2 (Figure 6E).
Unless a second hydrogen bond was promptly formed, the existing hydrogen bond broke, and the detached ssDNA returned to a CSA value of 0 nm2 at t = 0.89 ns. Temporary hydrogen bond formation occurred whenever a second hydrogen bond was not formed soon enough to support the first. As the Mg2+ ions competed with each other for the GO oxidised groups, the ssDNA positioned itself preferentially in the vicinity of the unoxidised regions before adsorption. This was in marked contrast to earlier MD studies that simulated GO/ssDNA interactions without Mg2+ ions, when ssDNA segments preferentially bound to oxidised versus unoxidised regions of a GO surface [11].
As the oligonucleotide chain remained close to the GO, the CSA value increased up to 2 nm2 at t ≈ 2.50 ns, corresponding to the formation of three hydrogen bonds and a T-shaped π–π stacking in which the rings adopt a perpendicular geometry [30], as shown in Figure 4. This type of π-stacking has been previously observed in DNA–protein interactions [31]. Despite respecting our π–π stacking criteria, the GO region involved was heavily oxidised, and this oxidation could shield and significantly weaken the π-stacking energy. The T-shaped stacking broke apart at t = 82ns.
At t ≈ 5.4 ns, the CSA value increased to 3.15 nm2, corresponding to the formation of one more hydrogen bonds. For the rest of the simulation, at least one hydrogen bond persisted between the ssDNA and the GO surface. Within this t = 5.4 ns timeframe, the distance between the backbone of the ssDNA and the graphene surface carbon atoms narrowed from 2.25 to 1.30 nm. The oligonucleotide conformation, resembling Figure 3A, had a terminal nucleobase forming hydrogen bonds with oxidised groups that anchored the rest of the oligonucleotide chain to the GO surface. The ssDNA backbone region that connected to the GO anchored terminal base was bridged by Mg2+ ions and lay flat parallel to the plane of the graphene. The rest of the ssDNA was looped over this GO-associated oligonucleotide chain, allowing Mg2+ ions to reside in between these two oligonucleotide backbone regions. During the next 17 ns, almost all of the ssDNA backbone was bridged by Mg2+ ions. Towards the end of this 17 ns duration, the backbone was flattened with a small axis angle (0–10°) onto the GO surface plane (Figure 6G). Throughout this transitional interaction, most of the parameters were at or near maximal or minimal absolute values; VdW energy peaked at −200 kJ mol−1, Coulomb energy: ≈300 kJ mol−1, CSA reached ≈5 nm2 and intermolecular distance ranged between 0.70 and 0.75 nm. Despite Mg2+ ion-mediated oligonucleotide backbone interactions with the GO surface, some nucleobases formed hydrogen bonds with GO oxidised moieties, and were thus oriented towards the GO surface.
This lying-flat adsorption conformation was not necessarily stable. In the representative simulation, by t = 27.5 ns, the region of the ssDNA backbone carrying free terminal nucleobases was quickly associated with floating Mg2+ ions in preference to adsorption onto the GO surface. In the following 7 ns, the molecule returned to a condensed conformation stabilised by intramolecular π–π stacking (Figure 3B).
During the next 200 ns, the ssDNA migrated from site to site on the GO surface, displaying a CSA value close to 1.5 nm2 until, at t = 212 ns, the contacting base bonded to an oxidised group through hydrogen bonds and further relaxed its conformation forming a π–π stacking interaction with an adjacent graphene ring. This correlated well to CSA jumping from 1.5 to 2.5 nm2 (Figure 6E) and a decreased VdW interaction energy from −75 kJ mol−1 to −125 kJ mol−1 (Figure 6B). The distance, VdW, Coulomb and CSA values remained constant for the rest of the simulation. The overall molecular alignment of the oligonucleotide chain nucleobases was towards the centre of the backbone loop, away from nearby Mg2+ ions attracted to the negatively charged phosphate backbone. Small periodic oscillations resulted in slight fluctuations of the angle (0–20°) between the ssDNA phosphate backbone and the GO (Figure 6G).
In summary, the ssDNA molecule was adsorbed on the surface of the GO with part of its oligonucleotide chain bridged by the Mg2+ ions to the GO surface, the remainder adopted a folded conformation with its oligonucleotide backbone looped onto itself (Figure 3A,B). The π–π stacking interactions played a key role in allowing the oligonucleotide to anchor, rather than migrate, on the GO surface with binding energies influenced by the presence of hydrogen bonds and electrostatic interactions between the GO surface adsorbed Mg2+ ions and the ssDNA. Given the very dynamic conformational changes of ssDNA, we do not exclude the possibility that other adsorption mechanisms may exist. Future exploration of different sets of ion parameters, such as CUFIX [32], and the use of force fields that allow continuous bond formation and breakage, such as ReaxFF [33], may improve accuracy for biosensor design. The computational approach used in this work may be extended to testing different metal ions and different graphene derivatives, or other novel 2D materials, to pursue scenarios under which ssDNA and dsDNA are easy to differentiate due to different behaviour.

3.2. Double-Stranded DNA Adsorption on GO in the Presence of Mg2+ and Cl Ions

During the equilibration step, the more restrained dsDNA movement allowed the ions to move freely from randomly assigned initial positions to more energetically favourable ones. As was found for the equilibration step for ssDNA simulations, Mg2+ ions were adsorbed on the surface of the GO near the oxidised functional groups. Moreover, they were also predominantly associated with the negatively charged dsDNA backbone. In effect, Mg2+ ions formed a thin, positively charged blanket over the negatively charged oxygen atoms present on the GO surface (see Supplementary Figure S2) and also stabilized the tertiary structure of the DNA molecule. No such specific pattern of distribution was observed in the case of the Cl ions.
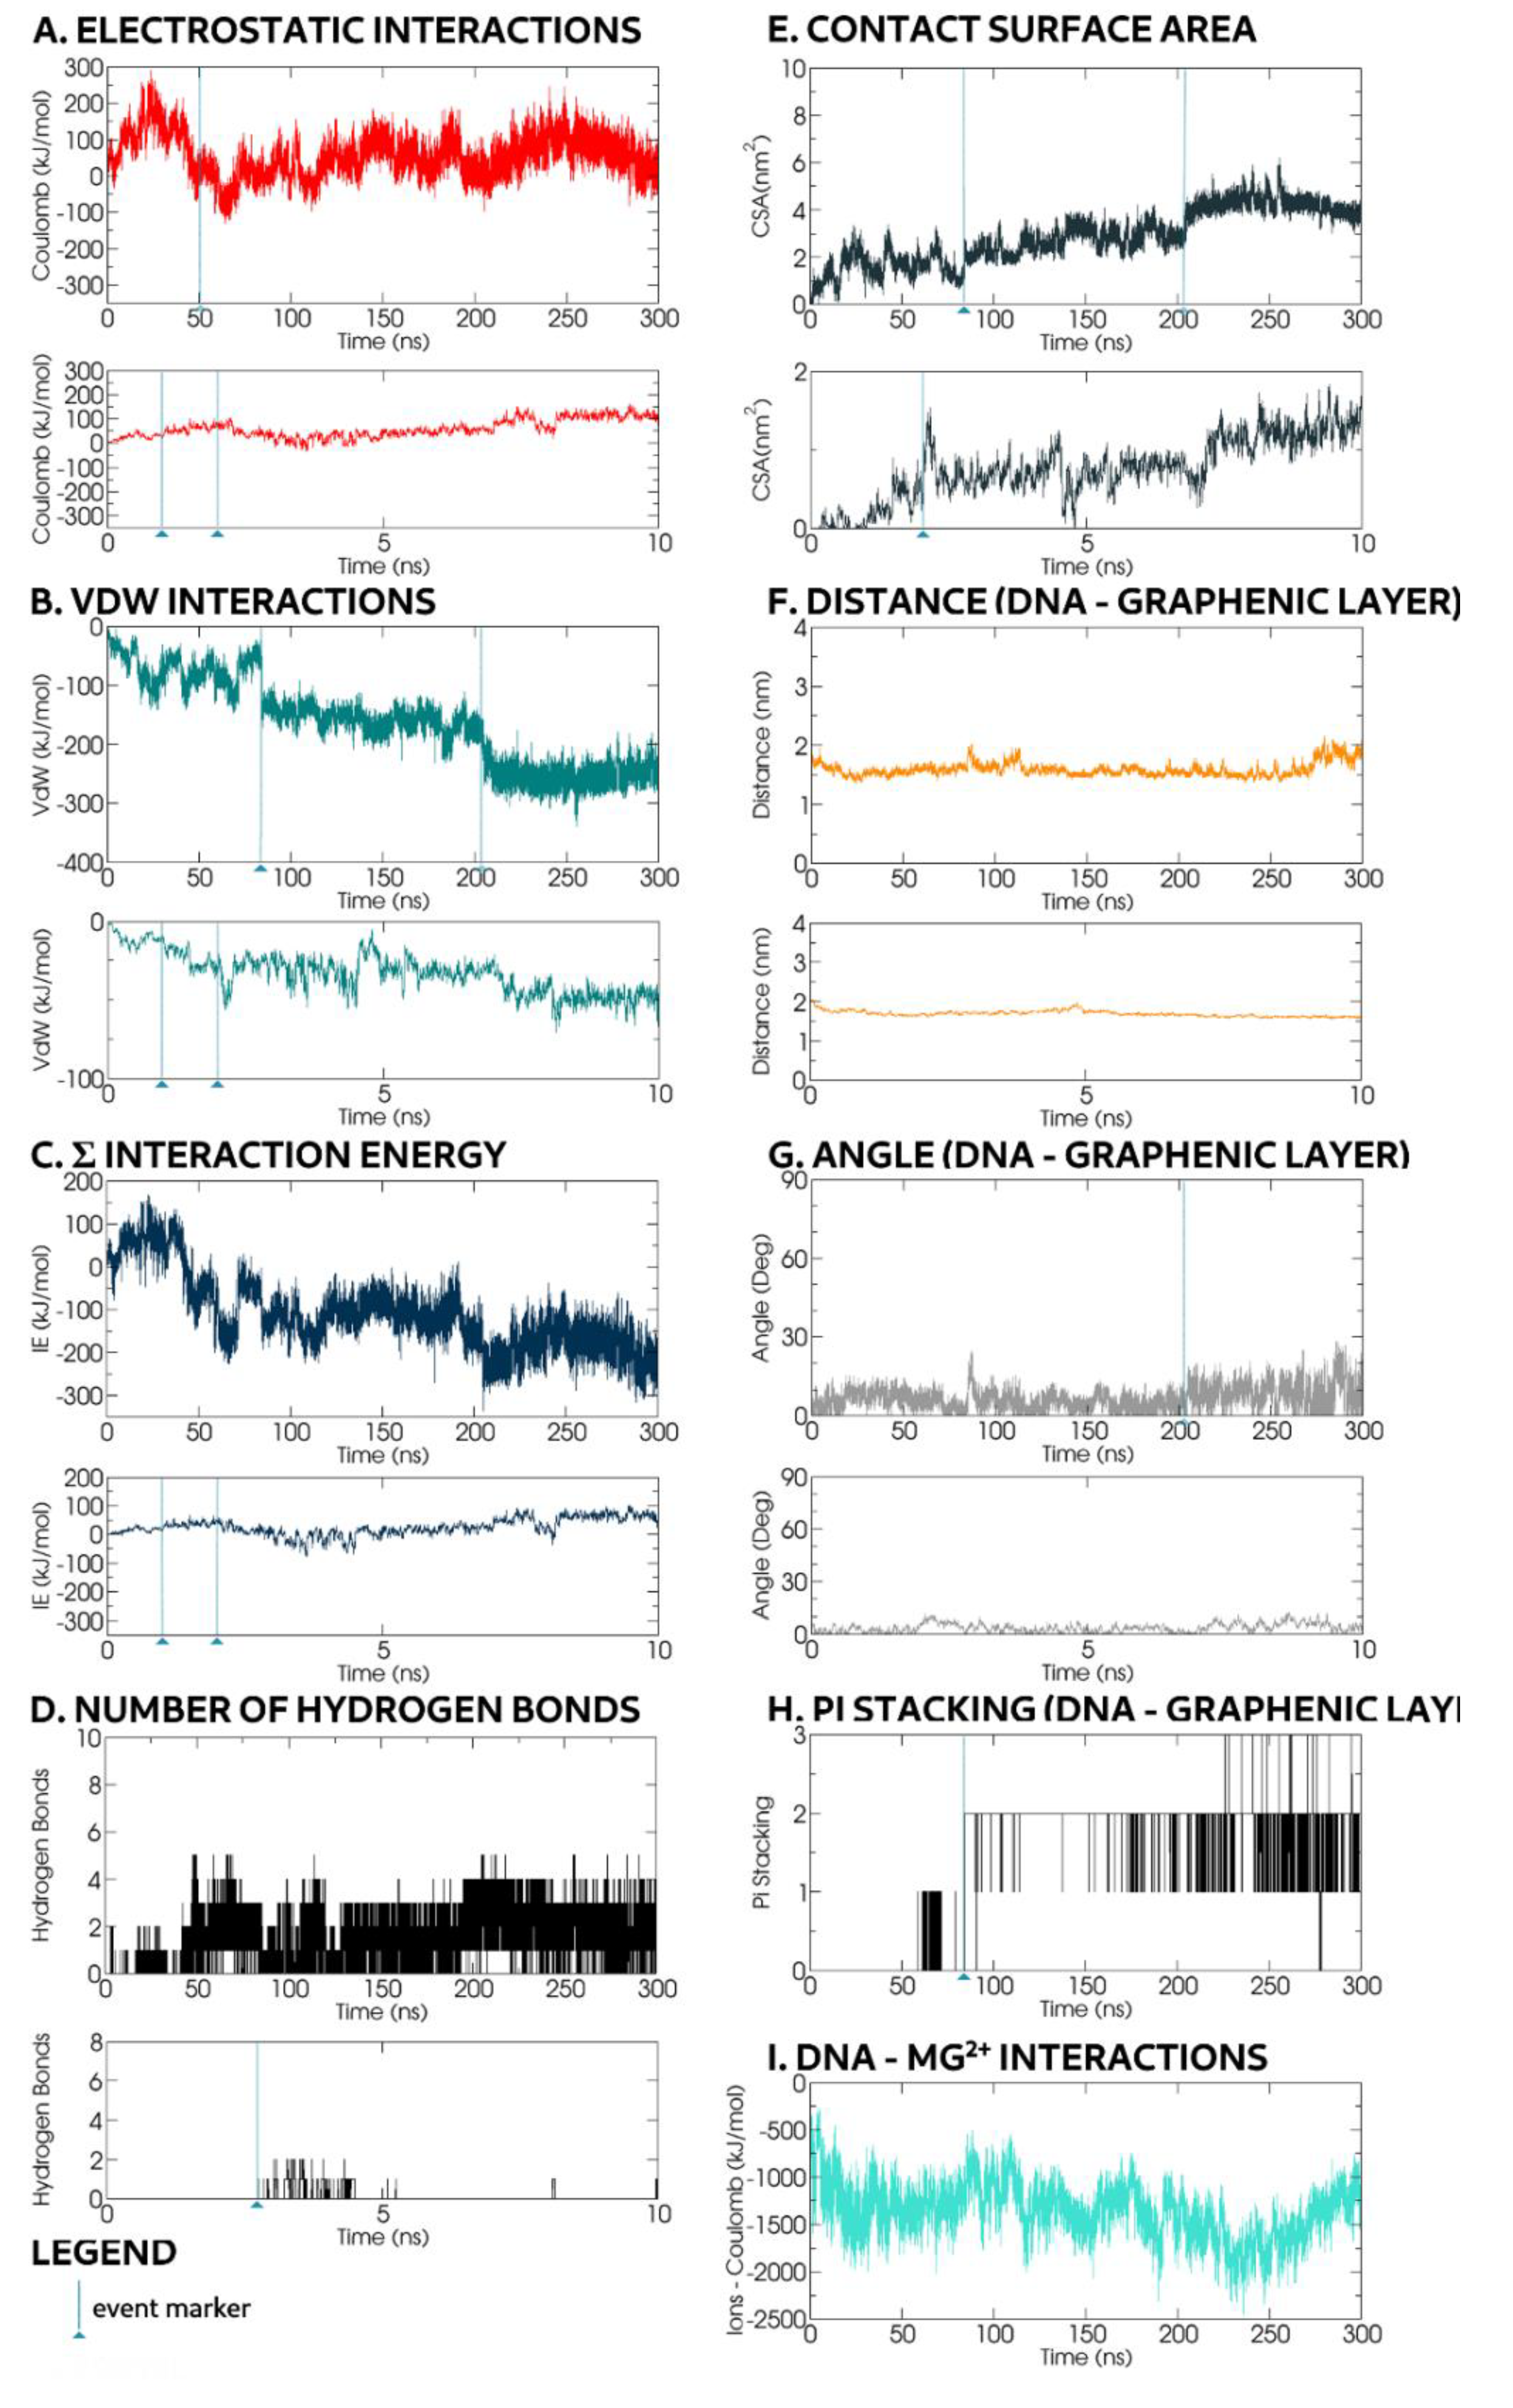
The trajectory snapshots (Figure 7) for representative dynamic dsDNA adsorption interactions with the GO progressed with the dsDNA backbone parallel to the graphenic surface without significant rotation, regardless of the dsDNA’s initial orientation. During the first 2 ns, the distance between the nucleic backbone and the GO fell from 2 nm to 1.63 nm (Figure 8F) and remained within a ±0.5 nm range for the rest of the simulation. At the end of the mentioned translocation phase (2 ns), it lay tangentially with only a small angle (0–5°) into the GO plane (Figure 8G). This finding is in contrast with previous MD studies concerning GO-oligonucleotide without the presence of Mg2+ or Cl ions, where the same dsDNA oligonucleotide axis rotated quickly and landed perpendicularly to the GO surface [9,10].
Our energy-related graphs indicated a small repulsive net force between 1 and 2 ns in Figure 8C, as a result of an 80 kJ mol−1 electrostatic interaction and −30 kJ mol−1 VdW interaction as shown in Figure 8A,B. Despite this result, the dsDNA approached the GO because the Mg2+ ions formed a positively charged blanket over the negatively charged oxygen atoms on the GO surface, thereby bridging the negatively charged dsDNA phosphate backbone with the GO surface. Indeed, within 1.4 nm of both the GO and oligonucleotide, the Mg2+ ions alone exerted a significant dominant attractive force on the dsDNA (Figure 8I). The GO–dsDNA intermolecular distance changed minimally over the rest of the simulation time, but yet it was greater than the distances proposed by previous studies of dsDNA adsorption on GO without the Mg2+ and Cl ions, because of the Mg2+ ions bridged between the dsDNA and GO molecules.
Beyond these ionic interactions, the dsDNA further interacted with the GO through hydrogen bonds, first observed at t = 2.75 ns (Figure 7 and Figure 8D). Correspondingly, the contact surface area reached 0.5 nm2 at t = 2 ns (Figure 8E) and fluctuated between 0.5 and 1.5 nm2 as the dsDNA conformation oscillated to reach an energetically favourable configuration for the hydrogen bonds to be formed. The initial hydrogen bonds were transient, altered by movement of ions in solution and dsDNA perturbation of ions adsorbed on the GO surface. For the electrostatic interactions that involved the bridging Mg2+ ions dominating other interactions (Figure 8I), the dsDNA molecule drifted on the xy-plane with existing hydrogen bonds broken and was recreated in different positions.
Curiously, at the t = 1 and t = 2 ns snapshots (Figure 7), in the presence of Mg2+, the terminal bases of the dsDNA broke their π–π stacking interactions and hydrogen bonds formed with the other bases, apparently stochastically. This event occurred repeatedly throughout the simulation for all four terminal bases. At t ≈ 50 ns, one inner base broke its intramolecular interactions to form hydrogen bonds with the nearby GO surface oxidised groups. Concurrently, the dsDNA-GO electrostatic energy dropped below 0 kJ mol−1 (Figure 8A). The base continued to move between local functional groups present on the GO surface until, at t = 72 ns, it reached the edge of an unoxidised region. In the following 12 ns, the two hydrogen bonds formed with persisting nearby epoxy groups. Both Mg2+ ions and freed dsDNA bases competed for interaction with the oxidised GO surface. Eventually, at t = 84 ns, the freed base was constrained inside the unoxidised region by Mg2+ ions, where it quickly formed π–π stacking interactions with the available graphene rings (Figure 8H). This was marked by a sharp energy drop from −72 kJ mol−1 to −148 kJ mol−1 (Figure 8B) and, for the next 116 ns, only oscillated within ±25 kJ mol−1. Concurrently, the contact surface area, increased from 1 nm2 to 2 nm2 (Figure 8E). For the next 116 ns, the п-stacked base migrated within the unoxidised region, confining the dsDNA molecule range of movement on the xy-plane.
At t ≈ 200 ns, a second inner dsDNA base, complementary to the base within an unoxidised region, broke away from the intramolecular π–π stacking interactions with neighbouring bases, moved chaotically and soon formed hydrogen bonds with nearby oxidised groups on the GO surface. Thus, the CSA increase from 3 to 4 nm2 (Figure 8E) and a two-step increase of VdW attractive forces from −187 to −240 kJ mol−1 (Figure 8B) corresponded to the formation of two hydrogen bonds. Subsequently, the VdW energy value remained constant at −250 kJ mol−1 throughout the rest of the simulation. The CSA value remained constant at 4 nm2 with only small fluctuations of ±0.25 nm2 (Figure 8E). These values indicated that the dsDNA molecule was adsorbed on the surface of the GO molecule.
Notably, when situated in an oxidised area, the newly freed base’s inclination changed according to the influence of nearby ions, but its x–y plane position remained fixed by hydrogen bonds between its corresponding dsDNA backbone segment and the nearby oxidised groups. Furthermore, when the dsDNA was anchored at one end by its two freed bases, the dsDNA backbone angle with the GO plane oscillated between 5 and 30°. During the final 100 ns of the simulation, the dsDNA moved away from the GO before returning to an almost parallel position, while anchored.
In summary, the dsDNA was adsorbed on GO in the presence of Mg2+ and Cl and first lay axially flat, its negatively charged phosphate backbone bridged by Mg2+ ions to oxidised groups on the GO surface. Given that the electrostatic attractive forces between the dsDNA and Mg2+ ions dominated the interactions of the dsDNA with the GO, we expect the distribution of the ions adsorbed on the GO surface to be the most influential factor for successful adsorption. However, solute ions could disrupt intramolecular π–π stacking interactions, allowing the oligonucleotide bases to instead associate via hydrogen bonds to oxidised GO surface regions. In adjacent unoxidised GO regions, the oligonucleotide base could form π–π stacking interactions that anchored it to the graphene rings of the graphene molecule. The unravelling of the terminal bases of the dsDNA at different times throughout the simulations could ultimately invoke stronger π–π interaction-mediated oligonucleotide anchoring on the GO surface. This phenomenon may be dependent on ionic concentration. Future studies should address whether the predicted oscillatory pattern from the data for 300ns simulations for the dsDNA backbone may persist over longer simulation times. Generally, the energy and CSA values were greater for dsDNA compared with ssDNA, and thus in the presence of Mg2+ ions we would expect dsDNA to have a greater binding affinity for GO than ssDNA. For building a broader overview of dsDNA adsorption in the presence of Mg2+ and Cl ions, different ionic concentrations and dsDNA molecules of varying lengths should be simulated.

3.3. Single-Stranded DNA Adsorption on rGO-PEG-NH2 in the Presence of Mg2+ and Cl Ions

After the NVT equilibration step, Cl ions positioned themselves between and around the PEG–NH2 chains, whereas Mg2+ ions were primarily located further away from the rGO surface. However, some Mg2+ ions were found around the negatively charged oligonucleotide backbone. Through a series of cooperative non-bonding interactions, the ssDNA molecule was adsorbed on the rGO-PEG-NH2 species in the presence of the Mg2+ and Cl ions. Two main simulation outcomes were revealed: The ssDNA backbone would either lie entirely on top of the PEG-NH2 chains, or one of its ends would reach through the PEG-NH2 chains and contact the rGO surface, eventually forming п–п interactions with one of its graphene rings. The adsorbed ssDNA conformation was not necessarily stretched, but could form loops, hairpins and pseudoknots [29] due to the torsion of its backbone. The main forces involved were electrostatic interactions, hydrogen bonds and eventually π–π stacking interactions.
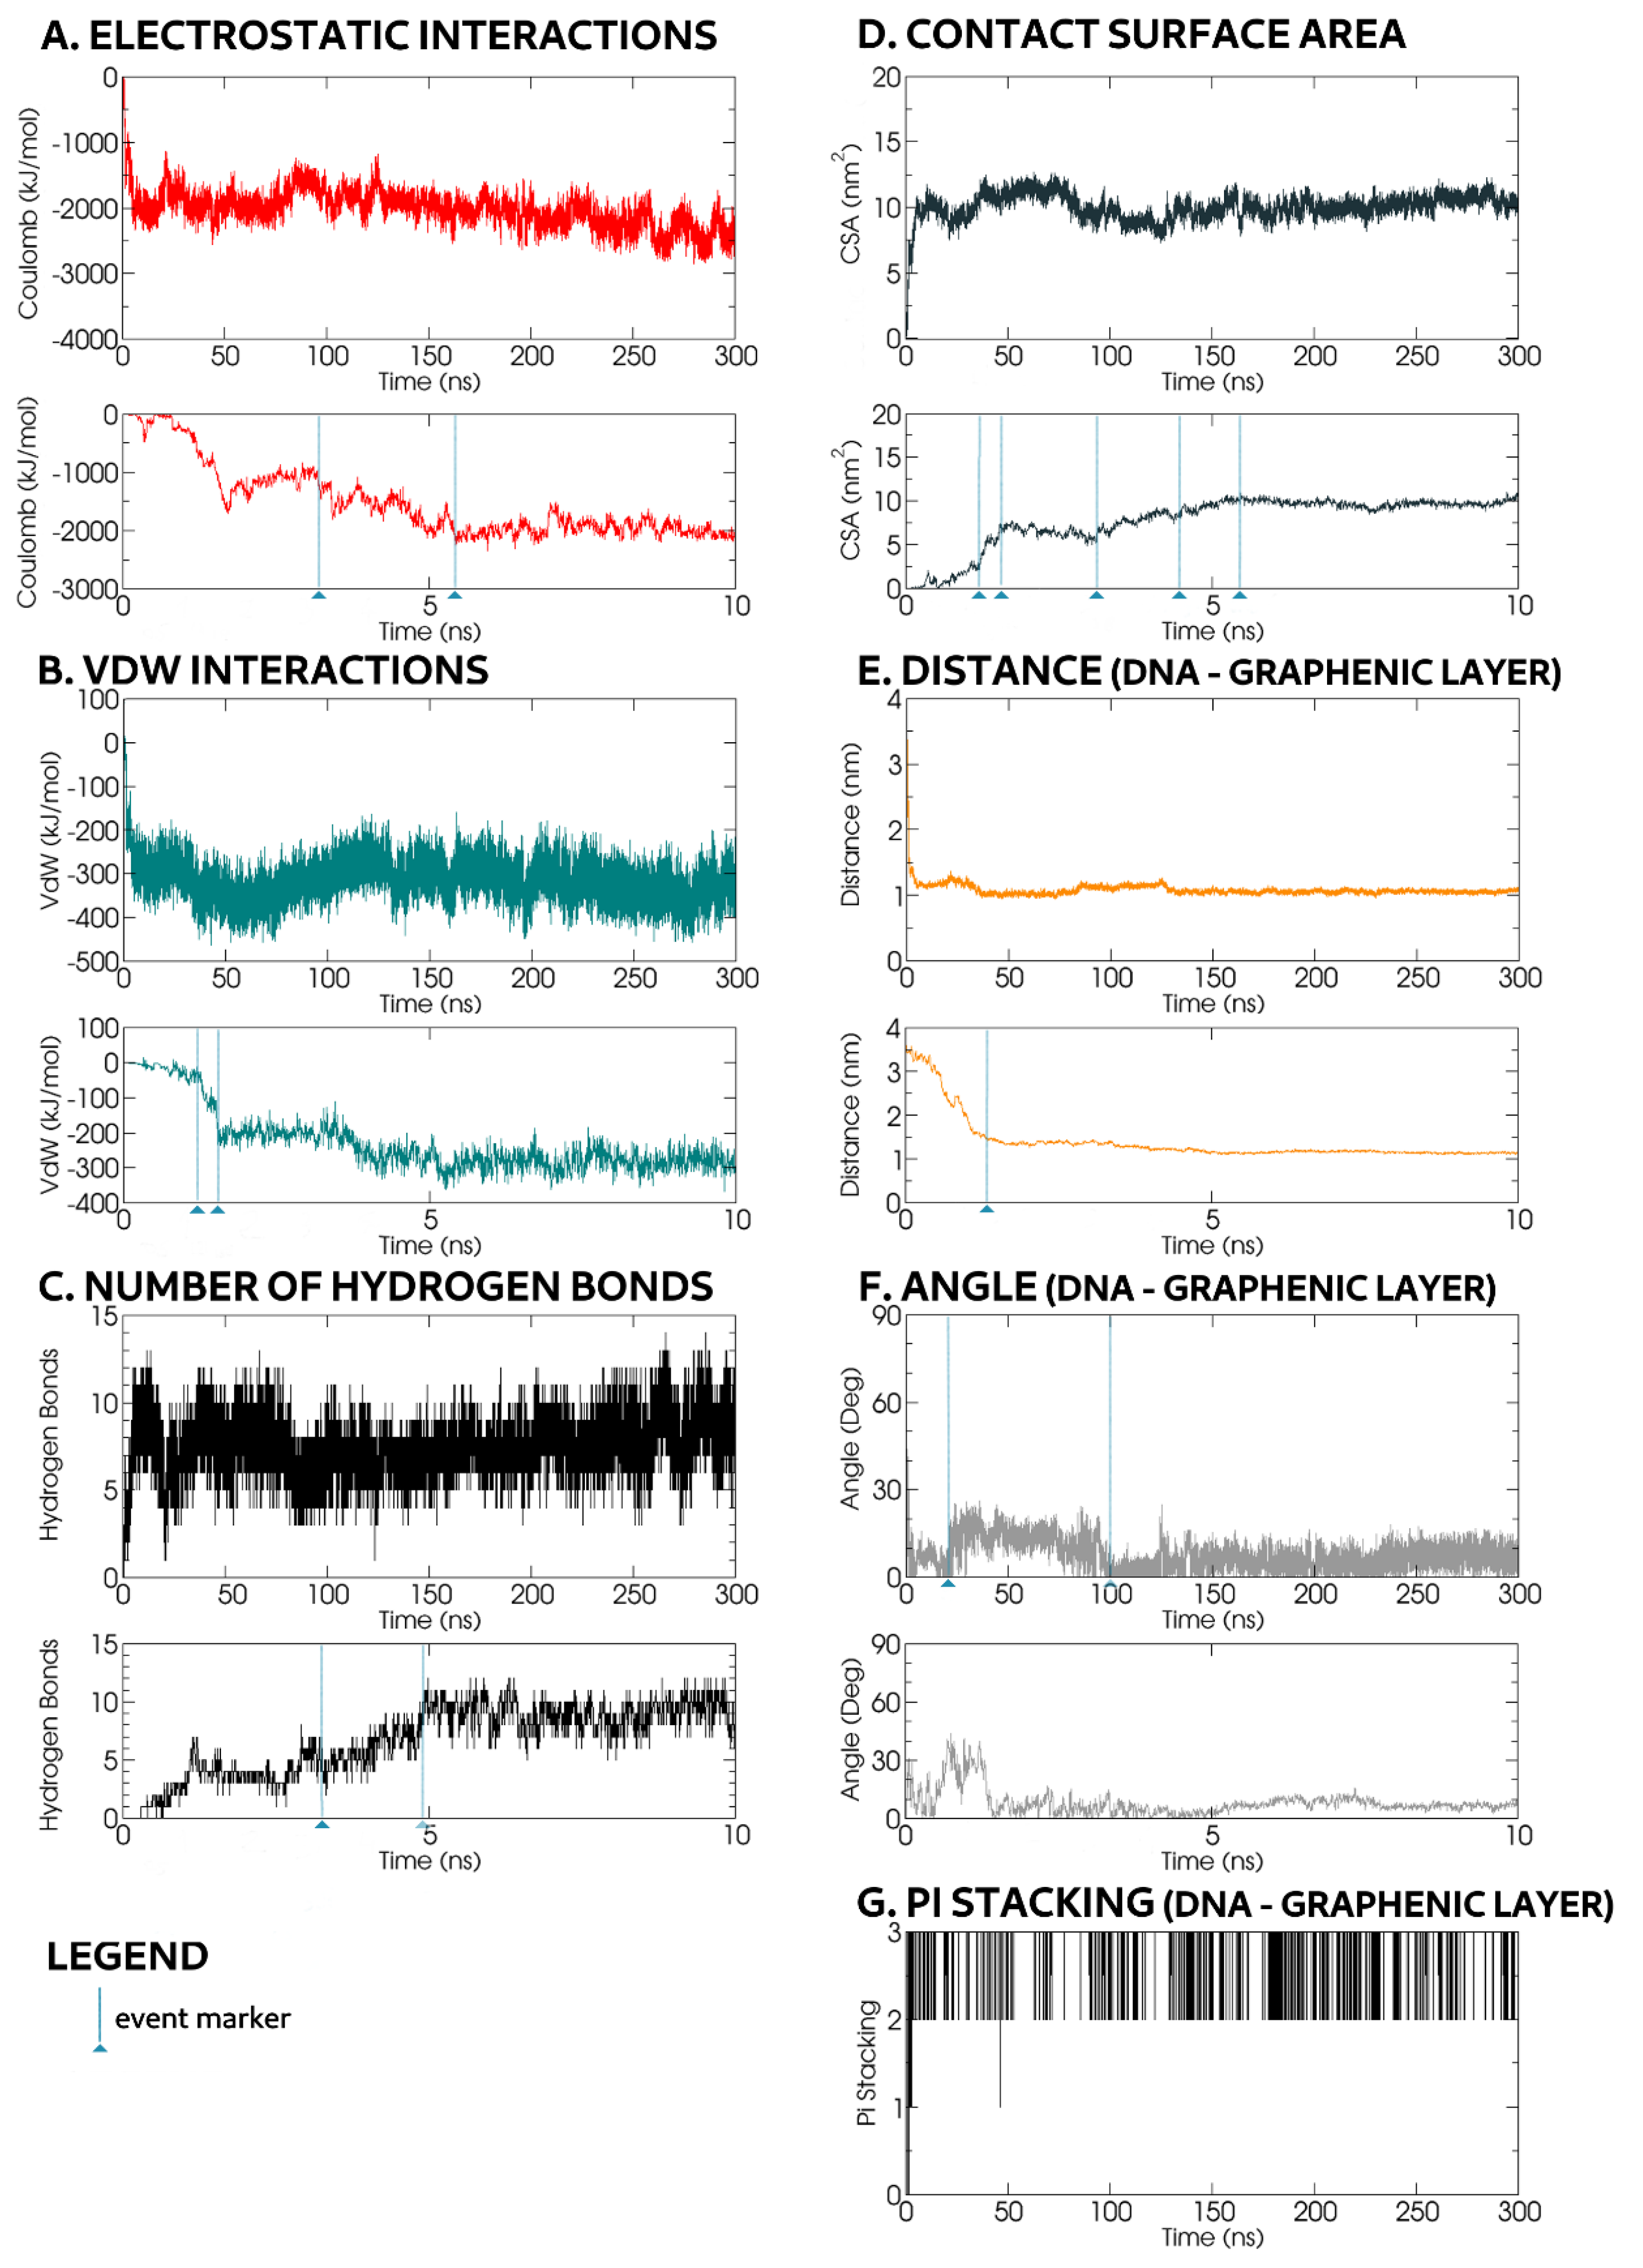
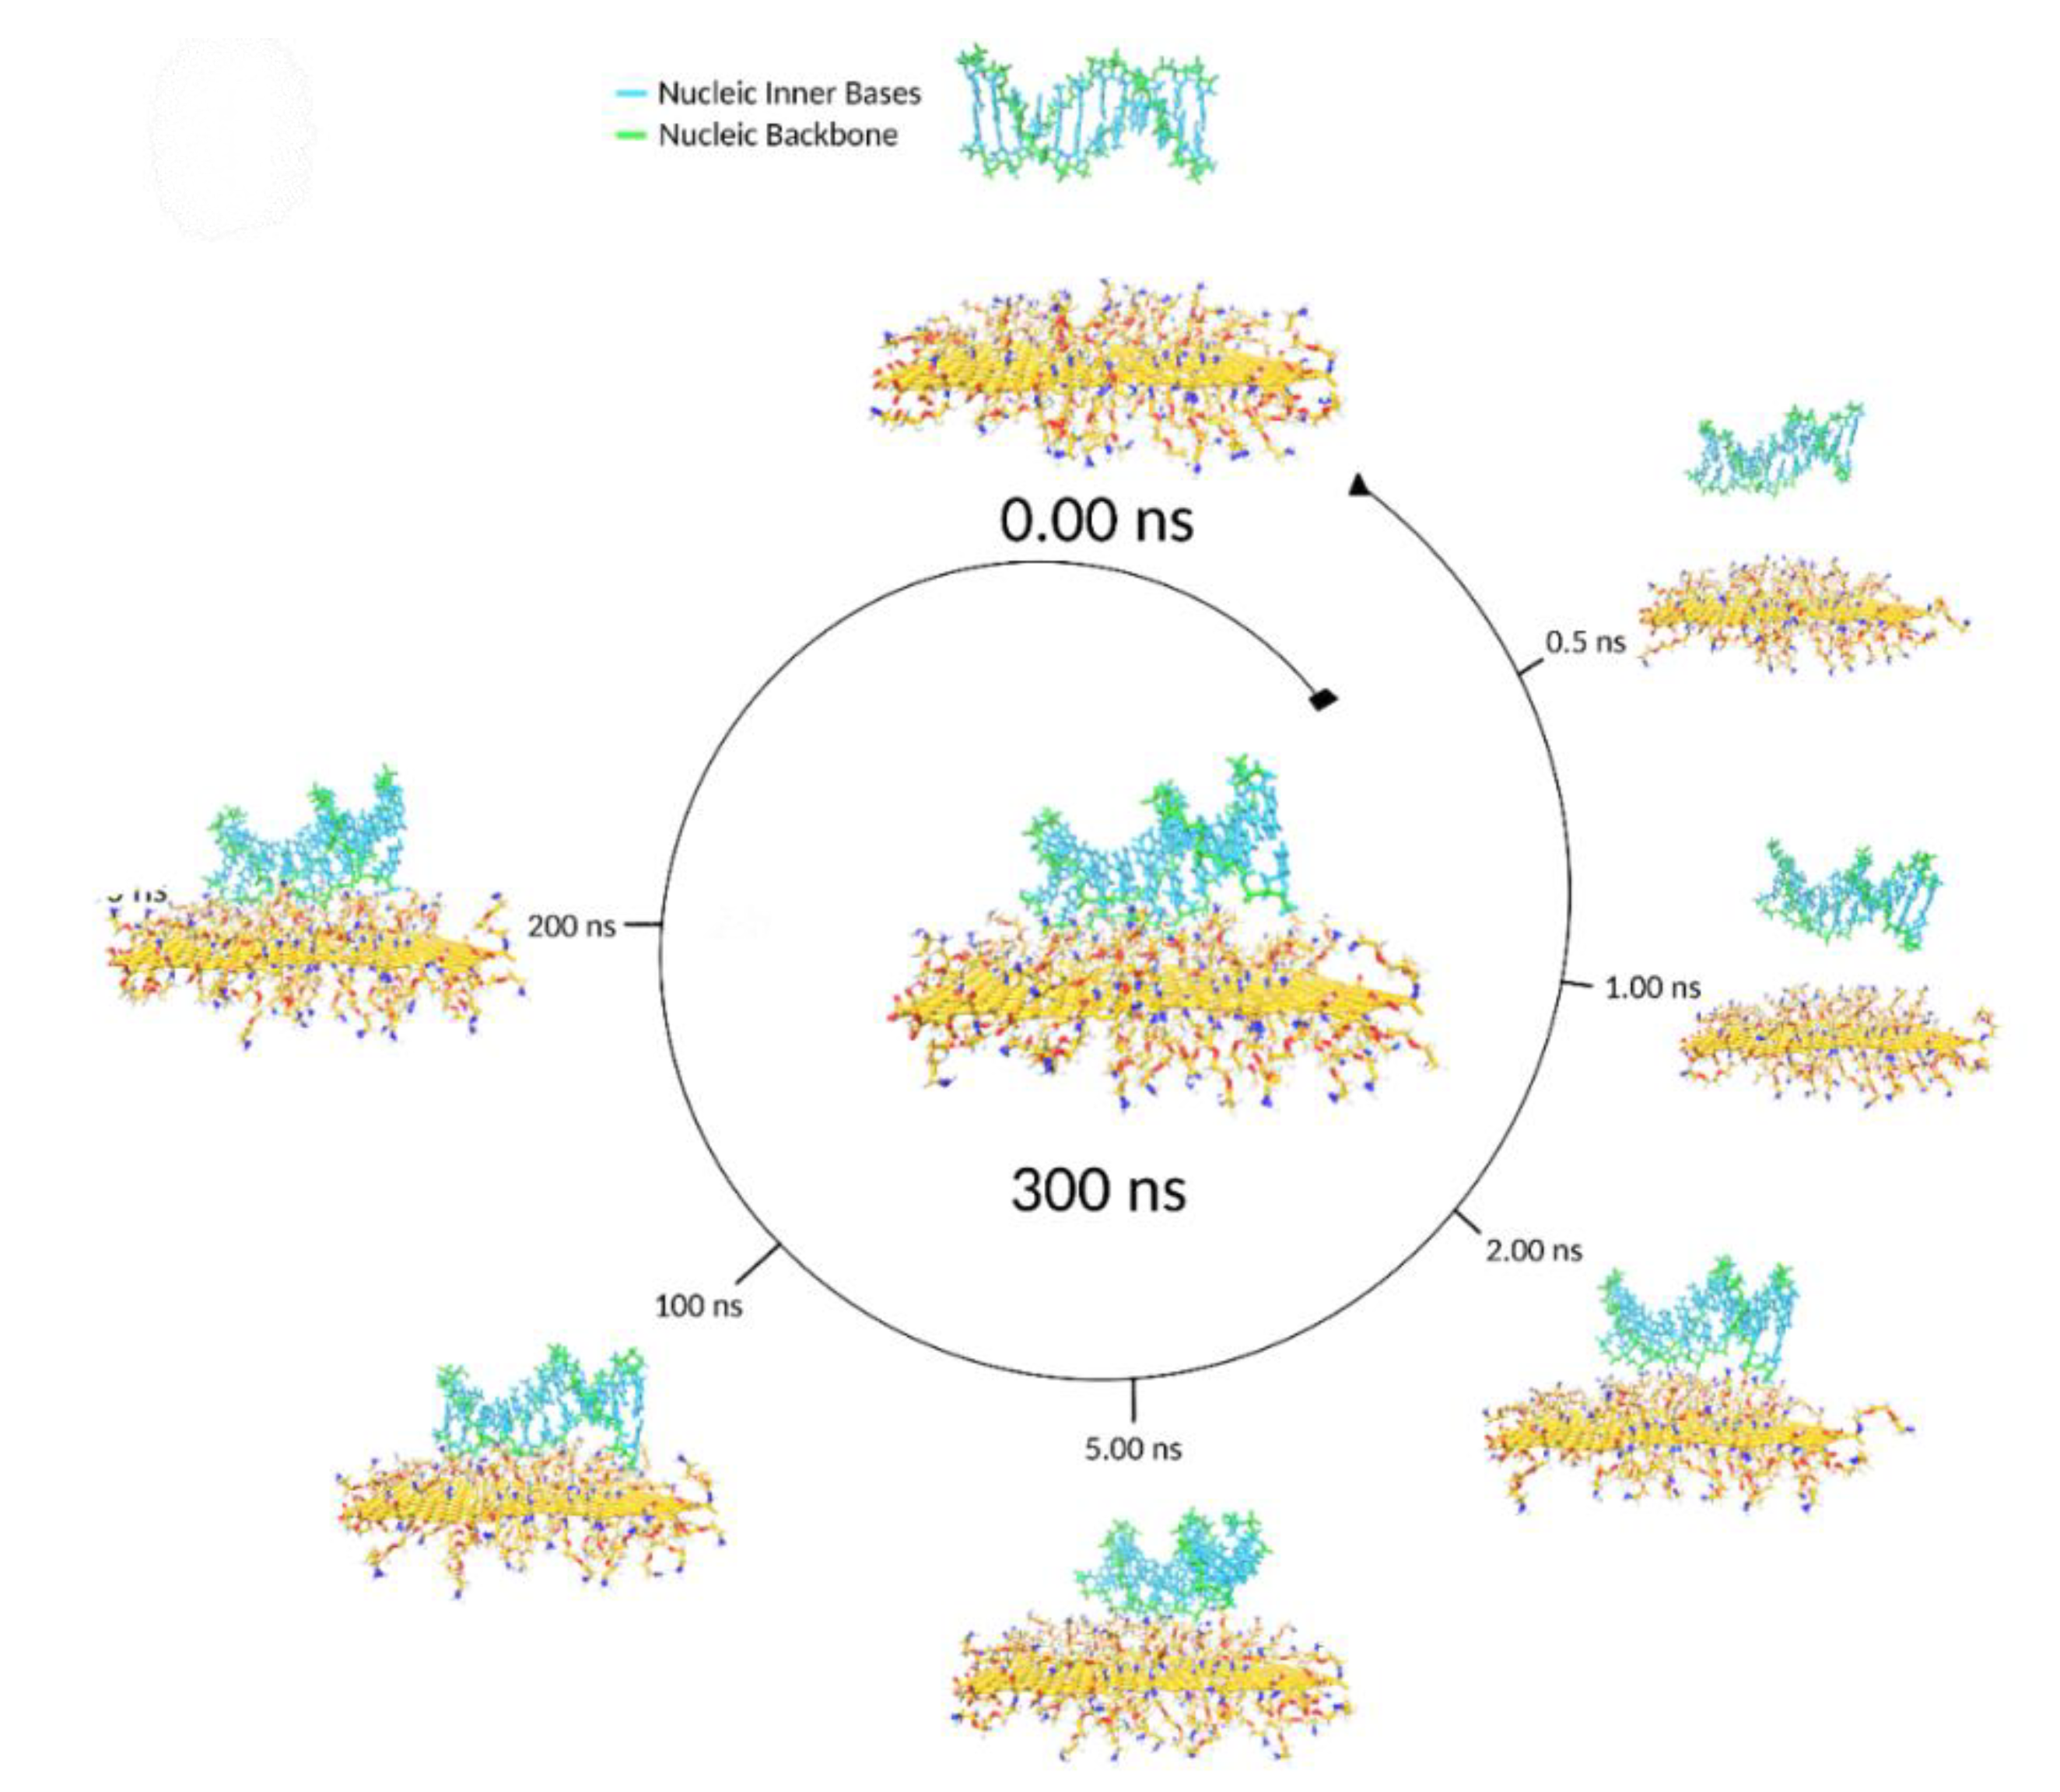
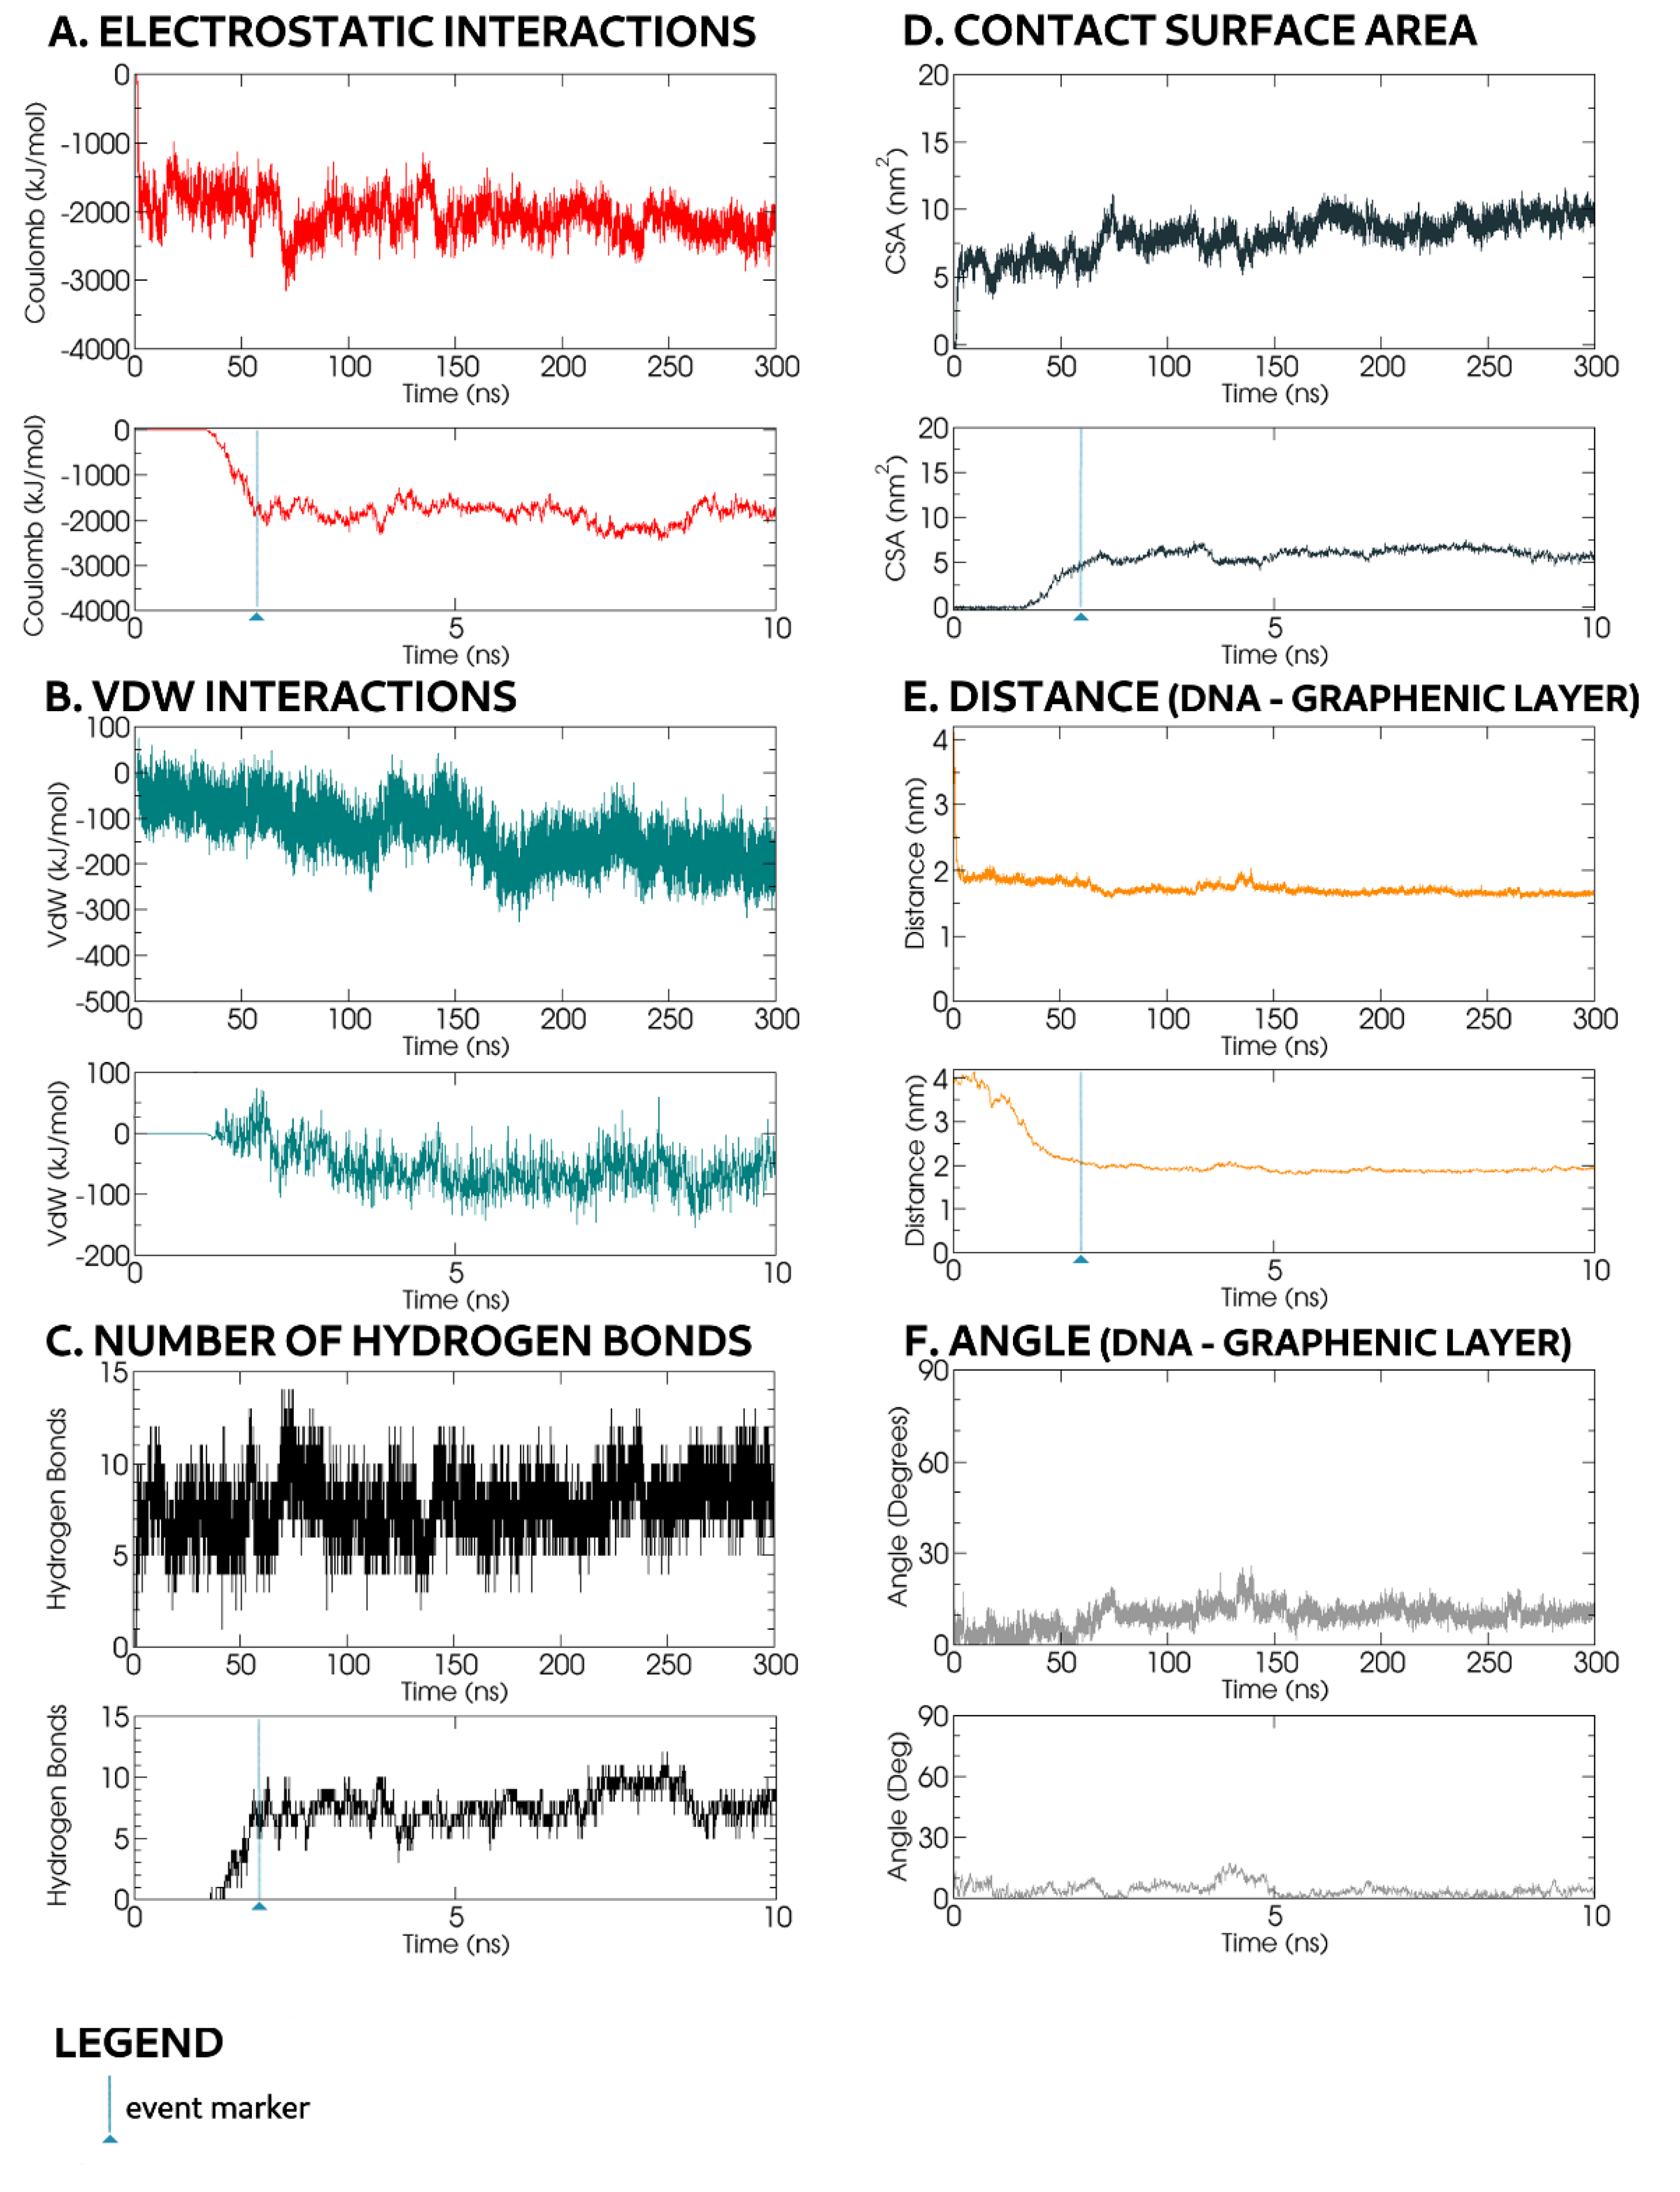
In a typical example, most dynamic adsorption events took place within the first 2 ns. Depending on the initial ssDNA orientation, one end approached the rGO-PEG-NH2, with its phosphate backbone facing the GO surface, achieving contact in ~0.5 ns (Figure 9). Concurrently, the CSA value rose (Figure 10D), while transient hydrogen bonds were reformed (Figure 10C).
The opposite ssDNA end moved towards the PEG-NH2 chains, while the one already in contact with rGO sank deeper into the PEG chain layer according to chain orientation. Within t = 1.33 ns, the intermolecular distance decreased from 4 nm to 1.33 nm, reaching 1.07 nm at 300 ns (Figure 10E). At t = 1.21 ns, during intermolecular proximation, CSA (Figure 10D) and VdW (Figure 10B) values suddenly changed: CSA increased from 2.19 nm2 at t = 1.21 ns to 7.2 nm2 at t = 1.58 ns and VdW energy decreased from −40 kJ mol−1 at t = 1.21 ns to −220 kJ mol−1 at t = 1.58 ns (Figure 10B). These events corresponded to the formation of a π–π stacking structure (Figure 10G). Thus, although one ssDNA end was attracted to the top of the PEG-NH2 chains, the oligonucleotide bases at the other end were anchored the ssDNA to the rGO surface via π–π interactions. This behaviour was more likely when ssDNA was situated in a region with a lower density of PEG-NH2 chains, where more space was available for its bases to form π–π stacking structures with the graphene rings.
The shape of the ssDNA molecule after t = 2 ns remained largely similar until the end of the simulation at t = 300 ns (Figure 9). At t = 22 ns, the angle between the oligonuncleotide backbone and the rGO surface increased to 15–20°, but decreased to 5–10° at t = 100 ns, remaining so until the end of the simulation (Figure 10F).
Events occurring after t = 2 ns included CSA incrementation, from 5 nm2 at t = 3.18 ns to 8 nm2 at t = 4.47 ns and 10 nm2 at t = 5.46 ns (Figure 10D), associated with ssDNA shape rearrangement as the number of hydrogen bonds with the rGO-PEG-NH2 molecule grew from 4–5 at t = 3.18 ns to 10 at t = 4.9 ns (Figure 10C), while Coulomb interactions grew from −1000 kJ mol−1 at t = 3.18 ns to −2200 kJ mol−1 at t = 5.4 ns (Figure 10A).

3.4. Double-Stranded DNA Adsorption on rGO-PEG-NH2 in the Presence of Mg2+ and Cl Ions

During the NVT equilibration step, Cl ions positioned themselves between and around the PEG-NH2 chains, whereas Mg2+ ions were primarily located further away from the graphene. However, some Mg2+ ions were found around the negatively charged phosphate backbone of the dsDNA. Snapshots of simulation events are displayed in Figure 11, while the graphs of specific parameters are shown in Figure 12.
For rGO-PEG-NH2 in the presence of Mg2+ and Cl ions, dsDNA was adsorbed with its backbone orientation parallel to the graphene layer. The main forces involved were electrostatic interactions and to a lesser extent hydrogen bonds. In contrast with GO simulations, π–π stacking interactions did not play a role in the dsDNA adsorption process.
Initially, the dsDNA molecule moved towards the rGO, swaying with loss of some associated Mg2+ ions. Within t = 2 ns, the oligonucleotide backbone to rGO surface distance fell from 4 to 2 nm (Figure 12E), and CSA increased sharply to 5 nm2 (Figure 12D) as the two molecules made contact with the dsDNA backbone captured by the PEG-NH2 chains (Figure 11). The predominant electrostatic Coulomb interactions reached −2000 kJ mol−1 (Figure 12A). Approximately 7–8 hydrogen bonds were formed early in the reaction (Figure 12C); however, the VdW interaction value was relatively weak at −100 kJ mol−1 (Figure 12B).
From this point onward, the position of the dsDNA persisted throughout the rest of the simulation. We noted only modest trends, e.g., the value of the inter-distance graph (Figure 12E) fell from 2 nm at t = 2 ns to 1.65 nm at t = 300 ns as the number of hydrogen bonds increased to between 10 and 12. The energy of the VdW interactions increased correspondingly from the aforementioned −100 kJ mol−1 to −200 kJ mol−1 at t = 300 ns. We could therefore assume that the dsDNA became further associated with the PEG chains following their initial interaction.
Of note, the adsorbed dsDNA was influenced by both the Mg2+ ions and PEG chains. As the dsDNA sank among the PEG chains, the associated segments of the backbone became stretched out. In contrast, for dsDNA grooves facing away from the rGO layer, Mg2+ ions maintained a more contracted oligonucleotide conformation. Overall, the dsDNA became arched, changing its orientation angle (Figure 11). The angle between the oligonucleotide axis and the graphenic surface fluctuated slightly (±5°) over time (Figure 12F).
Thus, we propose that dsDNA molecule was adsorbed on the surface of the rGO-PEG-NH2 species primarily due to electrostatic interactions with the oligonucleotide backbone in an almost parallel orientation to the plane of the graphenic surface. Future studies may seek to optimize the charge derivation method for new computational models of graphene derivatives by making use of ab initio techniques, such as Density Functional Theory.
To aid with following the events described in this section, please see Table 1.

4. Conclusions

We show that the inclusion of Mg2+ ions strongly influenced MD outcomes for both ssDNA and dsDNA adsorption on the GO surface. Typically, ssDNA was adsorbed with its backbone looping over itself with one of its bases anchored to the GO surface through π–π stacking interactions. In contrast to prior MD studies without Mg2+ that suggested dsDNA was adsorbed in an upright perpendicular conformation, we found that dsDNA in the presence of Mg2+ was first adsorbed onto GO with its backbone axis lying tangentially. Highlighting the impact of GO functionalisation, for rGO-PEG-NH2, Mg2+ ions were repelled from the rGO surface. The presence of the PEG chains also meant that both ssDNA and dsDNA molecules were adsorbed on the rGO surface, regardless of the presence of Mg2+ ions. In particular, single-stranded molecules could migrate between the PEG–NH2 chains and form π–π stacking interactions with the rGO surface. The data highlighted the potential importance of the graphenic-functionalized surface heterogeneity for determining the potential outcome of oligonucleotide interactions. We anticipate that our study will facilitate the exploration of the effects of different ion concentrations and oligonucleotide sizes for modelling improved graphene-based biosensor parameters.

Supplementary Materials

The following are available online at https://www.mdpi.com/2079-6412/10/3/289/s1, Table S1: The number of Mg2+ and Cl ions added in each of the different setups; Figure S1: Model displaying the chemical formula of the –NH-PEG-NH2 molecule used in order to create the rGO-PEG-NH2 graphenic species; Figure S2: Ion distribution at the end of the equilibration step; Figure S3: ssDNA adsorption on rGO-PEG-NH2 in the presence of Cl- ions; Figure S4: dsDNA adsorption on rGO-PEG-NH2 in the presence of Cl- ions.

Author Contributions

Conceptualization, M.I. and S.M.; methodology, S.M.; software, S.M., C.G.S. and E.I.S.; validation, S.M.; formal analysis, S.M.; investigation, S.M. and M.I.; resources, C.G.S. and E.I.S.; data curation, S.M.; writing—original draft preparation, S.M.; writing—review and editing, S.M., J.S.B., M.I., C.G.S. and E.I.S.; visualization, S.M.; supervision, M.I.; project administration, M.I.; funding acquisition, M.I. and J.S.B.; All authors have read and agreed to the published version of the manuscript.

Funding

This work was supported by a grant of the Ministry of Research and Innovation, Operational Program Competitiveness Axis 1—Section E, Program co-financed from European Regional Development Fund under the project number 154/25.11.2016, P_37_221/2015, “A novel graphene biosensor testing osteogenic potency; capturing best stem cell performance for regenerative medicine” (GRABTOP).

Conflicts of Interest

The authors declare no conflict of interest.

References

  1. Pykal, M.; Jurečka, P.; Karlický, F.; Otyepka, M. Modelling of graphene functionalization. Phys. Chem. Chem. Phys. 2016, 18, 6351–6372. [Google Scholar] [CrossRef] [PubMed] [Green Version]
  2. Geim, A.K.; Novoselov, K.S. The rise of graphene. Nat. Mat. 2007, 6, 183–191. [Google Scholar] [CrossRef]
  3. Rao, C.N.; Sood, A.K.; Subrahmanyam, K.S.; Govindaraj, A. Graphene: The new two-dimensional nanomaterial. Angew. Chem. Int. Ed. 2009, 48, 7752–7777. [Google Scholar] [CrossRef] [PubMed]
  4. Huang, X.; Yin, Z.; Wu, S.; Qi, X.; He, Q.; Zhang, Q.; Yan, Q.; Boey, F.; Zhang, H. Graphene-based materials: Synthesis, characterization, properties, and applications. Small 2011, 7, 1876–1902. [Google Scholar] [CrossRef] [PubMed]
  5. Campos, R.; Machado, G., Jr.; Cerqueira, M.F.; Borne, J.; Alpuim, P. Wafer scale fabrication of graphene microelectrode arrays for the detection of DNA hybridization. Microelectron. Eng. 2018, 189, 85–90. [Google Scholar] [CrossRef] [Green Version]
  6. Suvarnaphaet, P.; Pechprasarn, S. Graphene-Based Materials for Biosensors: A Review. Sensors 2017, 17, 2161. [Google Scholar] [CrossRef] [PubMed] [Green Version]
  7. Kauling, A.P.; Seefeldt, A.T.; Pisoni, D.P.; Pradeep, R.C.; Bentini, R.; Oliveira, R.V.B.; Novoselov, K.S.; Castro Neto, A.H. The Worldwide Graphene Flake Production. Adv. Mater. 2018, 30, 1803784. [Google Scholar] [CrossRef]
  8. Yang, J.; Hu, P.; Yu, G. Perspective of graphene-based electronic devices: Graphene synthesis and diverse applications. APL Mater. 2019, 7, 020901. [Google Scholar] [CrossRef] [Green Version]
  9. Chen, J.; Chen, L.; Wang, Y.; Chen, S. Molecular dynamics simulations of the adsorption of DNA segments onto graphene oxide. J. Phys. D Appl. Phys. 2014, 47, 5054823. [Google Scholar] [CrossRef]
  10. Zeng, S.; Chen, L.; Wang, Y.; Chen, J. Exploration on the mechanism of DNA adsorption on graphene and graphene oxide via molecular simulations. J. Phys. D Appl. Phys. 2015, 48, 275402. [Google Scholar] [CrossRef]
  11. Xu, Z.; Lei, X.; Tu, Y.; Tan, Z.-J.; Song, B.; Fang, H. Dynamic Cooperation of Hydrogen Binding and π Stacking in ssDNA Adsorption on Graphene Oxide. Chem. Eur. J. 2017, 23, 13100–13104. [Google Scholar] [CrossRef] [PubMed]
  12. Becheru, D.; Vlăsceanu, G.; Banciu, A.; Vasile, E.; Ioniţă, M.; Burns, J. Optical Graphene-Based Biosensor for Nucleic Acid Detection; Influence of Graphene Functionalization and Ionic Strength. Int. J. Mol. 2018, 19, 3230. [Google Scholar] [CrossRef] [PubMed] [Green Version]
  13. Kim, S.; Park, C.; Gang, J. Effect of pH and Salt on Adsorption of Double-Stranded DNA on Graphene Oxide. J. Nanosci. Nanotechnol. 2015, 15, 7913–7917. [Google Scholar] [CrossRef] [PubMed]
  14. Drew, H.R.; Wing, R.M.; Takano, T.; Broka, C.; Tanaka, S.; Itakura, K.; Dickerson, R.E. Structure of a B-DNA dodecamer: Conformation and dynamics. Proc. Natl. Acad. Sci. USA 1981, 78, 2179–2183. [Google Scholar] [CrossRef] [Green Version]
  15. Dans, P.D.; Danilāne, L.; Ivani, I.; Dršata, T.; Lankaš, F.; Hospital, A.; Walther, J.; Pujagut, R.I.; Battistini, F.; Gelpí, J.L. Long-timescale dynamics of the Drew-Dickerson dodecamer. Nucleic Acids Res. 2016, 44, 4052–4066. [Google Scholar] [CrossRef] [Green Version]
  16. Case, D.A.; Cheatham, T.E.; Darden, T.; Gohlke, H.; Luo, R.; Merz, K.M.; Onufriev, A.; Simmerling, C.; Wang, B.; Woods, R.J. The Amber biomolecular simulation programs. J. Comput. Chem. 2005, 26, 1668–1688. [Google Scholar] [CrossRef] [Green Version]
  17. Abraham, M.J.; Murtola, T.; Schulz, R.; Páll, S.; Smith, J.C.; Hess, B.; Lindahl, E. GROMACS: High performance molecular simulations through multi-level parallelism from laptops to supercomputers. SoftwareX 2015, 1, 19–25. [Google Scholar] [CrossRef] [Green Version]
  18. Humphrey, W.; Dalke, A.; Schulten, K. VMD: Visual molecular dynamics. J. Mol. Graph. 1996, 14, 33–38. [Google Scholar] [CrossRef]
  19. Medhekar, N.V.; Ramasubramaniam, A.; Ruoff, R.S.; Shenoy, V.B. Hydrogen Bond Networks in Graphene Oxide Composite Paper: Structure and Mechanical Properties. ACS Nano 2010, 4, 2300–2306. [Google Scholar] [CrossRef]
  20. Nováček, M.; Jankovský, O.; Luxa, J.; Sedmidubský, D.; Pumera, M.; Fila, V.; Lhotka, M.; Klímová, K.; Matějková, S.; Sofer, Z. Tunning of graphene oxide composition by multiple oxidations for carbon dioxide storage and capture of toxic metals. J. Mater. Chem. A 2017, 6, 2739–2748. [Google Scholar] [CrossRef] [Green Version]
  21. Aminated Graphene Amino-PEG covalently linked. Available online: https://www.acsmaterial.com/aminated-graphene-amino-peg-covalently-linked.html (accessed on 5 March 2020).
  22. Rappe, A.K.; Casewit, C.J.; Colwell, K.S.; Goddard, W.A.; Skiff, W.M. UFF, a full periodic table force field for molecular mechanics and molecular dynamics simulations. J. Am. Chem. Soc. 1992, 114, 10024–10035. [Google Scholar] [CrossRef]
  23. Ivani, I.; Dans, P.D.; Noy, A.; Pérez, A.; Faustino, I.; Hospital, A.; Walther, J.; Andrio, P.; Goñi, R.; Balaceanu, A.; et al. Parmbsc1: A refined force field for DNA simulations. Nat. Methods 2016, 13, 55. [Google Scholar] [CrossRef] [PubMed] [Green Version]
  24. Jiang, X.; Gao, J.; Huynh, T.; Huai, P.; Fan, C.; Zhou, R.; Song, B. An improved DNA force field for ssDNA interactions with gold nanoparticles. J. Chem. Phys. 2014, 140, 234102. [Google Scholar] [CrossRef] [PubMed]
  25. Gowers, R.J.; Linke, M.; Barnoud, J.; Reddy, T.J.E.; Melo, M.N.; Seyler, S.L.; Domański, J.; Dotson, D.L.; Buchoux, S.; Kenney, I.M.; et al. MDAnalysis: A Python Package for the Rapid Analysis of Molecular Dynamics Simulations. In Proceedings of the 15th Python in Science Conference, Austin, TX, USA, 11–17 July 2016; pp. 98–105. [Google Scholar] [CrossRef] [Green Version]
  26. Michaud-Agrawal, N.; Denning, E.J.; Woolf, T.B.; Beckstein, O. MDAnalysis: A toolkit for the analysis of molecular dynamics simulations. J. Comput. Chem. 2011, 32, 2319–2327. [Google Scholar] [CrossRef] [PubMed] [Green Version]
  27. Brown, R.F.; Andrews, C.T.; Elcock, A.H. Stacking Free Energies of All DNA and RNA Nucleoside Pairs and Dinucleoside-Monophosphates Computed Using Recently Revised AMBER Parameters and Compared with Experiment. J. Chem. Theory Comput. 2015, 11, 2315–2328. [Google Scholar] [CrossRef] [PubMed]
  28. Kabeláč, M.; Kroutil, O.; Předota, M.; Lankaš, F.; Šíp, M. Influence of a charged graphene surface on the orientation and conformation of covalently attached oligonucleotides: A molecular dynamics study. Phys. Chem. Chem. Phys. 2012, 14, 4217–4229. [Google Scholar] [CrossRef]
  29. Zhang, Y.; Zhou, H.; Ou-Yang, Z.-C. Stretching single-stranded DNA: Interplay of electrostatic, base-pairing, and base-pair stacking interactions. Biophys. J. 2011, 81, 1133. [Google Scholar] [CrossRef] [Green Version]
  30. DiStasio, R.A.; von Helden, G.; Steele, R.P.; Head-Gordon, M. On the T-shaped structures of the benzene dimer. Chem. Phys. Lett. 2007, 437, 277–283. [Google Scholar] [CrossRef]
  31. Wilson, K.A.; Wetmore, S.D. Combining crystallographic and quantum chemical data to understand DNA-protein π-interactions in nature. Struct. Chem. 2017, 28, 1487–1500. [Google Scholar] [CrossRef]
  32. Yoo, J.; Aksimentiev, A. New tricks for old dogs: Improving the accuracy of biomolecular force fields by pair-specific corrections to non-bonded interactions. Phys. Chem. Chem. Phys. 2018, 20, 8432–8449. [Google Scholar] [CrossRef]
  33. Van Duin, A.C.T.; Dasgupta, S.; Lorant, F.; Goddard, W.A. ReaxFF:  A Reactive Force Field for Hydrocarbons. J. Phys. Chem. A 2001, 105, 9396–9409. [Google Scholar] [CrossRef] [Green Version]
Figure 1. The two DNA molecules used, generated with the sequence 5’-CGCGAATTCGCG-3’: (A) Double-stranded deoxyribose nucleic acid (dsDNA); (B) Single-stranded DNA (ssDNA).
Coatings 10 00289 g001
Figure 2. Models of the three different graphenic species involved in obtaining the topologies used in the simulations: (A) Pristine graphene; (B) graphene Oxide (GO) obtained from pristine graphene, with a negative net charge; (C) aminated graphene NH2-PEG (rGO-PEG-NH2) obtained from GO, with a positive net charge.
Coatings 10 00289 g002
Figure 3. Representative conformations of ssDNA during the 300 ns simulation time. (A) conformation anchored to the GO surface by hydrogen bonds formed by a terminal nucleobase; (B) condensed conformation anchored to the GO surface by π–π stacking formed by a terminal nucleobase.
Coatings 10 00289 g003
Figure 4. T-shaped π–π stacking shown as a simulation snapshot (left) and as a schematic (right).
Coatings 10 00289 g004
Figure 5. Trajectory snapshots ranging from 0 to 300 ns of ssDNA and GO in the presence of both Mg2+ and Cl atoms (ions not shown).
Coatings 10 00289 g005
Figure 6. Evolution of different parameters over the 300 ns simulation time: (A) Electrostatic interactions between GO and ssDNA; (B) VdW interactions between GO and ssDNA; (C) Interaction energy between GO and ssDNA; (D) Hydrogen bonds formed between GO and ssDNA; (E) Contact surface area between GO and ssDNA; (F) Distance between the ssDNA molecule and the graphene layer; (G) Angle between the ssDNA molecule and the graphenic layer; (H) π–π stacking between ssDNA and the graphenic layer; (I) Electrostatic interactions between the ssDNA molecules and Mg2+ ions within 1.4 nm of both the ssDNA and the GO.
Coatings 10 00289 g006
Figure 7. Trajectory snapshots ranging from 0 to 300 ns of dsDNA and GO in the presence of both Mg2+ and Cl atoms (ions not shown).
Coatings 10 00289 g007
Figure 8. Evolution of different parameters over the 300ns simulation time: (A) Electrostatic interactions between GO and dsDNA; (B) VdW interactions between GO and dsDNA; (C) Interaction energy between GO and dsDNA; (D) Hydrogen bonds formed between GO and dsDNA; (E) Contact surface area between GO and dsDNA; (F) Distance between the dsDNA molecule and the graphene layer; (G) Angle between the dsDNA molecule and the graphenic layer; (H) π–π stacking between dsDNA and the graphenic layer; (I) Electrostatic interactions between the dsDNA molecules and Mg2+ ions within 1.4 nm of both the dsDNA and the GO.
Coatings 10 00289 g008
Figure 9. Trajectory snapshots ranging from 0 to 300 ns of ssDNA and rGO-PEG-NH2 in the presence of both Mg2+ and Cl atoms (ions not shown).
Coatings 10 00289 g009
Figure 10. Evolution of different parameters over the 300 ns simulation time: (A) Electrostatic interactions between rGO and ssDNA; (B) VdW interactions between rGO and ssDNA; (C) Hydrogen bonds formed between rGO and ssDNA; (D) Contact surface area between rGO and ssDNA; (E) Distance between the ssDNA molecule and the graphenic layer; (F) Angle between the ssDNA molecule and the graphenic layer; (G) π–π stacking between ssDNA and the graphenic layer.
Coatings 10 00289 g010
Figure 11. Trajectory snapshots ranging from 0 to 300 ns of dsDNA and rGO-PEG-NH2 in the presence of both Mg2+ and Cl atoms (ions not shown).
Coatings 10 00289 g011
Figure 12. Evolution of different parameters over the 300 ns simulation time: (A) Electrostatic interactions between rGO and dsDNA; (B) VdW interactions between rGO and dsDNA; (C) Hydrogen bonds formed between rGO and dsDNA; (D) Contact surface area between rGO and dsDNA; (E) Distance between the dsDNA molecule and the graphenic layer; (F) Angle between the dsDNA molecule and the graphenic layer.
Coatings 10 00289 g012
Table 1. Summary of all events throughout the 300ns simulated time for each of the four presented cases. The specific time of each event is then associated to the graphs displaying a change in value, which were referenced in the description of events.
GO ssDNAGO dsDNA
Coatings 10 00289 i001 Coatings 10 00289 i002
0.6 ns (HB, CSA); 0.89 ns (CSA); 2.50 ns (HB, CSA, Pi stacking); 5.40 ns (HB, CSA, Distance); 22.4 ns (Angle, Coulomb, VdW, Interaction Energy, CSA, Distance); 212 ns (Pi stacking, CSA, VdW)1–2 ns (Coulomb, VdW, Interaction Energy); 2 ns (CSA); 2.75 ns (HB); 50 ns (Coulomb); 84 ns (Pi Stacking, CSA); 200 ns (Pi stacking, CSA, VdW, Angle)
rGO-PEG-NH2 ssDNArGO-PEG-NH2 dsDNA
Coatings 10 00289 i003 Coatings 10 00289 i004
1.33 ns (Distance); 1.21–1.58 ns (CSA, VdW, Pi Stacking); 3.18–4.47 ns (CSA, HB); 3.18–5.46 ns (Coulomb); 22 ns (Angle); 100 ns (Angle)2 ns (Distance, CSA, Coulomb, HB, VdW); 300 ns (Distance, VdW)

