Article

Characterization of a C-Based Coating Applied on an AA6063 Alloy and Developed by a Novel Electrochemical Synthesis Route

by
Adriana Gallegos-Melgar
1,*,
Yael González-López
2,
Arturo Abúndez
2,
Francisco Javier Flores-Ruiz
3,
Juan C. Díaz-Guillén
1,
José. A. Betancourt-Cantera
1,
Maricruz Hernández-Hernández
1,
Gerardo Trápaga-Martínez
4,
Carlos. A. Poblano-Salas
5,
Jorge. L. Acevedo-Dávila
6 and
Jan Mayen
7,*
1
CONACYT-Corporación Mexicana de Investigación en Materiales, Saltillo C.P. Coahuila 25290, Mexico
2
Tecnológico Nacional de México-Centro Nacional de Investigación y Desarrollo Tecnológico (CENIDET), Prolongación Palmira s/n esq. Apatzingán, Col. Palmira. Cuernavaca 62490, Morelos, Mexico
3
CONACYT-Instituto de Física, Benemérita Universidad Autónoma de Puebla, Apdo. Post. J-48, Puebla Pue 72570, Mexico
4
CIATEQ A. C. Centro de Tecnología Avanzada, San Agustín del Retablo No. 150, Querétaro 76150, Mexico
5
Centro de Tecnología Avanzada A.C., Procesos de Manufactura, Av. Manantiales 23-A, Parque Industrial Bernardo Quintana, El Marqués 76246, Qro, Mexico
6
Corporación Mexicana de Investigación en Materiales, Saltillo C.P. Coahuila 25290, Mexico
7
CONACYT-CIATEQ, Unidad San Luis Potosí, Eje 126 No. 225, Zona Industrial, San Luis Potosí (S.L.P) 78395, Mexico
*
Authors to whom correspondence should be addressed.
Coatings 2020, 10(2), 145; https://doi.org/10.3390/coatings10020145
Submission received: 13 January 2020 / Revised: 26 January 2020 / Accepted: 31 January 2020 / Published: 5 February 2020
(This article belongs to the Section Surface Characterization, Deposition and Modification)

Abstract

:
This research aimed to obtain a C-based coating electrochemically applied on an AA6063 alloy. Two electrochemical cells were designed and manufactured to obtain the C-based coating film on flat and cylindrical samples. Structural and microstructural characterizations were performed along with fatigue and corrosion performance testing. The structural and microstructural characterization revealed that the C-based coating deposited on AA6063 corresponded to carbon nanofibers and/or polycrystalline graphite. The performance testing showed an increase in fatigue life along with a decrease in corrosion resistance. The fracture surfaces of the fatigued samples were inspected by Scanning Electron Microscopy and 3D optical microscopy to correlate them with fatigue life estimation. The aforementioned process is a step towards the future development of a complete coating system that will overcome corrosion susceptibility. The carbon film obtained by this electrochemical route has not previously been reported elsewhere.

1. Introduction

Fatigue is a phenomenon related to damage accumulation that leads to cracking and failure of structural parts [1]. This phenomenon has been extensively investigated since the XIX century [1,2] and has led to many catastrophes in human history, some of which involved the loss of human life [2]. Researchers and engineers are still searching for solutions to minimize fatigue failures of structural parts, thereby increasing the fatigue life of materials [3]. Among those solutions are hard coatings and films, which help to enhance the fatigue resistance of metals and alloys. Some of the most critical fields of application of coatings designed to reduce fatigue susceptibility are the automobile, aeronautical, aerospace, marine, and construction industries [4,5,6,7], as well as the metalworking industries, which manufacture products such as dies for molds and tools for medical and home appliances [8,9]. Aluminum alloys and steels are the materials of choice in the aforementioned industries. On the other hand, there are several processing routes to obtain hard coatings and films for industrial applications, such as PVD [8], CVD [10], and electrochemical route [11] coatings. Diamond-like carbon (DLC) coatings offer excellent mechanical properties and a low friction coefficient [12,13,14]. These coatings are gaining interest among researchers as can be seen in the reported literature [15] and real-life applications [16]. The most common processing technology, however, relies on the PVD technique, which offers high quality C-based films [17]. However, this technique has some technical limitations, such as issues related to complex geometries and elevated operating costs that make the escalation of the technology difficult to accomplish. In recent years, electrodeposition has emerged as a DLC deposition technique [18,19,20,21,22,23,24,25,26]. This deposition technique has been employed since 1992 [27]. Deposition from the liquid phase results in low temperature deposition and size scaling. The voltage and temperatures which are reported in different works [18,19,20,21,22,23,24,25,26] are from 3000 V to 1 V and from 24 h to 0.5 h, as Table 1 shows. There are few works which report the use of acetic acid as an electrolyte and low voltage for the deposition of DLC on metallic substrates. Hence, this work investigated an electrochemical route to obtain DLC [19,20,21,22] with the aim to increase the fatigue life of metals and alloys at a relatively low cost, which would eventually lead to up-scaling at industrial level for complex geometries.

2. Experimental Details

The substrate material selected for this research was AA6063-T6 alloy, which is used to manufacture structural components in the industries mentioned above. The designed rectangular plate specimens were machined and polished to a 2500 SiC grit grade.
The chemical composition and mechanical properties of the aluminum were previously characterized [31] and are reported in weight percentage: Fe0.27, Mg0.85, Mn0.05, Si0.43, and Al98.40.
A DC voltage power source up to 32 V was used to deposit the films. The deposition diameter of the samples was set to 1.9 cm. The electrodeposition experiments were performed with a voltage ranging from 1 to 30 V. The evaluated deposition times were 0.5, 1.5, 2.5, 3.0, and 5.0 h. An electrolyte carbon source concentration of 1% volume of acetic acid was used in this work. The separation between the graphite electrode and the sample surface was 10 mm.

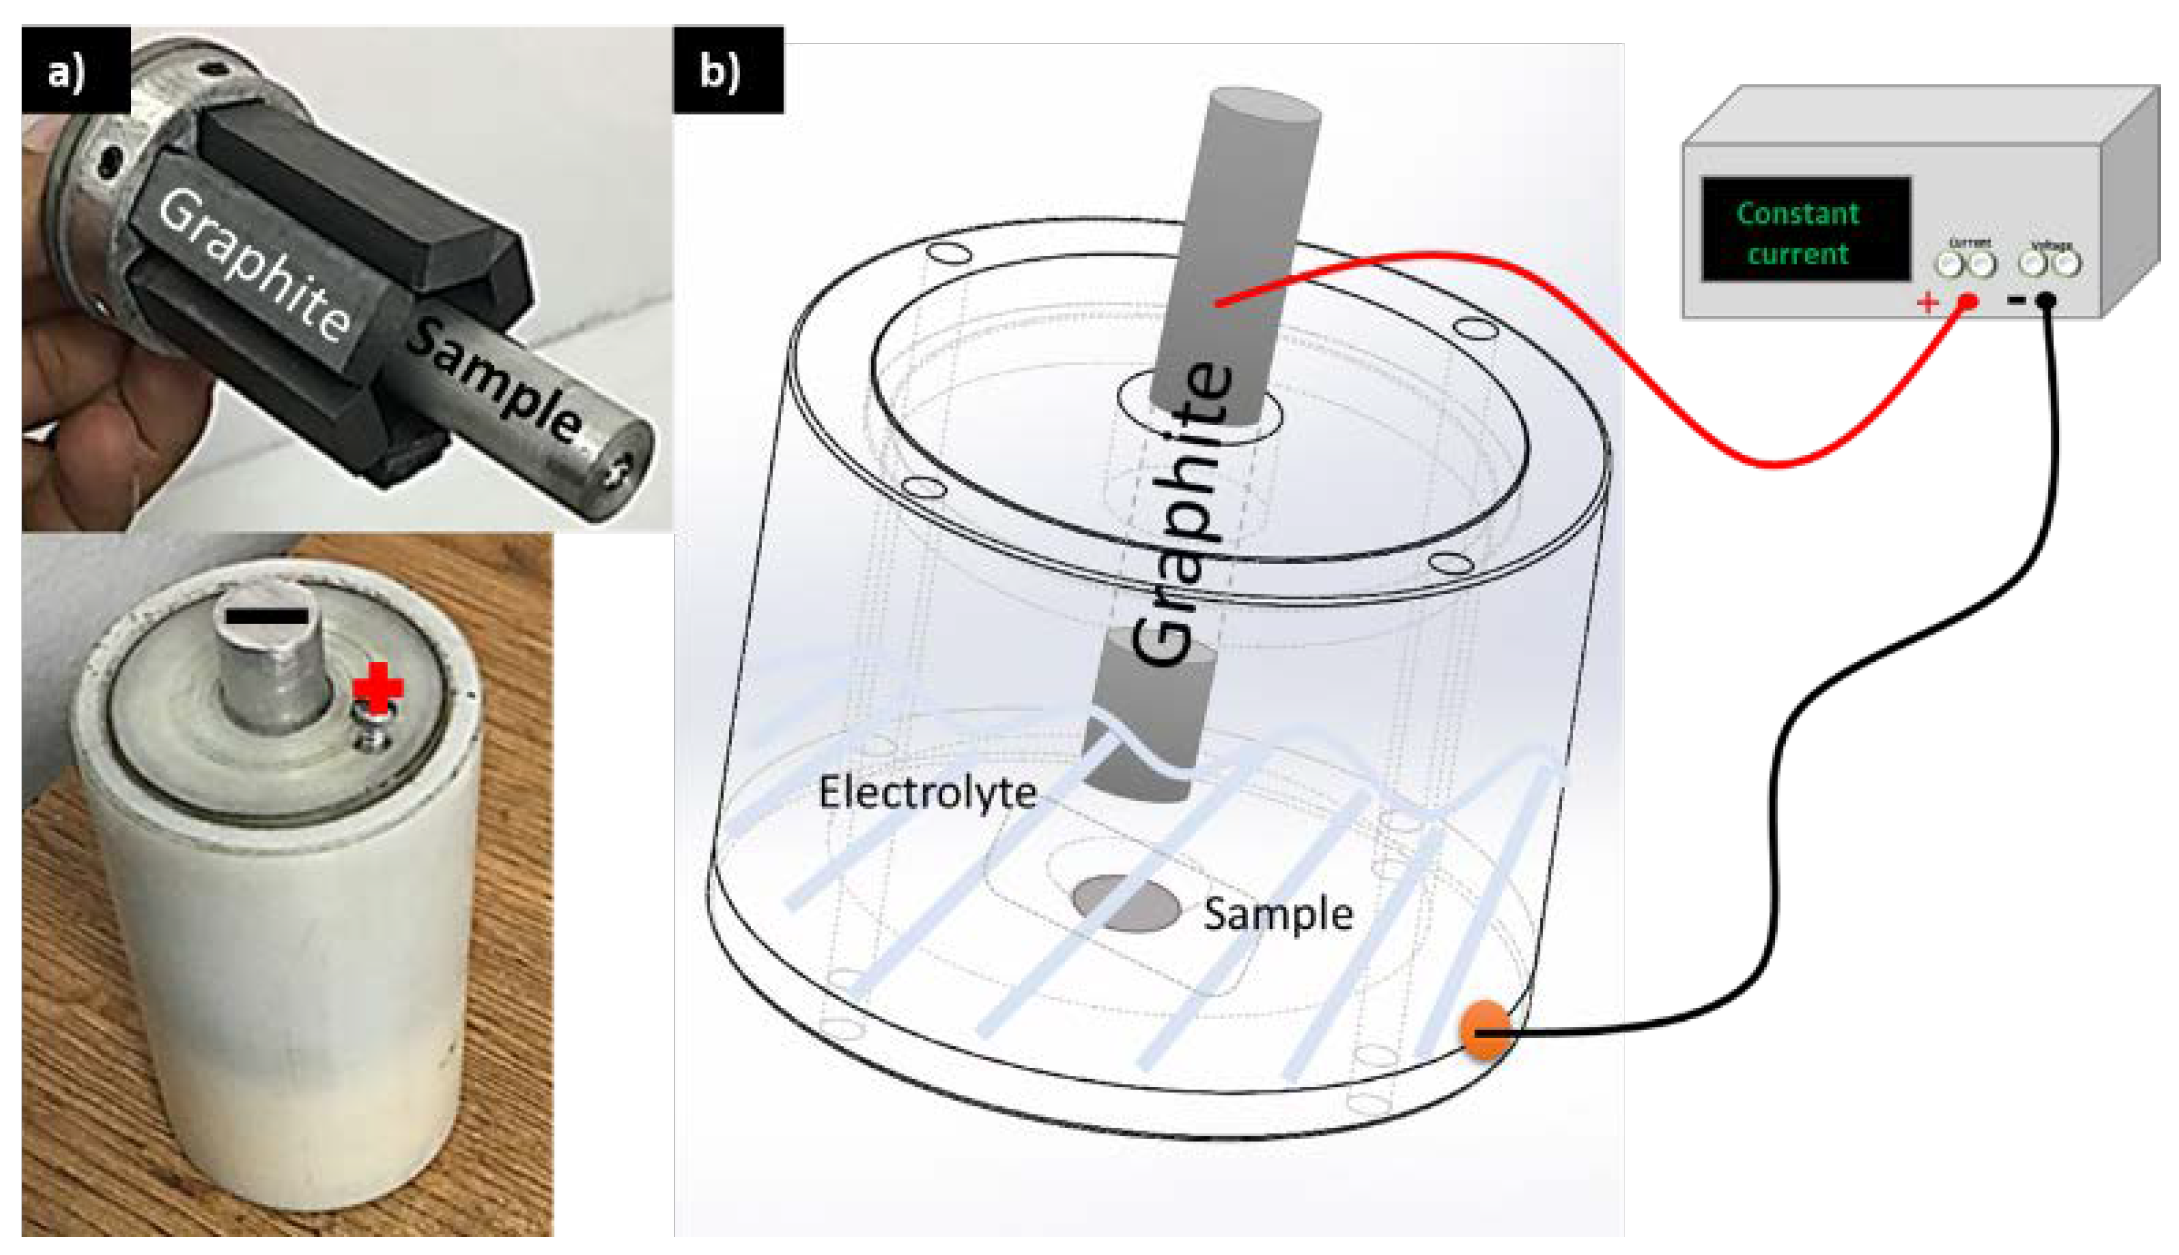
2.1. Electrochemical Synthesis of C-based Coatings

The design and manufacture of the electrochemical cells to deposit the C-based films are presented in Figure 1. Figure 1b shows the cell designed to deposit the films on the flat samples, where the graphite bar was placed at 10 mm up to the substrate and connected to the cathode and the substrate to the anode; Figure 1a shows the cell designed to deposit the films on the fatigue samples, the graphite was placed around the sample keeping 10 mm of separation between the sample and the graphite, the graphite was connected to the cathode and the sample to the anode.
According to Roy et al. [19], in Equation (1) the methyl groups are transported to the cathode until the aluminum surface is saturated with a high concentration of CH3+ radicals and 2H+ ions.
CH 3 COOH + H 2 O CH 3 + + ( COOH ) + H + + ( OH ) CH 3 + + CO 2 + ( OH ) + 2 H +
Additionally, 1g of NaHCO3 was added to the electrolyte to increase the evolution of H+ >> H2 (see Equation (2)), which raises the conductivity and produces faster deposition rates at low voltages, thus significantly reducing the operation costs by the presence of CH3COONa. It is well known that sodium acetate and acetic acid in a solution act as a buffer to maintain a relatively constant pH level, which helps to stabilize the electrodeposition procedure.
NaHCO 3 Na + + HCO 3

2.2. Structural and Microstructural Characterization Procedure

To measure the thickness, a small layer of Kapton tape was pasted on one side of the samples. Roughness was obtained by two different methods, namely Atomic Force Microscopy (AFM) and profilometry. The Raman spectra were measured with a 632.91 nm source. In addition, Scanning Electron Microscopy (SEM) was used to visually characterize the morphology of the C-based films and the fracture surface of the fatigue samples.

2.3. Fatigue Testing Procedure

The circular transversal section for rotating fatigue samples was designed and machined according to the Moore standard for rotating-beam fatigue testing. The geometric parameters, such as testing diameter (DT), gripping diameter (DG), radius of curvature (RC), and sample length (LS) are described below.
  • DT = 6.35 mm;
  • DG = 2DT = 12.70 mm;
  • RC = 8DT = 50.80 mm;
  • LS = 16DT = 101.6 mm.
The rotating fatigue testing was carried out following the Moore experimental setup [32] with a constant stress sinusoidal amplitude of 150 MPa at a frequency of 29 Hz. The test was performed at room temperature (approximately 25 °C), the force was controlled by calibrated hanging weights. Additionally, six samples per deposition condition were fatigue tested.

2.4. Polarization Resistance Testing Procedure

The polarization resistance evaluation was performed using a DropSens μSTAT 400 potentiostat/galvanostat. The corrosive solution for the test was 3% NaCl to simulate an aggressive marine environment. An Ag/AgCl electrode was used as a reference electrode and a graphite round bar was used as an auxiliary electrode. One specimen per condition was tested at room temperature. The electrochemical scanning parameters for the potentiodynamic polarization tests were in a range from −1 to 1 V for the open-circuit potential value, at 0.008 V/s scan rate (Srate), with a step potential (Estep) of 0.001 V, at a preconditioned time (tprecond) of 5 s.

3. Results and Discussion

The aim of this work was to grow diamond-like carbon films using AA6063 alloy as a substrate using an electrochemical route, as reported by several researchers [20,21]. However, a lower concentration of CH3COOH was used in comparison to other reported works. The following subsections contain the discussion of the results of the structural and microstructural characterization, along with fatigue testing, and the correspondent analysis of the fractured surface of samples.

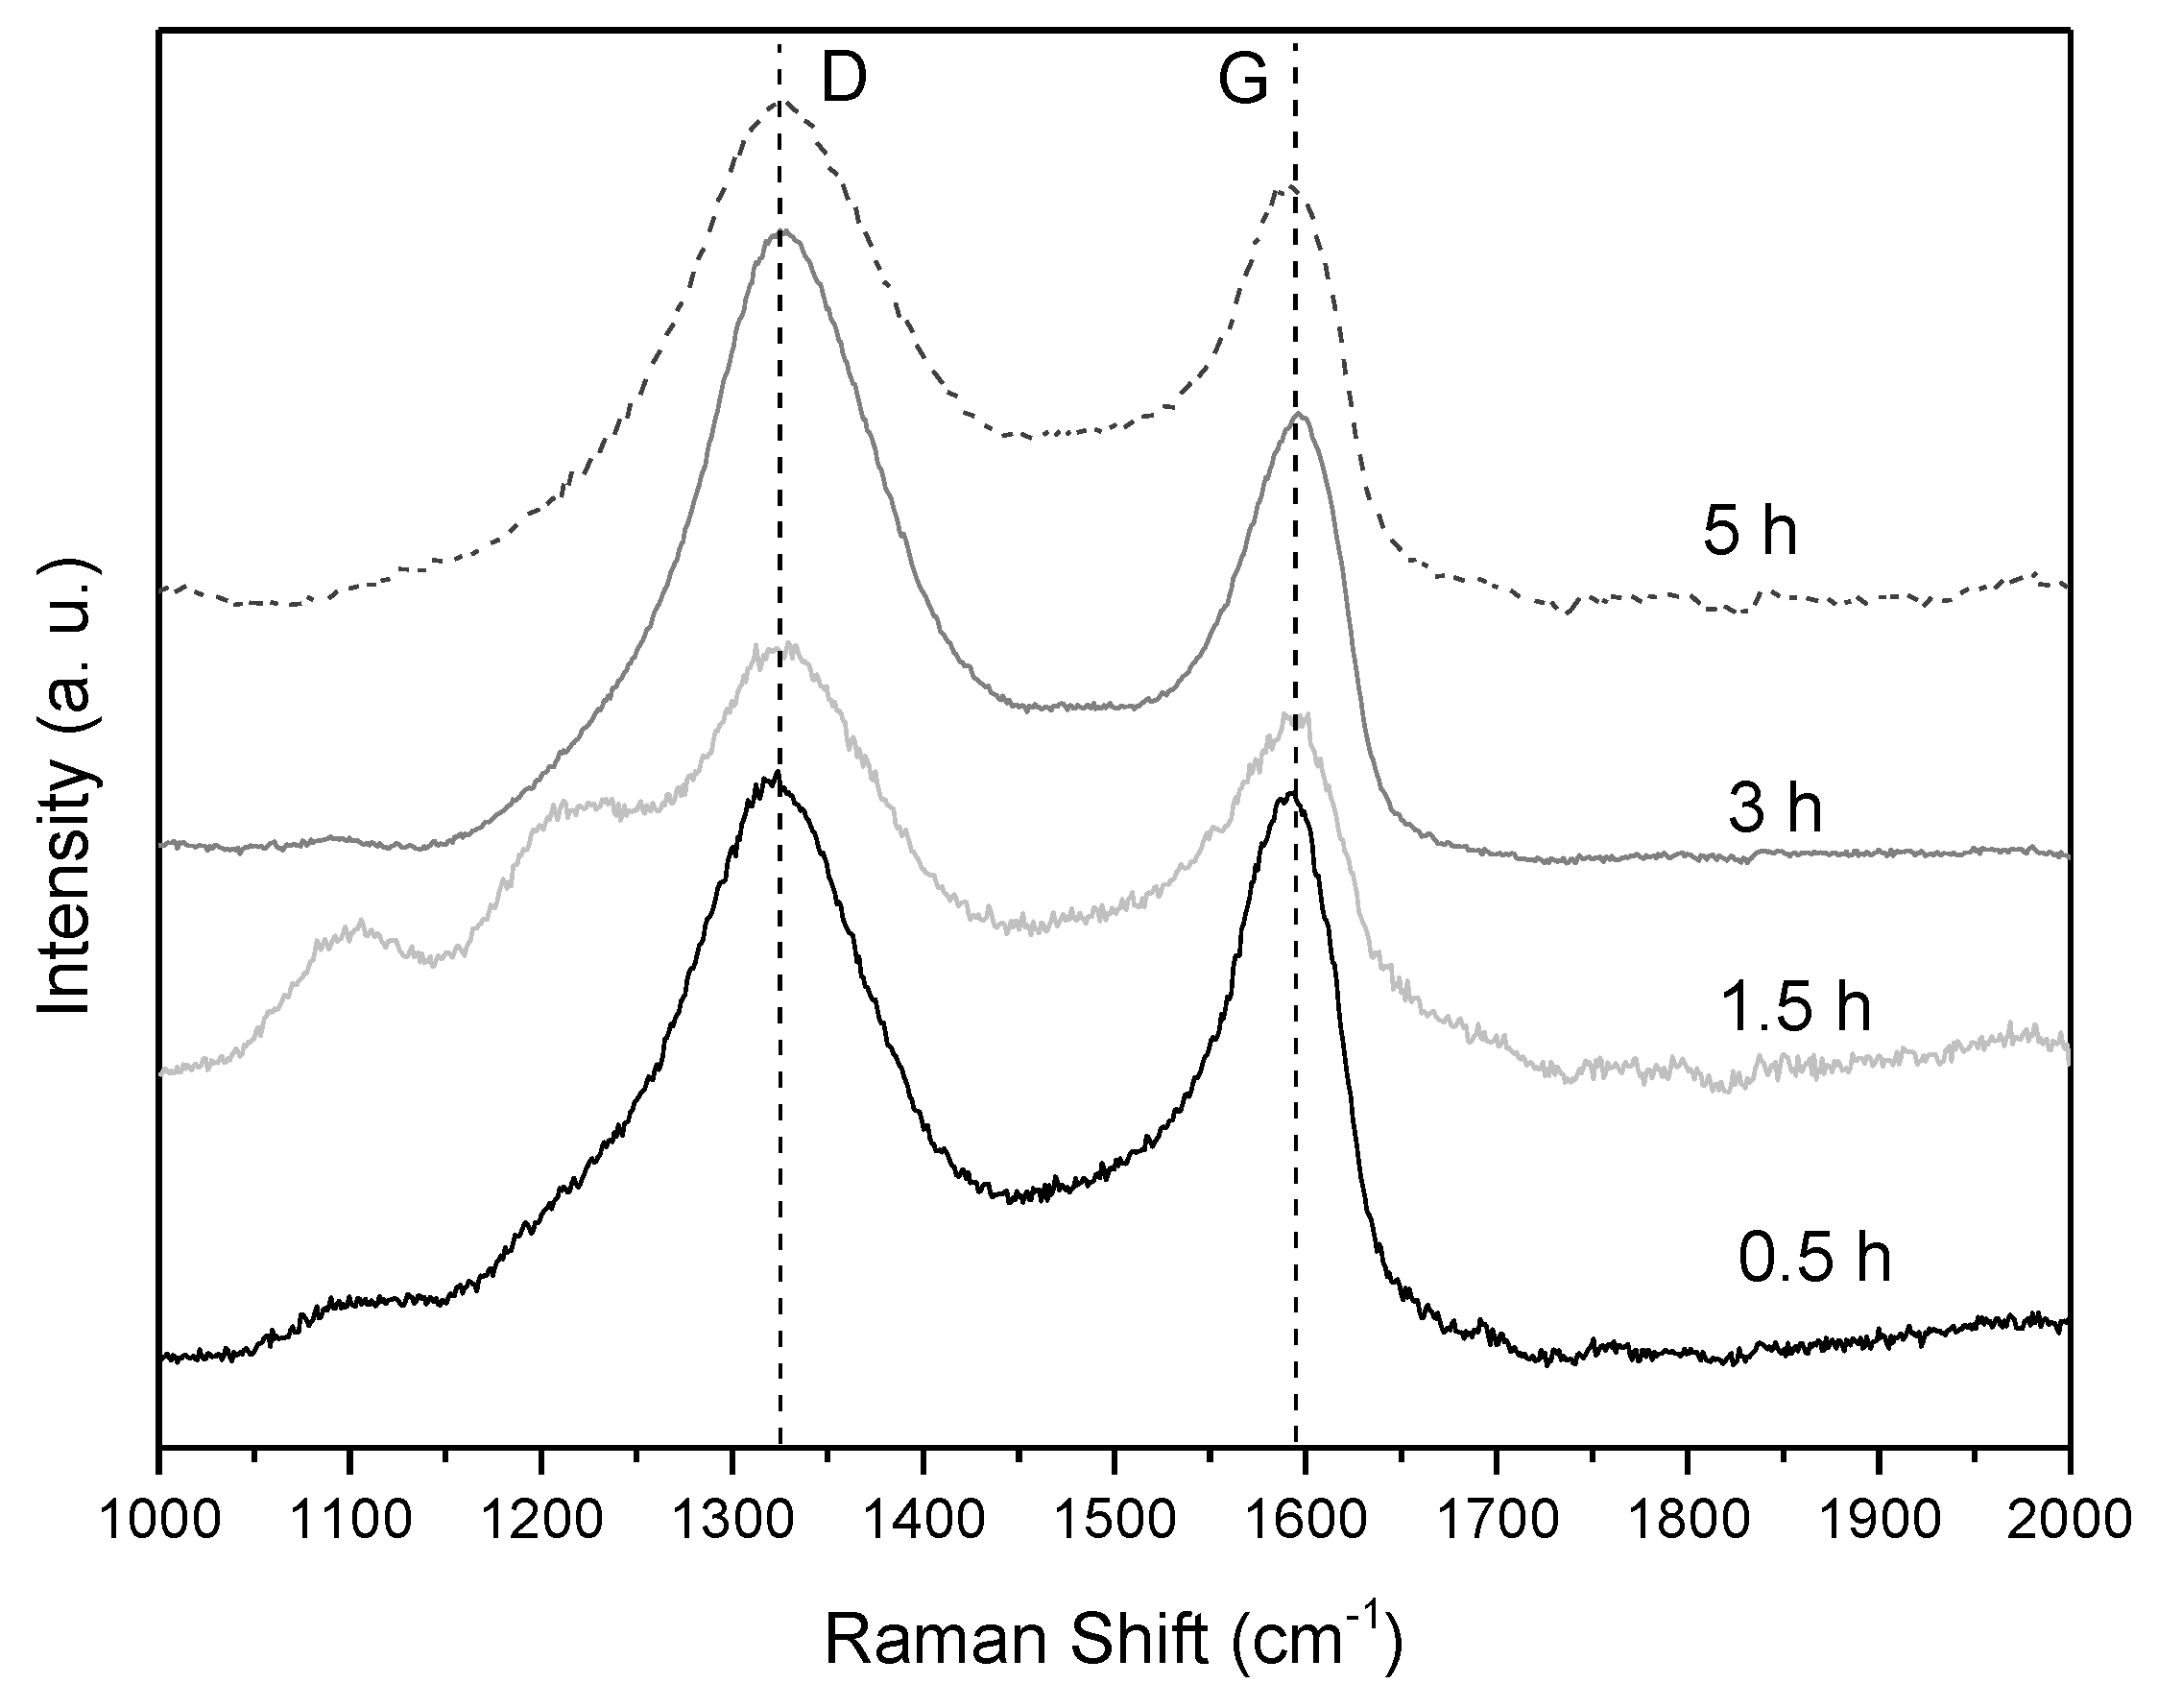
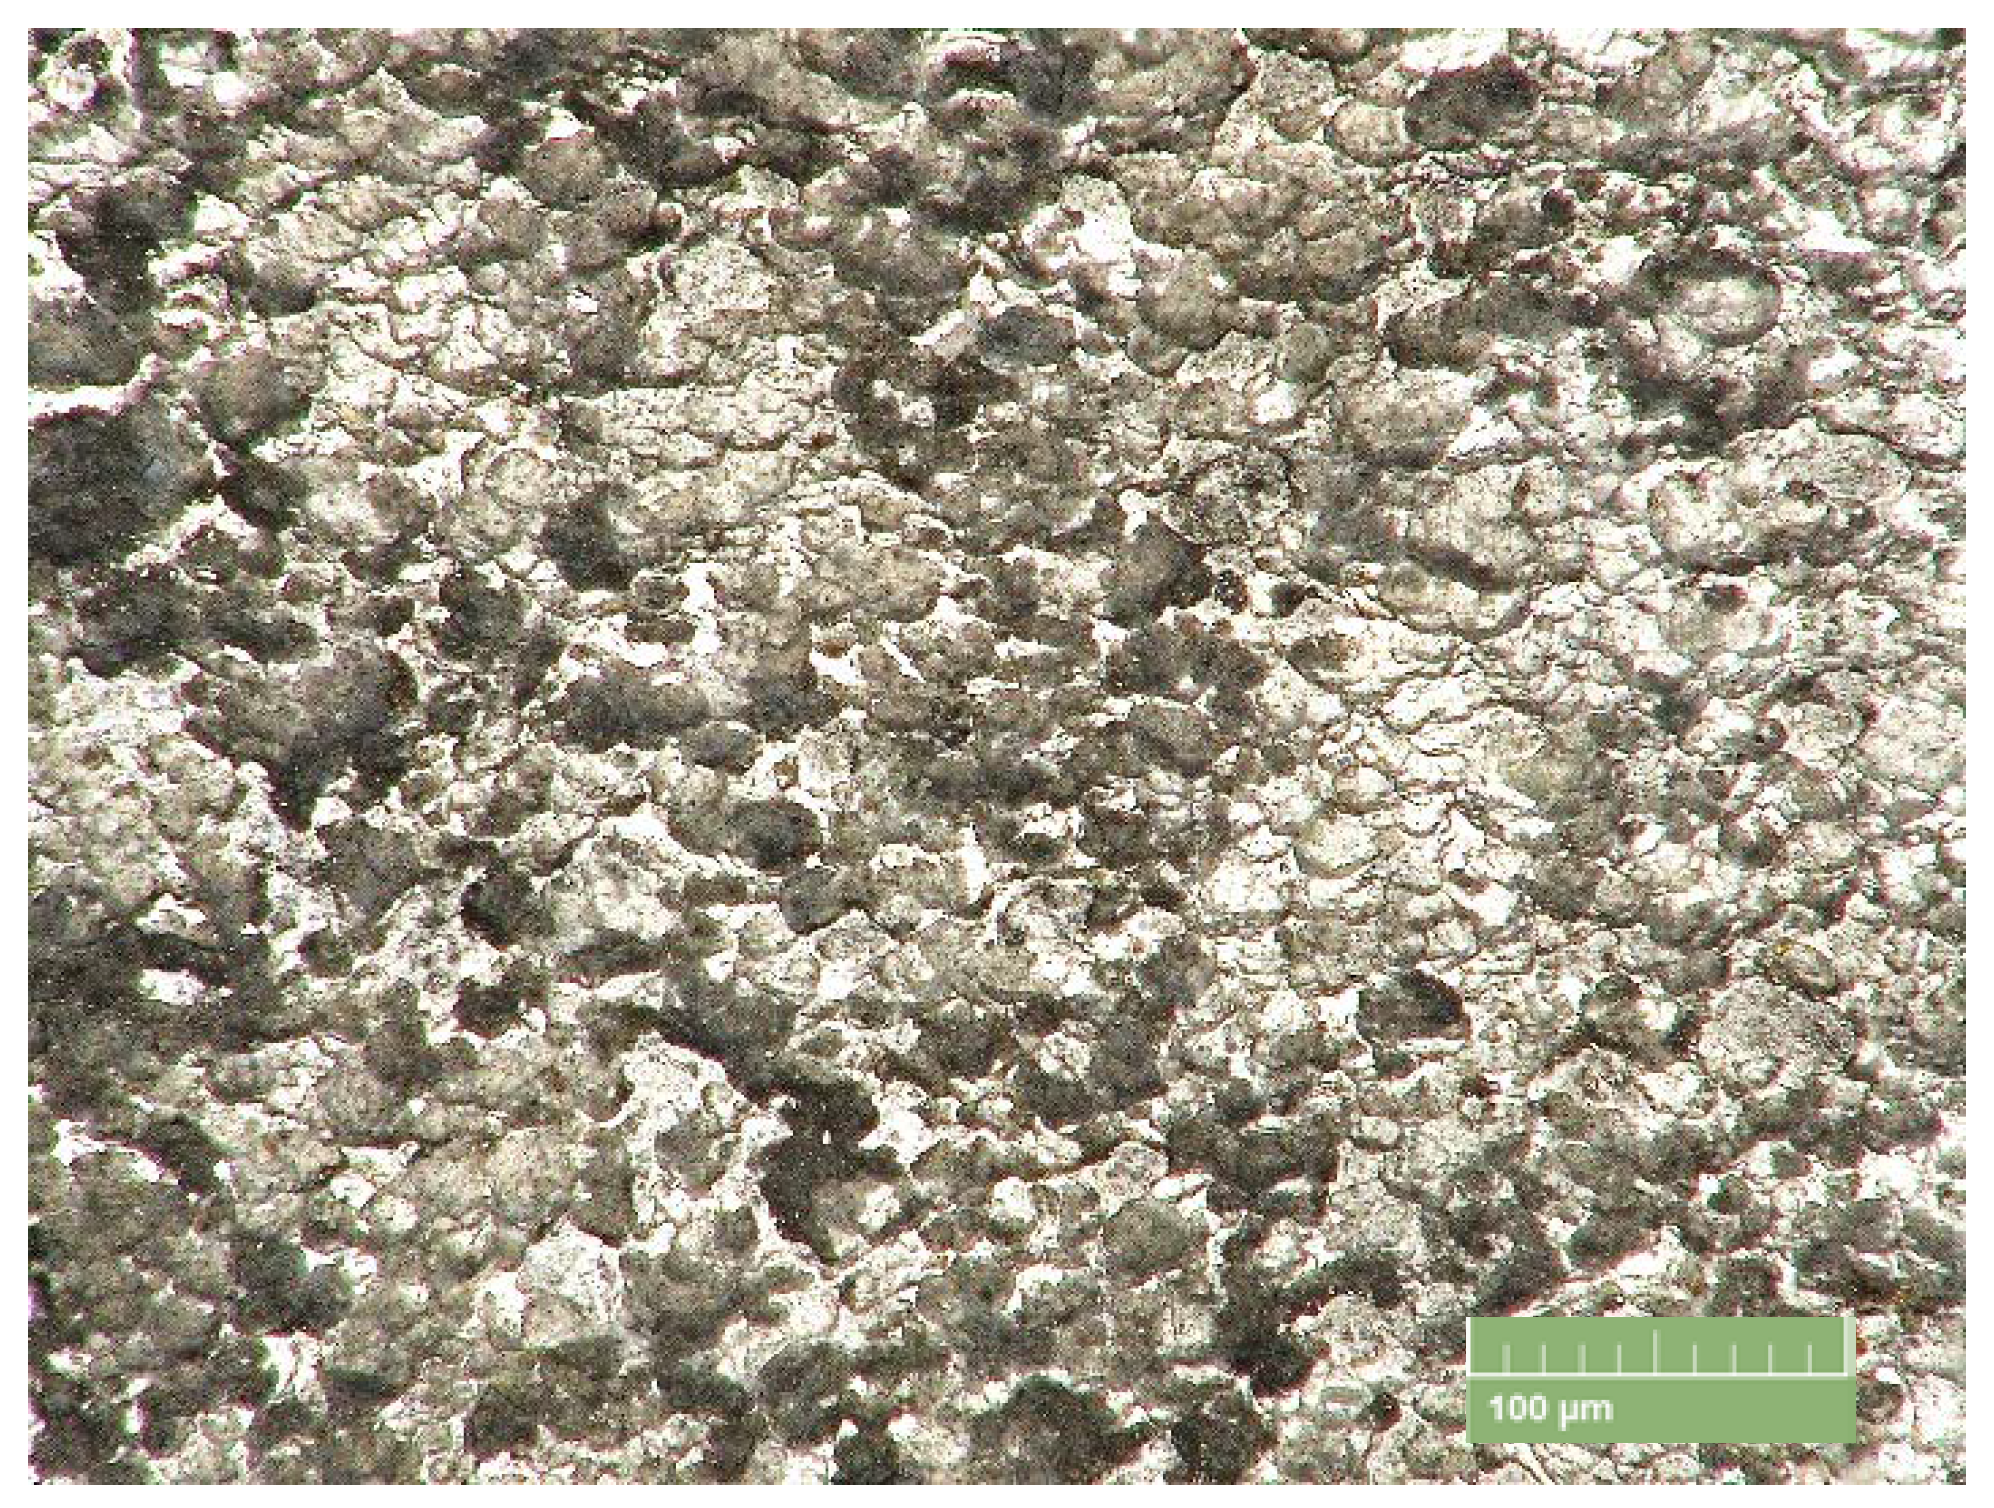
3.1. Structural and Microstructural Characterization Results

As is well known, Raman spectroscopy is one of the most widely used techniques to identify C-based structures due to its nondestructive technical nature. Diamond shows a narrow peak at 1332 cm−1 [33], while for DLC, in the visible spectra, two peaks have been reported, namely the D and G peaks at 1360 and 1580 cm−1, respectively. However, it is necessary to deconvolute the spectra to pinpoint the position of the D and G peaks [34,35]. For disordered graphite, the G peak is located around 1580–1600 cm−1, and the D peak around 1350 cm−1. In carbon fibers, the G peak can be located at around 1585 cm−1 for C–C vibrations in graphite; finally, the G peak is located around 1330 cm−1, which has been related to polycrystalline graphite [36,37,38]. Furthermore, the shape of the peak in the spectra of carbon fibers is well differentiated from that of diamond and DLC. The position of the peaks varies when using different testing wave lengths [39,40] from 325 (UV) to 830nm. In this work, two peaks at 1334 and 1586 cm−1 were found, which corresponds to the D and G peaks, respectively. The ID/IG intensity of 1.4 indicates the existence of some amorphous carbons [41]; the shape of the peaks is related to the carbon fiber peaks (see Figure 2).
Using Atomic Force Microscopy (AFM), it was possible to observe grain crystallization growth as the deposition time increased from 0.5 to 5 h (see Figure 3). With the profilometer method, roughness was measured along a 1 cm line in three different zones for each of the samples. The results obtained indicate that the roughness increases with deposition time and the thickness varies from 1 µm up to almost 14 µm. The thickness was also measured with the profilometer varying from ~4 to 51 µm. Table 2 shows the different roughnesses and thicknesses for all samples.
The roughness and thickness increased with deposition time, as expected. Figure 4 displays the microstructural features of the coating grain formation.
Grain size was calculated by the optical method using ImageJ software (see Table 3); the results indicate that the grain size increased with the deposition time. A researcher group, led by Gupta et al. [26] demonstrated that the SEM technique can be used to characterize the grain nucleation and size as a function of the processing parameters, and discovered that the key processing parameters were electrolyte concentration, current, voltage, and deposition time. Several researchers [30,42,43] have demonstrated that electrodeposited films have a nodular grain nucleation and growth, until a smooth surface is achieved. Figure 4 shows different stages of this process where it can be seen that at 0.5 h, the grain morphology corresponds to nodular grain nucleation and growth, as reported by other authors [30,42,43]. As the time increases, the grown grain achieves a coarsening of the nodular grains and a smooth morphology, and bigger grains are obtained. The nodular grain nucleation and growth can be seen in Figure 5, where a 3D micrograph shows the surface morphology of the C-based coating obtained at 15 V constant potential with the lowest deposition time.

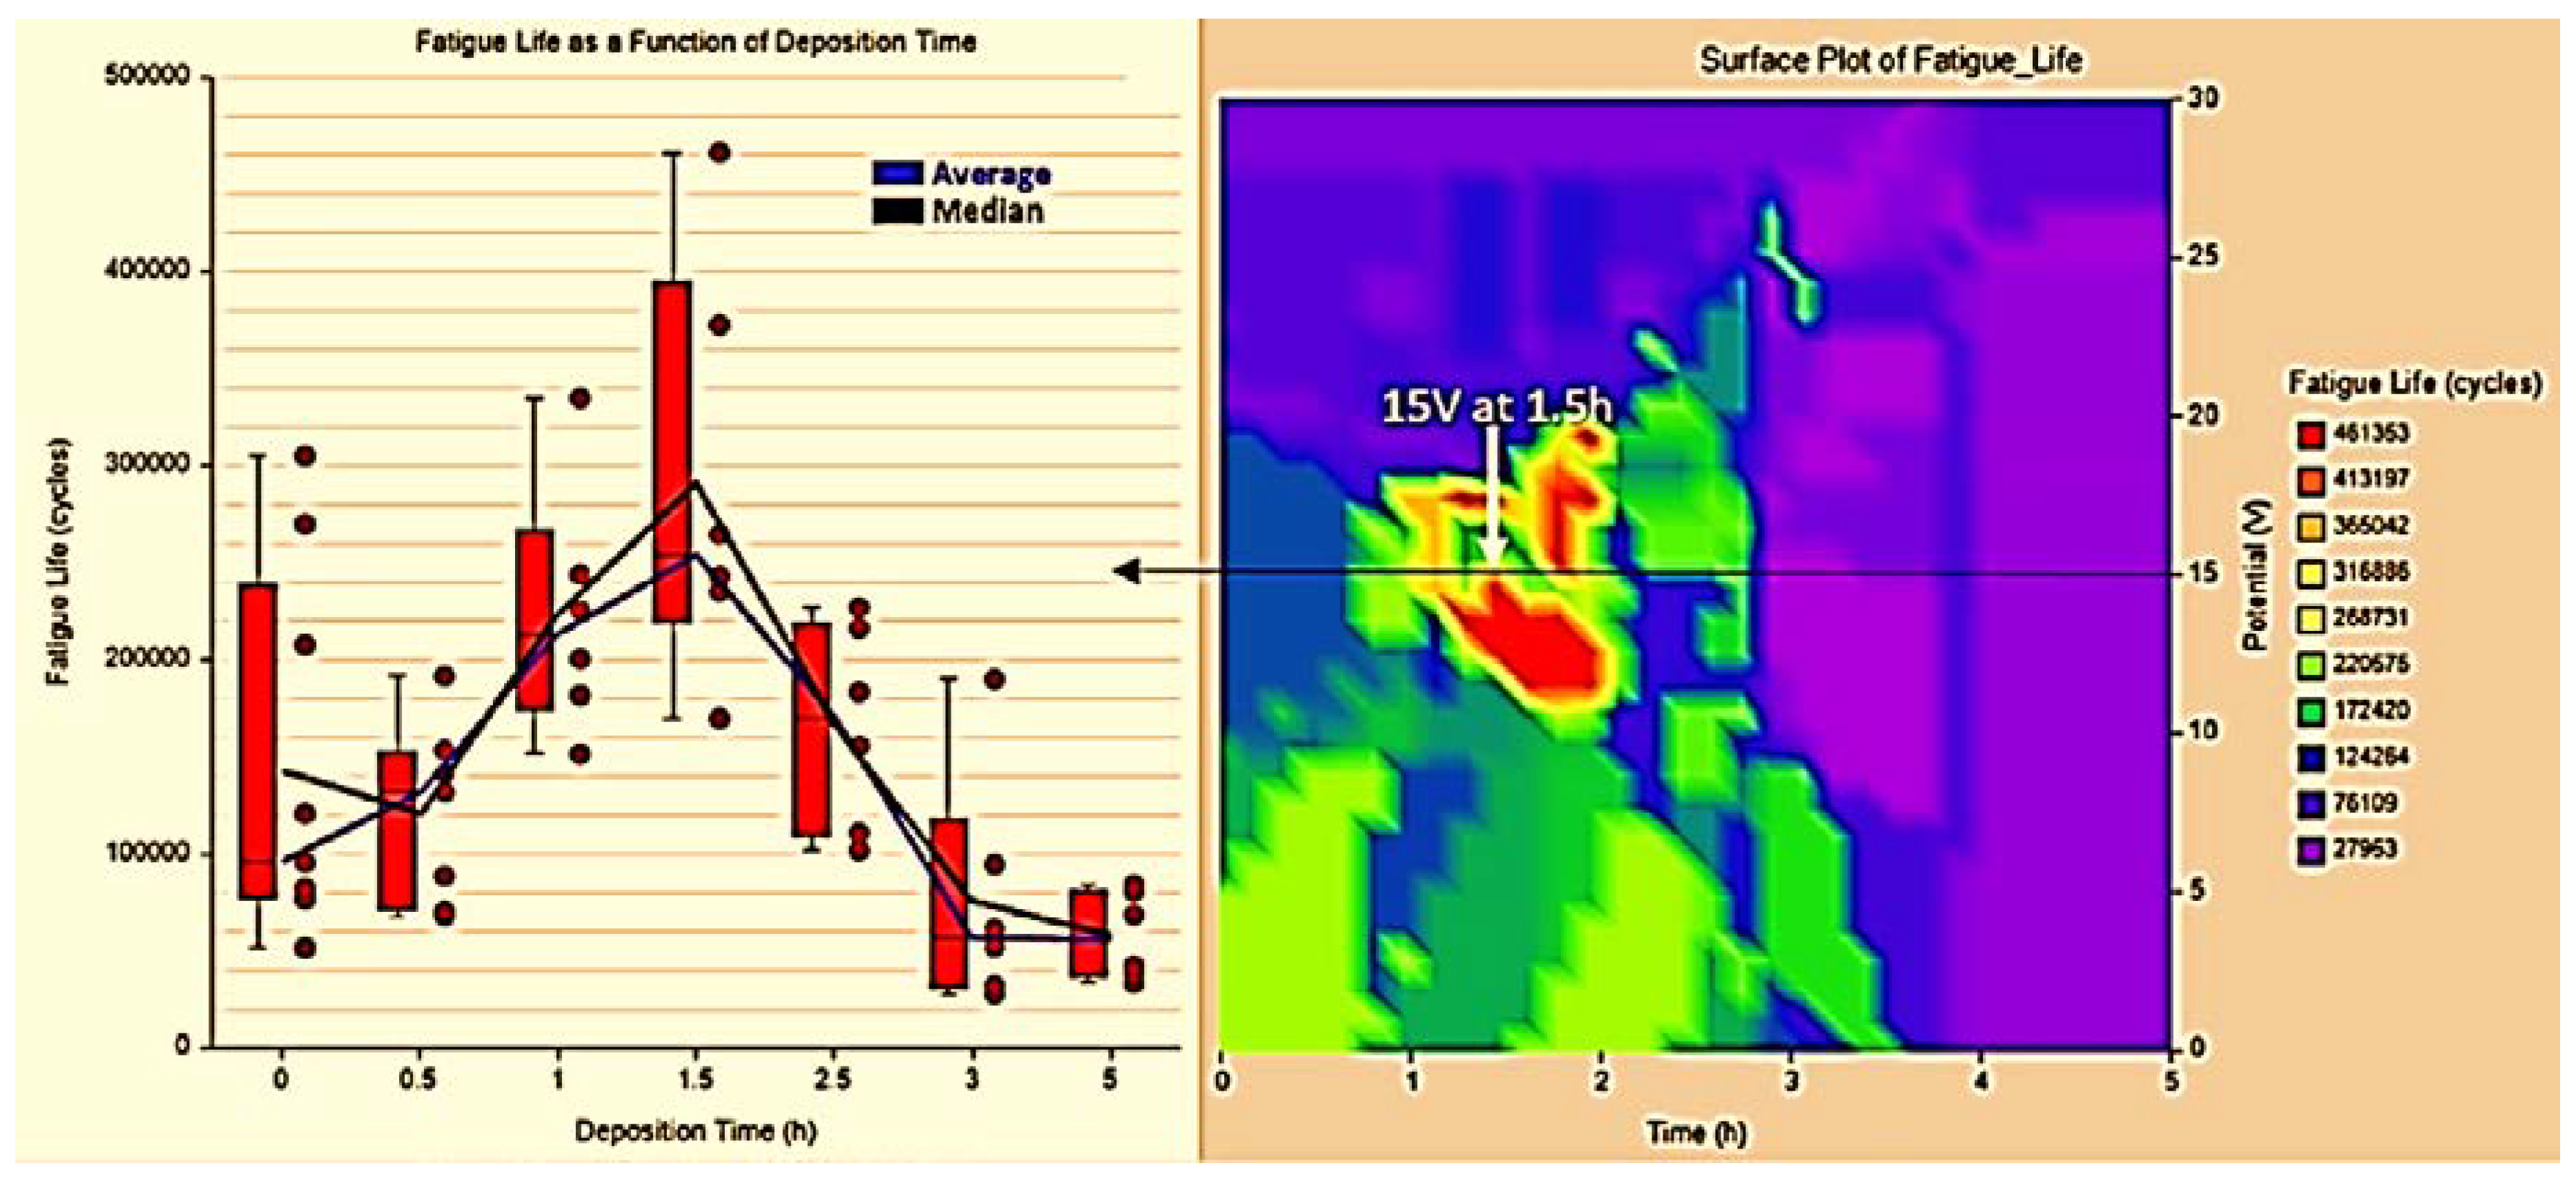
3.2. Fatigue Life Results

The experimental fatigue life results were obtained following the Moore experimental setup [32]. The voltage and deposition time of the C-based film clearly affect the fatigue life of the aluminum alloy (see Figure 6). In a range between 10 and 20 V, and 1 to 2 h deposition time, fatigue life is maximized. These results are in good agreement with those of several researchers [19,20] who have previously reported on C-based films obtained by the electrochemical route. They found that better quality coatings are obtained at approximately 15 V. At 15 V and 1.5 h deposition time, fatigue life increases by more than 100% as compared with the uncoated alloy. The 3D surface plot shows the fatigue life estimation of the entire experimental design with parameters from 0.5 to 5 h and 5 to 30 V of deposition. Therefore, better enhancement is achieved in a range between 10 and 20 V and 1 to 2.5 h, which is in agreement with the results of other researchers [19,20], as noted above.

3.3. SEM Fracture Surface Characterization

After the samples were fatigue tested, the characterization of the fracture surface was performed. The examined experimental set was subjected to the 15 V constant potential and 0.5 up to 5 h deposition parameters. The fatigued samples can be seen in Figure 7, where a different surface tonality can be observed, which indicates that the variations in the roughness and thickness of the coating are a function of the deposition time as ascertained by AFM and profilometer examination.
The fracture surface of the fatigued samples was investigated according to the fractured surface diagram depicted in Figure 8, and the main fracture mechanisms were described and correlated to fatigue life estimation (see Figure 9a–l).
As mentioned above, the analysis of the fractured surfaces revealed (Figure 9a–l) that the samples were subjected to flexion and rotation, as can be correlated to the mechanism diagram [44] below, which is in good agreement with the experimental conditions selected in this research. According to the diagram, the rotation of the samples when subjected to flexion is responsible for the symmetry loss of the stress distribution at the crack tip and produces the surface morphology depicted in Figure 9a–l.
After the surface fracture analysis, it seems that the surface morphology of the six samples (see Figure 8) is similar and corresponds to the failure mechanism depicted in Figure 9. Therefore, why does fatigue life vary if both the failure mechanism and the alloy are the same for all samples? It is possible that the C-based coating is responsible for delaying the crack nucleation and propagation at a critical thickness on the AA6063 surface without affecting the general failure mechanism on the alloy. Then, a greater roughness for a deposition time of 1.5 h may increase the concentration stress, affecting the fatigue life. It appears that the critical roughness and thickness is at 1.5 h of the deposition time at 15 V potential.

3.4. Polarization Resistance Results

Another important performance evaluation is the corrosion resistance of the alloy, since structural alloys require good mechanical properties obtained without increasing the corrosion susceptibility. Table 4 presents the electrochemical parameters obtained from polarization tests along with the corrosion efficiency (Np). The corrosion potential shifts to a more noble potential as deposition time increases; however, this shift has a negligible effect on the corrosion susceptibility because of the increased coating thickness. In addition, the 5 h deposition time increases the efficiency of the C-based coating but decreases fatigue life to below the level of the uncoated alloy. The 1.5 h deposition time maximizes fatigue life along with a considerable loss of corrosion resistance, but this does not represent a setback, since a complete coating system consists of several different layers that make the coating functional for real applications. Perhaps a polymeric topcoat may be required as the main barrier against a corrosive environment.
According to Falcade et al. [43], the increase in corrosion efficiency is related to the homogeneity of the film, which forms an effective barrier between the substrate and the corrosive environment. Thus, the results obtained for the 5 h deposition time drastically increases the corrosion efficiency, which is in good agreement with the results of Falcade et al. Furthermore, when inspecting the roughness on a nanometric scale (see Table 2), the 5 h deposition condition shows the lowest roughness value, which supports the affirmation by Falcade et al. [43]. Therefore, at deposition times below 5 h, the roughness increases, and the valleys formed on the surface of the film can act as sites that facilitate corrosive processes.
It is important to mention that the methodology employed to obtain the polarization resistance (Rp) and the corrosion current density (icorr) was the Stern and Geary approach [45].
Finally, as mentioned in the discussion of the results above, a lower concentration of CH3COOH was used in comparison with other reported works. After the structural and microstructural characterization was performed, it was evident that the obtained film was not the expected DLC. However, the fatigue life of the aluminum alloy was enhanced by 100%. The main contribution of this study is that the obtained film corresponded to crystalline graphite produced by electrochemical synthesis on an aluminum substrate, on flat and cylindrical surfaces, which has not been previously reported. Furthermore, an increase in the alloy fatigue resistance was accomplished as mentioned above.

4. Conclusions

The main objective of this research was to obtain a DLC coating by an electrochemical route. However, the structural and microstructural results discarded the formation of a DLC coating on the aluminum samples. On the other hand, this work confirmed the formation of polycrystalline graphite, which has not been previously reported for a film obtained by this synthesis route, and which enhances the fatigue life of metals and alloys. Several key conclusions have thus been drawn:
  • The C-based coating obtained by this electrochemical route has not been previously reported in the literature;
  • The obtained coating increases fatigue life by up to 100% compared with the uncoated alloy at a critical thickness of 3.9 µm and 20.5 µm for roughness;
  • The fracture surface characterization reveals that the failure mechanism is the same for all samples, which indicates that the coating is a retardant of nucleation and propagation of short cracks until a critical thickness and roughness is achieved; after crossing those critical conditions, the experimental evidence suggest that the stress concentration increases due to roughness;
  • Corrosion resistance is affected by the proposed C-based coating. Hence, a coating system composed of a C-based layer, primer, and topcoat must be designed and developed to overcome this drawback.

Author Contributions

Conceptualization, A.G.-M., Y.G.-L., A.A. and J.M.; Data curation, Y.G.-L., F.J.F.-R., J.C.D.-G., J.A.B.-C., M.H.-H. and J.M.; Formal analysis, A.G.-M. and J.M.; Funding acquisition, A.A., G.T.-M. and C.A.P.-S.; Investigation, A.G.-M., Y.G.-L., F.J.F.-R., J.C.D.-G., J.A.B.-C., M.H.-H. and J.M.; Methodology, A.G.-M., A.A. and F.J.F.-R.; Project administration, J.M.; Resources, J.L.A.-D.; Supervision, A.G.-M. and J.L.A.-D.; Writing—original draft, A.G.-M.; Writing—review & editing, G.T.-M., C.A.P.-S. and J.M. All authors have read and agreed to the published version of the manuscript.

Funding

The funding for this research was provided by CONACYT through the project grant INFR-293468 and FOINS 2016-01-2488.

Acknowledgments

We thank Cátedras CONACYT and CONACYT National System of Researchers for supporting the researchers with ID numbers 2309 and 5150. we suggest to move the funding information to the Funding section.

Conflicts of Interest

The authors declare no conflict of interest.

References

  1. Peralta, P.; Laird, C. Fatigue of Metals. In Physical Metallurgy, 5th ed.; Elsevier: Amsterdam, The Netherlands, 2014; Volume 1, pp. 1765–1880. ISBN 9780444537713. [Google Scholar]
  2. Park, C.K.; Kim, D.G. Historical background. In Current and Future Management of Brain Metastasis; Springer: Dordrecht, The Netherlands, 2012; Volume 25, pp. 1–12. ISBN 9783805596183. [Google Scholar]
  3. Cui, W. A state-of-the-art review on fatigue life prediction methods for metal structures. J. Mar. Sci. Technol. 2002, 7, 43–56. [Google Scholar] [CrossRef]
  4. Schlesinger, M.; Paunovic, M. Modern Electroplating, 5th ed.; John Wiley & Sons: Hoboken, NJ, USA, 2011; ISBN 9780470167786. [Google Scholar]
  5. Zhang, S.; Zhao, D. Aerospace Materials Handbook; Taylor & Francis: Boca Raton, FL, USA, 2013; ISBN 1439873305. [Google Scholar]
  6. Hirsch, J. Aluminium Alloys for Automotive Application. Mater. Sci. Forum 1997, 242, 33–50. [Google Scholar] [CrossRef]
  7. Giummarra, C.; Thomas, B.; Rioja, R. New Aluminum alloys for aerospace applications. In Proceedings of the Light Metals Technology Conference 2007, Saveur, QC, Canada, 24–26 September 2007. [Google Scholar]
  8. Wang, Y. A study of PVD coatings and die materials for extended die-casting die life. Surf. Coat. Technol. 1997, 94–95, 60–63. [Google Scholar] [CrossRef]
  9. Peter, I.; Rosso, M.; Gobber, F.S. Study of protective coatings for aluminum die casting molds. Appl. Surf. Sci. 2015, 358, 563–571. [Google Scholar] [CrossRef]
  10. Choy, K.L. Chemical vapour deposition of coatings. Prog. Mater. Sci. 2003, 48, 57–170. [Google Scholar] [CrossRef]
  11. Djokić, S. Electrodeposition and Surface Finishing; Springer: New York, NY, USA, 2014. [Google Scholar]
  12. Chen, K.-W.; Lin, J.-F. The study of adhesion and nanomechanical properties of DLC films deposited on tool steels. Thin Solid Films 2009, 517, 4916–4920. [Google Scholar] [CrossRef]
  13. Vanhulsel, A.; Velasco, F.; Jacobs, R.; Eersels, L.; Havermans, D.; Roberts, E.W.; Sherrington, I.; Anderson, M.J.; Gaillard, L. DLC solid lubricant coatings on ball bearings for space applications. Tribol. Int. 2007, 40, 1186–1194. [Google Scholar] [CrossRef]
  14. Lettington, A.H. Applications of diamond-like carbon thin films. Carbon N. Y. 1998, 36, 555–560. [Google Scholar] [CrossRef]
  15. Grill, A. Diamond-like carbon: State of the art. Diam. Relat. Mater. 2002, 8, 428–434. [Google Scholar] [CrossRef]
  16. Bewilogua, K.; Hofmann, D. History of diamond-like carbon films—From first experiments to worldwide applications. Surf. Coat. Technol. 2014, 242, 214–225. [Google Scholar] [CrossRef]
  17. Caschera, D.; Federici, F.; Kaciulis, S.; Pandolfi, L.; Cusmà, A.; Padeletti, G. Deposition of Ti-containing diamond-like carbon (DLC) films by PECVD technique. Mater. Sci. Eng. C 2007, 27, 1328–1330. [Google Scholar] [CrossRef]
  18. Li, R.S.; Zhou, M.; Pan, X.J.; Zhang, Z.X.; Lu, B.A.; Wang, T.; Xie, E.Q. Simultaneous deposition of diamondlike carbon films on both surfaces of aluminum substrate by electrochemical technique. J. Appl. Phys. 2009, 105, 1–4. [Google Scholar] [CrossRef]
  19. Roy, R.K.; Deb, B.; Bhattacharjee, B.; Pal, A.K. Synthesis of diamond-like carbon film by novel electrodeposition route. Thin Solid Films 2002, 422, 92–97. [Google Scholar] [CrossRef]
  20. Hassannejad, H.; Bogani, F.; Boniardi, M.; Casaroli, A.; Mele, C.; Bozzini, B. Electrodeposition of DLC films on carbon steel from acetic acid solutions. Trans. IMF 2014, 92, 183–188. [Google Scholar] [CrossRef]
  21. Manhabosco, T.M.; Muller, I.L. Electrodeposition of diamond-like carbon (DLC) films on Ti. Appl. Surf. Sci. 2009, 255, 4082–4086. [Google Scholar] [CrossRef]
  22. Ribeiro, H.; Cardoso, P.; Falcade, T.; Kunst, S.R. Corrosion and Wear Resistance of Carbon Films Obtained by Electrodeposition on Ferritic Stainless Steel. Mater. Res. 2015, 18, 292–297. [Google Scholar]
  23. Wang, H.; Shen, M.R.; Ning, Z.Y.; Ye, C.; Dang, H.Y.; Cao, C.B.; Zhu, H.S. Deposition of unhydrogenated diamond-like amorphous carbon films by electrolysis of organic solutions. Thin Solid Films 1997, 293, 87–90. [Google Scholar] [CrossRef]
  24. Jiu, J.T.; Li, L.P.; Cao, C.B.; Zhu, H.S. Deposition of diamond like carbon films by using liquid phase electrodeposition technique and its electron emission properties. J. Mater. Sci. 2001, 36, 5801–5804. [Google Scholar] [CrossRef]
  25. Sreejith, K.; Nuwad, J.; Pillai, C.G.S. Low voltage electrodeposition of diamond like carbon (DLC). Appl. Surf. Sci. 2005, 252, 296–302. [Google Scholar] [CrossRef]
  26. Gupta, S.; Pal Chowdhury, M.; Pal, A.K. Synthesis of DLC films by electrodeposition technique using formic acid as electrolyte. Diam. Relat. Mater. 2004, 13, 1680–1689. [Google Scholar] [CrossRef]
  27. Namba, Y. Attempt to grow diamond phase carbon films from an organic solution. J. Vac. Sci. Technol. A Vacuum Surf. Film. 1992, 10, 3368–3370. [Google Scholar] [CrossRef]
  28. Kulak, A.I.; Kokorin, A.I.; Meissner, D.; Ralchenko, V.G.; Vlasov, I.I.; Kondratyuk, A.V.; Kulak, T.I. Electrodeposition of nanostructured diamond-like films by oxidation of lithium acetylide. Electrochem. Commun. 2003, 5, 301–305. [Google Scholar] [CrossRef]
  29. Gupta, S.; Roy, R.K.; Deb, B.; Kundu, S.; Pal, A.K. Low voltage electrodeposition of diamond-like carbon films. Mater. Lett. 2003, 57, 3479–3485. [Google Scholar] [CrossRef]
  30. He, W.; Yu, R.; Wang, H.; Yan, H. Electrodeposition mechanism of hydrogen-free diamond-like carbon films from organic electrolytes. Carbon N. Y. 2005, 43, 2000–2006. [Google Scholar] [CrossRef]
  31. Mayen, J.; Gallegos-Melgar, A.; Abúndez, A.; Alcudia, E.; Colín, J.; Barredo, E. Yield Strength Improvement of an Al-6063 Alloy by Applying a Novel Combination of Cold Working and Heat Treatments for Die Casting of Plastic Parts. Trans. Indian Inst. Met. 2019, 72, 1211–1220. [Google Scholar] [CrossRef]
  32. Weibull, W. Fatigue Testing and Analysis of Results; Published for Advisory Group for Aeronautical Research and development, North Atlantic Treaty Organization; Pergamon Press: Oxford, UK, 1961; ISBN 9781483154169. [Google Scholar]
  33. Ferrari, A.C.; Robertson, J.; Trans, P.; Lond, R.S. Raman spectroscopy of amorphous, nanostructured, diamond—Like carbon, and nanodiamond Raman spectroscopy of amorphous. Philos. Trans. R. Soc. Lond. Ser. A Math. Phys. Eng. Sci. 2004, 2, 2477–2512. [Google Scholar] [CrossRef]
  34. Ferrari, A.C.; Robertson, J. Interpretation of Raman spectra of disordered and amorphous carbon. Phys. Rev. B 2000, 61, 14095–14107. [Google Scholar] [CrossRef] [Green Version]
  35. Ferrari, A.C. Determination of bonding in diamond-like carbon by Raman spectroscopy. Diam. Relat. Mater. 2002, 11, 1053–1061. [Google Scholar] [CrossRef]
  36. Tuinstra, F.; Koenig, J.L. Characterization of graphite fiber surfaces with Raman spectroscopy. J. Compos. Mater. 1970, 4, 492–497. [Google Scholar] [CrossRef]
  37. Washer, G.; Blum, F. Raman spectroscopy for the nondestructive testing of carbon fiber. Adv. Mater. Sci. Eng. 2008, 2008, 2–5. [Google Scholar] [CrossRef]
  38. Pozegic, T.R.; Hamerton, I.; Anguita, J.V.; Tang, W.; Ballocchi, P.; Jenkins, P.; Silva, S.R.P. Low temperature growth of carbon nanotubes on carbon fibre to create a highly networked fuzzy fibre reinforced composite with superior electrical conductivity. Carbon N. Y. 2014, 74, 319–328. [Google Scholar] [CrossRef]
  39. Street, T. Raman spectroscopy of graphite. Philos. Trans. R. Soc. London Ser. A Math. Phys. Eng. Sci. 2004, 2271–2288. [Google Scholar]
  40. Okuda, H.; Young, R.J.; Wolverson, D.; Tanaka, F. Investigating nanostructures in carbon fi bres using Raman spectroscopy. Carbon N. Y. 2018, 130, 178–184. [Google Scholar] [CrossRef]
  41. Rahim, I.; Dresselhaus, M.S. Thermal conductivity and Raman spectra of carbon fibers. Phys. Rev. B 1985, 32, 6742–6747. [Google Scholar]
  42. Wang, H.; Shen, M.R.; Ning, Z.Y.; Ye, C.; Cao, C.B.; Dang, H.Y.; Zhu, H.S. Deposition of diamond-like carbon films by electrolysis of methanol solution. Appl. Phys. Lett. 1996, 69, 1074–1076. [Google Scholar] [CrossRef]
  43. Falcade, T.; Shmitzhaus, T.E.; Dos Reis, O.G.; Vargas, A.L.M.; Hübler, R.; Müller, I.L.; De Fraga Malfatti, C. Electrodeposition of diamond-like carbon films on titanium alloy using organic liquids: Corrosion and wear resistance. Appl. Surf. Sci. 2012, 263, 18–24. [Google Scholar] [CrossRef] [Green Version]
  44. Fatigue Fracture—An overview | ScienceDirect Topics. In Comprehensive Materials Processing; Elsevier: Amsterdam, The Netherlands, 2014.
  45. Stern, M.; Geary, A.L. Electrochemical Polarization. J. Electrochem. Soc. 1957, 104, 559. [Google Scholar] [CrossRef]
Figure 1. Experimental setup to obtain the C-based films. (a) cell designed to deposit the films on the fatigue samples; (b) cell designed to deposit the films on the flat samples.
Coatings 10 00145 g001
Figure 2. Raman spectra of the C-based films obtained.
Coatings 10 00145 g002
Figure 3. Atomic Force Microscopy (AFM) surface topography of the C-based films.
Coatings 10 00145 g003
Figure 4. SEM characterization of the C-based films microstructure at 1000×.
Coatings 10 00145 g004
Figure 5. 3D morphological surface characteristics of the C-based coating at 15 V for 1.5 h of deposition parameters.
Coatings 10 00145 g005
Figure 6. Fatigue life estimation for 15 V deposition voltage and 3D surface plot for all tested voltages and deposition times.
Coatings 10 00145 g006
Figure 7. Fatigued samples (15 V constant potential).
Coatings 10 00145 g007
Figure 8. Failure mechanism of metals exposed to flexion and rotation. The (a) arrows indicate crack nucleation due to stress concentration and (b) propagation direction due to asymmetric stress distribution, finally, (c) indicates the catastrophic failure due to stress concentration at the crack tip being close to the fracture toughness of the material [44].
Coatings 10 00145 g008
Figure 9. Fracture surface of fatigued samples. (a) 0.5 h deposition time, 27×; (b) 0.5 h deposition time, 500×; (c) 1 h deposition time, 27×; (d) 1 h deposition time, 500×; (e) 1.5 h deposition time, 27×; (f) 1.5 h deposition time, 500×; (g) 2.5 h deposition time, 27×; (h) 2.5 h deposition time, 500×; (i) 3 h deposition time, 27×; (j) 3 h deposition time, 500×; (k) 5 h deposition time, 27×; (l) 5 h deposition time, 500×.
Coatings 10 00145 g009aCoatings 10 00145 g009b
Table 1. Relevant diamond-like carbon (DLC) electrodeposition research.
SubstrateElectrolyte (%)TemperatureAnodeDistanceTimeVoltage/Current DensityYear
Silicon (100)Pure methanol, ethanol, 2-propanol, acetone and tetrahydrofuran50 °C and 60 °C-10 mm-0 to 3000 V1997 [23]
Si (100)Methanol (99.5) Graphite4 mm 1000 V–0.2 mA/mm22001 [24]
SnO2-coated glassCH3COOH and deionized water (0.5 to 20)30 and 85 °C.Graphite sheet7 mm1 h1000 V2002 [19]
Nickel of 99% purity and stainless steelOxidation of 4 M solution of lithium acetylide in dimethyl-sulfoxide25 °C Current densities (0.2–2.0 mA/cm2) in the range of electrode potentials 0.3–2.5 V2003 [28]
SnO2-coated glassCH3COOH and deionized water 358 K.Graphite sheet 7 mm0.5 h0.8 mA/cm22003 [29]
SnO2-coated glassFrom 0.5 to 10% v/v using formic acid and water as electrolyteat 300 and 360 K.Graphite7 mm (0 –30 V; 1 A) f16 V/Am and 5.44 mA/m22004 [26]
Si (100)Methanol, ethanol, acetonitrile and DMF (Dimethylformamide)50 °CGraphite10 mm5h1600 V2005 [30]
Pure titanium (Grade 1)Acetonitrile and DMF25 °CGraphite4 mm4h1200 V2009 [21]
A284 steelCH3COOH (1 to 10%)25 °CHigh-purity graphite plates4 mm1 to 5h8 to 20V2014 [20]
AISI 430DMF 20 °C 7 mm24 h1200 V2015 [22]
Al6063-T6CH3COOH (1%)25 °CGraphite10 mm0.5 h to 5 h 2020
Table 2. Morphological parameters of the carbon films obtained.
SampleRoughness (Profilometer)Thickness (Profilometer)
0.5 h1.2 µm4.4 µm
1.5 h3.9 µm20.5 µm
3 h4 µm30 µm
5 h13.9 µm51 µm
Table 3. Grain size measurement.
SampleGrain Size (µm)
0.5 h76.4
1.5 h88.8
3 h91.6
5 h94
Table 4. Electrochemical parameters obtained from polarization testing.
SampleEcorr (V)icorr (µA/cm2)Rp (KΩ-cm2)Np (%)
0.5 h−1.28112.2042.30961
1.5 h−1.3601101.7340.0592
3 h−1.22489.9780.44912
5 h−0.8909.8645.931156
Al6063−1.29820.7083.799100

