Article

Relative Ti2AlC Scale Volatility under 1300 °C Combustion Conditions

by
James L. Smialek
NASA Glenn Research Center, Cleveland, OH 44135, USA
Retired, Oct 29, 2018.
Coatings 2020, 10(2), 142; https://doi.org/10.3390/coatings10020142
Submission received: 4 January 2020 / Revised: 21 January 2020 / Accepted: 3 February 2020 / Published: 5 February 2020
(This article belongs to the Special Issue Environmental Barrier Coatings)

Abstract

:
Turbine environments may degrade high temperature ceramics because of volatile hydroxide reaction products formed in water vapor. Accordingly, the volatility of transient TiO2 and steady-state Al2O3 scales formed on the oxidation-resistant Ti2AlC MAX phase ceramic was examined in 1300 °C high velocity (Mach 0.3, 100 m/s) and high pressure (6 atm, 25 m/s) burner rig tests (BRT). Unlike metals, the ceramic was stable at 1300 °C. Unlike SiC and Si3N4, neither burner test produced a weight loss, unless heavily pre-oxidized. Lower mass gains were produced in the BRT compared to furnace tests. The commonly observed initial, fast TiO2 transient scale was preferentially removed in hot burner gas (~10% water vapor). A lesser degree of gradual Al2O3 volatilization occurred, indicated by grain boundary porosity and crystallographic etching. Modified cubic-linear (growth-volatility) kinetics are suggested. Gas velocity and water vapor pressure play specific roles for each scale. Furthermore, a 7YSZ TBC on Ti2AlC survived for 500 h in the Mach 0.3 burner test at 1300 °C with no indication of volatility or spalling.

1. Brief Introduction

Ceramics are widely indicated for higher temperature turbine components. Water vapor attack has become a new element of study because of volatile hydroxides that form by reaction with Al2O3 substrates or with SiO2 scales that form on SiC and Si3N4. The severity of attack is controlled by the thermodynamics of the reaction, velocity, and water vapor pressure [1,2,3,4]. The water vapor component of combusted jet fuel is generally indicated at ~10%, with chemical activity increasing with overall system pressure. Typical volatile hydroxides of common oxides observed or projected are CrO2(OH)2, Si(OH)4, TiO(OH)2, and Al(OH)3, in order of decreasing severity [1,2,3,4]. While Cr volatiles can occur at low temperatures, 1200 °C or more is required for the others to become a noticeable problem. Thus, widely used Al2O3-forming superalloys, typically limited to 1150 °C, have not previously exhibited a scale volatility problem. Also, thermal barrier coatings (TBC) allow for higher gas temperatures, but protect the metal and thermally grown oxide (TGO) from both high temperature and high velocity. Al2O3 and SiC ceramic matrix composites (CMC) generally need an environmental barrier coating (EBC) for continuous use above about 1200 °C [5]. Furthermore, SiO2 scales are known to have significantly increased growth rates in water vapor, whereas Al2O3 scales show more complex effects on metals than on MAX phases [6,7,8,9].
Another class of materials that presents opportunities at intermediate temperatures is that of Al2O3-forming MAX phases, such as Cr2AlC, Ti2AlC, and Ti3AlC2. These compounds are very oxidation resistant, some at or above 1300 °C [10], although strength is lacking for unsupported, load-bearing use at this temperature. A broad program evolved at NASA Glenn to examine Type II low temperature hot corrosion resistance of Cr2AlC coatings on superalloys, basic Al2O3 scale kinetics, and extreme durability of yttria-stabilized zirconia (YSZ) TBC on Ti2AlC [11]. Burner rig testing was also performed that yielded experimental results for TiO2 and Al2O3 scale durability in water vapor. The purpose of this present paper is to catalogue and analyze high pressure (6 atm) and high velocity (100 m/s) burner results with regards to scale volatility issues. Part of the motivation relates to the behavior of Al2O3 scales in high velocity water vapor at 1300 °C, an environment not typically used for standard metal alloy tests. The materials and processes were described in detail from a number of studies comprising the source data for this compilation [12,13,14,15]. All the results subsequently presented derive from these studies. For further reference, those studies included broad literature surveys and more in-depth discussions.

2. Materials and Methods

Ti2AlC MAXthal 211® was obtained from Sandvik/Kanthal (Sandviken, Sweden) and EDM machined into ~0.2 cm thick ×1.2 cm wide ×2 cm long furnace samples, ×4 cm long HP-BRT samples, and ×7 cm long Mach 0.3 BRT samples. These were polished through 2400 grit and ultrasonically cleaned in detergent and alcohol. The box furnace tests (Rapid Temp) were conducted in lab air and samples intermittently weighed/inspected over graduated intervals for up to 500 h. Thermogravimetric (TGA) tests were conducted in dry, bottled air for 100 h, using a vertical tube furnace with weights continuously recorded by a thermo-balance (Setaram, Caluire, France). High pressure burner rig tests (6 atm, 25 m/s) were performed in a jet-fuel burner apparatus, completely sealed in a water-cooled stainless-steel chamber, with pressure controlled by an exhaust valve. Test bars were held at the ends in a water-cooled fixture, at 45° to the flame. Typical run series achieved 6 h exposure between shutdown and weightings, usually accruing 50 h total test time. Heating and cooldown were generally achieved within 10 min. High velocity Mach 0.3 BRT tests (1 atm., 100 m/s) employed an open jet-fueled burner, with a cantilever gripped, face-on test bar. The face had been coated with 160 μm of Metco 6700 7YSZ TBC by plasma spray-physical vapor deposition (PS-PVD, Sulzer-Oerlikon, 94 kW, 40/80 Ar/He, 1.5 mbar), the backside left uncoated. Cycling (5 h) was obtained by pivoting the burner away from the sample. Heating and cooling were generally complete in 1 min. BRT sample temperatures were monitored by two-color or 8 μm pyrometers, with gas temperature measured by thermocouple. Samples were examined at various intervals and weighed on a Sartorius analytical balance (±0.00005 g). Scales were examined by optical and FEG-SEM microscopy (Hitachi S-4700, Tokyo, Japan), both on the surface and as Ni-plated, metallographically polished cross-sections at the end of the 500 h BRT. Phase contents were estimated from (Brüker 8D) X-ray diffractometer scans and Rietveld refinement, using Jade software (version 6). Complete experimental details are available in the source studies [12,13,14,15].

3. Results

The weight change results from a suite of 1300 °C furnace and jet fuel burner tests are presented in Figure 1. Test times were dictated by the specific study they addressed: standard 100 h TGA, extended 300 h furnace pre-oxidation to produce a very slow growing Al2O3 scale, short 50 h HP-BRT to demonstrate kinetics in a labor-intensive, expensive, pressurized apparatus, and 500 h to demonstrate long term TBC durability in the convenient, available, Mach 0.3 high velocity cyclic rig.
The ambient air box furnace (pre-ox) and dry air TGA show similar gains. These are compared to lower curves for the two burner tests. All results indicate a rapid initial uptake in the order of 1 mg/cm2 within the first hour of exposure. This has often been associated with a rapid transient growth of discontinuous TiO2 scales that are then undercut by a healing layer of slow-growing, steady-state Al2O3. Nearly linear weight loss was observed in the HP-BRT for a pre-oxidized sample, that would otherwise have been masked by the high initial growth rate. Long-term testing was conveniently enabled by the box furnace, used for a pre-oxidation treatment here, and by the accessibility of the open Mach 0.3 burner test. Weight gain of ~2.4 mg/cm2 was achieved in the Mach 0.3 BRT as compared to about 1.6 mg/cm2 for the much shorter HP-BRT.
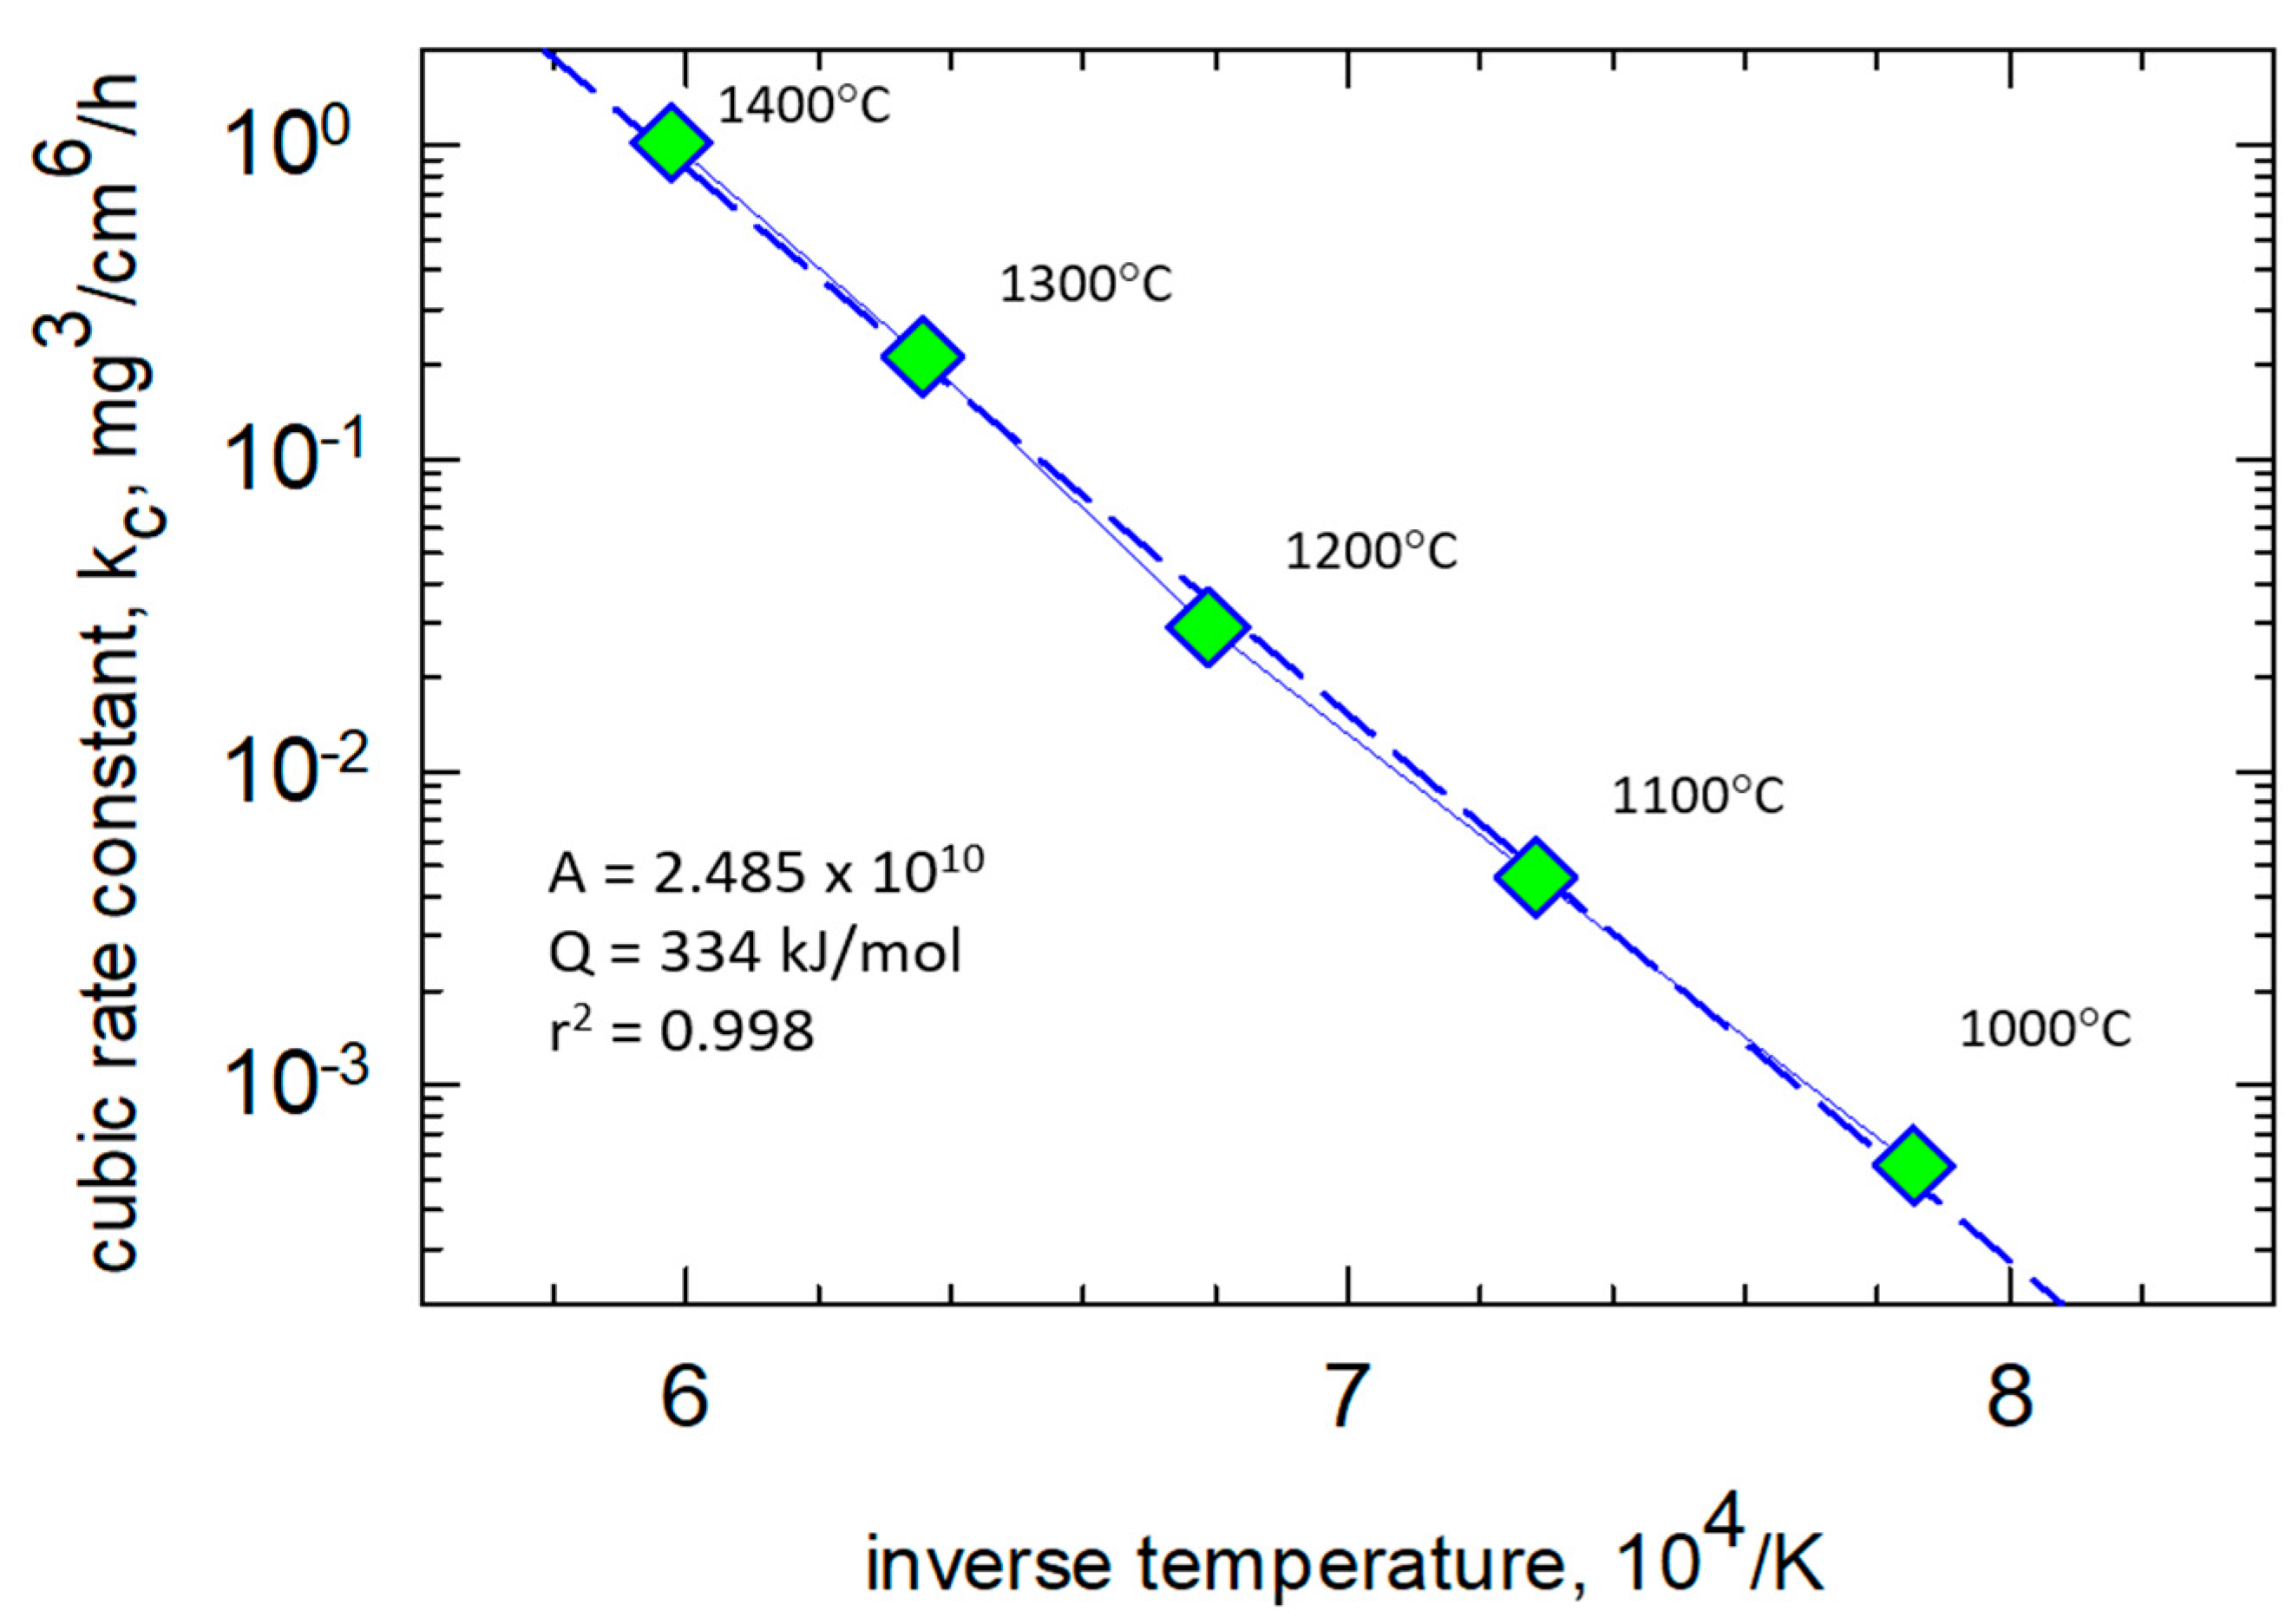
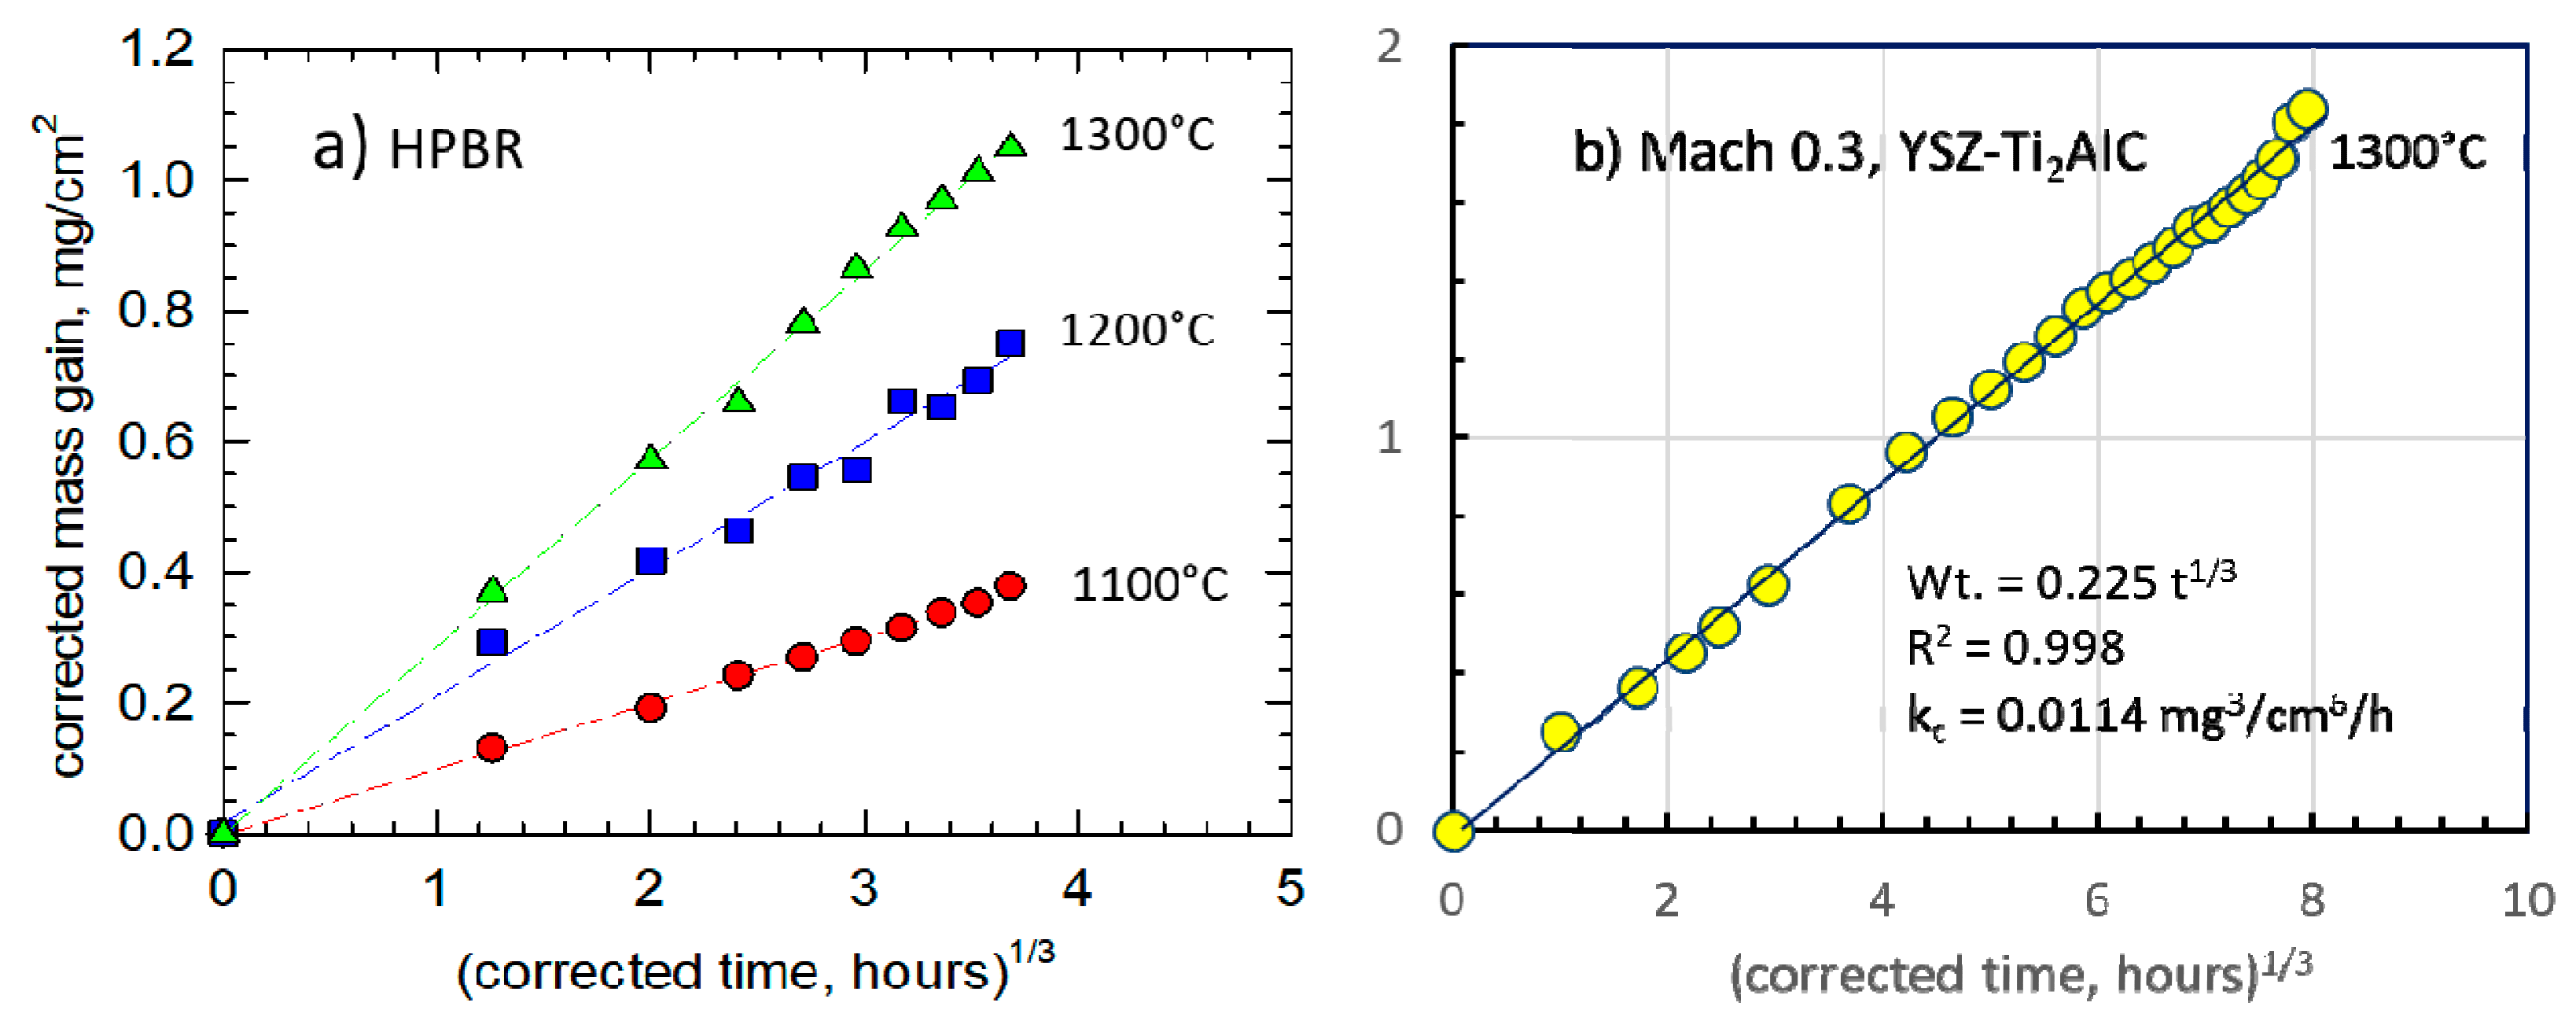
The cubic scaling kinetics were easily treated by correcting (subtracting) the amount of transient TiO2, as graphically interpolated on log-log plots [12,14]. In the case of TGA tests, it was shown that most of the transient growth, w0, took place in the first 10 min. Good linearized fits of (w − w0) to (t − t0)1/3 cubic kinetics could be obtained in these well-controlled TGA furnace tests. The cubic scaling constants, extracted from the (w − w0) offset-corrected mass gain curves show a very well-behaved, single-mechanism Arrhenius dependency, Figure 2. Over the temperature range of 1000 °C–1400 °C, an activation energy of 334 kJ/mol·K is seen to apply. Accordingly, the same graphical approach was applied to the 1300 °C test data for HP-BRT (Figure 3a) and Mach 0.3 BRT (Figure 3b). These yielded kc of 0.024 and 0.011 mg3/cm6·h, respectively, compared to 0.212 mg3/cm6·h determined by TGA [12,13]. These BRT reductions reflect losses due to scale volatility effects. The Mach 0.3 test also incorporates protective effects of the YSZ face-coat and lower temperatures (100 °C) away from the hot zone.
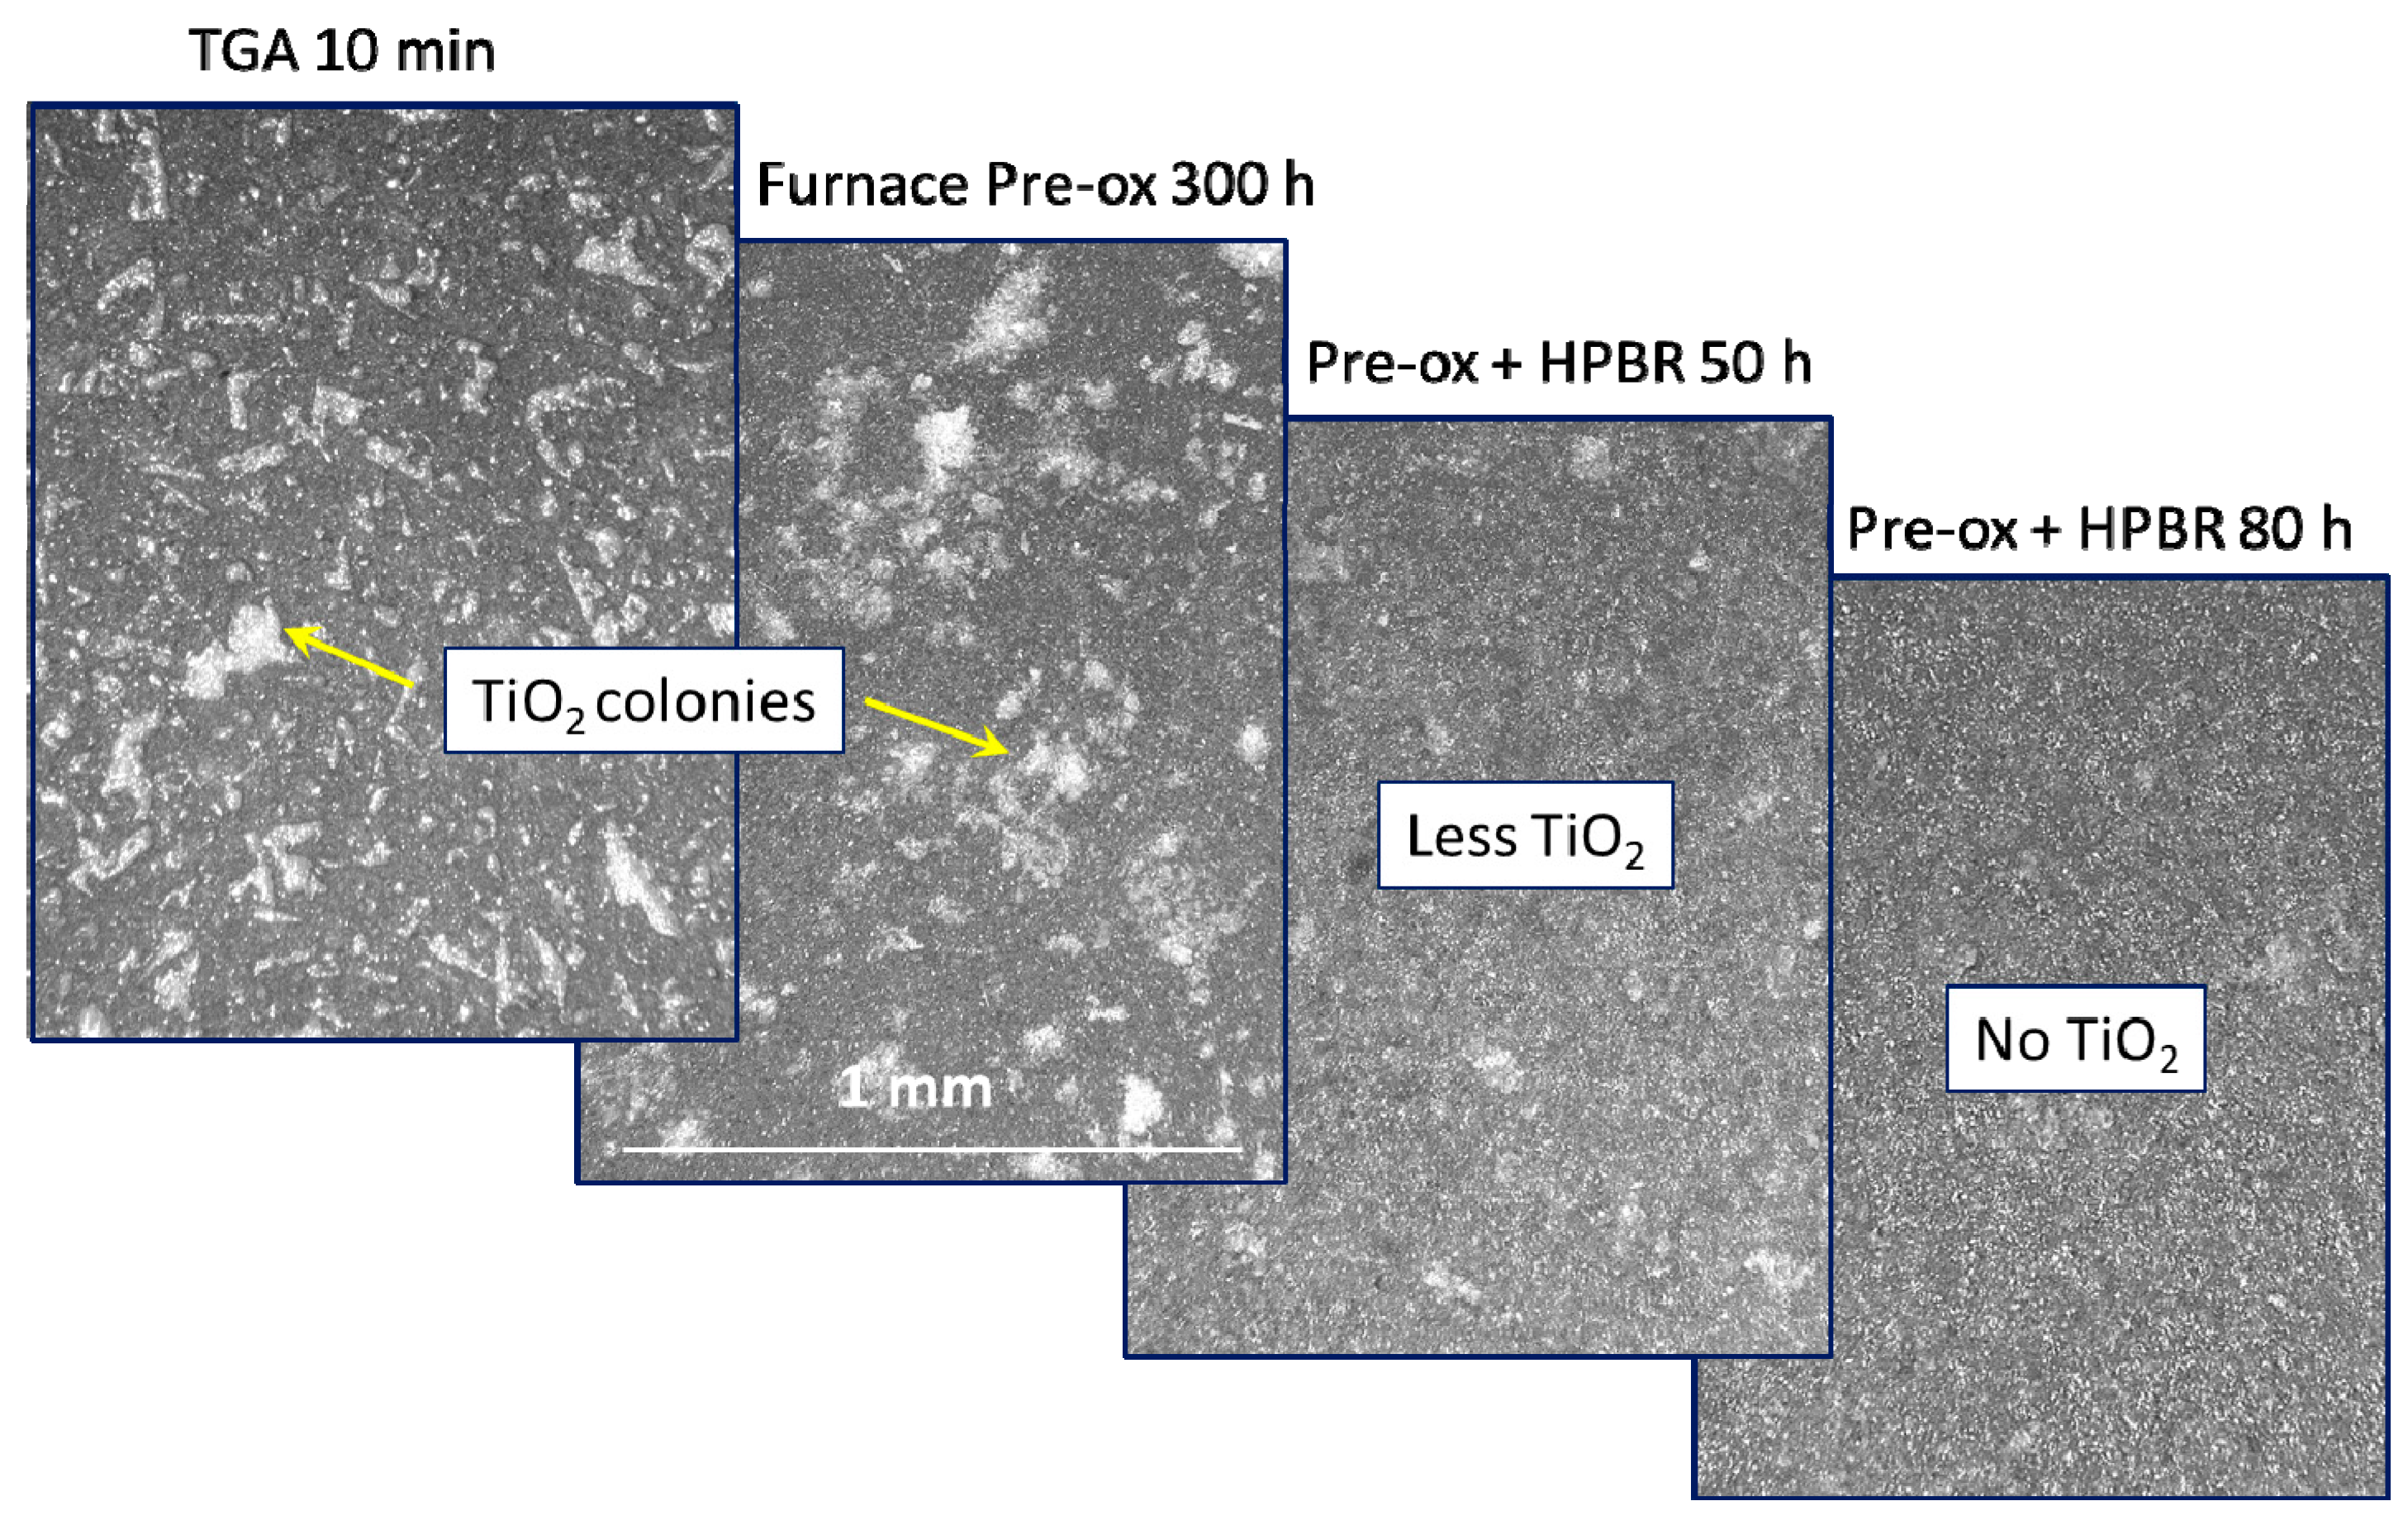
Visual confirmation of TiO2 volatility can be surmised from the low-magnification optical micrographs in Figure 4. Here, the scattered, sometimes oriented, initial clusters of light scale phases are seen to coarsen with furnace exposure time and decrease or disappear with HP-BRT exposure time. This effect was semi-quantitatively verified by Rietveld analyses of X-ray diffractometer scans. While TiO2 (rutile) was the primary transient identified at 1200 °C and below, the reaction phase of TiAl2O5 was also identified after 1300 °C exposures. Here, initial scale quantities of 20% TiO2 and 10% TiAl2O5 were determined after just 0.2 h of furnace exposure. These decreased dramatically to only 0.1% and 1%, respectively, after 80-h HP-BRT exposures (300 h furnace pre-oxidation), the remainder being α-Al2O3 [13].
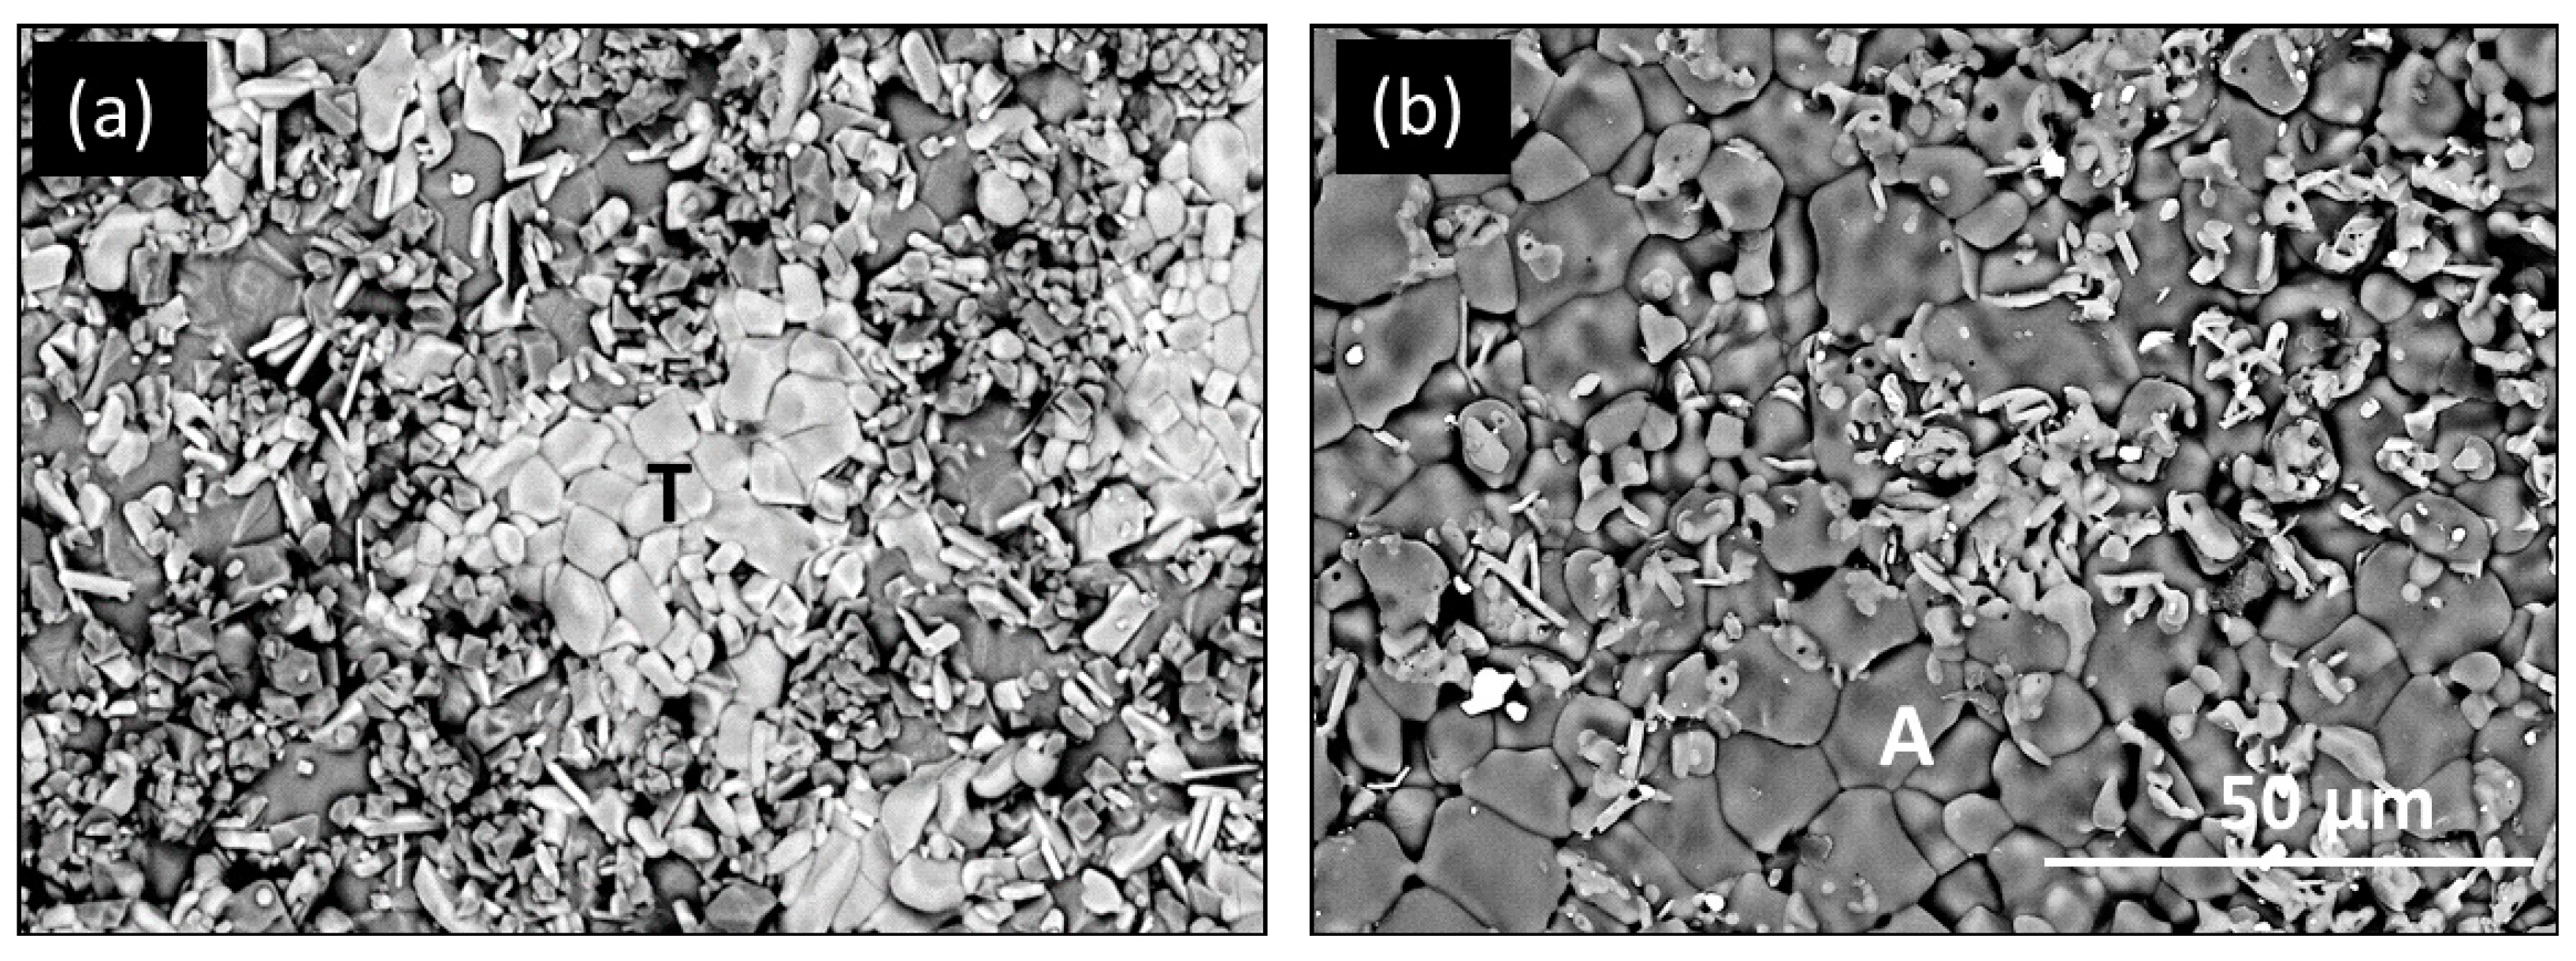
The effect of this HP-BRT exposure on the surface structure can be seen in Figure 5. After 300 h pre-oxidation at 1300 °C, transient TiO2 and TiAl2O5 bright clusters (T) were retained in (a), but then largely removed by HP-BRT testing for 80 h at 1300 °C in (b). Distinct underlying grains of Al2O3 (A) could then be discerned with a much lower Ti EDS signal overall. A linear weight loss rate of 0.012 mg/cm2·h was also measured, as shown by the lower curve in Figure 1. Since this included some modest scale growth, the total removal rate was surmised to be about 0.017 mg/cm2·h. (Pre-oxidation was required to produce a thick scale with a low instantaneous growth rate less than the volatility rate).
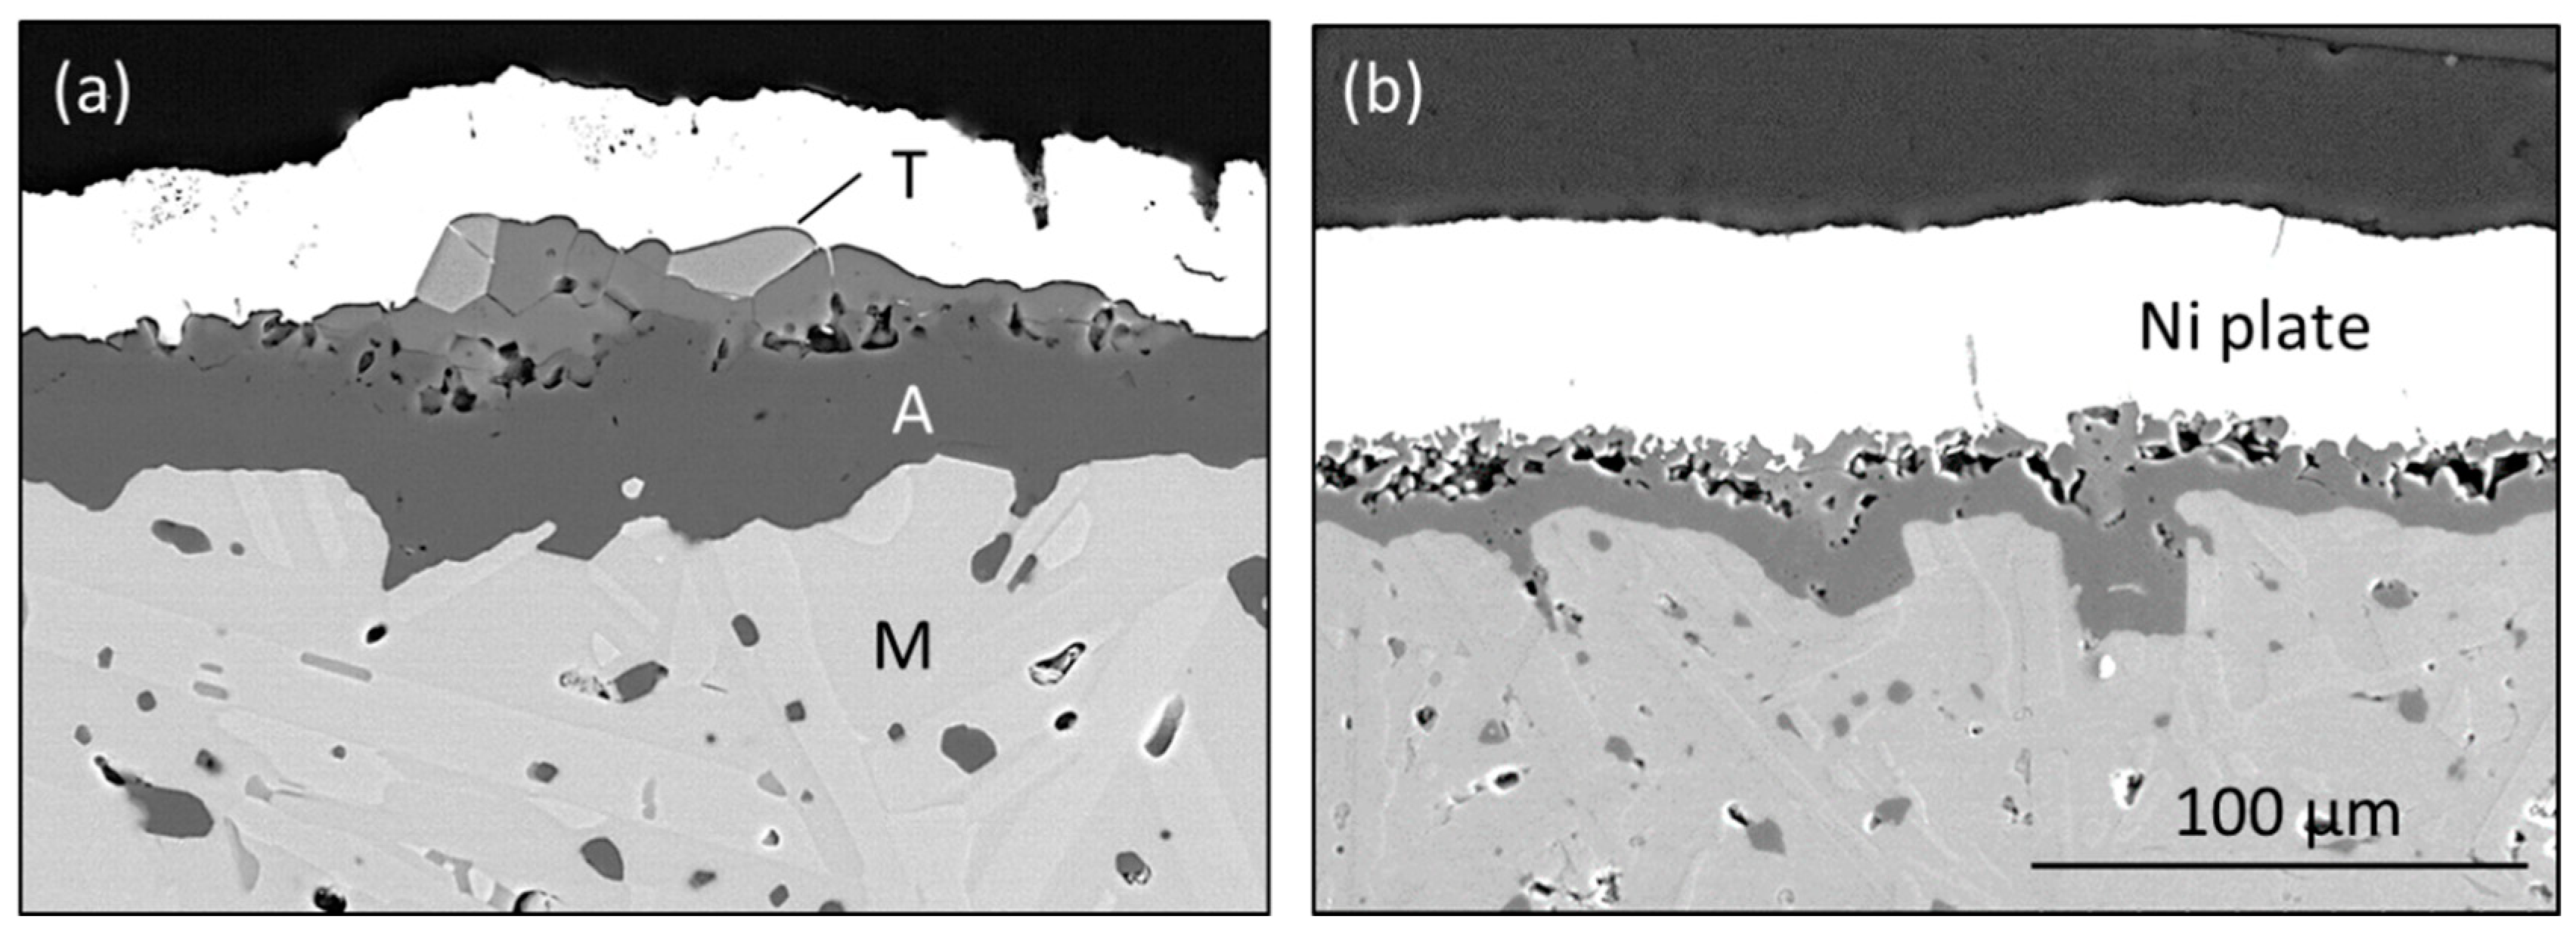
A direct comparison of scales formed in 1300°C TGA (100 h) and HP-BRT (50 h) in cross-section is presented in Figure 6. The TGA structure shows the Ti-rich remnants of scattered transient scale colonies, with a dense underlayer of Al2O3. The HP-BRT sample exhibits a rather discontinuous surface scale with less distinct Ti-rich regions, if at all. HP-BRT scale volatility is again suggested. The inner Al2O3–Ti2AlC interface is completely intact with no porosity or cracking.
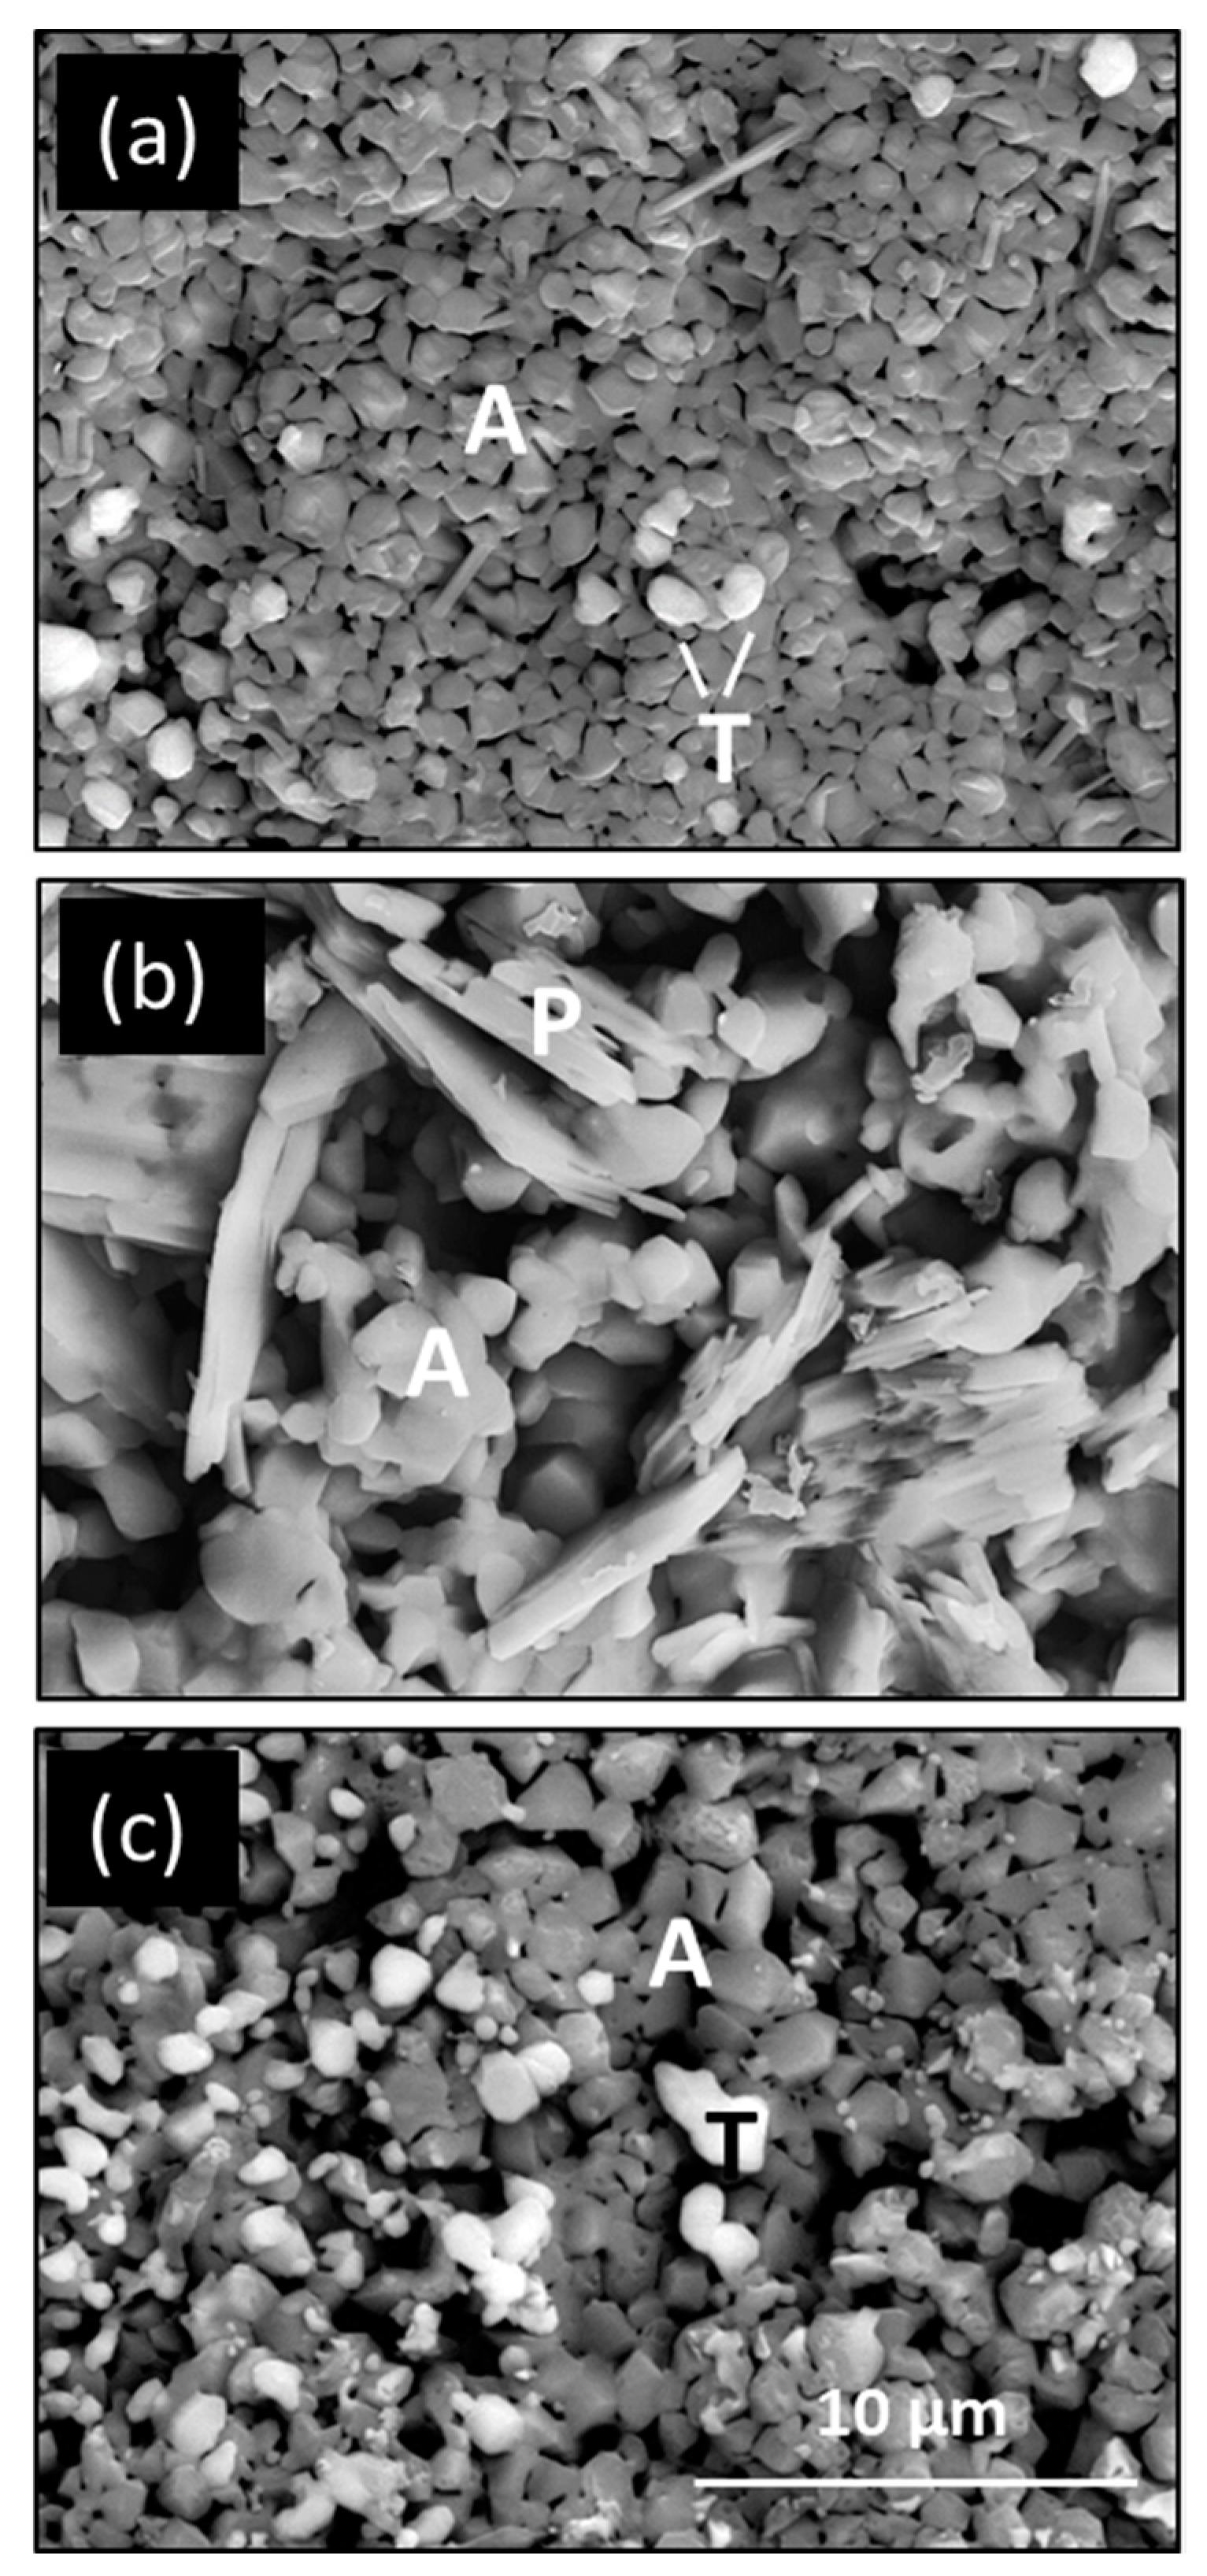
Mach 0.3 BRT (1 atm., 100 m/s, 500 h) exposures produced similar effects on surface scale microstructure (uncoated sample backside) (Figure 7). However, since the burner nozzle was about 2.5 cm in diameter centered on the 5 cm long exposed sample length, the sample temperature at the top (a) and bottom (grip end, c) was about 100°C cooler. This resulted in a less severe attack, with some remnants of bright Ti-rich particles atop Al2O3 grains, the latter exhibiting grain boundary porosity.
In contrast, the hot section (b) showed little vestige of Ti-rich scales, but a highly irregular, open Al2O3 scale. Some grains appeared to be etched crystallographically, forming lamellae, possibly along the hexagonal (0001) basal planes. The platelets retained a slight Ti level; they may have been derived from TiAl2O5 grains where Ti was removed by selective water vapor corrosion. Xrd analyses of the oxidized surface showed ~10% TiO2 after the initial 20 min at 1000 °C, then removed by volatile reactions to just 0.1% after the 1300 °C exposure, the remainder of the scale being α-Al2O3 [15]. No phase change in the Ti2AlC substrate was apparent other than reduced x-ray diffraction intensity due to absorption from the thickening scale.
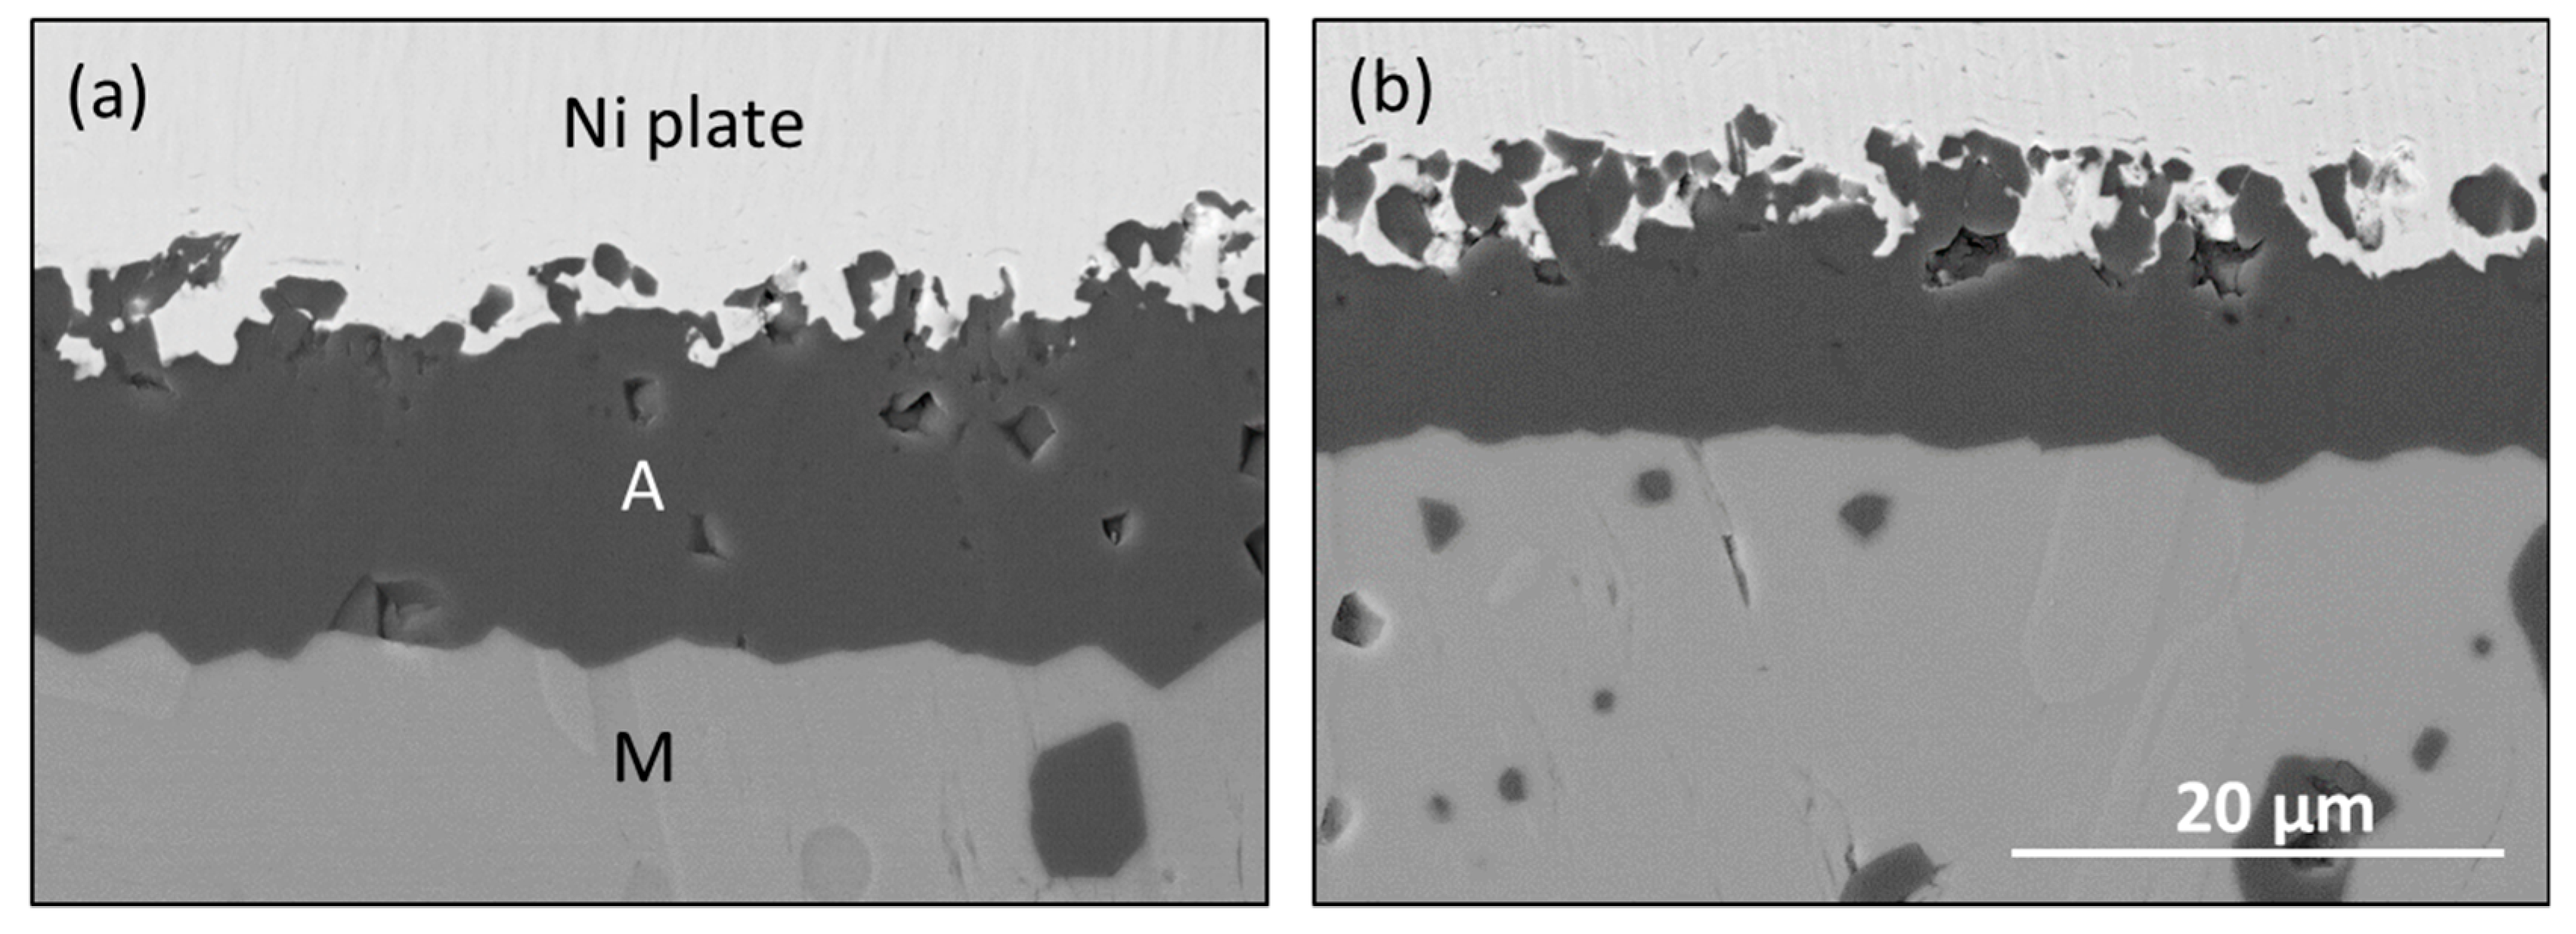
In cross-section, Figure 8, little indication of Ti-rich scales remains, and the scale is thicker in the hot zone region (a). The surfaces are very irregular and open, consistent with scale removal by volatile products. Less of this structure remains in the hot zone region compared to the grip end (b). Again, the scale-substrate interface is seen to be completely intact.
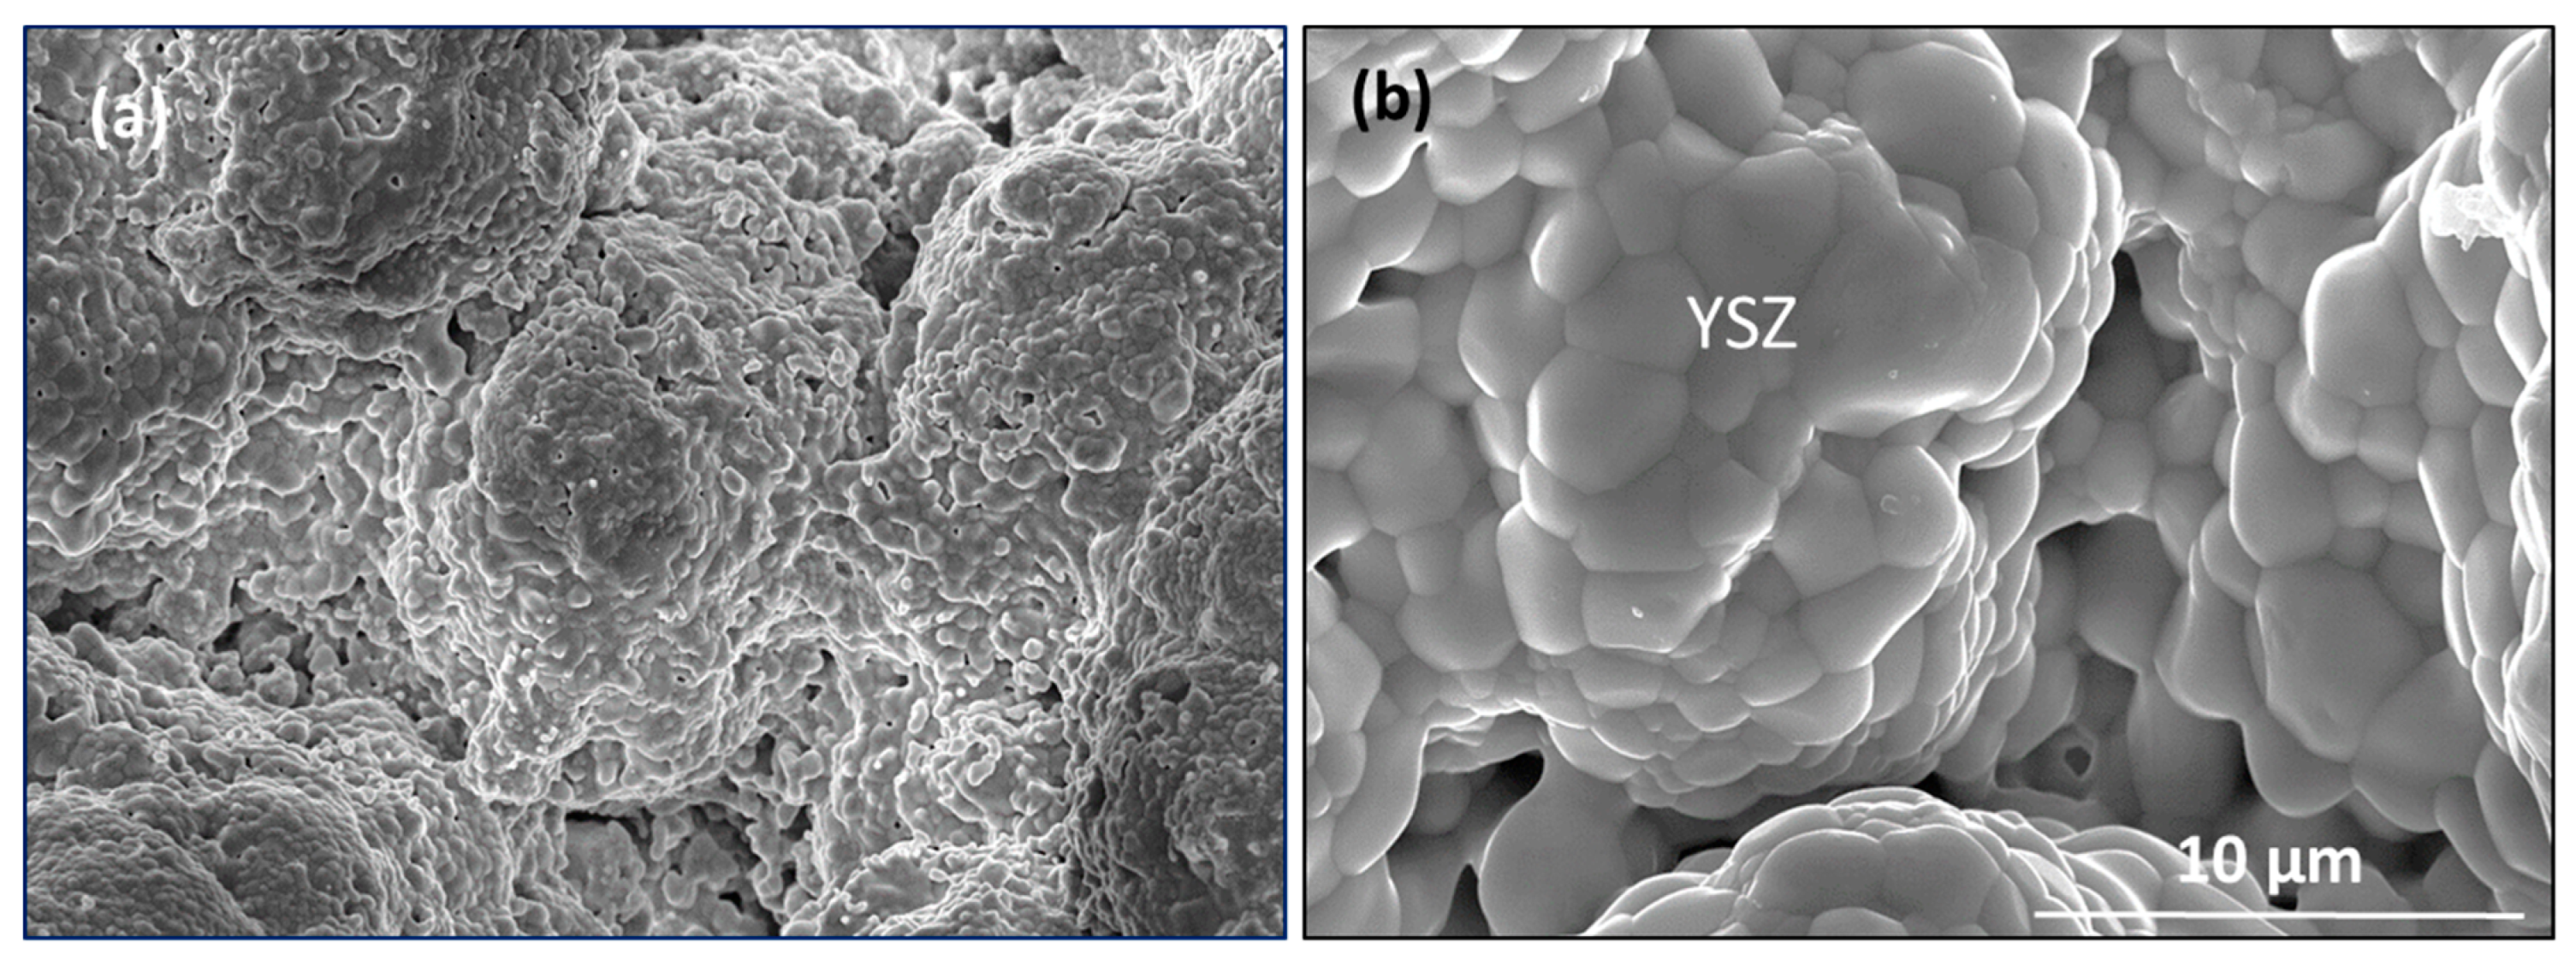
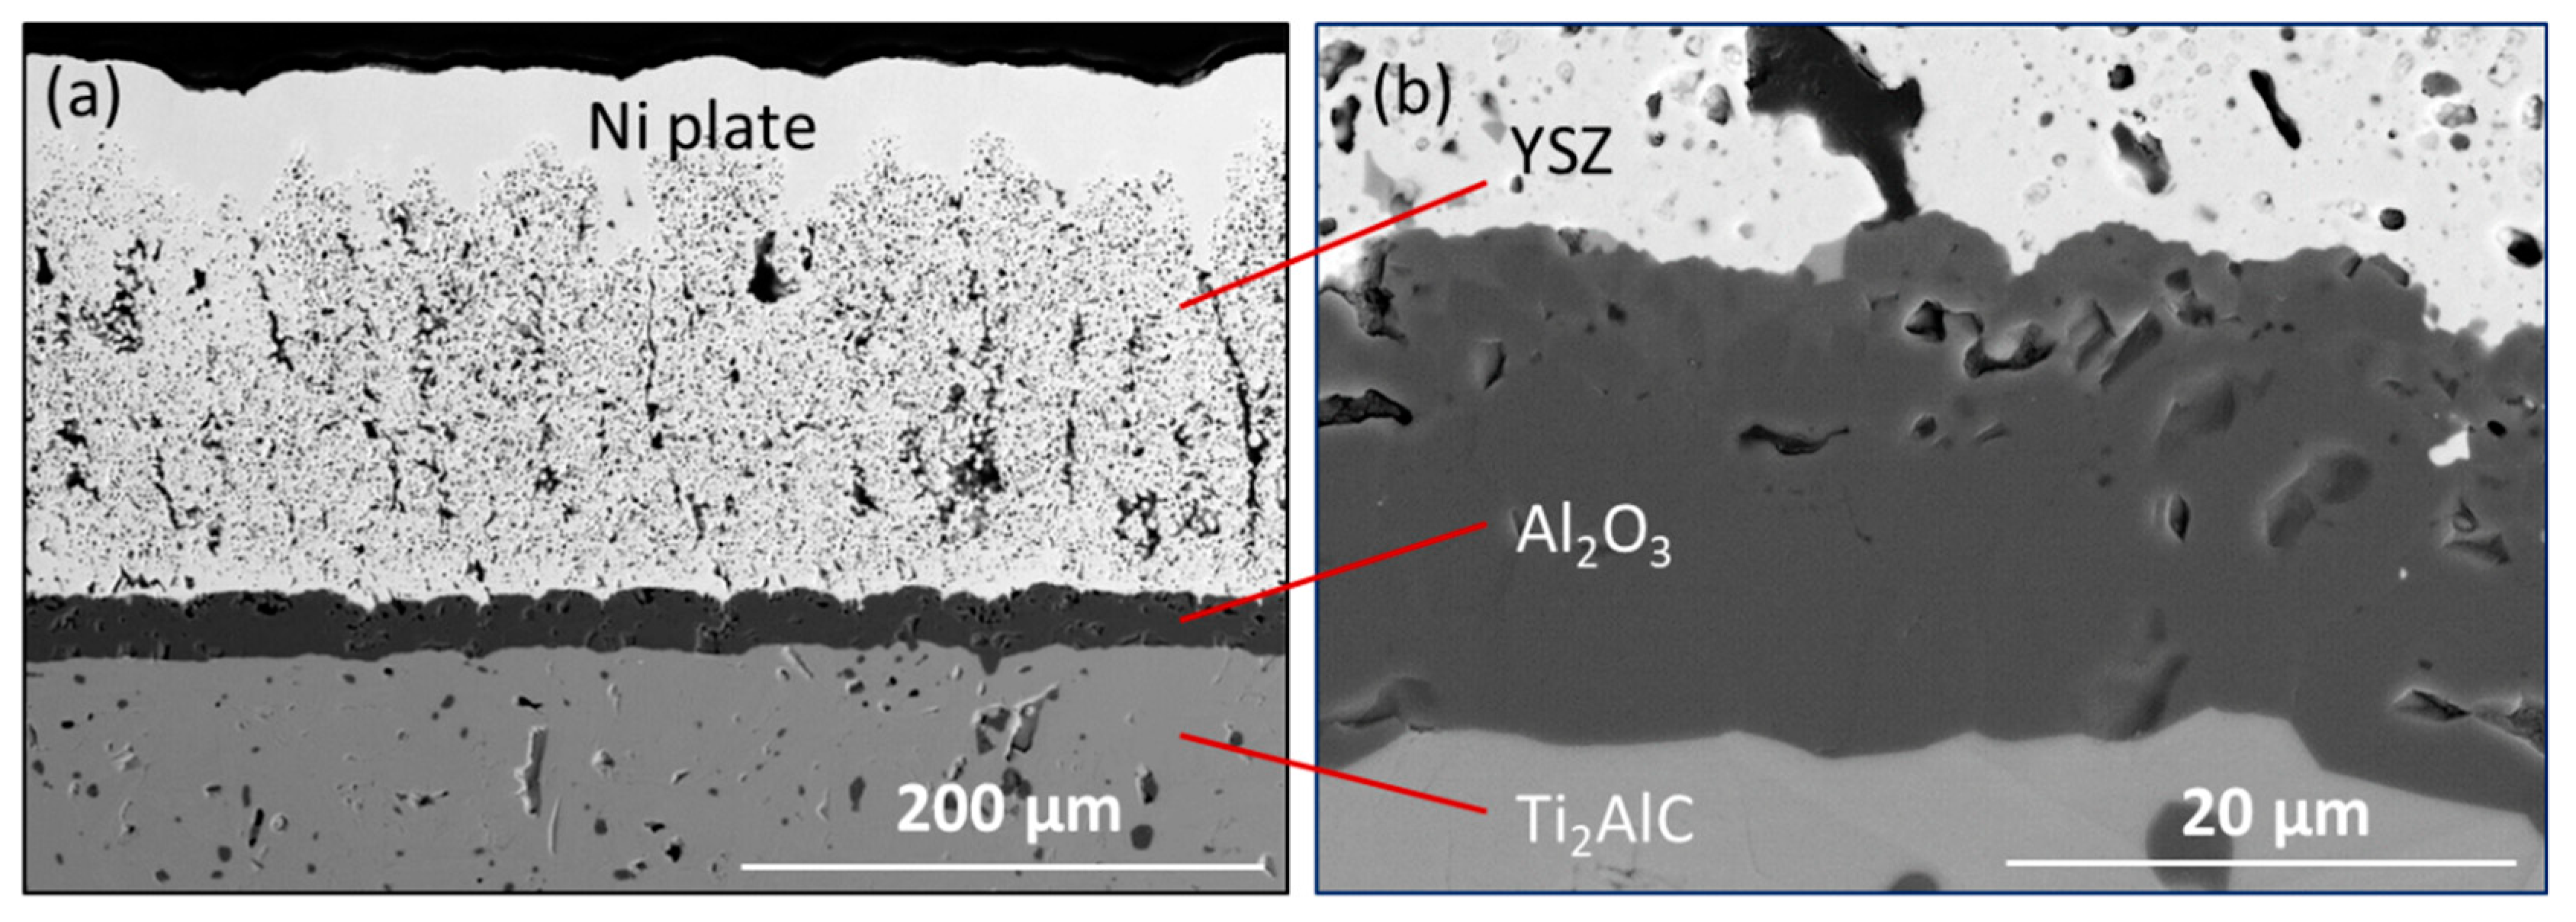
Figure 9 presents coating structures typifying the as-sprayed (a) and the hot zone region (b) for the coated face of the Mach 0.3 BRT sample. The coating exhibits deposition columns, first textured by the deposition process (a), then by grain growth and surface smoothing during thermal annealing (b). Here, the flame directly impinged on the YSZ coating face, which shows no features of oxide removal by volatility: the zirconia grains and PS-PVD coating columns are basically intact. In the cross-section (Figure 10), the coating, TGO, and MAX phase substrate are also intact with no interfacial porosity, cracks, or delamination. Porosity and metallographic pullout, however, is observed within the scale. Volatility issues have therefore been prevented on the coated face. Coating survival after 500 h testing at 1300 °C and 100 m/s is thus indicated on all accounts. Further testing would not be “cost effective” or especially productive as there was little indication of imminent failure, i.e., the same results are expected for 1000 h testing and beyond. Furnace testing has shown similar durability for the YSZ/Ti2AlC system, surviving 2500 h total, including 500 h at 1300 °C and scales up to 40 μm thick [14]. While little evidence is seen for detrimental interface reactions, it can be surmised that sustained Al2O3 growth will be limited by the Al reservoir in the MAX phase substrate.

4. Discussion

The previous assemblage of results compared the high temperature scaling characteristics of the oxidation resistant Ti2AlC phase under moist, high velocity burner conditions to those from static and dry atmospheres. The distinct appearance and removal of the initial TiO2 transient scale by moisture in a high velocity gas stream was highlighted. The relative susceptibility of TiO2 to TiO(OH)2 formation in water vapor appears preferential compared to that of Al2O3 via Al(OH)3 volatiles. Such a condition has been examined in concert with Jacobson’s thermodynamic treatment of various oxides in flowing moist gases [13]. It was predicted that TiO(OH)2 losses would be on the same order as Al(OH)3 losses, but it is now acknowledged that some uncertainties still remain regarding TiO2 volatiles [16,17]. While the Ti-oxides appeared to be removed preferentially, some losses of Al2O3 are also indicated. Critical studies have indeed demonstrated volatile losses and crystallographic etching for bulk Al2O3 [18,19,20].
The general removal rate of various scales in various water vapor environments can be modeled according to v1/2pH2On/ptotal1/2, using the original thermochemical-diffusional approach developed by Opila et al. for various oxides [1]. Here, n = 1 for TiO2, n = 3/2 for Al2O3, and n = 2 for SiO2, as dictated by the chemical reaction with water vapor. Accordingly, the relative severity of the Mach 0.3 test (100 m/s, 1 atm) to the HP-BRT (25 m/s, 6 atm) shown here produces relative rig factors of 0.82, 0.33, and 0.14 for the three scales, respectively [15]. Thus, in the Mach 0.3 test, TiO2 is expected to show similar attack severity as in the HP-BRT, while SiO2 is expected to show less attack, with Al2O3 intermediate. This is consistent with efficient removal of TiO2 observed in both tests and more severe removal of SiO2 in the HP-BRT.
An attempt was made to extract volatility kinetics from the weight change curves using a cubic-linear fit (Chen-Tedmon) [21]. This was partially enabled using COSP for Windows originally designed for cyclic oxidation spalling models. For the present case, cubic growth and uniform scale removal is the model selected [13,22]. To account for a decreasing amount of TiO2 with time, the “spall” (removed) thickness exponent (α) is addressed as a negative number (−3). It is recognized that a constant quotient of the ”spall” fraction, Q0, and cycle duration, τ, yield identical loss rates per hour. (The response basically converges to continuous curves for τ ≤ 1 h and reproduce their analytical expression).
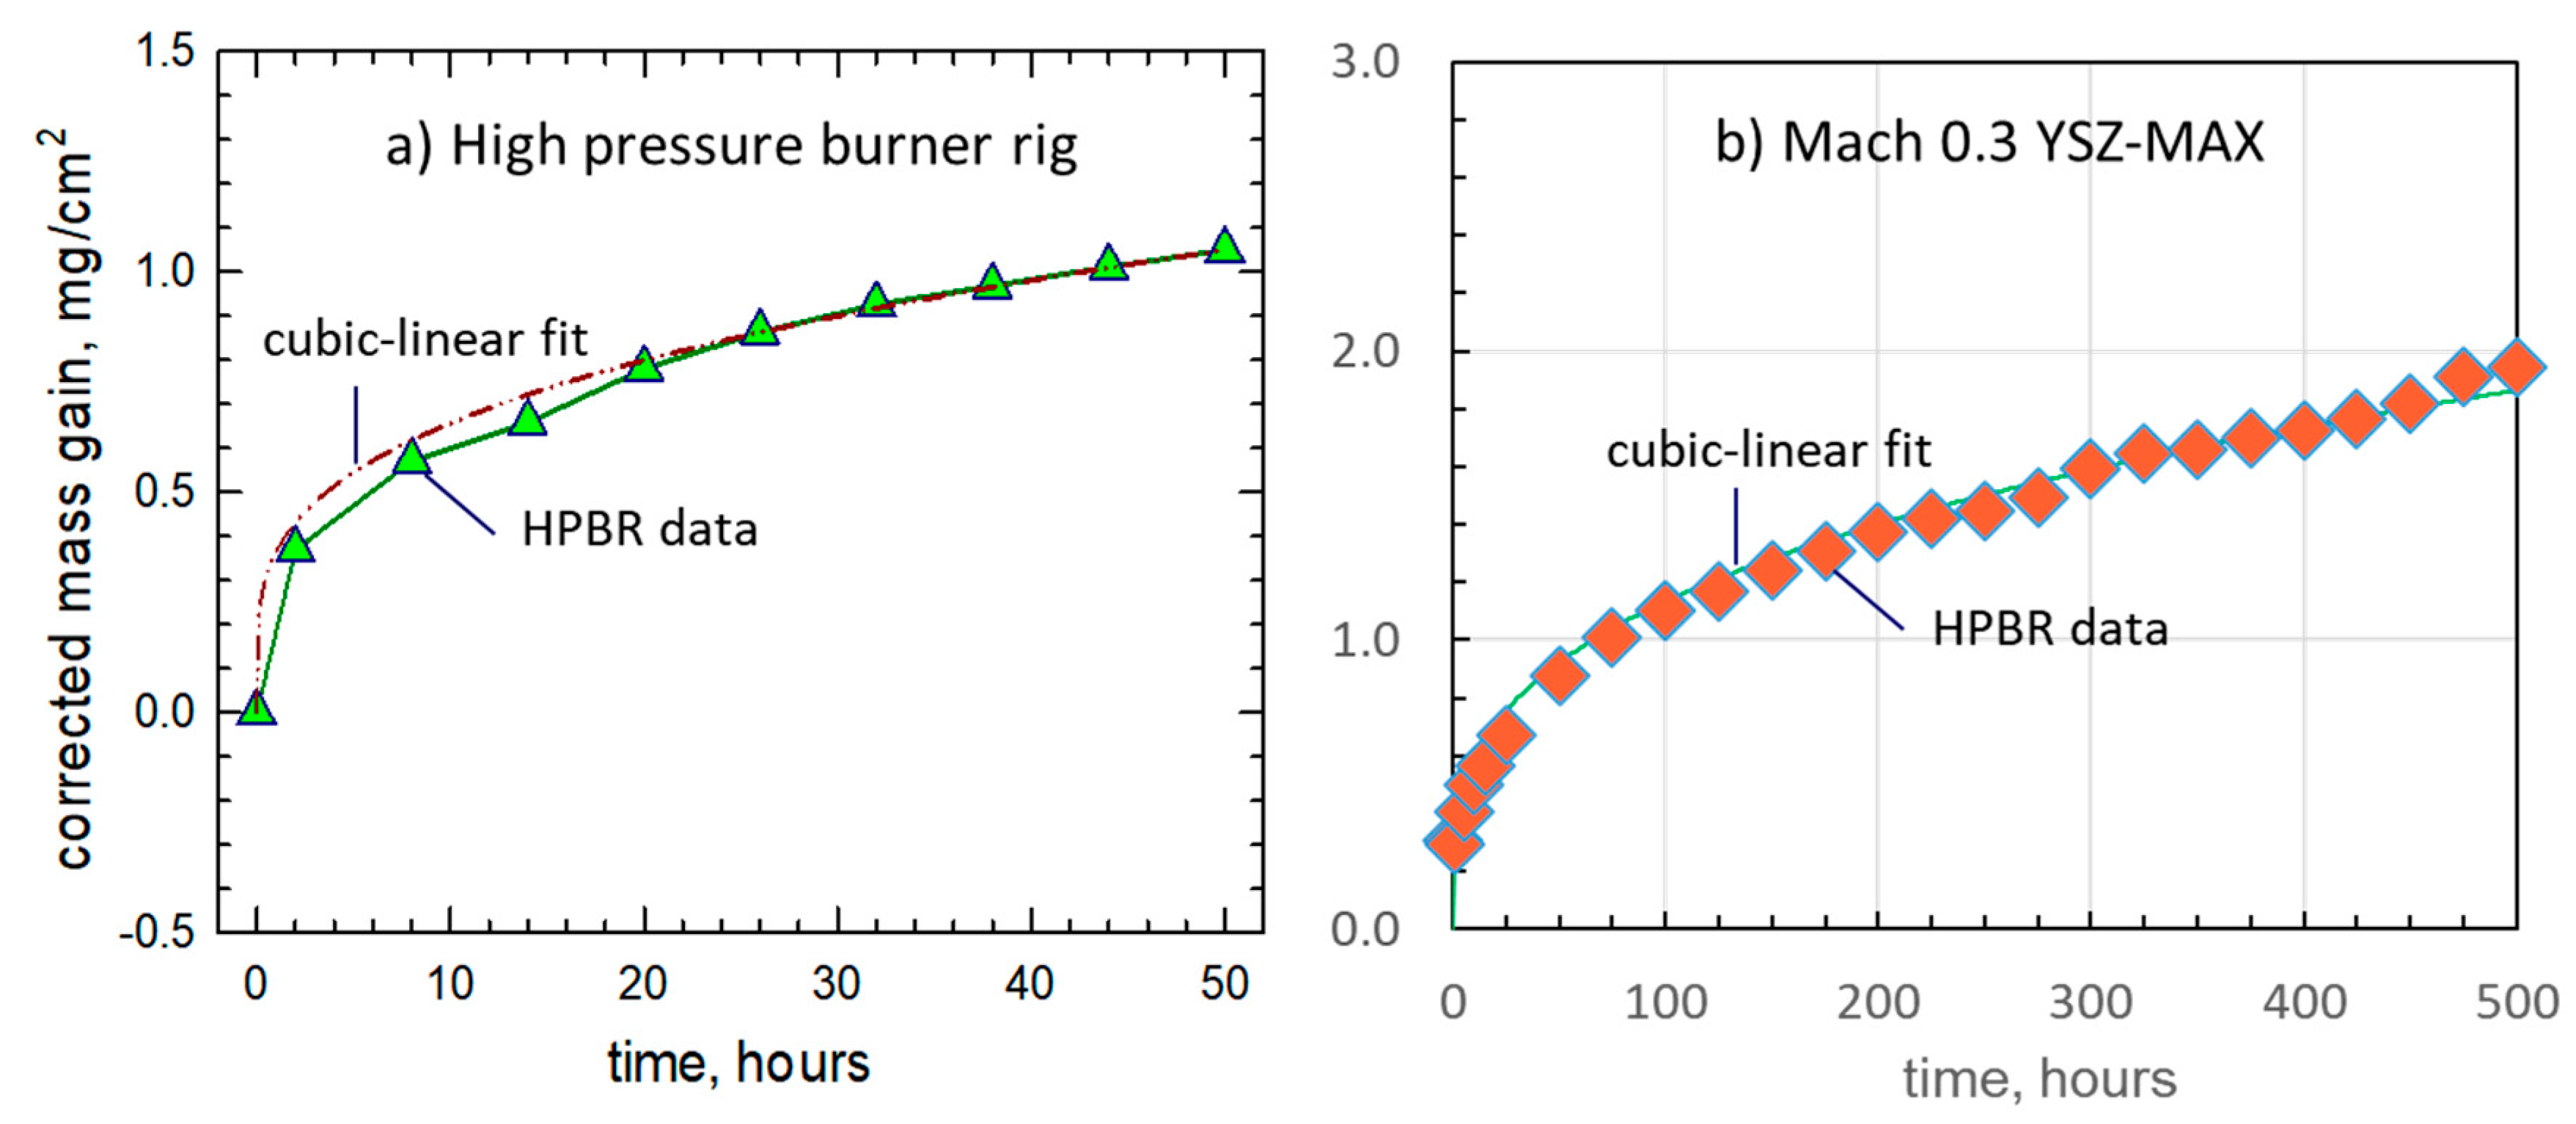
Some solutions are presented in Figure 11 for (a) the HP-BRT and (b) Mach 0.3 BRT results. Both model curves (dashed) are reasonable fits for the experimental data (symbols). The fitting parameters were kc = 0.212 mg3/cm6/h, Q0 = 0.220 for the HP-BRT [13] and kc = 0.050 mg3/cm6/h, Q0 = 0.038 for the Mach 0.3 BRT. Both sets fixed a cubic growth exponent, m = 3.0, and used a decreasing spall exponent, α = −3. The HP-BRT fit initiated with the same kc determined by TGA in dry air. The resulting Q0 was shown to be consistent with a linear volatility weight loss of 0.01–0.02 mg/cm2·h produced for the pre-oxidized sample [13]. The Mach 0.3 BRT, however, maintained face-to-back and center-to-top/bottom temperature gradients. Accordingly, the net Mach 0.3 growth constant was considerably less, being only about one-quarter that of the HP-BRT. Also, the COSP fit projected a low Al volatility weight loss rate of ~0.002 mg/cm2·h after 100 h, converging to just ~0.001 mg/cm2·h after 500 h, or about one-tenth that of the 50 h HP-BRT rates. Remarkably, the Al2O3 scale thickness under the YSZ in the hot zone (at ~1244 °C) after 500 h (~20 μm) was basically the same as that produced in the HP-BRT (at ~1300 °C) after just 50 h.

5. Summary

Results from various thermal exposures of Ti2AlC incorporating water vapor attack in high velocity gas have been examined. Volatility of TiO2 and Al2O3 scales at 1300 °C was indicated by the burner rig results, especially when compared to furnace tests. Discontinuous, superficial colonies of Ti-rich oxide grains were essentially cleaned off in both high-pressure (6 atm.) and long-term, high- velocity (100 m/s) burner tests. While moderate weight gains resulted from continuous Al2O3 growth, 300 h pre-oxidation allowed a net weight loss to be observed for a thick slow-growing scale. The linear loss rate was about one-fifth that determined for SiO2 scales formed on SiC in the same exposure. While Al2O3 losses were not as pronounced as TiO2, grain boundary etching and porosity indicated some volatility effects. The PS-PVD YSZ coating on the hot face of the Mach 0.3 test sample showed no volatility effects and was totally protective of the underlying adherent Al2O3 scale and Ti2AlC substrate. No degradation was apparent for 500 h at a temperature (1300 °C) well in excess of current alloy system capabilities. Continued testing was unwarranted and impractical since failure would not be expected even for much longer times.

Funding

This research received no external funding.

Acknowledgments

Substantial contributions were made to the original works by M. Cuy, B. Harder, A. Garg, R. Pastel, J. Buehler, R. Rogers, and N. Jacobson. Those studies were performed under the NASA Fundamental Aeronautics Program.

Conflicts of Interest

The author declares no conflict of interest

References

  1. Opila, E.J. Volatility of common protective oxides in high-temperature water vapor: Current understanding and unanswered questions. Mater. Sci. Forum 2004, 461, 765–774. [Google Scholar] [CrossRef] [Green Version]
  2. Jacobson, N.; Myers, D.; Opila, E.; Copland, E. Interactions of water vapor with oxides at elevated temperatures. J. Phys. Chem. Solids 2005, 66, 471–478. [Google Scholar] [CrossRef] [Green Version]
  3. Opila, E.J.; Jacobson, N.S.; Myers, D.L.; Copland, E.H. Predicting oxide stability in high-temperature water vapor. JOM 2006, 58, 22–27. [Google Scholar] [CrossRef]
  4. Meschter, P.J.; Opila, E.J.; Jacobson, N.S. Water vapor–mediated volatilization of high-temperature materials. Annu. Rev. Mater. Res. 2013, 43, 559–588. [Google Scholar] [CrossRef]
  5. Lee, K.N.; Fox, D.S.; Bansal, N.P. Rare earth silicate environmental barrier coatings for SiC/SiC composites and Si3N4 ceramics. J. Eur. Ceram. Soc. 2005, 25, 1705–1715. [Google Scholar] [CrossRef]
  6. Basu, S.; Obando, N.; Gowdy, A.; Karaman, I.; Radovic, M. Long-term oxidation of Ti2AlC in air and water vapor at 1000 °C–1300 °C temperature range. J. Electrochem. Soc. 2012, 159, C90. [Google Scholar] [CrossRef]
  7. Maris-sida, M.C.; Meier, G.H.; Pettit, F.S. Some water vapor effects during the oxidation of alloys that are α -Al2O3 formers. Metall. Mater. Trans. A 2003, 34A, 2609–2619. [Google Scholar] [CrossRef]
  8. Lin, Z.J.; Li, M.S.; Wang, J.Y.; Zhou, Y.C. Influence of water vapor on the oxidation behavior of Ti3AlC2 and Ti2AlC. Scr. Mater. 2008, 58, 29–32. [Google Scholar] [CrossRef]
  9. Unocic, K.A.; Pint, B.A. Effect of water vapor on thermally grown alumina scales on bond coatings. Surf. Coat. Technol. 2013, 215, 30–38. [Google Scholar] [CrossRef]
  10. Tallman, D.J.; Anasori, B.; Barsoum, M.W. A critical review of the oxidation of Ti2AlC, Ti3AlC2 and Cr2AlC in air. Mater. Res. Lett. 2013, 1, 115–125. [Google Scholar] [CrossRef]
  11. Smialek, J.L. Oxidation of Al2O3 scale-forming MAX phases in turbine environments. Metall. Mater. Trans. A 2017, 49A, 782–792. [Google Scholar] [CrossRef]
  12. Smialek, J.L. Kinetic aspects of Ti2AlC MAX phase oxidation. Oxid. Met. 2015, 83, 351–366. [Google Scholar] [CrossRef]
  13. Smialek, J.L. Environmental resistance of a Ti2AlC-type MAX phase in a high pressure burner rig. J. Eur. Ceram. Soc. 2017, 37, 23–34. [Google Scholar] [CrossRef] [Green Version]
  14. Smialek, J.L.; Harder, B.J.; Garg, A. Oxidative durability of TBCs on Ti2AlC MAX phase substrates. Surf. Coat. Technol. 2016, 285, 77–86. [Google Scholar] [CrossRef] [Green Version]
  15. Smialek, J.L.; Cuy, M.D.; Harder, B.J.; Garg, A.; Rogers, R.B. Durability of YSZ Coated Ti2AlC in 1300°C Mach 0.3 Burner Rig Tests; NASA/TM 2020-220380. 2019. Available online: https://ntrs.nasa.gov/search.jsp?R=20190033077 (accessed on 4 February 2020).
  16. Nguyen, Q.N.; Bauschlicher, C.W.; Myers, D.L.; Jacobson, N.S.; Opila, E.J. Computational and experimental study of thermodynamics of the reaction of titania and water at high temperatures. J. Phys. Chem. A 2017, 121, 9508–9517. [Google Scholar] [CrossRef]
  17. Myers, D.L.; Jacobson, N.S.; Bauschlicher, C.W.; Opila, E.J. Thermochemistry of volatile metal hydroxides and oxyhydroxides at elevated temperatures. J. Mater. Res. 2019, 34, 397–407. [Google Scholar] [CrossRef]
  18. Opila, E.J.; Myers, D.L. Alumina volatility in water vapor at elevated temperatures. J. Am. Ceram. Soc. 2004, 87, 1701–1705. [Google Scholar] [CrossRef]
  19. Yuri, I.; Hisamatsu, T. Recession Rate Prediction for Ceramic Materials in Combustion Gas Flow. 2003. Available online: https://asmedigitalcollection.asme.org/GT/proceedings-abstract/GT2003/36843/633/298920 (accessed on 4 February 2020).
  20. Gatzen, C.; Mack, D.E.; Guillon, O.; Vaßen, R. Water vapor corrosion test using supersonic gas velocities. J. Am. Ceram. Soc. 2019, 102, 6850–6862. [Google Scholar] [CrossRef]
  21. Chen, Y.; Tan, T.; Chen, H. Oxidation companied by scale removal: Initial and asymptotical kinetics. J. Nucl. Sci. Technol. 2008, 45, 662–667. [Google Scholar] [CrossRef]
  22. Smialek, J.L.; Auping, J. V COSP for windows—Strategies for rapid analyses of cyclic-oxidation behavior. Oxid. Met. 2002, 57, 559–581. [Google Scholar] [CrossRef]
Figure 1. Comparison of 1300 °C Ti2AlC furnace and burner oxidation data. Mach 0.3 burner at 1 atm. and 100 m/s; HPBR at 6 atm. and 25 m/s, TGA dry air, and ambient air furnace tests.
Coatings 10 00142 g001
Figure 2. Arrhenius plot of log cubic oxidation rate constant vs 1/T; TGA furnace tests of Ti2AlC in dry air for 100 h at 1000–1400 °C [14].
Coatings 10 00142 g002
Figure 3. Cubic oxidation kinetics suggested by linearized transient-corrected weight vs t1/3 behavior for Ti2AlC. (a) 6 atm, 25 m/s, 50 h, HP-BRT; and (b) 1 atm., 100 m/s, 500 h, Mach 0.3 BRT, with YSZ face-coat [13,15].
Coatings 10 00142 g003
Figure 4. Optical micrographs depicting discontinuous TiO2 scales formed in furnace tests and successive removal in HP-BRT exposures at 1300 °C.
Coatings 10 00142 g004
Figure 5. SEM/BSE surface microstructures of scales formed on Ti2AlC at 1300 °C in (a) furnace pre-oxidation for 300 h and (b) followed by high pressure burner rig (80 h at 6 atm, 25 m/s). T (Ti-rich transient scale); A (Al2O3) [13].
Coatings 10 00142 g005
Figure 6. SEM/BSE cross sections of scale microstructures formed on Ti2AlC at 1300 °C in (a) furnace TGA (100 h) [11] and (b) high pressure burner rig (50 h at 6 atm, 25 m/s). Ni (plating); T (Ti-rich transient scale); A (Al2O3); M (MAX phase substrate).
Coatings 10 00142 g006
Figure 7. SEM/BSE surface microstructures of scales formed on Ti2AlC at 1300 °C in Mach 0.3 high velocity burner rig (500 h at 1300 °C) Uncoated backside at sample (a) top, (b) hot center, (c) grip end. T (Ti-rich transient scale); A (Al2O3); P (etched platelets) [15].
Coatings 10 00142 g007
Figure 8. SEM/BSE cross-section images of scale microstructures formed on Ti2AlC in Mach 0.3 BRT (1300 °C, 500 h, 100 m/s, 1 atm). (a) Hot section, uncoated backside; (b) cooler grip end, uncoated backside. Ni (plating); A (Al2O3); M (MAX phase substrate) [15].
Coatings 10 00142 g008
Figure 9. SEM microstructure of YSZ coating surface on Ti2AlC after the Mach 0.3 high velocity burner rig test. (a) Grip end, 500 h/1200 °C test, (b) hot zone, 500 h/1300 °C test.
Coatings 10 00142 g009
Figure 10. SEM/BSE hot zone cross-section of YSZ coated Ti2AlC after BRT (Mach 0.3, 500 h/1300 °C). (a) Full structure, (b) detail showing intact YSZ–Al2O3–Ti2AlC interfaces [15].
Coatings 10 00142 g010
Figure 11. Cubic-linear fits to burner oxidation results for Ti2AlC: (a) high pressure (6 atm, 25 m/s, 1300 °C). (COSP for Windows, kc = 0.212 mg3/cm6/h, Q = 0.220 mg/cm2/h, m = 3, α = −3); (b) high velocity Mach 0.3 for YSZ/Ti2AlC (1 atm, 100 m/s, 1300 °C). (COSP for Windows: kc = 0.050 mg3/cm6/h, Q = 0.038 mg/cm2/h, m = 3, α = −3).
Coatings 10 00142 g011

