Article

Damage Mechanism Based Approach to the Structural Health Monitoring of Wind Turbine Blades

by
Malcolm McGugan
and
Leon Mishnaevsky, Jr.
*
Department of Wind Energy, Risø Campus, Technical University of Denmark, Frederiksborgvej 399, 4000 Roskilde, Denmark
*
Author to whom correspondence should be addressed.
Coatings 2020, 10(12), 1223; https://doi.org/10.3390/coatings10121223
Submission received: 18 November 2020 / Revised: 4 December 2020 / Accepted: 8 December 2020 / Published: 14 December 2020
(This article belongs to the Special Issue Wind Turbine Blade Coatings: New Advances, Application and Challenges)

Abstract

:
A damage mechanism based approach to the structural health monitoring of wind turbine blades is formulated. Typical physical mechanisms of wind turbine blade degradation, including surface erosion, adhesive fatigue, laminate cracking and in some cases compressive kinking and failure are reviewed. Examples of a local, damage mechanism based approach to the structural health monitoring of wind turbine blades are demonstrated, including the monitoring of leading edge erosion of wind turbine blades, adhesive bond failure, plydrop delamination, static and dynamic plydrop tests, and bolt and laminate fatigue. The examples demonstrate the possibilities of monitoring specific damage mechanisms, and specific localizations of wind turbine blades.

1. Introduction

Currently, 205 GW of wind energy capacity is available in Europe. By 2030, 323 GW of wind energy will be installed in the EU [1]. Wind energy covers now 15% of the EU’s electricity demand, and in 2030 it is expected to reach 30%, and provide employment to 569,000 people. Thus, a large expansion of wind energy is expected. However, the operation and maintenance (O&M) costs for wind turbines are very high, making up 20–25% of the total levelized cost per kWh over the lifetime of a turbine [2]. High maintenance and repair costs increase the energy price and make wind energy less competitive. Structural repair of a single wind blade can cost up to $30,000, and a new blade costs, on average, about $200,000 [3].
In order to reduce the maintenance cost, new strategies of maintenance, including also health monitoring are required. Maintenance of wind turbines is an important and also expensive part of the wind farm owners function. The maintenance can be realized as corrective maintenance strategy (i.e., the maintenance and repair activity starts only after a failure or damage event), preventive (time-based) maintenance (i.e., regular inspections of wind turbines, allowing early identification of coming damage or failure). Preventive maintenance can be realized as scheduled and condition based maintenance, which requires permanent health monitoring and allows for early fault detection.
Installing structural health monitoring requires local modification of wind turbine blade materials, leading to additional costs and efforts. On the other side, the efficiency of structural health monitoring in detecting blade degradation requires further improvement.
In this paper, the idea of the damage mechanism based (mechanism-informed) structural health monitoring of wind turbine blades is formulated. In Section 2, various strategies and approaches of structural health monitoring are discussed. The concept of damage mechanism based structural health monitoring of wind turbine blades, and the damage mechanisms are discussed in Section 3. Examples of the local, damage mechanism based approach to the structural health monitoring of wind turbine blades are demonstrated in Section 4. The examples demonstrate the possibilities of monitoring specific damage mechanisms, and specific localizations of wind turbine blades.

2. Maintenance and Health Monitoring of WT Blades: State of the Art

The corrective maintenance strategy leads to a rather late, post-failure start of maintenance activities, and thus, a risk of large or even catastrophic failure of wind turbines. Preventive maintenance, widely used in the aircraft industry, allows for early detection of incipient failure, but only if the inspections are carried out quite often. Preventive maintenance for one turbine per year costs around €10,000, depending on the competence of the technicians and local labor markets (plus the costs of system failures) [4].
Further, the reliability-based inspection strategy (when the next inspection is scheduled on the basis of reliability prognosis and probabilistic fatigue crack growth analysis) and risk-based approach (the next inspection takes into account also the possible consequence of a failure and inspection and repair costs) are often used, which represent a kind of balance between preventive and corrective maintenance strategies. The condition based maintenance (CBM) can be employed if the integrity of the wind turbine blades is permanently observed, for instance, by using permanent sensors in the blades. It would allow avoiding unnecessary (and, again expensive) inspections of wind turbines. The transition from the “passive” to “proactive” condition based maintenance is expected to reduce maintenance costs drastically (up to 239% net cost savings) [5] and increase the reliability of structures [6]. For aircrafts, the CBM reduces the delays from unscheduled maintenance by 80% [7], and reduce downtime by 10…12 times [8].
Global monitoring of large structures is increasingly common for many civil engineering applications (such as bridges). From a relatively small number of measurements, the dynamic response of the entire structure should be calculated. A lot of different solutions for structural health monitoring of wind turbine blades have been developed based on various sensing mechanisms and data analysis approaches. Such wild growth lead to the situation when solutions developed in different groups are not related and not based on other solutions, and a lot of publications are in fact reviews seeking to classify available techniques [9,10,11,12,13,14,15,16,17,18].
The SCADA system (supervisory control and data acquisition) is used for remote supervision and control of the entire wind parks and the individual wind turbines [10,17]. Condition monitoring systems (CMSs) provide operators with information about the health of the structures [18].
The SHM of blades can be realized using vibration monitoring, strain measuring, acoustic emissions, impedance techniques, ultrasonic waves, smart paint, laser vibrometry and ultrasound, impedance tomography, thermography, and nanosensors [13,19,20,21]. Different types of sensors can be employed, e.g., PZT wafers, fiber optic sensors, accelerometers, MEMS, etc. Initial health monitoring systems were developed for static testing, e.g., acoustic emission (AE) and coherent optical (CO) techniques developed in [22], and acoustic emission (passive listening) based structural neural system with piezoelectric sensors developed by NREL [23]. The structural health monitoring of the blades includes acquiring and analyzing data from sensors in the given structure and evaluation of the integrity and health of a structure [24]. The SHM system should include sensors, attached to the structure, corresponding hardware (data handling) and software for the data analysis. Figure 1 schows a schema of the information flow from blade damage via SHM to repair.

2.1. Value of Information and Modeling in Maintenance Analysis

There exist several mathematical models used in maintenance analysis. The concept of value of information (VoI), allowing quantification of the benefits provided by structural health monitoring (SHM) systems has been formulated in [25]. The approach is based on the influence diagram (ID), structured graphical representation of decision processes under uncertainty, which supports the modeling process.
Ossai et al. [26] used six-state Markov model to analyze the influence of maintenance on failure risks and downtimes. Bangalore et al. [27] developed PMSPIC (preventive maintenance scheduling problem with interval costs) mathematical model, which takes into account both age based and condition based failure rate models, to be used for the optimizing of maintenance scheduling.
Nielsen and colleagues [28] estimated the value of the information (VoI) delivered by the SHM system. The monitored object is a blade of an operating wind turbine. The case study shows how the maintenance cost optimization can be performed using a risk-based approach cast in a Bayesian decision analysis framework, in which probabilistic models are developed for blade deterioration processes, blade inspections, and SHM systems.

2.2. Vibration-Based Techniques/Operation Modal Analysis

The method is based on measurements of the blade vibration spectra and detecting the eigenfrequencies of the blades [18]. The vibration monitoring can be done using accelerometers, piezo or microelectromechanical systems (MEMSs). Arcenault et al. [29] developed a distributed strain sensor system based on fiber Bragg grating (FBG) for real time structural health monitoring of a wind turbine rotor. Operational modal analysis (OMA) methods, the frequency domain decomposition (FDD) method and the Hilbert transform method (HTM) were used to capture natural frequencies and mode shapes of distributed strains. The model was validated by testing sudden change in the dynamic properties of the blade due to the addition of a lumped mass to one of the blades. In [30], piezoceramic actuator patches bonded to the blade were used to excite the vibrations and the vibration response of the blade was measured using the patches or scanning laser Doppler vibrometer. In order to detect damage, the authors considered and compared four algorithms, namely, transmittance function, resonant comparison, operational detection shape, and wave propagation methods.
Kim et al. [31] used operational modal analysis (OMA) with numerical-sensor signals to carry out SHM of floating offshore wind turbines, with the numerical accelerometer signals along the tower and blade of FOWT in dynamic wind field. The frequency-domain decomposition (FDD) method was used. The damage is detected by comparing modal properties (natural frequencies, displacement mode shapes (DMS), and curvature mode shapes (CMS)) between the intact and damaged conditions. CMS was shown to be the most effective modal property to detect damage locations and intensities. Tcherniak, and Mølgaard [32] developed an active vibration-based SHM system, with an electromagnetic actuator (which periodically hits the base) and a number of accelerometers connected to the data acquisition unit, attached inside the rotor’s spinner. A semisupervised learning algorithm and anomaly detection approach were used for the damage detection.

2.3. Acoustic Emissions (AEs)

AE based methods use piezoelectric sensors, which detect high-frequency elastic waves caused by cracking or debonding. In [9], the authors reviewed SHM and NDT systems developed by teams from NASA Kennedy Space Center, Purdue University and Virginia Tech. The SHM systems were based on commercial acoustic emission (AE) NDT system. Macrofiber composite (MFC) actuator and MFC sensors were installed in wind blades in different layouts. The acoustic emission sensors monitor sound waves caused by structural damage that propagate on the blade surface. Acoustic velocity and attenuation measurements allowed detecting significant AE events early in the tests. Among acoustic based damage detection methods, active (involving generating a controlled acoustic input signal) and passive methods (using sound generated by the natural wind flow around the blade) can be used. In [33], acoustics-based damage detection methodology on the basis of a change in acoustic transmission loss (TL; loss of acoustic power) across the boundaries of a damaged blade compared with its undamaged state was proposed. The authors proposed that placing microphones inside the blade cavities to monitor the acoustic environment and diagnose damage. Poozeh et al. [34] proposed using an array of microphones to detect cracks in blades. To analyze the acoustic pressure distribution in and around airfoils, which is necessary for passive damage detection, Traylor and colleagues [35] developed a generalized computational methodology of reduced order acoustic-structural coupled modeling of the aeroacoustics of a blade. It was demonstrated how passive acoustic detection could be used to identify blade damage. The acoustic emission (AE) technique, based on recording and analyzing acoustic waves generated by a blade material when it becomes damaged, has proven its high effectiveness in identifying damage in wind turbine blades (see for instance [36]).

2.4. Strain Measurement

Strain measurements can be carried out using strain gauge or fiber optic cables (fiber Bragg grating (FBG) sensor and optic fiber microbend displacement sensor). Song et al. [37] developed the piezoceramic-based wireless sensor network (WSN) for health monitoring of wind turbine blades with the active sensing approach. The WSN included an access point, which coordinates the network and is connected to a computer, and another node working as wave inciting actuator exciting. Other wireless nodes detect the wave responses, and provide data for the analysis. Damage status at different sites is evaluated at distributed locations. The damage status inside the blade was evaluated through the analysis of the sensor signals. Based on wavelet packet analysis results, a damage index and a damage matrix were developed to evaluate the damage status, including sensor-history damage index matrix at different locations. The approach was tested in static testing and in wind tunnel test. Zhang et al. [38] developed monitoring based on an optical fiber Brillouin sensor and Brillouin optical time domain analysis (BOTDA). They demonstrated that the system can detect cracks as small as 1.5 cm. Schroeder et al. [39] installed fiber Bragg grating sensor system for continuous on-line load monitoring of the rotor blade. The system functioned for over one year.

2.5. Ultrasound Wave Propagation

The ultrasonic pulse, sent into the blades by a transducer, is reflected at the defects, if they are there, and recorded by the same sensors. Lee and colleagues [40] proposed a portable long distance ultrasonic propagation imaging (LUPI) system, which used a laser beam targeting and scanning system. To evaluate the damage, Lee and colleagues developed a platform based on anomalous wave propagation imaging (AWPI) methods. Park and colleagues [41] used laser ultrasonic imaging, and a piezoelectric sensor for ultrasonic measurement. Arnold and colleagues [42] tested the radar system (namely, frequency-modulated continuous wave radar) for structural health monitoring of wind turbine blades. The damage was detected by comparing signals from 3D imaging and as small as a 30-mm cut in a glass fiber composite structure could be localized.

2.6. Measuring Impedance Changes

High-frequency structural excitations are applied through surface-bonded piezoelectric transducers, and the changes in measured impedance (measured by monitoring the current and voltage applied to the piezoelectric transducers) indicate the damage occurrence [43]. Park and Inman [43] reviewed the impedance-based structural health monitoring, and demonstrated the usage of this technique. In order to detect structural damage, a frequency-domain autoregressive model with exogenous inputs (ARX) was developed and validated. Pitchford et al. [44] proposed to use impedance-based structural health monitoring for the onboard SHM system, with attached piezoceramic (PZT) patches serving as self-sensing actuators, exciting the structure with high-frequency excitations, and monitoring changes in impedance. The integrity of blades is accessed by monitoring the electrical impedance of the PZT.

2.7. Thermography and Imaging

Defects, local degradation of materials can cause the temperature patterns, which can be detected by using infrared thermography, and analyzed to identify the defects. Hwang et al. [45] proposed a noncontact, continuous line laser thermography technique for damage detection of rotating blades. Thermal waves, generated by a laser beam on the blade are measured by an infrared camera. The damage imaging algorithm (image reconstruction using a coordinate transformation and damage extraction using a statistical pattern recognition) is then used to visualize the damage. Similarly, X-ray can allow identification of changing local properties due to defects [14].

2.8. Embedded Conductive Nanoscale Particles

The conductive nanoparticles (for instance, carbone nanotubes/CNT, graphene, and Mxenes) embedded in the composites and polymer layers can enhance the toughness and fatigue resistance of the materials [46,47,48,49], but also be used as nanosensors. The nanoparticles are arranged in networks, layers, agglomerates, or fibers, creating the conductivity path in the material. The electrical resistance of the materials with nanoparticles is changed under deformation and failure, due to changing, eventually broken, contact between adjacent carbon nanoparticles, thus, changing the percolation path, and the change in the tunneling resistance between two adjacent nanoparticles, due to changing distance between them. Kang and colleagues [50] used multiwalled carbon nanotube reinforced PMMA polymer as a piezoresistive strain sensor for structural health monitoring. They considered the nanotube strain sensor as a biomimetic artificial neuron, which can be used for detecting large strains and cracking. Sam-Daliri et al. [51] proposed to use the multiwalled carbon nanotubes (MWCNTs) loaded epoxy composites to sense strain changes under tension load using an AC impedance measurement setup. They demonstrated high sensitivity of the impedance reading. Dai [52] developed a carbon nanotube (CNT)-based nonwoven composite sensor that can be integrated with a difference imaging-based electrical impedance tomography (EIT) sensing scheme to offer a true two-dimensional damage sensing methodology. The system allows estimating damage location, size, and severity. Grabowski et al. [53,54] developed MWCN/polymer (acrylic and epoxy) based sensors and then applied to the test material with the use of two techniques (screen printing and spray coating). They tested the sensors and demonstrated the usability. Li et al. [55] proposed fiber-reinforced polymers with an embedded graphene sensing network connected to the guided ultrasonic wave (GUW)-based structural health monitoring (SHM) system. The tunneling effect, triggered by guided ultrasonic waves makes it possible to avoid use of conventional ultrasonic transducers, creating the possibility of self-health monitoring, without using external sensors.

2.9. Damage Detection

Wind turbines operate under varying complex conditions (fatigue, rotation, random variations of load, of temperature, and humidity). Therefore, the measured signals are often non-stationary, even without forming cracks and defects [13]. In order to extract the damage information from the rather complex signals, different pattern recognition techniques (novelty detection) are applied, e.g., Bayesian classification methods, nearest-neighbor search, artificial neural network classifiers, and also unsupervised learning approaches [13]. The damage detection can include the information about availability of damage, or, at more detailed level, identification of type and localization of damage. The data and signal analysis processing are carried out using statistical and trend analysis, filtering methods, time-domain analysis, power cepstrum analysis (inverse Fourier transformation), time-domain averaging, fast-Fourier transform (FFT), amplitude demodulation, and wavelet transformations [19]. Ou, Dertimanis, and Chatzi [20] proposed vibration-based scheme operational damage identification based on the variability of the mode shape curvatures (MSCs) of the blade along its plane direction. Dervilis et al. [21] used machine learning algorithms based on optimized artificial neural networks (ANNs), autoassociative neural network (AANN) based on a standard ANN form and a novel approach to autoassociation with radial basis functions (RBFs) networks. The method relied on vibration data and frequency response function measurements (FRFs). Generally, statistical model development methods are reviewed in [16].

2.10. Limitations and Challenges

Structural health monitoring technology faces many challenges, and the techniques used have their advantages and disadvantages. Strain gauges are prone to failures and can be sensitive to lightning. Acoustic emission and other local sensor based technologies, require a high number of distributed sensors for detection of small damages [18]. Further, the modal characteristics of the blades are determined by load carrying parts (cap), and that influences the sensitivity of operation modal analysis, and limits the detection of small cracks in bondlines or surface erosion defects [18]. Wireless sensors require additional power supply for the sensors. FBG sensors have some advantages over the resistive strain gauge type system, by being insensitive to electromagnetic interference, having a higher signal to noise ratio, and having greater signal transmittance distance [29]. Optic fibers have low electric conductivity and thus are safer against lightning. However, the optical fiber approach allows mainly measuring local properties while piezoelectric transducers allow real-time monitoring of an entire blade.

3. Concept of Mechanism Based Structural Health Monitoring of Wind Turbine Blades

3.1. On the Damage Mechanism-Informed Health Monitoring

The techniques using few sensors to measure structural response features are rarely sensitive enough to detect localized damage reliably unless the damage is severe. This has also been the experience for monitoring of wind turbine blades and although operational approaches suitable for detecting ice accumulation or turbine imbalance exist, these seldom provide information about specific damage locations or severity.
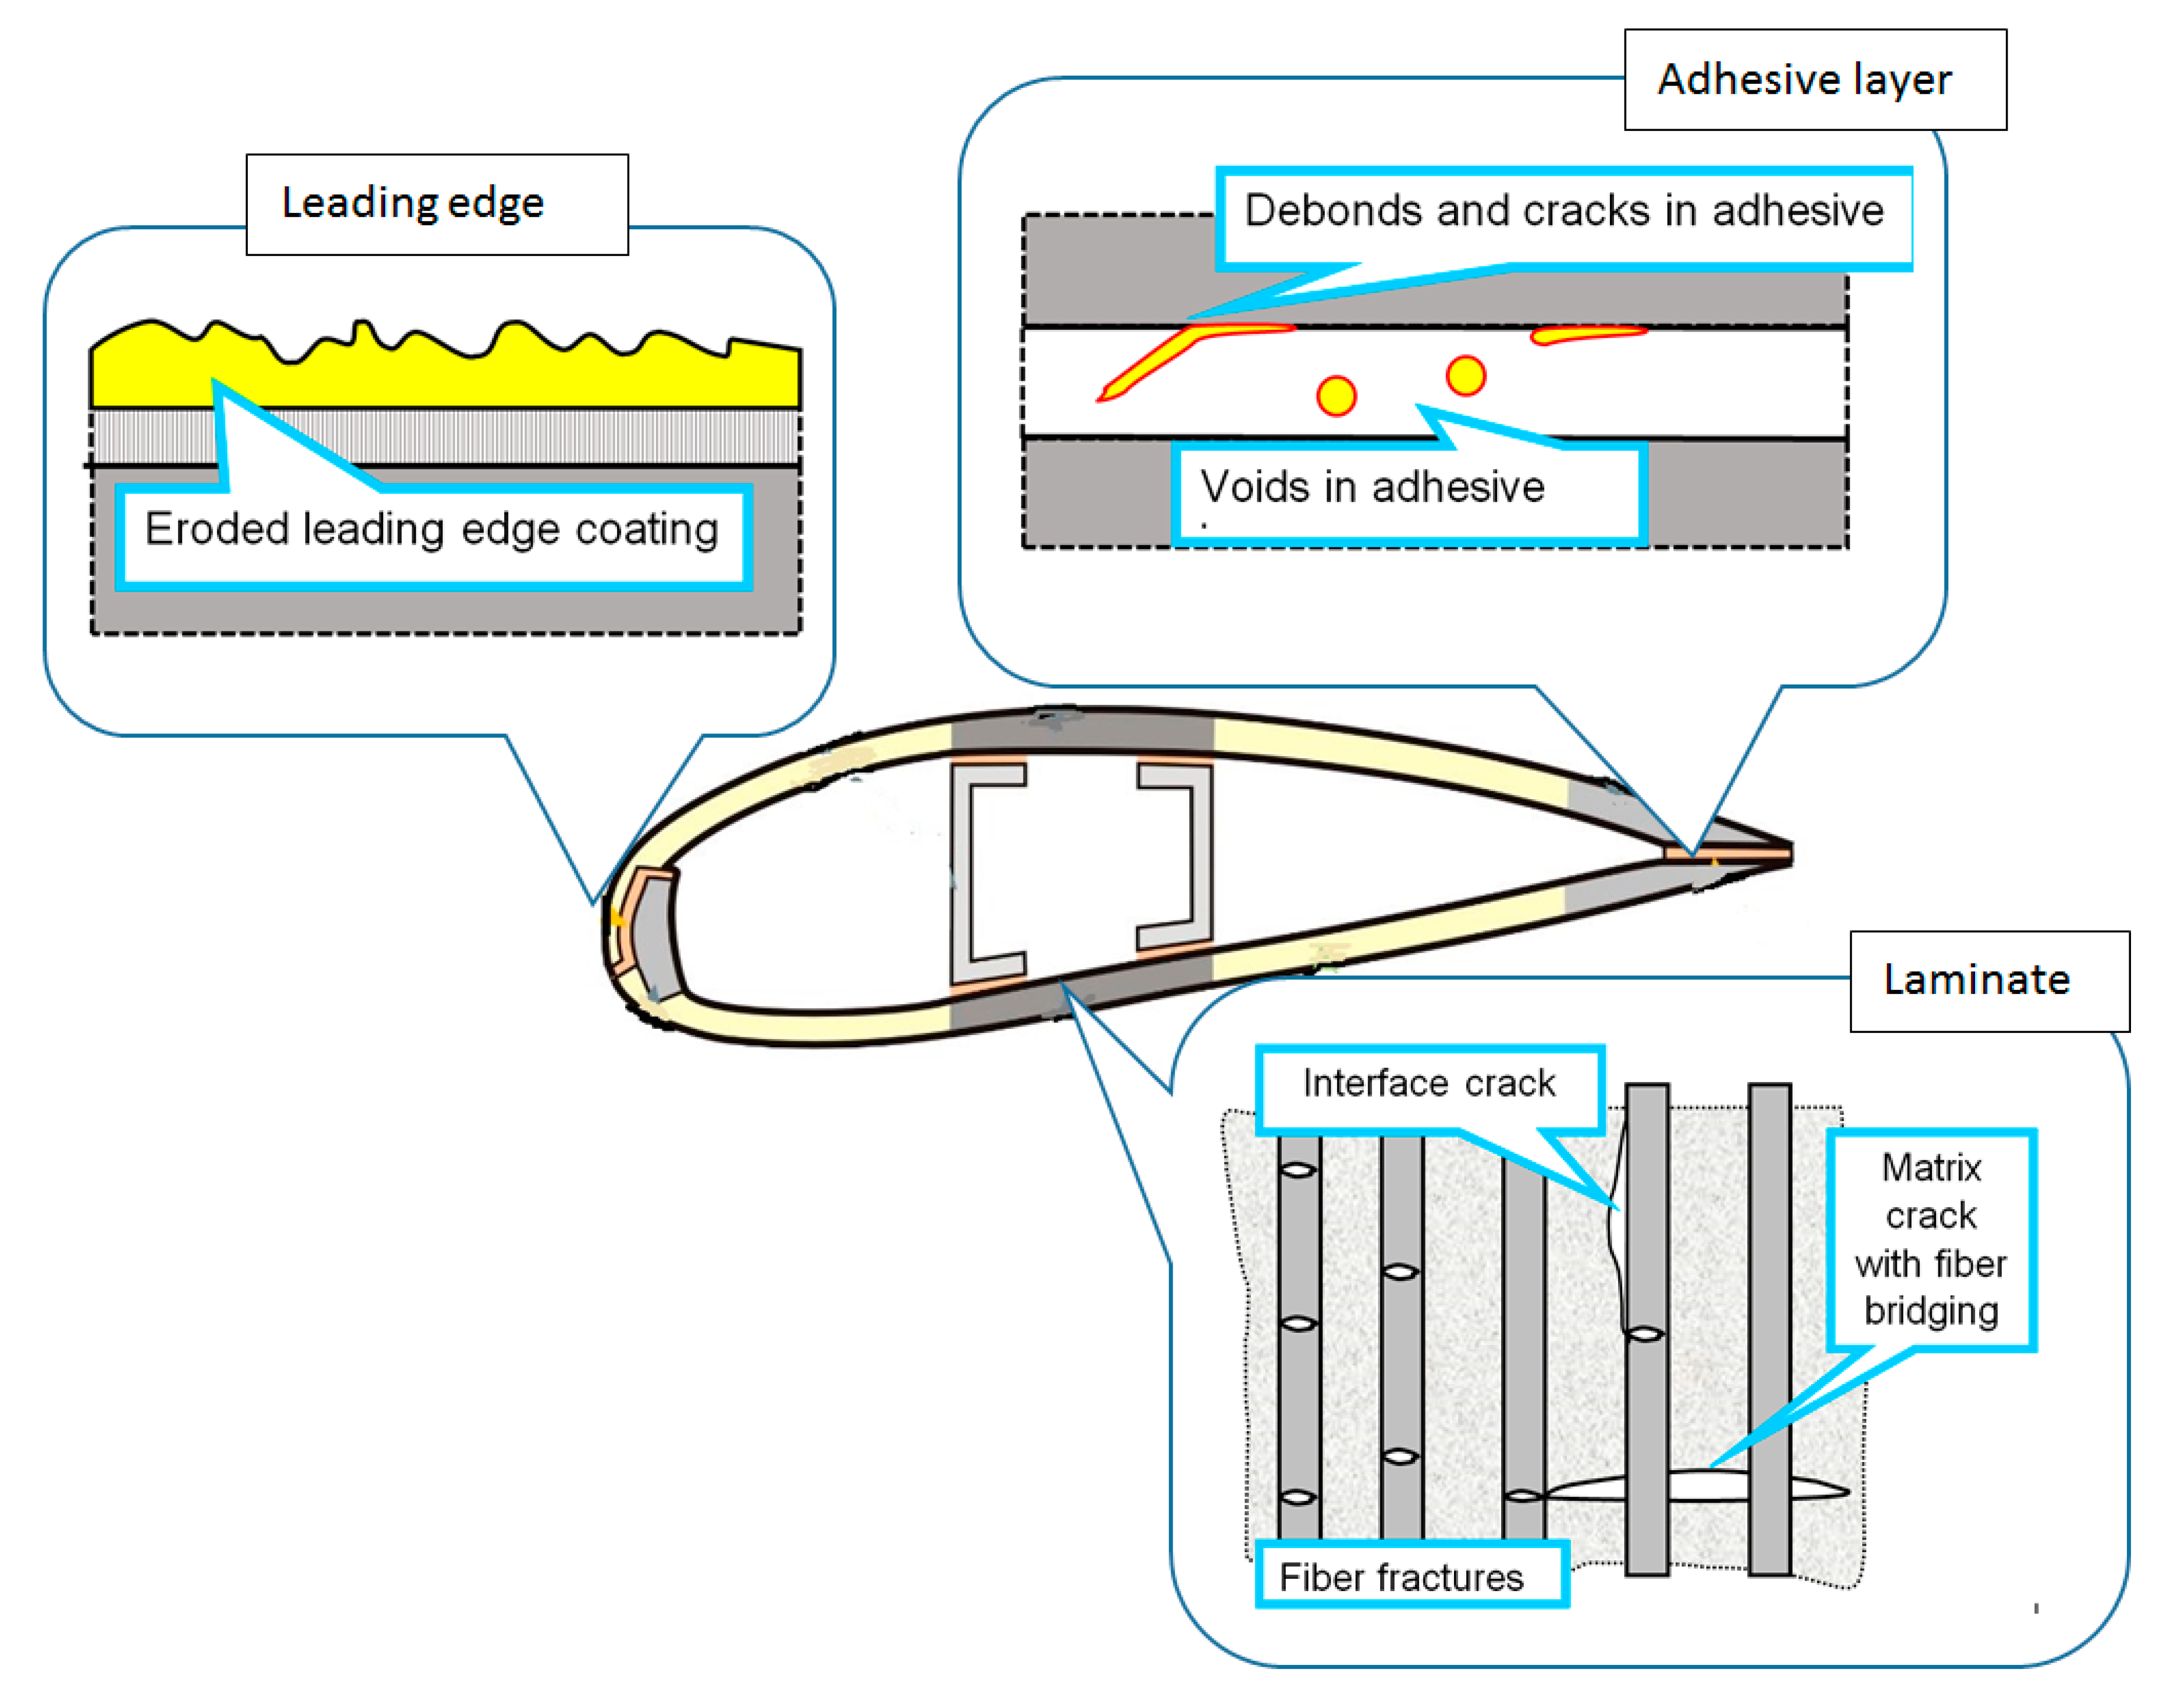
The sensor technology will need to track the condition of these particular defects/imperfections and provide alerts on their response under various operational loadings. Obtaining such information from offshore wind farms will not be straightforward or cheap. Therefore it is the embedded “local” sensor instrumentation that must confirm details about the current state, and inputs for models predicting the future state as some defects begin to initiate precursor damage and grow. The damage observed in different structural zones of the blade is not the same and it follows that the damage protection approach, the repair/mitigation strategy, and the sensor deployments will also be different for each structural zone. The embedded conductive nanoscale sensing particles (CNT and graphene) might allow comprehensive sensing of blade defects in the future, including smallest initial defects, voids, and erosion pits, but these technologies are still at a relatively low technological readiness level (TRL). In order to overcome the limitations of the available sensing methods, it is suggested here to use the mechanism based structural health monitoring approach. This approach assumes the location of sensing elements in the regions of expected damage initiation, and in the form and orientation corresponding to the expected defect configuration. The expected damage type and configuration can be determined in the field studies, and some of expected damage mechanisms are reviewed in Section 3.2. The surface erosion, adhesive fatigue, laminate cracking, and in some cases compressive kinking and failure are among the most often observed mechanisms. Figure 2 shows the examples of the damage mechanisms at structural and microstructural levels.

3.2. Degradation Mechanisms of Wind Turbine Blades

Wind turbines are subject to complex environmental and mechanical loading during their service time, including cyclic deformation and high moisture and temperature variations, but also extraordinary events, like transportation damage, lightning strikes, and bird impact [56,57,58,59,60]. In addition to damage during service, transportation, installation and assembly damage, and manufacturing defects have a strong influence on blade degradation. Failure events of different degrees take place relatively often. With an estimated 700,000 blades in operation globally, there are, on average, 3800 incidents of blade failure each year. Average failure rate of an offshore wind turbine is 8.3 per turbine per year [56].
The main causes of wind turbine blade damage include lightning strikes, environmental wear, rain, sand and contaminants caused erosion, bird impacts, thermal cycling, leading and trailing edge erosion, fatigue, moisture intrusion and foreign object impact, egress of moisture through the laminate skin structure, as a result of the surface damage, and mechanical failure [61,62,63,64,65,66,67,68].
According to [65], the following areas of blades are easily damaged: 30–35% and 70% in chord length from the blade root, root of the blade, maximum chord, and upper spar cap/flange of the spar, but also trailing edge on the high pressure side [9] and on the leading edge.
Li et al. [67] listed the following typical damage scenarios of wind turbine blades: wind of large magnitudes, lightning shock, uneven ice accumulation, manufacturing defects. Chen [68] listed also failure of a control system, failure at the root connection leading to blade throw, extreme load buckling, blade overspeed striking the tower, incorrect design for fatigue loads, crane impact during scheduled maintenance or on-site repair, poor manufacturing quality, and fire.
Sørensen et al. [69] identified different types of damage of wind turbine blades: skin/adhesive debonding (including buckling induced skin/adhesive debonding), adhesive joint failure, sandwich debonding, delamination, splitting along fibers, and cracks in the gelcoat.
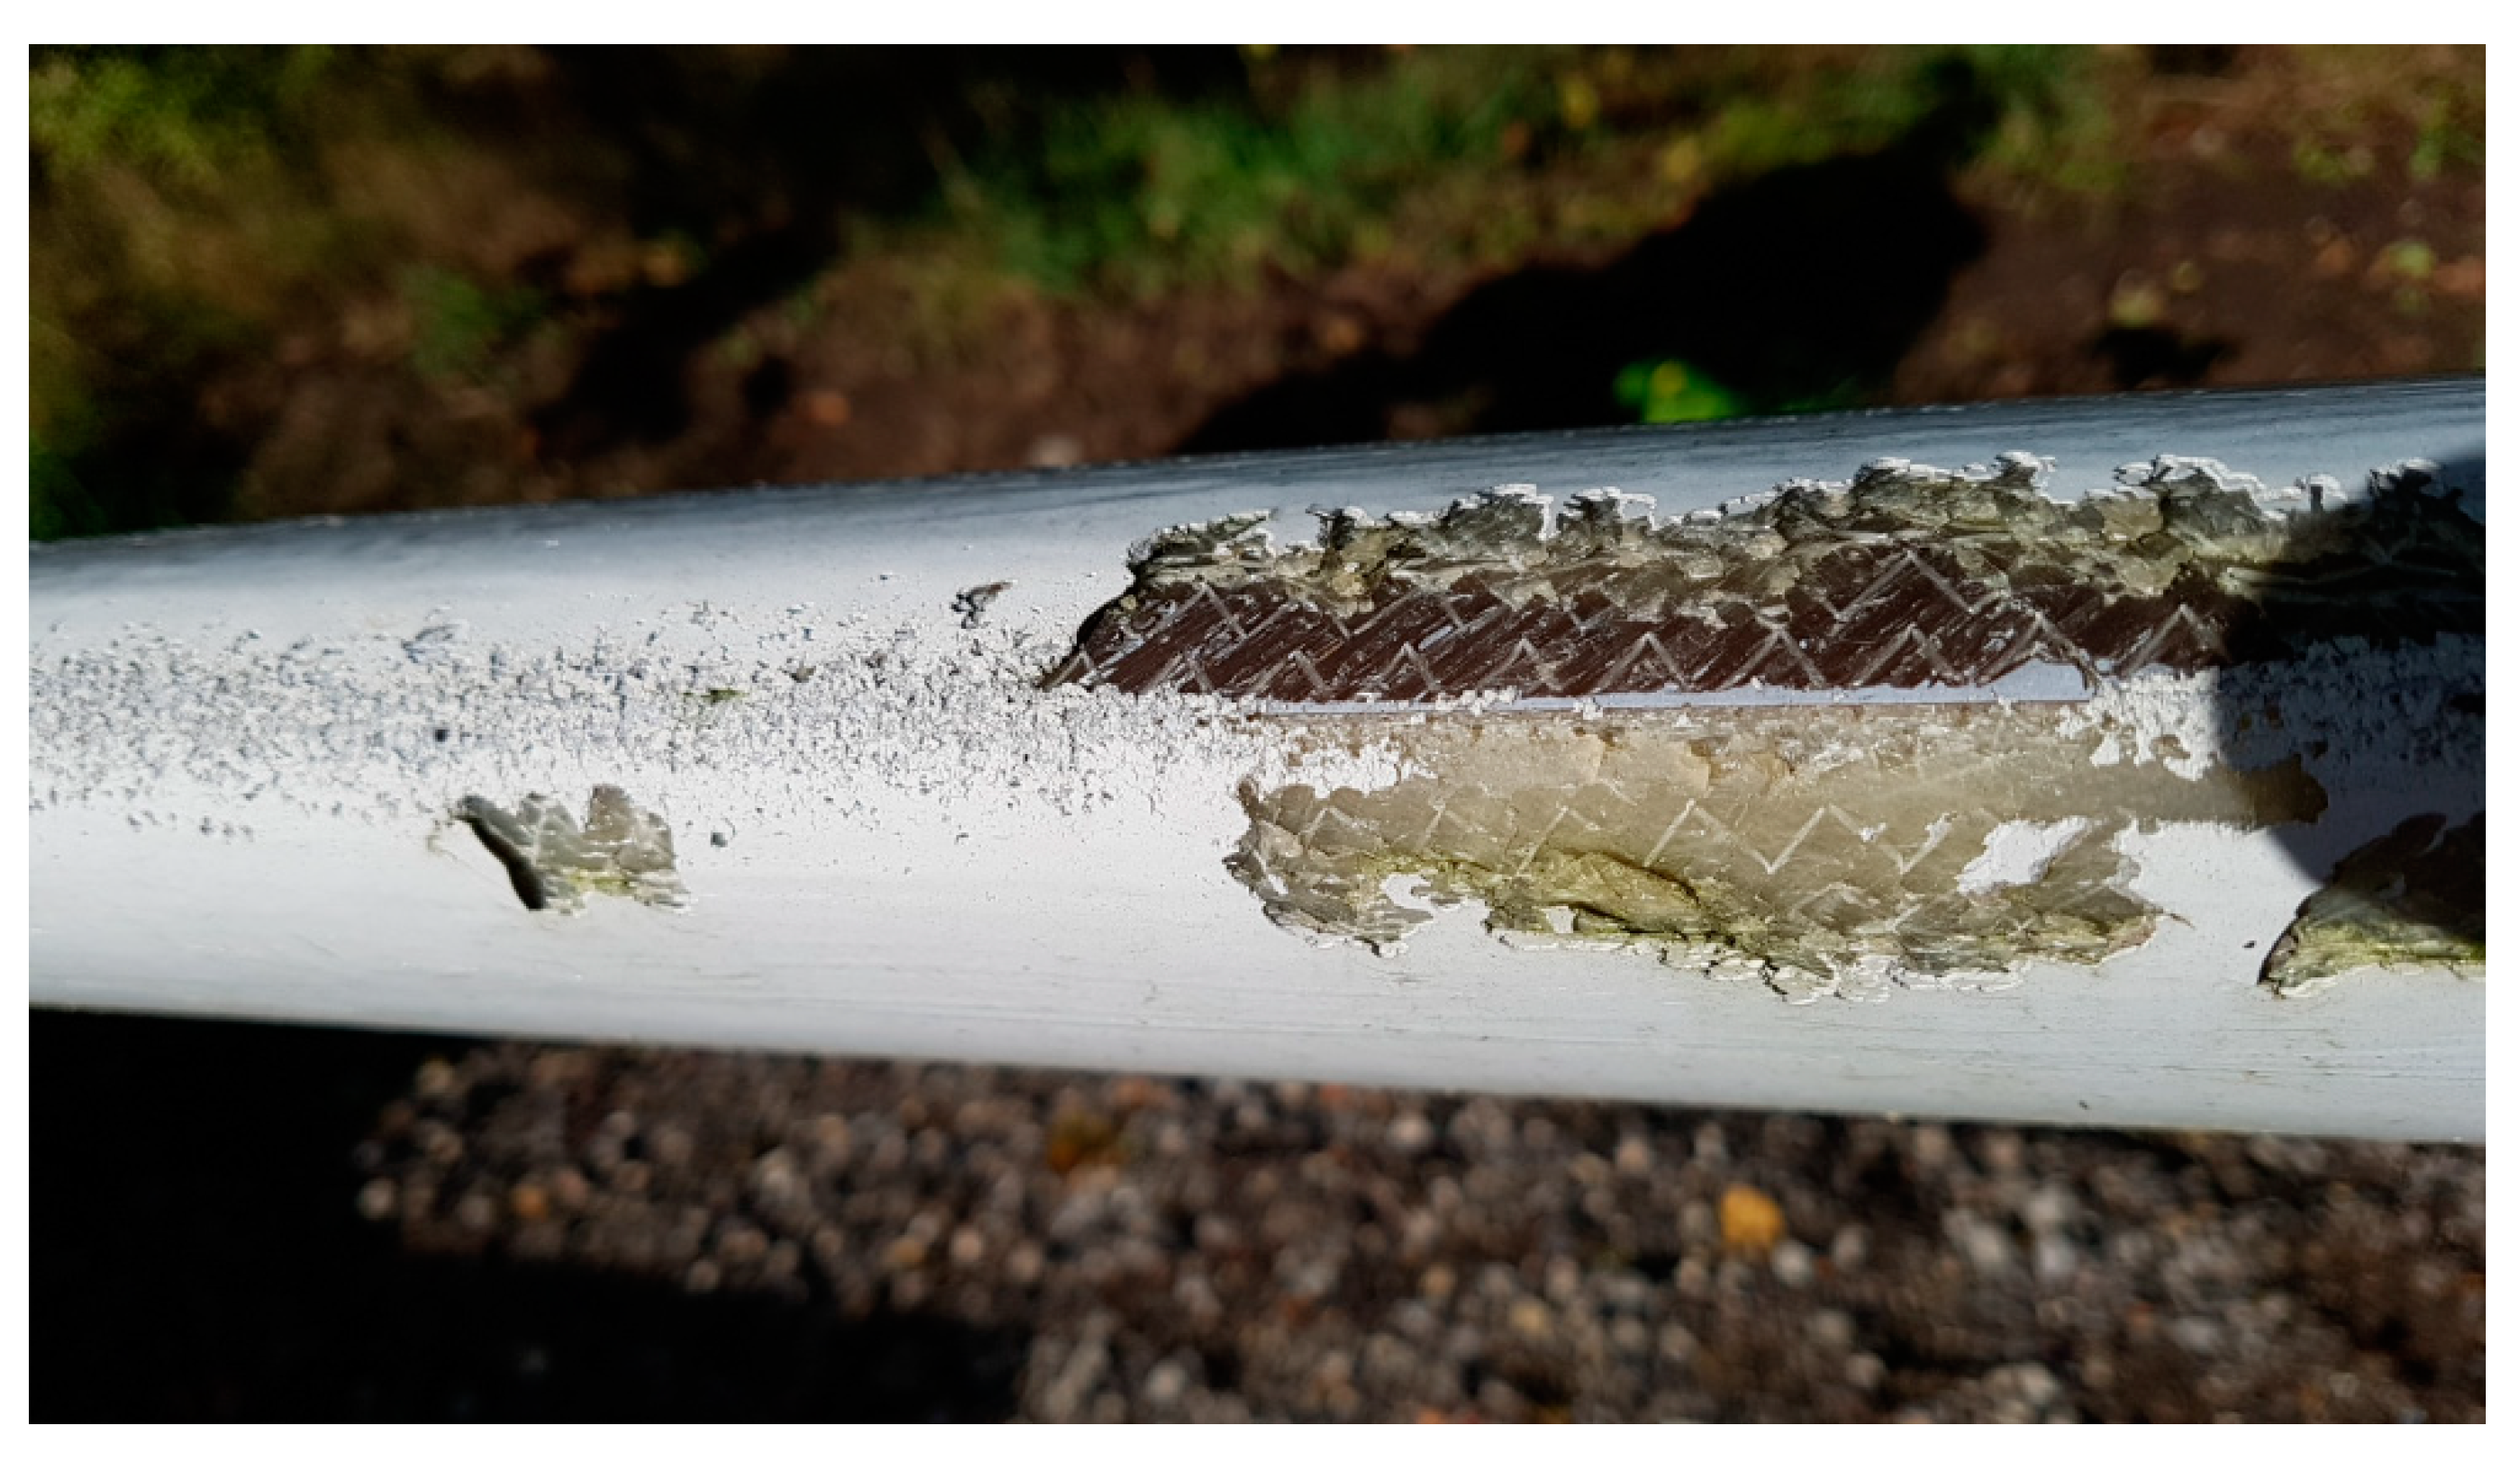
With a view on repair procedures, wind turbine blade damage is classified as: (a) surface erosion, (b) non-structural damage, and delaminations (b) and (c) structural damage, with fiber failure [61,62,70]. The surface erosion is caused by fatigue from repeated rain drop and hail impacts, causing surface microcracks, leading to pits, gouges, delaminations, and surface roughness, which in turn reduces the energy production of the wind turbine [71,72]. The surface roughening has also an effect on the wind turbine noise [73,74]. Eroded blades increase dramatically the noise generation [75]. Figure 3 shows a photo of an eroded blade.
The structural damage can include surface cracks and delaminations (e.g., from impact). For instance, in thick composite parts wrinkles may lead to the formation of compression failure and delamination [76]. Cracks and delamination can also start from processing details such as plydrops that locally causes a stress concentration.
It is of interest to compare frequency of observation of different damage mechanisms. According to data from Caithness Windfarm Information Forum [57], blade failure is the most common cause of wind turbine accidents. There are various data on annual failure rates for rotors and average downtimes per failure: 11 annual failures with an average downtime per failure of 3.2 days based on the Wind Monitor and Evaluation Program(WMEP) database [59] (corresponds to an average downtime of 9 h per year per turbine, and probability 0.10% for each turbine [58]), 0.23 annual failure rate with an average downtime per failure of 11.4 days based on LWK (corresponds to an average downtime of 62 h per year per turbine, and to a probability of 0.71% for each turbine) [58,59]. So, Carol et al. [56] observed that 6.2 minor repairs, 1.1 major repair, and 0.43 major replacements are required on average per turbine per year. Blades are the most flexible component and are easily damaged, this can lead to rotor imbalance, aerodynamic asymmetry, and blade fracture [60]. Blades are the 5th biggest contributor to overall failure, with 6.2% (after the pitch and hydraulic system, auxiliary components, generator, and gearbox) [56]. Blades show 0.456 minor repairs, 0.010 major, and 0.001 major replacements per turbine per year. The minor repairs can be surface erosion or debonding, repaired by protection tapes or shields [61], filling and sealing, and resin injection for small surface cracks, while a major repair is typically a structural repair, for instance, plug/patch and scarf repair [61,62]. In [64], the failure rate of blades is given as 1.116 × 10⁻⁵ per hour (third after tip break and yaw bearings).

4. Demonstration: Monitoring Specific Damage Mechanisms

In this section, several approaches to monitor specific local damage mechanisms suitable for particular wind turbine blade structural zones are discussed, and laboratory (or test hall) measurements demonstrating the principle for detection and assessment of damage is presented.

4.1. Leading Edge Erosion by a Single Point Impact Fatigue Test (SPIFT)

The severe problem of erosion on wind turbine blades can initially be addressed in two ways, and these approaches do not exclude each other. The first approach would be to limit the damage potential of erosion-causing impacts by adjusting the position and operation of turbines in areas with high precipitation (or other aerosol particulates) [77]. This could be done exclusively during the short periods when erosion risk is highest, for example during thunderstorms, hail showers, dust clouds, insect swarms, and so on. A second approach is to enhance the protection level on the leading edge of the blades so longer operation in harsh environments becomes possible [72]. Currently, a number of solutions are used to protect blades again the erosion: one can list protection tapes (from durable, abrasion-resistant polyurethane elastomers), protective coatings, applied with either a brush or casting, epoxy, and polyurethane fillers. The specific solutions available on the market include the ProBlade Collision Barrier by LM Wind Power, KYNAR PVDF-acrylic hybrid emulsion coating by Arkema, 3M polyurethane coatings and W4600, polyurethane tape by Bergolin, Duromar, Enercon two component polyurethane coating system, Belzona 1331 and Belzona 1381, ELLE (Ever Lasting Leading Edge), soft shell developed and marketed by Poly Tech, and durable cover Blaid Protective Sheet, produced by IER Fujikura.
Any monitoring system implemented on the leading edge section of a wind turbine blade should, at a minimum, give details about the current impact loading level for that particular structure and confirm continued effective performance of the added protective layers.
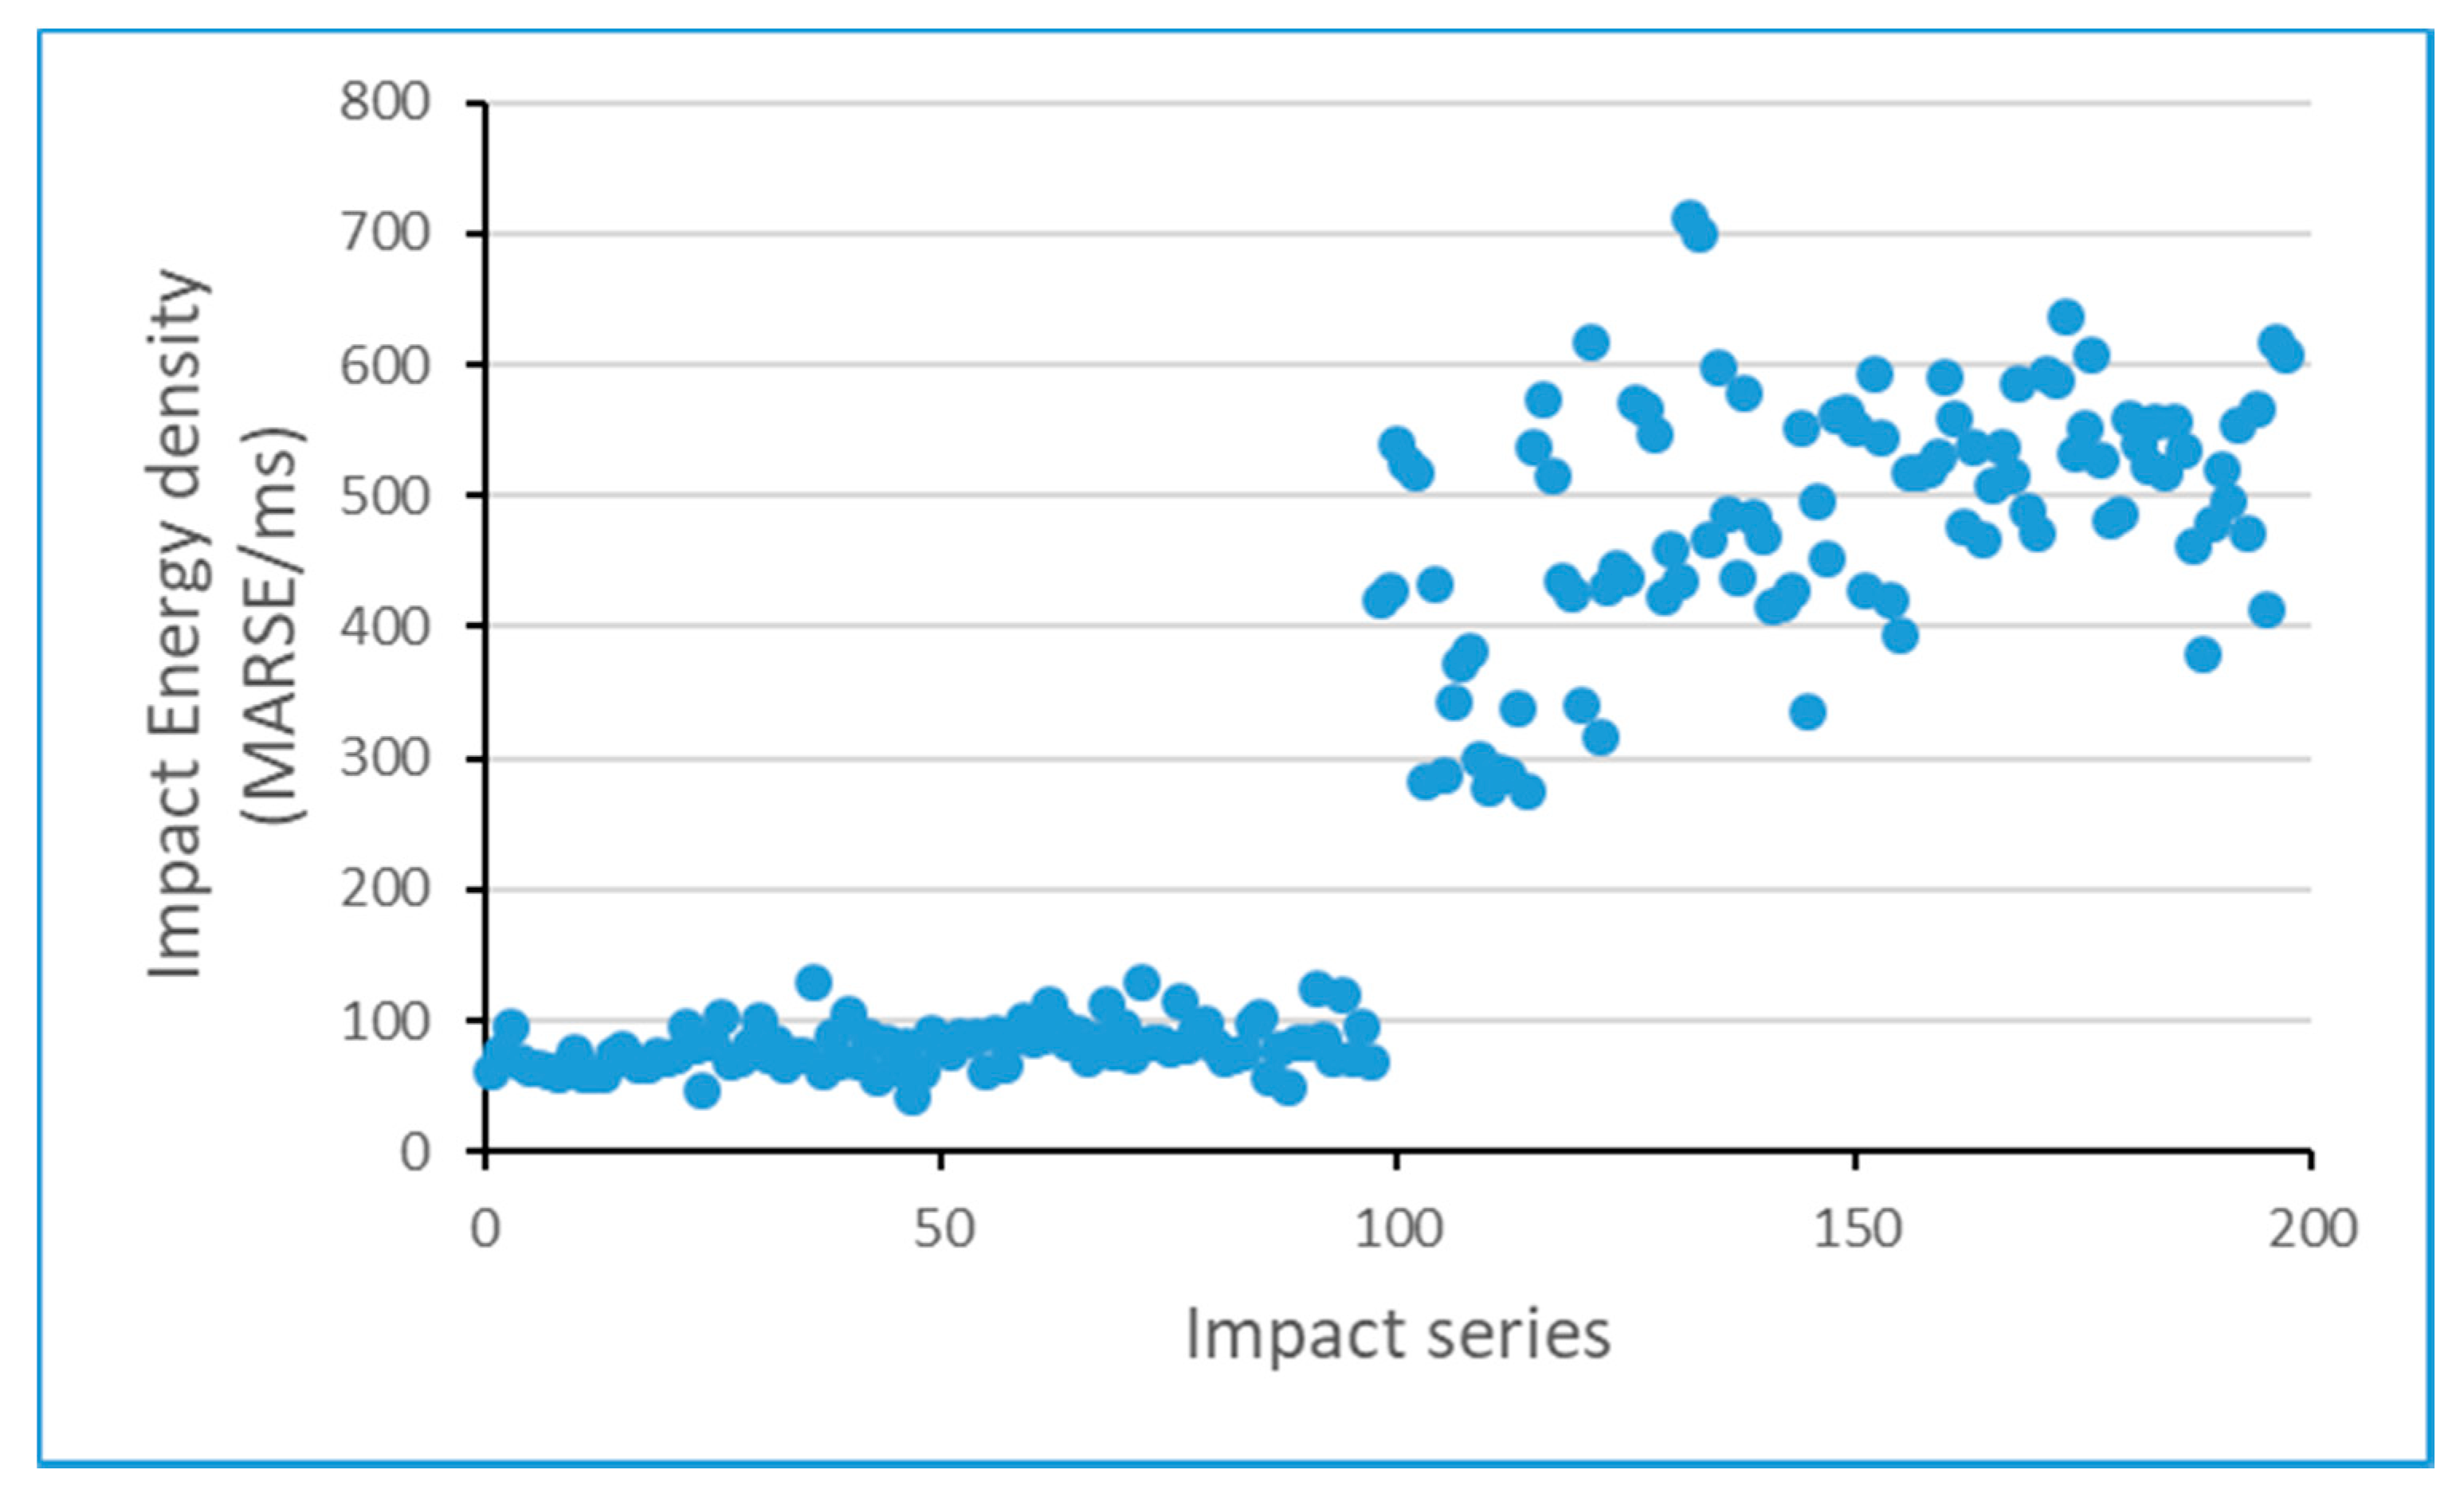
In order to conduct more controlled investigations into the effect of a repeated series of single point impacts on typical wind turbine blade laminates and different protection strategies, a team at DTU Wind Energy developed a new test approach, called single point impact fatigue tester (SPIFT) [78]. This approach included a stress wave measurement for every impact to highlight any changes in the protective layer effectiveness and damage accumulation in the underlying laminate. Acoustic emission (AE) sensors were attached to the SPIFT specimen (reverse side of the coated laminate) and allowed to register the stress wave response resulting from each individual impact event. By comparing changes in the extracted AE waveform features, an impact characterization was used. A correspondence between the type and velocity of the impact pellet and the response of the stress wave sensor, indicating that the energy loading into a particular test specimen configuration could be confirmed by sensor output [78]. Furthermore, when the SPIFT was run until failure of the leading edge protection, this caused a sharp change in the stress wave sensor response being returned.
Figure 4 shows a typical output reading with each point corresponding to a single pellet impact. The y-axis shows a value corresponding to the energy density index for each impact, being calculated from the area under the stress waveform (MARSE—measure of the area under the envelope of the rectified linear voltage time signal) detected by the sensor in the underlying laminate divided by the duration of that waveform (in milliseconds). The change in this value indicates the point at which local failure of the leading edge protection capability at the impact point occurs.
Thus, this preliminary test demonstrated the possibility to monitor the damage and impact of coatings on the blades.

4.2. Interface Crack Opening and Interface Crack Progression

Many wind turbine blade designs require significant volumes of adhesive, in the “spar-line” between the spar cap or shear web and the shell of the blade, and in the “mold-line” between the two halves of the blade shell. In either case the presence of voids in these bondlines and thickness variations and cure stresses is considered ubiquitous and has long been an area studied to determine the severity and criticality of potential defects on the performance (particularly the fatigue performance) of the structure.
Removing the possibility of all defects from occurring during the manufacturing process is not an economic proposition for blade manufacturers. In any case, not all defects result in problems within the lifetime of the blade. Therefore, the focus of research has always been on understanding the mechanisms by which particular defects can initiate damage that will propagate within the strain field of an operating structure. Hence resistance to fracture is a critical property and ideally the bonding technology design should demonstrate increasing resistance as the damage gets bigger, effectively “pinning” damage that initiates at one location (perhaps in connection with an unfortunately located defect) from ever growing to a size that compromises the operation of the structure.
Material properties that control damage propagation can be investigated in the laboratory in order to provide tools for designers to incorporate damage tolerance effects into the operating life cycle of the structures. A key consideration here is that monitoring systems should detect not just the presence of damage as usual, but additionally confirm that the damage tolerance mechanisms intended by the design are in effect. Bondline or interlaminar crack opening tests show variations in the resistance to damage growth due to a variety of material and morphological factors. One key factor is the presence or absence of reinforcing fibers linking the two separating faces. In a “clean” crack along an adhesive interface, the resistance to propagation is primarily found at the crack tip, in a crack with many hundreds of fibers linking the two separating faces, a “cohesive zone” behind the crack tip contributes hugely to resisting crack propagation. A damage tolerance design that depended on extensive fiber bridging to prevent damage growing would need to confirm the presence of this cohesive zone behind the crack front.
In mechanical test laboratories, the performance of various material and design combinations in crack opening tests can be assessed with dual cantilever beam (DCB) specimens. Acoustic emission sensors on these tests can measure details of the microseismology associated with the crack propagation [79].
DCB specimens with fully developed bridging zones have a higher resistance to crack growth, and the AE emitted consists entirely of microscale deformation events from all along the cohesive zone. The waveforms resulting from the detection of these events are very similar. However, if the crack propagation also includes pure resin crack failure then that AE activity will have very different waveform characteristics. A macroscale propagation event taking place during crack growth would generate an AE hit that “violated” the template of expected activity for a fully-bridged, high crack-resistance test [79,80].
In a series of nominally identical DCB specimens tested, a range of crack energy (JR) values were returned [79]. The data are shown in Table 1. Studying the AE output for each test, it could be seen that the two specimens with the highest JR values (Specimens A and D) had AE hit waveform characteristics that all fell within a tight range. Rise time under 1400 us, less than 600 counts (threshold crossings), MARSE energy under 90, and total duration under 2400 us. Using these four values as a “safe zone” template for a good crack resistance test, the AE activity from the other specimens can be compared against this template to see if their lower JR results are reflected in an altered AE microseismology.
The high crack resistance specimens (A and D) provide the template for the AE analysis, and as shown in Table 1, the deviation from this template (violation of one or more parameter threshold) in the AE activity from the other specimens seems to match their lower level of resistance to crack propagation. Such analysis of multivariate data is more usually done automatically and in greater detail by machine learning algorithms, either using a preset template for the waveform characteristics, or via self-learning.

4.3. Plydrop Delamination Propagation Rate during Tensile Testing

Wind turbine blade laminate thickness varies from root to tip. This reduction along the length of the lay-up is achieved by including “plydrops”, where one of the laminate layers is simply terminated thus reducing the total number of layers in the stack. An efficient plydrop design can help to reduce the effect [81], however this material and geometrical discontinuity is an inevitable source of stress concentration. Any delamination initiating at a plydrop discontinuity is a potentially critical damage. Early warning of this occurring during operation (both when and where), and any details about the progression rate under different load levels, will be valuable when planning the correct mitigation approach and scheduling a repair before the damage extent becomes too great.
Static plydrop test: A series of glass composite tensile test specimens that included several plydrops along their length were loaded in order to grow delaminations initiating from the first plydrop [82]. Acoustic emission sensors were used to detect the precursor failure at the end of each plydrop present in the gauge length, followed by growth of a delamination from the first (and deepest) plydrop along the length of the test specimen. The delamination growth was promoted using both static and dynamic loading regimes.
Figure 5 shows the specimen with four open plydrops on one surface and AE sensors (S1 and S2) at either end to detect and localize activity when the delamination initiates and propagates along the laminate interface from the first plydrop.
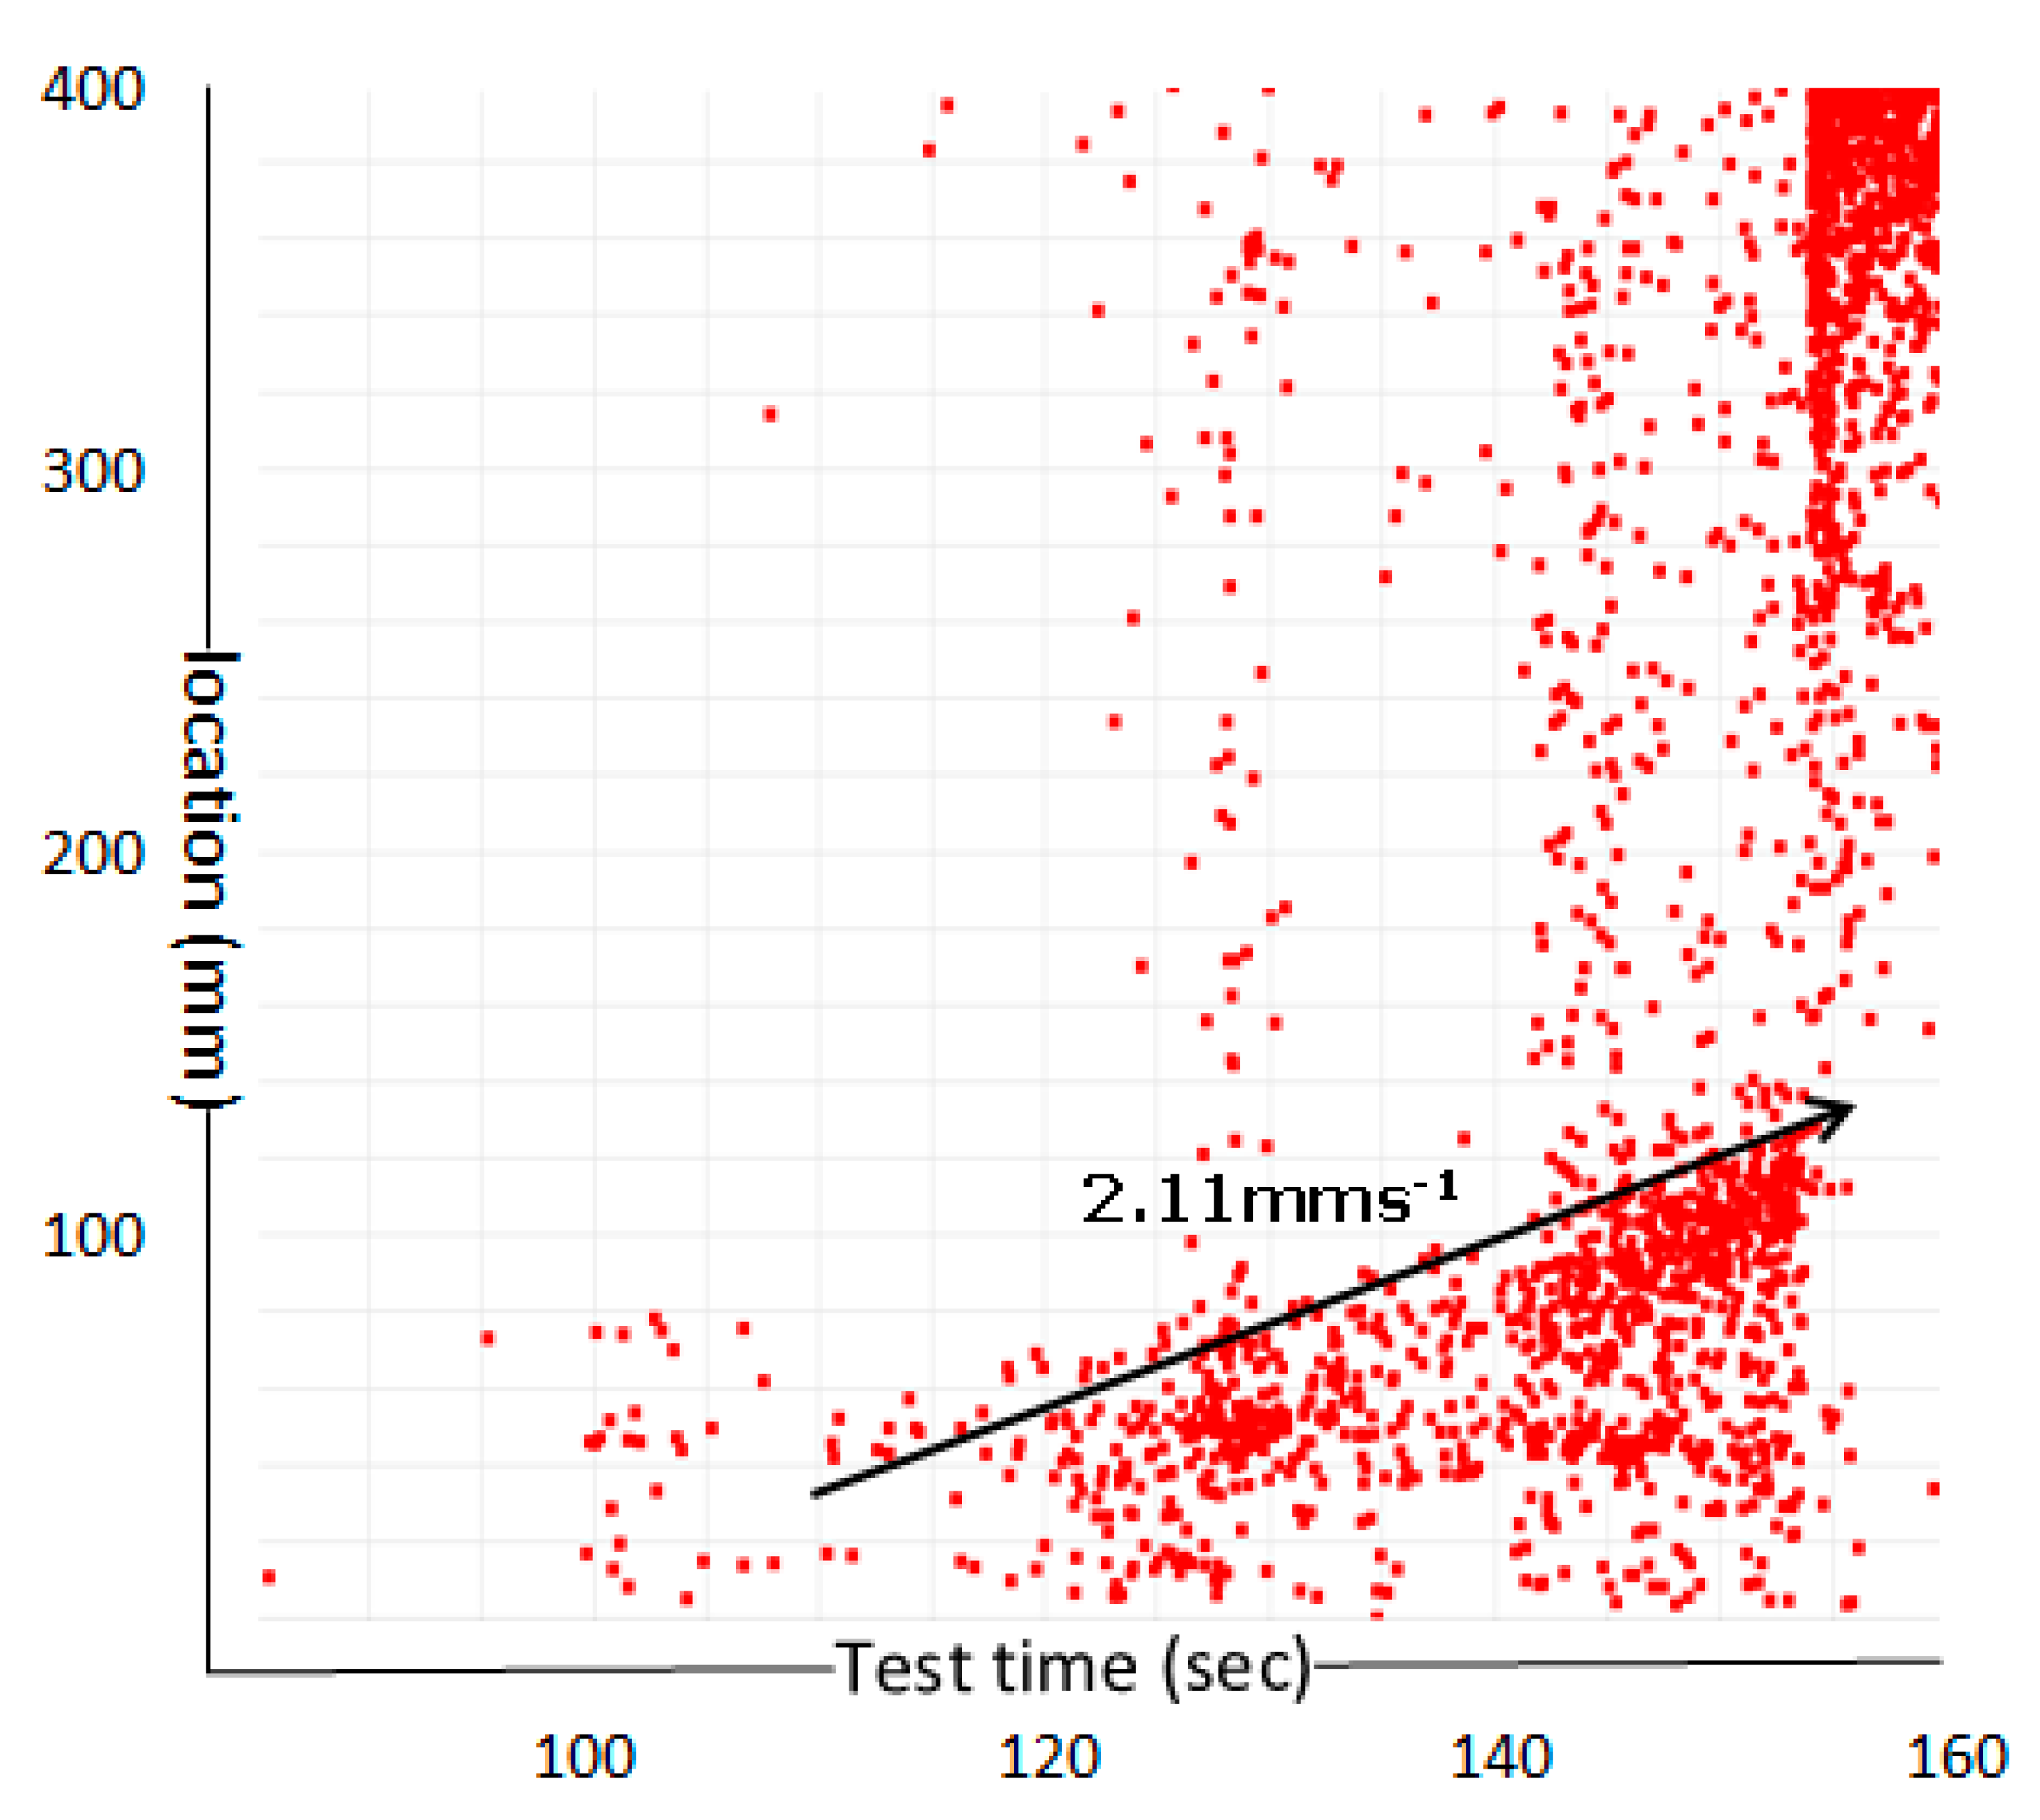
Figure 6 shows the localization output from the AE linear array during static load to failure. The vertical axis is the distance between the top and bottom sensors, and the horizontal axis shows test time. After initiating damage at the first two plydrops near the bottom of the specimen, the delamination propagated linearly until it approached the third plydrop at which point it became unstable and propagated rapidly. From the linear portion of the data, these measurements provided confirmation of the propagation rate as the crack front moves along the specimen, in this case 2.11 mms−1.
Dynamic plydrop test: An identical plydrop tensile test specimen was dynamically loaded (at 3 Hz) to observe progression of the initiated plydrop delamination under fatigue. Dynamic loading of the specimen increased the “noise level” in the test and it was therefore necessary to add guard sensors (S1 and S2) near the grips, and an extra sensor along the linear array (S3, S4, and S5) in order to extract the localization information that was so easily achieved with two sensors under static loading. This sensor array is shown in Figure 7.
The test took place over two days and the localization distribution from both days is shown in Figure 8 with the linear array along the length of the test specimen in the y-axis, and test time along the x-axis.
During the first phase of the fatigue loading, the delamination under the deepest plydrop was not yet initiated, but once in place it propagated at a consistent rate that was continued on the second day. The propagation rate for the delamination could be read from the AE localization output. In both days of testing the rate averaged to 0.012 mms−1 (4.3 cm every hour) or approximately 4 mm for every 1000 load cycles.

4.4. Root Bolt Failure

The circular root of a wind turbine blade is bolted to the hub. From here the round root shape must transition into the first aerofoil profile along the length of the blade. This transitional section carries the highest loads and must survive millions of cycles during the structures service life. Root bolt design is competitive, with subsuppliers looking to provide a robust solution with reduced assembly line times. Segmented blade design mean added focus on this area is likely in the future. The failure of a single bolt in the assembly due to fatigue failure in the metal component, or via adhesive failure in the attachment design, is a concern for any wind turbine blade. In such an event it is desirable to obtain immediate warning of its occurrence, plus information about the result of the failure on the structural behavior of the blade and turbine.
In a high flap displacement dynamic blade test, the blade had been instrumented with various sensors in order to detect changes resulting from the propagation of a deliberately induced damage. However, on the day in question, the extreme flap load regime being applied to the blade resulted instead in a failure of the root bolt assembly. Failure at the root meant the blade was free to move slightly at its attachment point to the test block. This compliance allowed the blade to “move away” from the induced displacements of the loading saddle. Although sensor distribution on the test blade was focused around the induced damage site, it was possible to read the immediate event of bolt assembly failure, plus a change in the trend of the response data that followed development of the root attachment compliance.
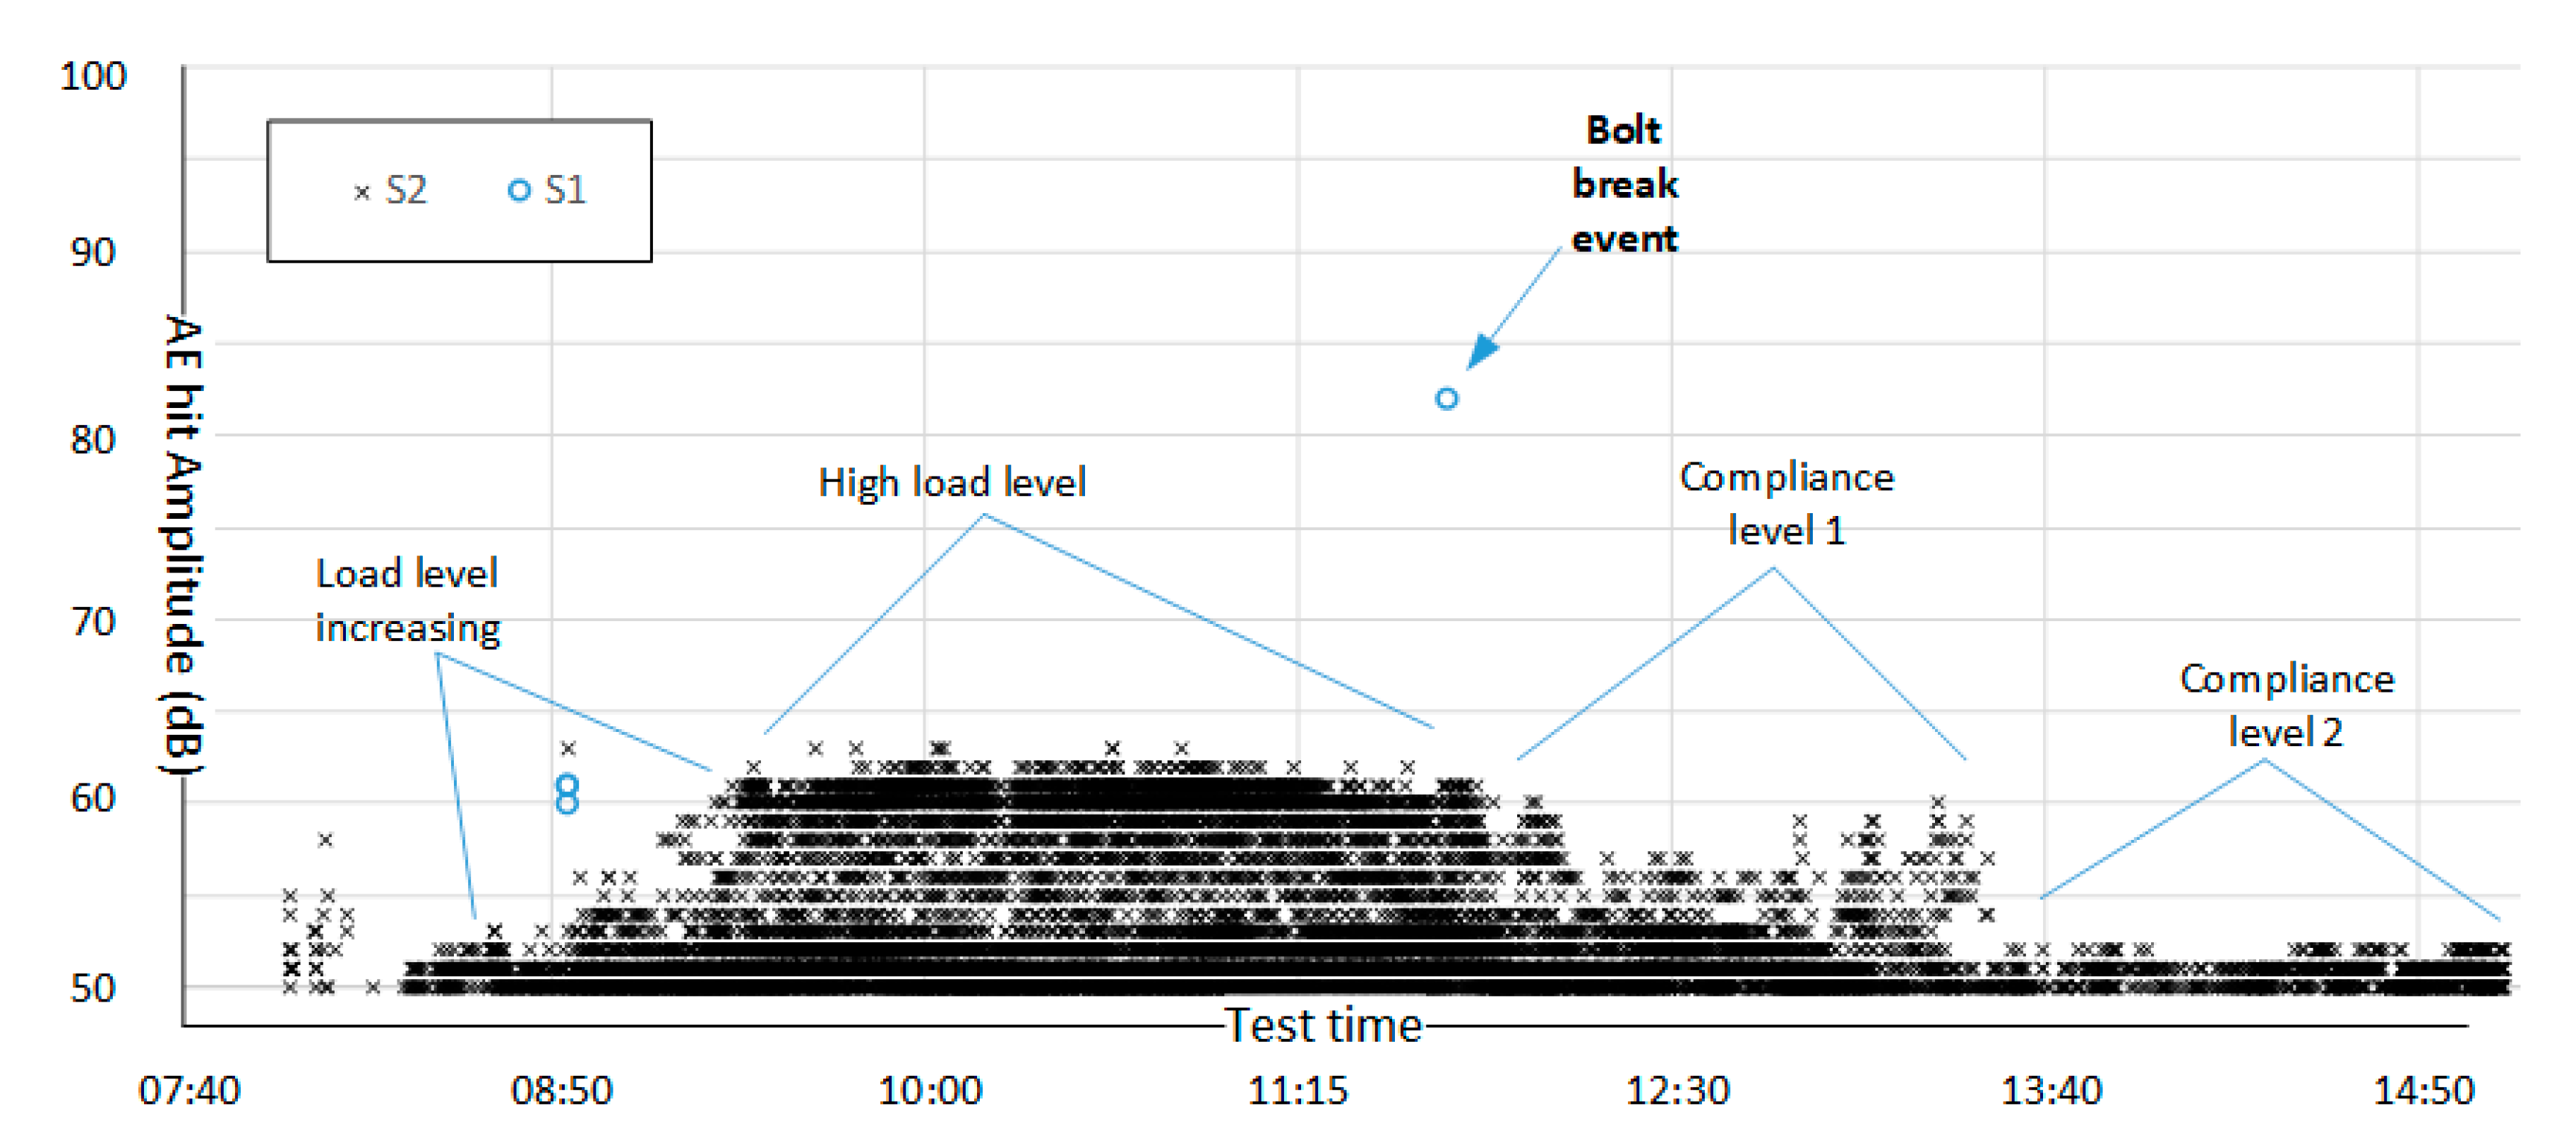
Figure 9 shows AE activity from two sensors for the entire day of blade testing with the amplitude of each detected hit on the x axis and time of day along the y axis. Sensor 1 (S1-O) was mounted near the root, Sensor 2 (S2-x) was mounted on the loading spar at a high bending moment radius of the blade.
Details about the testing for the duration of the day are reflected in the acoustic emission sensor output shown. At around 0800 on December 2nd, the blade was being prepared for the days testing. At about 0830 dynamic loading began; low magnitude to begin with but increasing gradually until the high levels intended to propagate the induced damage were achieved. By 0930 the high load level target was reached and the loading saddle displacements being applied to the blade in order to achieve this were maintained for the rest of the day.
At 1145 the bolt failure event occurred and was detected by the S1 sensor closest to the root; sensor 1 was almost entirely silent during the test up until this point. This AE hit detected by S1 was the single highest amplitude and highest energy hit of the day.
Shortly after this, the AE profile of the active S2 sensor began to change with lower amplitude activity being detected. This is due to compliance in the system as a result of the bolt failure at the root attachment to the loading block. At about 1330 the amplitude profile from S2 drops further as a more extensive compliance effect began.
One often highlighted drawback of passive AE monitoring for operational structures is the volume of data generated if all characteristics of every hit detected is to be recorded in order to permit a detailed analysis. However, as Figure 10 shows, even when the system only supplies a compiled report every 15 min (suitable for integration with SCADA) the occurrence of a unique event at the root section (S1) and a measure of the change in the structural behavior (S2) resulting can be flagged by automated surveillance programs.

4.5. Bulk Material Fatigue

Thick laminate layers of predominately unidirectional reinforcement material forms the bulk of the main load carrying spar components in wind turbine blades. In operation, these highly loaded sections of the structure must survive a 20–30 year lifetime consisting of 108 to 109 fatigue cycles and a wide range of load ratios.
The large completed blade structures cannot be tested to such an extent, and so the load carrying material is tested as coupons using accelerated damage accumulation that can be carried out in test laboratories all over the world. In this way a database of fatigue properties for particular resin/reinforcement combinations at different load severity can be generated and is often presented as a curve (S–N curve) showing applied stress in the material against the number of cycles to failure. Using this information a design damage equivalent can be generated using the liner damage rules of Palmgren-Miner.
Although an effective solution, there are significant potential uncertainties associated with this process. One of these is due to deviation in material properties between the bulk laminate blade material and the coupons being tested to determine fatigue performance. Every laboratory that runs polymer composite fatigue tests regularly will find some coupons that deviate from the expected performance due to minor defects in the manufactured material initiating coupon failure early in the damage accumulation process. This requires extra testing of coupons along the generated S–N curve in order to isolate the exception behavior. Additionally, this real variability in behavior feeds into (conservative) design decisions to ensure safety in the final structure, as the possibility of a local material defect is acknowledged.
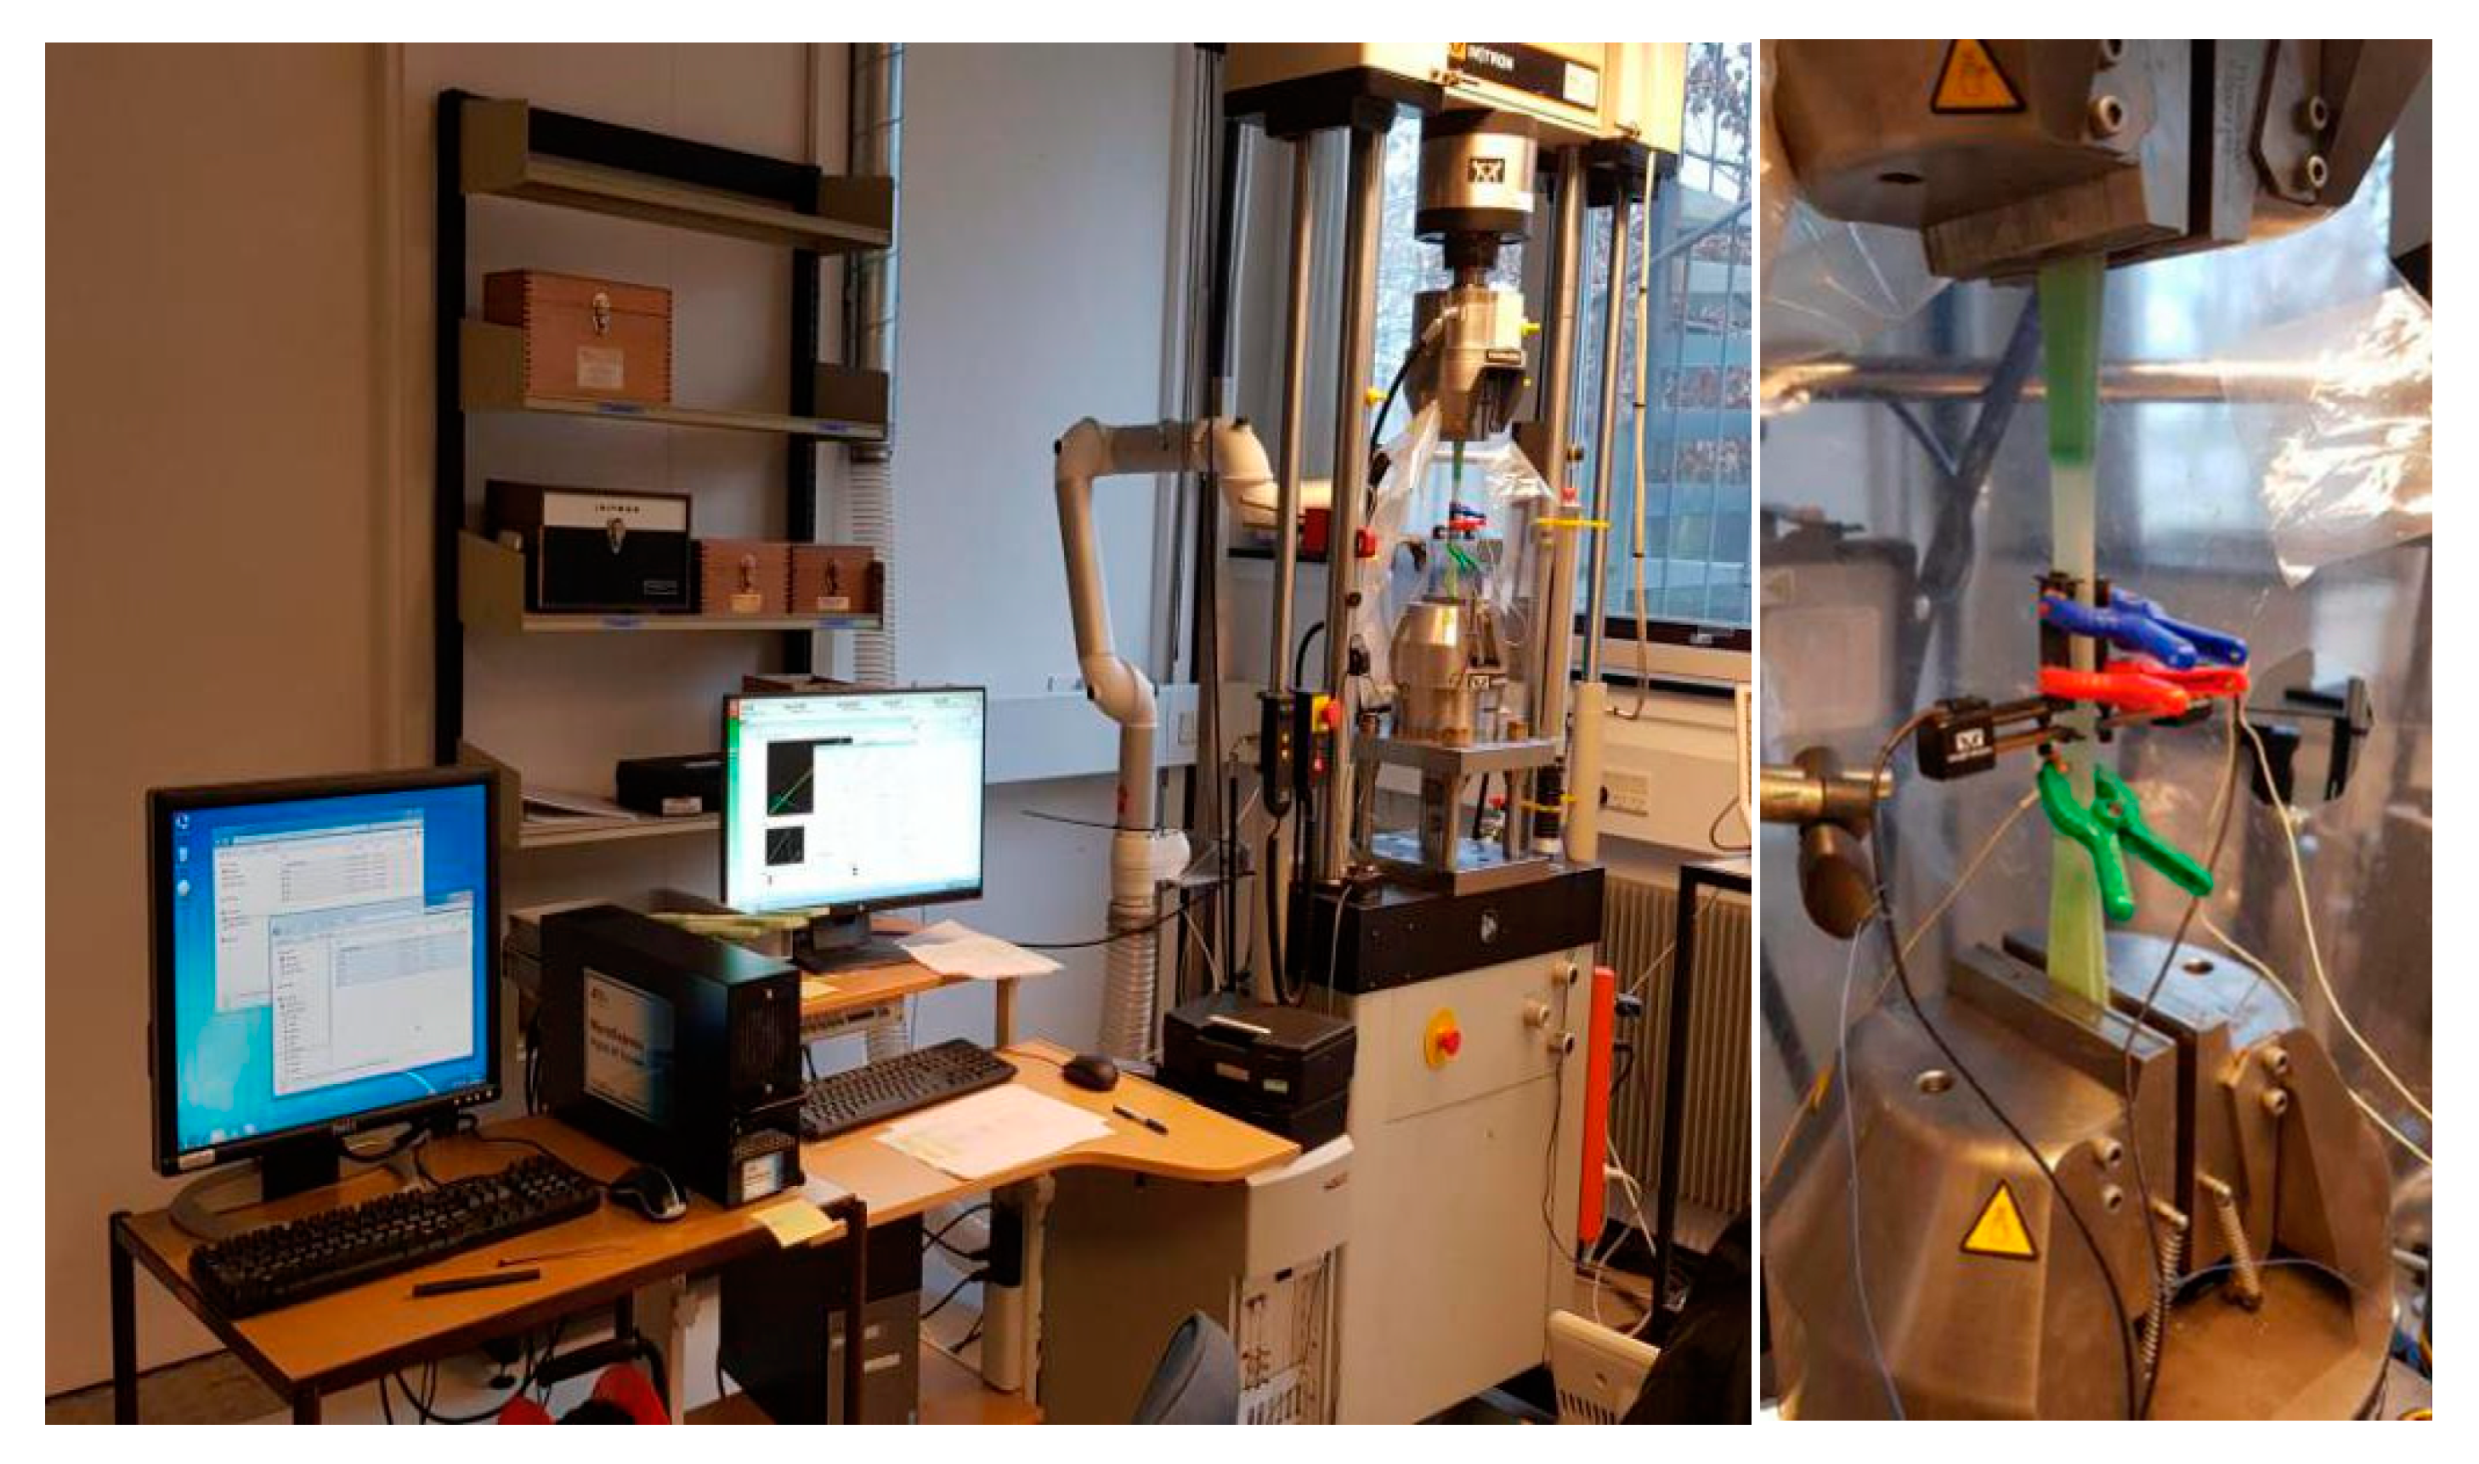
For example, the material properties of the chosen blade laminate are investigated by coupon testing. Part of this includes tensile fatigue testing (5 Hz) at various load levels to establish the number of cycles to failure; the general test set up is shown in Figure 11. Identical specimens A, B, C, and D are tested at a peak strain percentage of 1%, 0.95%, 0.90%, and 0.87% respectively. The expectation being that the higher strain levels applied will result in a lower number of cycles to failure. However as can be seen in Table 2, this hoped for progression was not achieved and resulted in more extensive testing around these strain levels being necessary in order to establish confidence in the general material performance.
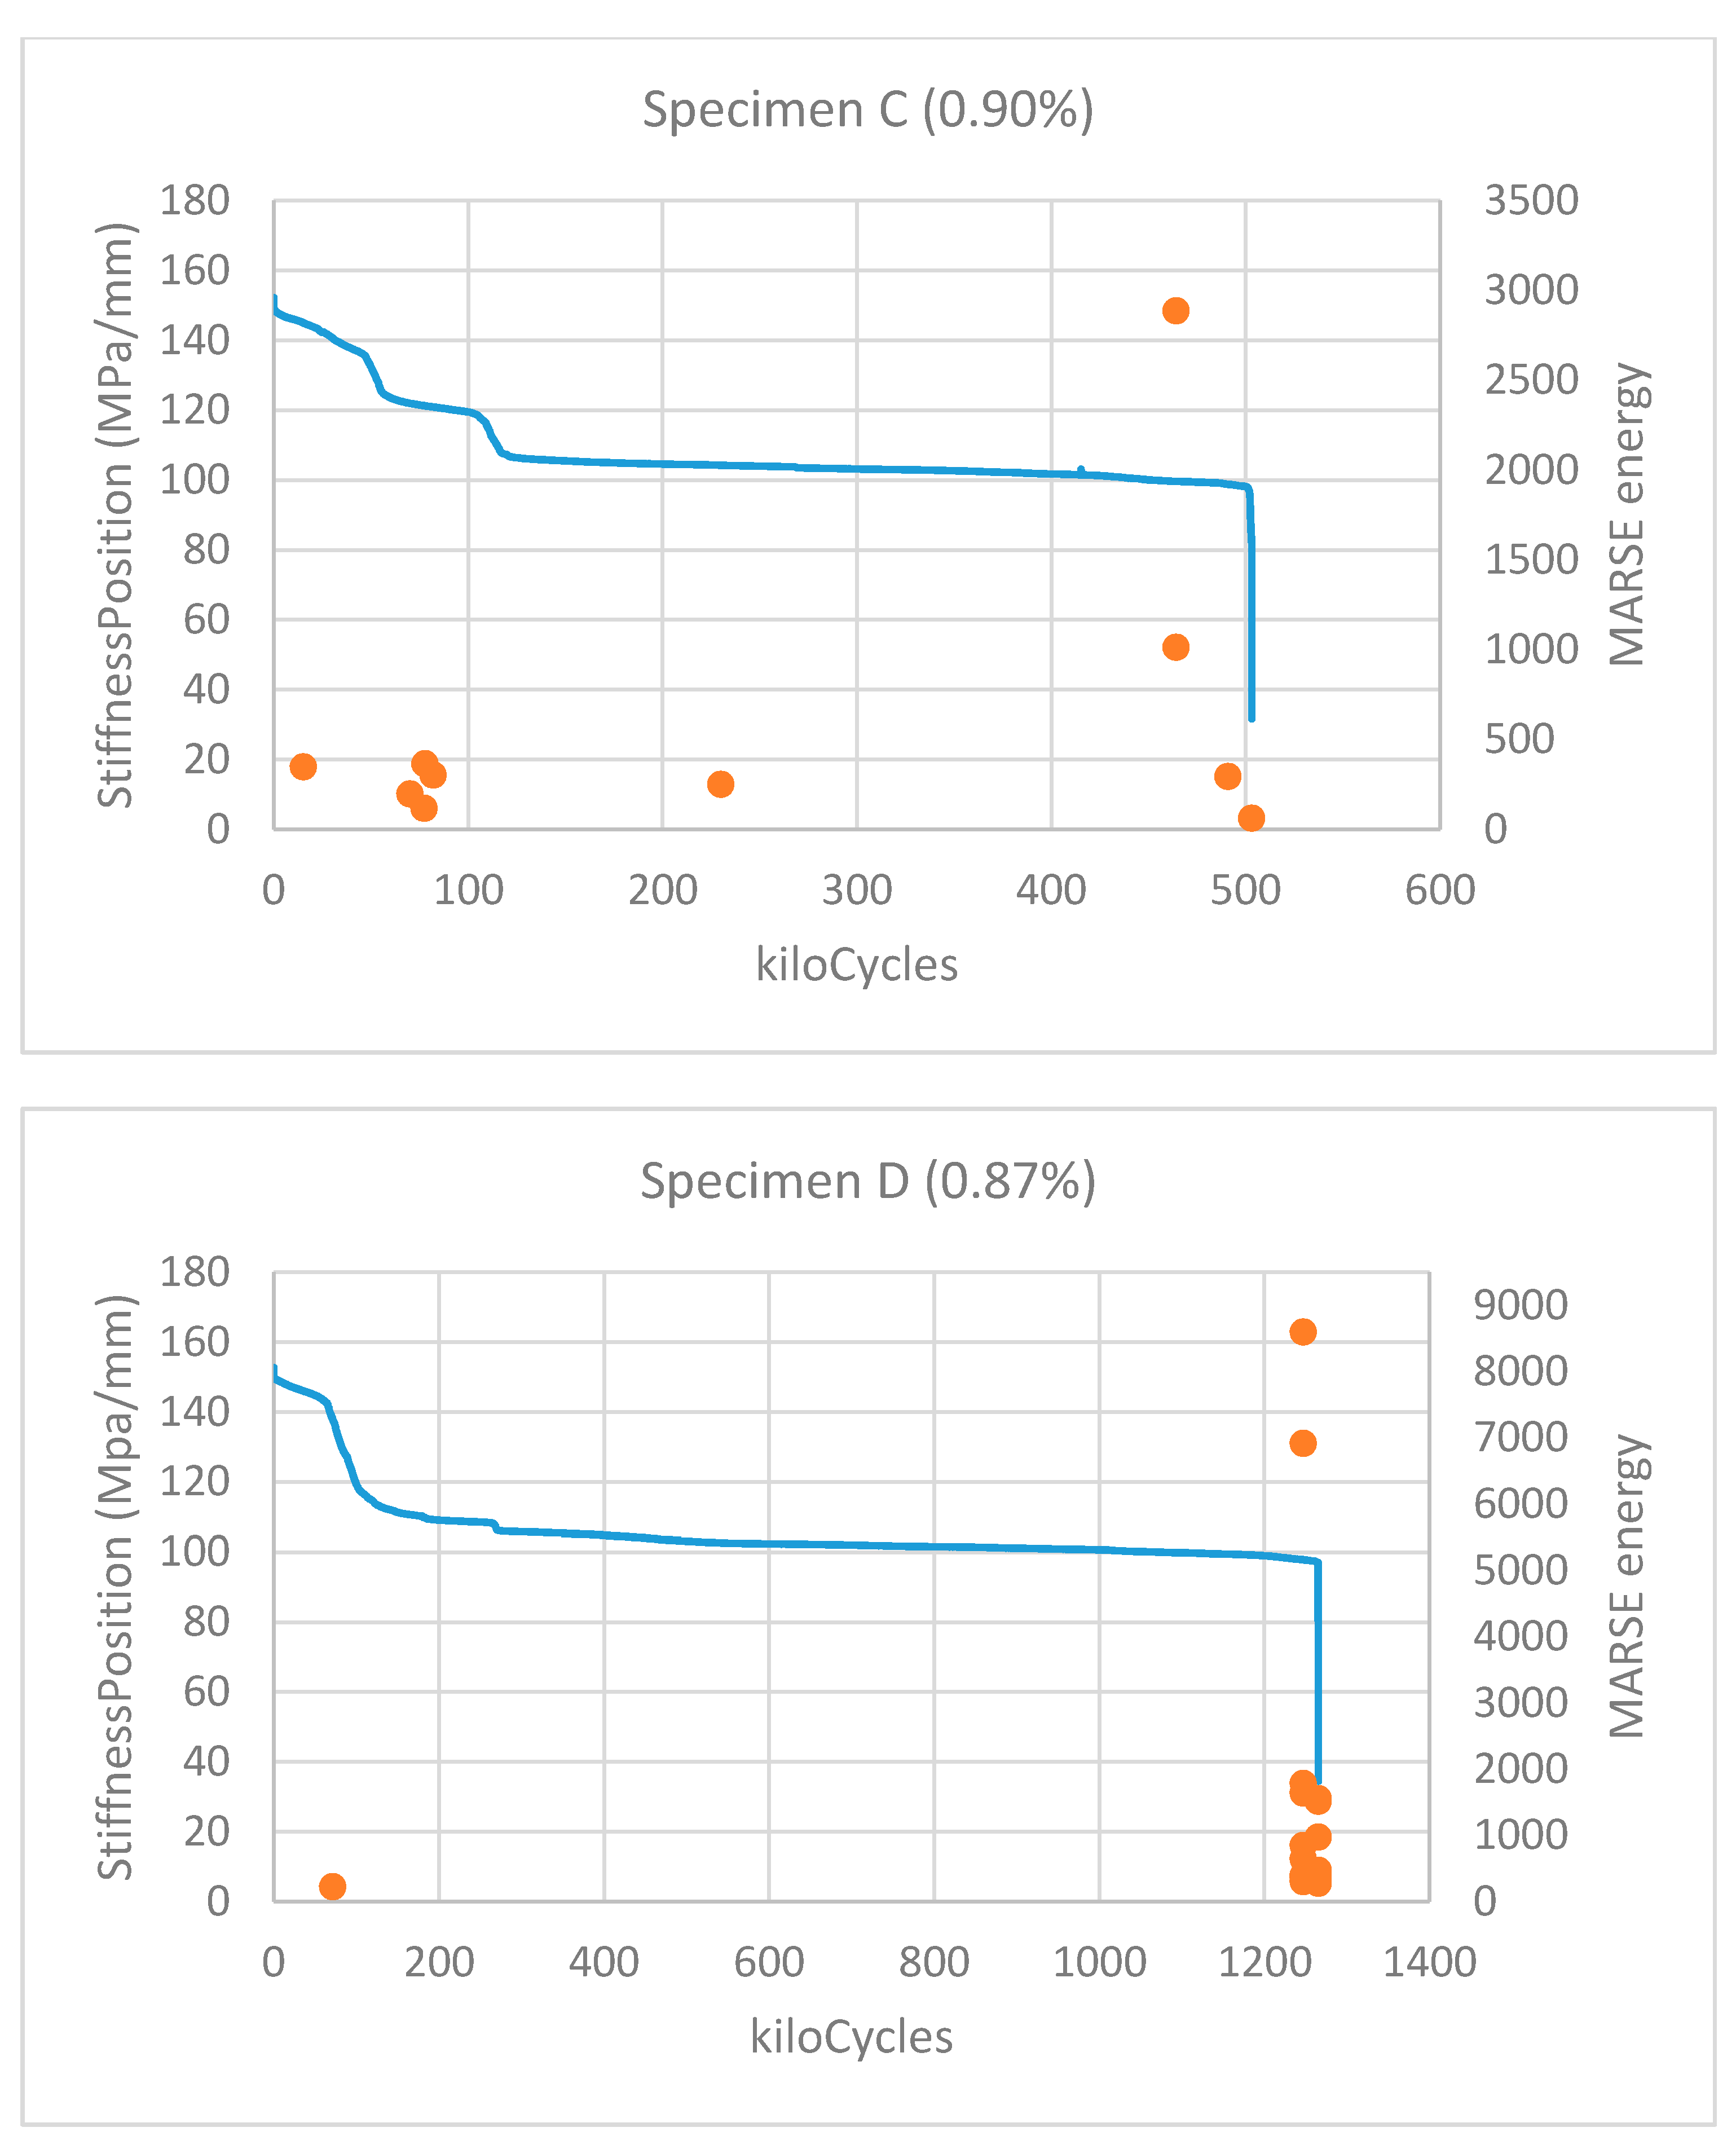
Of interest here is the possibility of detecting the suboptimal performance of specimen C early in its simulated life cycle. By looking at the AE data from these tests we saw a general response where high amplitude, high energy hits were detected briefly near the start of the testing (phase I), followed by a long period of fatigue loading where there was no high energy hits. The length of this middle phase (phase II) depended on the level of strain being applied and there was considerable lower amplitude activity as the material was affected by the dynamic strains and a distributed microdamage develops throughout the gauge length. Then, at the very end of the test (phase III), AE activity levels increased once more as the laminate material damage became macroscale failure and the integrity of the specimen broke down. This stiffness and AE response during the three phases of fatigue testing can be seen in Figure 12.
Figure 12 shows the stiffness response for the test specimens B, C, and D during fatigue testing overlaid with the high amplitude and high energy acoustic emission activity (all hits below 90 dB in amplitude were excluded). Note that test specimen C was the only one that emitted high amplitude hits during phase II, and that the highest energy hits occurred some 40,000 cycles prior to specimen failure rather than immediately at the failure point as with the others.

5. Future Directions

As discussed above, the weaknesses of current structural health monitoring technologies include: low sensitivity (only large cracks could be detected), embedded sensors could change the mass distribution of blades and also could represent a local weak site, potentially triggering crack growth; costs of introducing additional sensing elements. Therefore, the local nanoscale sensors that do not weaken the composites and coatings, but rather strengthen them, increasing their toughness and fatigue resistance can be considered as promising solution [83,84,85,86]. Another advantage of nanoscale conductive particles is the possibility of using available or only slightly modified manufacturing technology for composites and coatings. The idea of the damage mechanism based sensing with embedded nanoscale carbon particles (e.g., carbon nanotubes) is illustrated in Figure 13, where the conductive carbon nanoparticle layer and percolating carbon nanoparticle network are shown. Conductive fuzzy fibers can be used to sense defects in the composites [87]. While it would be preferable to prevent and stop defects at the stage when they are still small, the most sensing technologies allow only detecting relatively large defects. Thus, a possible approach would be to combine the self-healing and sensing functionalities, to heal the smallest defects and get a signal when the cracks grow. The technologies of healing composites include Diels-Adler technology (can be used, for instance, for polyurethane coatings [88]), microencapsulation [89], hollow fibers, vascular networks [90], vitrimers [91,92], and interconnected self-healing thermoplastic/epoxy matrix microstructures [91]. Some of these technologies are adapted now to wind turbine blades. Application of artificial intelligence and machine learning [93] is another promising direction to extract and interpret minimal data available from limited amount of sensors. Such an approach can also be optimized using digital twinning.

6. Conclusions

The concept of damage mechanism based (mechanism-informed) approach to the structural health monitoring of wind turbine blades was formulated. Various strategies and approaches of structural health monitoring of wind turbine blades were compared. Examples of the local, damage mechanism based approach to the structural health monitoring of wind turbine blade were demonstrated, include the monitoring of leading edge erosion of wind turbine blades, adhesive bond failure, plydrop delamination, static and dynamic plydrop tests, and bolt and laminate fatigue. The examples demonstrated the possibilities of monitoring specific damage mechanisms, and specific localizations of wind turbine blades. Possible future directions of the development of structural health monitoring systems are discussed.

Author Contributions

Conceptualization, M.M. and L.M.J.; methodology, investigation, writing—review and editing, M.M. and L.M.J. expeiments, M.M. All authors have read and agreed to the published version of the manuscript.

Funding

The authors kindly acknowledge the financial support of the Innovation Foundation of Denmark in the framework of the Grand Solutions project DURALEDGE, Durable leading edges for high tip speed wind turbine blades, File nr.: 8055-00012A, of the Danish Energy Technology Development and Demonstration Program in the RELIABLADE project (Improved reliability of wind turbine blades using digital twins throughout the life cycle), Journal number EUDP 64018-0068, and of the European Union’s Horizon 2020 research and innovation program in the DACOMAT project (Damage Controlled Composite Materials). GA No. 761072. Further, the authors acknowledge the support of the Ministry of Foreign Affairs of Denmark, in the framework of Danida grant 19-M02-DTU “Maintenance and Repair Strategy for Wind Energy Development”, and of the European Union via Marie Skłodowska-Curie project Nano2Day, grant agreement No 777810.

Conflicts of Interest

The authors declare no conflict of interest.

References

  1. Wind Energy in Europe: Outlook to 2023. October 2019. Available online: https://www.anev.org/wp-content/uploads/2019/10/Market-outlook-2019.pdf (accessed on 10 December 2020).
  2. Operation and Maintenance Costs of Wind Generated Power. Available online: https://www.wind-energy-the-facts.org (accessed on 10 December 2020).
  3. Stephenson, S. Wind Blade Repair: Planning, Safety, Flexibility. Composites World, 2011. Available online: https://www.compositesworld.com/columns/wind-blade-repair-planning-safety-flexibility(2) (accessed on 14 December 2020).
  4. Karavida, S.; Nõmmik, R. Waste Management of End-of-Service Wind Turbines. Master’s Thesis, Aalborg University, Aalborg, Denmark, June 2015. Available online: https://projekter.aau.dk/projekter/files/213319772/Waste_management_of_end_of_service_wind_turbines.pdf (accessed on 14 December 2020).
  5. Ruhul, A.; Peter, M.; Michael, P. Condition Based Maintenance: A UK pilot study. Int. J. Facil. Manag. 2015, 6. [Google Scholar]
  6. Starr, A.; Al-Najjar, B.; Holmberg, K.; Jantunen, E.; Bellew, J.; Albarbar, A. Maintenance Today and Future Trends, E-Maintenance; Springer: London, UK, 2010. [Google Scholar]
  7. Gerdes, M. Effects of Effects of Condition-Based Maintenace on Costs Caused by Unscheduled Maintenance of Aircraft. 2016. Available online: https://www.fzt.haw-hamburg.de/pers/Scholz/PAHMIR/GERDES-2016_Condition-basedMaintenanceOnCosts_JQME.pdf (accessed on 10 December 2020).
  8. Lasch, R.; Fritzsche, R. Logistics Management; Springer: Berlin/Heidelberg, Germany, 2016. [Google Scholar]
  9. Rumsey, M.A.; Paquette, J.A. Structural Health Monitoring of Wind Turbine Blades* Proceedings Volume 6933, Smart Sensor Phenomena, Technology, Networks, and Systems 2008; 69330E. Available online: https://doi.org/10.1117/12.778324 (accessed on 10 December 2020).
  10. Lian, J.; Cai, O.; Dong, X.; Jiang, Q.; Zhao, Y. Health Monitoring and Safety Evaluation of the Offshore Wind Turbine Structure: A Review and Discussion of Future Development. Sustainability 2019, 11, 494. [Google Scholar] [CrossRef] [Green Version]
  11. Yang, B.; Sun, D. Testing inspecting and monitoring technologies for wind turbine blades: A survey. Renew. Sustain. Energy Rev. 2013, 22, 515–526. [Google Scholar]
  12. Hyers, R.W.; Mcgowan, J.G.; Sullivan, K.L.; Manwell, J.F.; Syrett, B.C. Condition monitoring and prognosis of utility scale wind turbines. Adv. Energy Mater. 2006, 1, 187–203. [Google Scholar] [CrossRef]
  13. Antoniadou, I.; Dervilis, N.; Papatheou, E.; Maguire, A.E.; Worden, K. Aspects of structural health and condition monitoring of offshore wind turbines. Philos. Trans. A Math Phys. Eng. Sci. 2015, 373, 20140075. [Google Scholar] [CrossRef] [PubMed] [Green Version]
  14. Amenabar, I.; Mendikute, A.; López-Arraiza, A.; Lizaranzu, A.; Aurrekoetxea, J. Comparison and analysis of non-destructive testing techniques suitable for delamination inspection in wind turbine blades. Compos. Part B Eng. 2011, 42, 1298–1305. [Google Scholar] [CrossRef]
  15. Yang, W.; Peng, Z.; Wei, K.; Tian, W. Structural health monitoring of composite wind turbine blades: Challenges, issues and potential solutions. IET Renew. Power Gener. 2017, 11, 411–416. [Google Scholar] [CrossRef] [Green Version]
  16. Martinez-Luengo, M.; Kolios, A.; Wang, L. Structural health monitoring of offshore wind turbines: A review through the Statistical Pattern Recognition Paradigm. Renew. Sustain. Energy Rev. 2016, 64, 91–105. [Google Scholar] [CrossRef] [Green Version]
  17. Wang, K.S.; Sharma, V.S.; Zhang, Z.Y. SCADA data based condition monitoring of wind turbines. Adv. Manuf. 2014, 2, 61–69. [Google Scholar] [CrossRef] [Green Version]
  18. Fischer, K.; Coronado, D. Condition monitoring of wind turbines: State of the art, user experience and recommendations. VGB PowerTech. 2015, 7, 51–56. [Google Scholar]
  19. Joshuva, A.; ASLESH, A.K.; Sugumaran, V. State of the art of structural health monitoring of wind turbines. Int. J. Mech. Sci. 2019. [Google Scholar] [CrossRef]
  20. Ou, Y.; Chatzi, E.N.; Dertimanis, V.K.; Spiridonakos, M.D. Vibration-based experimental damage detection of a small-scale wind turbine blade. Struct. Health Monit. 2017, 16, 79–96. [Google Scholar] [CrossRef]
  21. Dervilis, N.; Choi, M.; Taylor, S.G.; Barthorpe, R.J.; Park, G.; Farrar, C.R.; Worden, K. On damage diagnosis for a wind turbine blade using pattern recognition. J. Sound Vib. 2014, 333, 1833–1850. [Google Scholar] [CrossRef]
  22. Sutherland, H.; Beattie, A.; Hansche, B.; Musial, W.; Allread, J.; Johnson, J.; Summers, M. The Application of Nondestructive Techniques to the Testing of a Wind Turbine Blade; Nasa Sti/recon Technical Report N; Sandia National Laboratories: Livermore, CA, USA, 1994.
  23. Kirikera, G.R.; Shinde, V.; Schulz, M.J.; Sundaresan, M.J.; Hughes, S.; Dam, J.V.; Nkrumah, F.; Grandhi, G.; Ghoshal, A. Monitoring Multi-Site Damage Growth During Quasi-Static Testing of a Wind Turbine Blade using a Structural Neural System. Struct. Health Monit. 2008, 7, 157–173. [Google Scholar] [CrossRef]
  24. SAE Standard. Guidelines for Implementation of Structural Health Monitoring on Fixed Wing Aircraft ARP6461; Society of Automotive Engineers: Warrendale, PA, USA, 2013. [Google Scholar]
  25. Straub, D.; Chatzi, E.; Bismut, E.; Courage, W.M.G.; Döhler, M.; Faber, M.H.; Zonta, D. Value of information: A roadmap to quantifying the benefit of structural health monitoring. In Safety, Reliability, Risk, Resilience and Sustainability of Structures and Infrastructure; Bucher, C., Ellingwood, B., Frangopol, D., Eds.; TU Verlag: Vienna, Austria, 2017; pp. 3018–3029. [Google Scholar]
  26. Ossai, C.I.; Boswell, B.; Davies, I.J. A Markovian approach for modelling the effects of maintenance on downtime and failure risk of wind turbine components. Renew. Energy 2016, 96, 775–783. [Google Scholar] [CrossRef]
  27. Bangalore, P.; Patriksson, M. Analysis of SCADA data for early fault detection, with application to the maintenance management of wind turbines. Renew. Energy 2018, 115, 521–532. [Google Scholar] [CrossRef]
  28. Nielsen, J.J.; Tcherniak, D.; Ulriksen, M.D. A case study on risk-based maintenance of wind turbine blades with structural health monitoring. Struct. Infrastruct. Eng. 2020, 1–17. [Google Scholar] [CrossRef]
  29. Arsenaul, T.J.; Achuthan, A.; Marzocca, P.; Grappasonni, C.; Coppotelli, G. Development of a FBG based distributed strain sensor system for wind turbine structural health monitoring. Smart Mater. Struct. 2013, 22. [Google Scholar] [CrossRef]
  30. Ghoshal, A.; Sundaresan, M.J.; Schulz, M.J.; Pai, P.F. Structural health monitoring techniques for wind turbine blades. J. Wind. Eng. Ind. Aerodyn. 2000, 85, 309–324. [Google Scholar] [CrossRef]
  31. Kim, H.C.; Kim, M.-H.; Choe, D.-E. Structural health monitoring of towers and blades for floating offshore wind turbines using operational modal analysis and modal properties with numerical-sensor signals. Ocean Eng. 2019, 188. [Google Scholar] [CrossRef]
  32. Tcherniak, D.; Mølgaard, L.L. Active vibration-based structural health monitoring system for wind turbine blade: Demonstration on an operating Vestas V27 wind turbine. Struct. Health Monit. 2017, 16, 536–550. [Google Scholar] [CrossRef] [Green Version]
  33. Niezrecki, C.; Inalpolat, M. Structural Health Monitoring of Wind Turbine Blades Using Wireless Acoustic Sensing, 2015, Patent. Available online: https://patents.google.com/patent/WO2015065873A3/ (accessed on 10 December 2020).
  34. Poozesh, P.; Aizawa, K.; Niezrecki, C.; Baqersad, J.; Inalpolat, M.; Heilmann, G. Structural health monitoring of wind turbine blades using acoustic microphone array. Struct. Health Monit. 2016, 16, 471–485. [Google Scholar] [CrossRef]
  35. Traylor, C.; DiPaola, M.; Willis, D.J.; Inalpolat, M. A computational investigation of airfoil aeroacoustics for structural health monitoring of wind turbine blades. Wind Energy 2019, 23, 795–809. [Google Scholar] [CrossRef]
  36. Papasalouros, D.; Tsopelas, N.; Anastasopoulos, A.; Kourousis, D.; Lekou, D.J.; Mouzakis, F. Acoustic emission monitoring of composite blade of NM48/750 NEG-MICON wind turbine. J. Acoust. Emiss. 2013, 31, 36–49. [Google Scholar]
  37. Song, G.; Li, H.; Gajic, B.; Zhou, W.; Chen, P.; Gu, H. Wind turbine blade health monitoring with piezoceramic-based wireless sensor network. Int. J. Smart Nano Mater. 2013, 4, 150–166. [Google Scholar] [CrossRef]
  38. Zhang, F.; Li, Y.; Yang, Z.; Zhang, L. Investigation of wind turbine blade monitoring based on optical fiber Brillouin sensor. In Proceedings of the 2009 International Conference on Sustainable Power Generation and Supply, Nanjing, China, 6–7 April 2009; pp. 1–4. [Google Scholar]
  39. Schroeder, K.; Ecke, W.; Apitz, J.; Lembke, E.; Lenschow, G. A Fibre Bragg grating sensor system monitors operational load in a wind turbine rotor blade. Meas. Sci. Technol. 2006, 17, 1167–1172. [Google Scholar] [CrossRef]
  40. Lee, J.R.; Shin, H.J.; Chia, C.C.; Dhital, D.; Yoon, D.J.; Huh, Y.H. Long distance laser ultrasonic propagation imaging system for damage visualization. Opt. Lasers Eng. 2011, 49, 1361–1371. [Google Scholar] [CrossRef]
  41. Park, B.; Sohn, H.; Yeum, C.M.; Truong, T.C. Laser ultrasonic imaging and damage detection for a rotating structure. Struct. Health Monit. 2013, 12, 494–506. [Google Scholar] [CrossRef]
  42. Arnold, P.; Moll, J.; Mälzer, M.; Krozer, V.; Pozdniakov, D.; Salman, R.; Rediske, S.; Scholz, M.; Friedmann, H.; Nuber, A. Radar-based structural health monitoring of wind turbine blades: The case of damage localization. Wind Energy 2018. [Google Scholar] [CrossRef]
  43. Park, G.; Inman, D.J. Structural health monitoring using piezoelectric impedance measurements. Phil. Trans. R. Soc. A 2007, 365, 373–392. [Google Scholar] [CrossRef]
  44. Pitchford, C.; Grisso, B.L.; Inman, D.J. Impedance-based structural health monitoring of wind turbine blades. In Proceedings of the SPIE 6532, Health Monitoring of Structural and Biological Systems 2007, 65321I, San Diego, CA, USA, 11 April 2007. [Google Scholar] [CrossRef] [Green Version]
  45. Hwang, S.; An, Y.K.; Sohn, H. Continuous Line Laser Thermography for Damage Imaging of Rotating Wind Turbine Blades. Procedia Eng. 2016, 188, 225–232. [Google Scholar] [CrossRef]
  46. Fiedler, B.; Gojny, F.H.; Wichmann, M.H.; Bauhofer, W.; Schulte, K. Can carbon nanotubes be used to sense damage in composites? Ann. Chim. Sci. Mat. 2004, 29, 81–94. [Google Scholar] [CrossRef]
  47. Thostenson, E.T.; Chou, T. Real-time in situ sensing of damage evolution in advanced fiber composites using carbon nanotube networks. Nanotechnology 2008, 19, 215713. [Google Scholar] [CrossRef] [PubMed]
  48. Thostenson, E.T.; Chou, T. Carbon nanotube networks: Sensing of distributed strain and damage for life prediction and self healing. Adv. Mater. 2006, 18, 2837–2841. [Google Scholar] [CrossRef]
  49. Hu, N.; Fukunaga, H.; Atobe, S.; Liu, Y.; Li, J. Piezoresistive strain sensors made from carbon nanotubes based polymer nanocomposites. Sensors 2011, 11, 10691–10723. [Google Scholar]
  50. Kang, I.; Schulz, M.; Kim, J.H.; Shanov, V.; Shi, D. A carbon nanotube strain sensor for structural health monitoring. Smart Mater. Struct. 2006, 15, 737–748. [Google Scholar] [CrossRef]
  51. Sam-Daliri, O.; Faller, L.M.; Farahani, M.; Roshanghias, A.; Oberlercher, H.; Mitterer, T.; Araee, A.; Zangl, H. MWCNT–Epoxy Nanocomposite Sensors for Structural Health Monitoring. Electronics 2018, 7, 143. [Google Scholar] [CrossRef] [Green Version]
  52. Dai, H. An Innovative Sensing Approach Using Carbon Nanotube-Based Composites for Structural Health Monitoring of Concrete Structures. Ph.D. Thesis, University of Delaware, Newark, DE, USA, 2017. [Google Scholar]
  53. Grabowski, K.; Zbyrad, P.; Uhl, T.; Staszewski, W.J.; Packo, P. Multiscale electro-mechanical modeling of carbon nanotube composites. Comput. Mater. Sci. 2017, 135, 169–180. [Google Scholar] [CrossRef]
  54. Grabowski, K.; Zbyrad, P.; Wilmański, A.; Uhl, T. Strain sensors based on carbon nanotube—Polymer coatings. In Proceedings of the EWSHM—7th European Workshop on Structural Health Monitoring, IFFSTTAR, Inria, Université de Nantes, Nantes, France, 27 July 2014. [Google Scholar]
  55. Li, Y.; Liao, Y.; Su, Z. Graphene-functionalized polymer composites for self-sensing of ultrasonic waves: An initiative towards “sensor-free” structural health monitoring. Compos. Sci. Technol. 2018, 168, 203–213. [Google Scholar] [CrossRef]
  56. Carroll, J.; McDonald, A.; McMillan, D. Failure rate, repair time and unscheduled O&M cost analysis of offshore wind turbines. Wind. Energy 2016, 19, 1107–1119. [Google Scholar] [CrossRef] [Green Version]
  57. Caithness Windfarm Information Forum, Accident Statistics. 2013. Available online: http://www.caithnesswindfarms.co.uk/ (accessed on 11 December 2020).
  58. Branner, K.; Ghadirian, A. Database about Blade Faults; DTU Wind Energy E, No. 0067; DTU Wind Energy: Roskilde, Denmark, 2014. [Google Scholar]
  59. Tavner, P. How are we going to make offshore wind farms more reliable? In SUPERGEN Wind 2011 General Assembly; 20 March 2011; Durham University: Durham, UK, 2011; Available online: https://docplayer.net/37070508-Supergen-wind-2011-general-assembly-how-are-we-going-to-make-offshore-wind-farms-more-reliable-peter-tavner-20-th-march-2011-durham-university.html (accessed on 11 December 2020).
  60. Lu, B.; Li, Y.; Wu, X.; Yang, Z. A review of recent advances in wind turbine condition monitoring and fault diagnosis. In Proceedings of the Power Electronics and Machines in Wind Applications, Lincoln, NE, USA, 24–26 June 2009; pp. 1–7. [Google Scholar]
  61. Mishnaevsky, L., Jr. Repair of wind turbine blades: Review of methods and related computational mechanics problems. Renew. Energy 2019, 140, 828–839. [Google Scholar] [CrossRef]
  62. Mischnaewski, L., III; Mishnaevsky, L., Jr. Structural repair of wind turbine blades: Computational model for the evaluation of the effects of adhesive and patch properties on the repair quality. Wind Energy 2020. [Google Scholar] [CrossRef]
  63. Shohag, M.A.S.; Hammel, E.C.; Olawale, D.O.; Okoli, O.I. Damage mitigation techniques in wind turbine blades: A review. Wind Eng. 2017, 41, 185–210. [Google Scholar] [CrossRef]
  64. Khan, M.M.; Iqbal, M.T.; Khan, F. Reliability and condition monitoring of a wind turbine. In Proceedings of the 18th Annual Canadian Conference Electrical and Computer Engineering, Saskatchewan, ON, Canada, 1–4 May 2005; pp. 1978–1981. [Google Scholar]
  65. Mishnaevsky, L., Jr.; Thomsen, K. Costs of repair of wind turbine blades: Influence of technology aspects. Wind Energy 2020. [Google Scholar] [CrossRef]
  66. Ciang, C.C.; Lee, J.R.; Bang, H.J. Structural health monitoring for a wind turbine system: A review of damage detection methods. Meas. Sci. Technol. 2008, 19, 122001. [Google Scholar] [CrossRef] [Green Version]
  67. Li, D.; Ho, S.C.M.; Song, G.; Ren, L.; Li, H. A review of damage detection methods for wind turbine blades. Smart. Mater. Struct. 2015, 24, 1–24. [Google Scholar]
  68. Chen, X. Fracture of wind turbine blades in operation—Part I: A comprehensive forensic investigation. Wind Energy 2018. [Google Scholar] [CrossRef]
  69. Sørensen, B.F.; Lading, L.; Sendrup, P.; McGugan, M.; Debel, C.P.; Kristensen, O.J.D.; Larsen, G.C.; Hansen, A.M.; Rheinländer, J.; Rusborg, J.; et al. Fundamentals for Remote Structural Health Monitoring of Wind Turbine Blades—A Preproject; Risoe-R; No. 1336EN; Forskningscenter Risoe: Roskilde, Denmark, 2002; p. 36. [Google Scholar]
  70. Mishnaevsky, L., Jr.; Branner, K.; Petersen, H.N.; Beauson, J.; McGugan, M.; Sørensen, B. Materials for wind turbine blades: An overview. Materials 2017, 10, 1285. [Google Scholar] [CrossRef] [Green Version]
  71. Mishnaevsky, L., Jr. Toolbox for optimizing anti-erosion protective coatings of wind turbine blades: Overview of mechanisms and technical solutions. Wind Energy 2019, 22, 1–18. [Google Scholar] [CrossRef]
  72. Mishnaevsky, L., Jr.; Fæster, S.; Mikkelsen, L.P.; Kusano, Y.; Bech, J.I. Micromechanisms of leading edge erosion of wind turbine blades: X-Ray tomography analysis and computational studies. Wind Energy 2019, 1–16. [Google Scholar] [CrossRef]
  73. Fredianelli, L.; Carpita, S.; Licitra, G. A procedure for deriving wind turbine noise limits by taking into account annoyance. Sci. Total. Environ. 2019, 648, 728–736. [Google Scholar] [CrossRef] [PubMed]
  74. Pohl, J.; Gabriel, J.; Hübner, G. Understanding stress effects of wind turbine noise–The integrated approach. Energy Policy 2018, 112, 119–128. [Google Scholar] [CrossRef]
  75. Liu, W.Y. A review on wind turbine noise mechanism and de-noising techniques. Renew. Energy 2017, 108, 311–320. [Google Scholar] [CrossRef]
  76. Mishnaevsky, L., Jr.; Brøndsted, P. Statistical modelling of compression and fatigue damage of unidirectional fiber reinforced composites. Compos. Sci. Technol. 2009, 69, 477–484. [Google Scholar] [CrossRef]
  77. Bech, J.; Hasager, C.B.; Bak, C. Extending the life of wind turbine blade leading edges by reducing the tip speed during extreme precipitation events. Wind Energy Sci. 2018, 3, 729–748. [Google Scholar] [CrossRef] [Green Version]
  78. Fraisse, A.; Bech, J.I.; Borum, K.K.; Fedorov, V.; Johansen, N.F.-J.; McGugan, M.; Mishnaevsky, L., Jr.; Kusano, Y. Impact fatigue damage of coated glass fibre reinforced polymer laminate. Renew. Energy 2018, 126, 1102–1112. [Google Scholar] [CrossRef] [Green Version]
  79. McGugan, M.; Pereira, G.; Sørensen, B.F.; Toftegaard, H.; Branner, K. Damage tolerance and structural monitoring for wind turbine blades. Phil. Trans. R. Soc. A 2015, 373, 20140077. [Google Scholar] [CrossRef]
  80. Torres-Arredondo, M.A.; Tibaduiza, D.-A.; McGugan, M.; Toftegaard, H.L.; Borum, K.K.; Mujica, L.E.; Rodellar, J.; Fritzen, C.-P. Multivariate data-driven modelling and pattern recognition for damage detection and identification for acoustic emission and acousto-ultrasonics. Smart Mater. Struct. 2013, 22, 105023. [Google Scholar] [CrossRef]
  81. Khan, B.; Potter, K.; Wisnom, M.R. Suppression of delamination at ply drops in tapered composites by ply chamfering. J. Compos. Mater. 2006, 40, 157–174. [Google Scholar] [CrossRef]
  82. Goutianos, S.; Sørensen, B.F. An element test specimen with ply drops to study fatigue crack growth rates at geometry transitions. In Proceedings of the 9th International Conference on Composites Testing and Model Identification, Luleå, Sweden, 29 May 2019. [Google Scholar]
  83. Boncel, S.; Kolanowska, A.; Kuziel, A.W.; Krzyżewska, I. Carbon Nanotube Wind Turbine Blades: How Far Are We Today from Laboratory Tests to Industrial Implementation? ACS Appl. Nano Mater. 2018, 1, 6542–6555. [Google Scholar] [CrossRef]
  84. Yavari, F.; Rafiee, M.A.; Rafiee, J.; Yu, Z.-Z.; Koratkar, N. Dramatic Increase in Fatigue Life in Hierarchical Graphene Composites. ACS Appl. Mater. Interfaces 2010, 2, 2738–2743. [Google Scholar] [CrossRef] [PubMed] [Green Version]
  85. Dai, G.M.; Mishnaevsky, L., Jr. Carbone nanotube reinforced hybrid composites: Computational modelling of environmental fatigue and usability for wind blades. Compos. Part B Eng. 2015, 78, 349–360. [Google Scholar] [CrossRef] [Green Version]
  86. Zhou, H.W.; Yi, H.Y.; Liu, Y.Q.; Hu, X.; Warrier, A.; Dai, G.M.; Mishnaevsky, L., Jr. Carbon fiber/carbon nanotube based hierarchical composites: Effect of CNT distribution on shearing strength. Compos. B 2016, 88, 201–211. [Google Scholar] [CrossRef] [Green Version]
  87. Boehle, M.; Jiang, Q.; Li, L.; Lagounov, A.; Lafdi, K. Carbon nanotubes grown on glass fiber as a strain sensor for real time structural health monitoring. Int. J. Smart Nano Mater. 2012, 3, 162–168. [Google Scholar] [CrossRef] [Green Version]
  88. Turkenburg, D.H.; Van Bracht, H.; Funke, B.; Schmider, M.; Janke, D.; Fischer, H.R. Polyurethane adhesives containing Diels–Alder-based thermoreversible bonds. J. Appl. Polym. Sci. 2017. [Google Scholar] [CrossRef]
  89. Cohades, A.; Branfoot, C.; Rae, S.; Bond, I.; Michaud, V. Progress in Self-Healing Fiber Reinforced Polymer Composites. Adv. Mater. Interfaces 2018, 5. [Google Scholar] [CrossRef]
  90. Matt, A.; Strong, S.; Elgammal, T.; Amano, R.S. Development of Novel Self-Healing Polymer Composites for Use in Wind Turbine Blades. J. Energy Resour. Technol. 2015. [Google Scholar] [CrossRef]
  91. Yang, X.; Guo, L.; Xu, X.; Shang, S.; Liu, H. A fully bio-based epoxy vitrimer: Self-healing, triple-shape memory and reprocessing triggered by dynamic covalent bond exchange. Mater. Des. 2020, 186, 108248. [Google Scholar] [CrossRef]
  92. Azcune, I.; Odriozola, I. Aromatic disulfide crosslinks in polymer systems: Self-healing, reprocessability, recyclability and more. Eur. Polym. J. 2016, 84, 147–160. [Google Scholar] [CrossRef]
  93. Jiménez, A.A.; Muñoz, C.Q.G.; Márquez, F.P.G. Machine Learning for Wind Turbine Blades Maintenance Management. Energies 2018, 11, 13. [Google Scholar] [CrossRef] [Green Version]
  94. Mishnaevsky, L., Jr. Nanostructured interfaces for enhancing mechanical properties of materials: Computational micromechanical studies. Compos. Part B 2015, 68, 75–84. [Google Scholar] [CrossRef] [Green Version]
Figure 1. Schema: from blade damage via SHM to repair: wind turbine → damage in laminate → embedded or attached sensors—monitoring system → repair.
Coatings 10 01223 g001
Figure 2. Main structural damage mechanisms of wind turbine blades.
Coatings 10 01223 g002
Figure 3. Eroded blade and mechanism of blade erosion (photo Jakob I. Bech).
Coatings 10 01223 g003
Figure 4. Sensor readout showing the energy density for each impact in a single point impact fatigue tester (SPIFT) series.
Coatings 10 01223 g004
Figure 5. Schematic of a plydrop specimen with the linear AE sensor array (static test).
Coatings 10 01223 g005
Figure 6. Acoustic emission localization during plydrop specimen static loading.
Coatings 10 01223 g006
Figure 7. Schematic of plydrop specimen with the linear AE sensor array (dynamic test).
Coatings 10 01223 g007
Figure 8. Acoustic emission localization during fatigue loading of the plydrop specimen (testing over two days).
Coatings 10 01223 g008
Figure 9. AE amplitude distribution for blade test during bolt failure incident.
Coatings 10 01223 g009
Figure 10. Maximum amplitude AE detected (15 min block period) during blade test bolt failure.
Coatings 10 01223 g010
Figure 11. Tensile fatigue test set up showing (from left to right) AE system, control system, and test rig, and a close up of the test specimen prior to loading, with extensometor and AE sensor clamped in place.
Coatings 10 01223 g011
Figure 12. Stiffness response for the tested specimens B, C, and D (MPa/mm) illustrating the standard phase I, II, and III of the tensile fatigue test. Additionally, shown on the same time axis is the occurrence of high amplitude AE hits during phase I and II, and in the case of the prematurely failed specimen C, also in phase II.
Coatings 10 01223 g012aCoatings 10 01223 g012b
Figure 13. Schema of possible distribution of carbon nanoparticles: on the surface (for surface sensing), on interfaces (for toughening, sensing, and fatigue) [94], and a 3D network in the matrix (volume sensing).
Coatings 10 01223 g013
Table 1. Table of results sWhowing dual cantilever beam (DCB) specimens JR value and acoustic emission (AE) characteristic information.
Specimen Series, Ordered by Descending JR ValueJR (N/mm)Total Number of AE Hits during TestNumber of AE Hits Violating
One ParameterTwo ParametersThree ParametersFour Parameters
Specimen A1.4019,9970000
Specimen D1.3523,3200000
Specimen C1.2016,8691000
Specimen B1.1514,2583200
Specimen F0.9019,9205422
Specimen E0.8029,6002321145
Table 2. Table of results from tensile fatigue testing of four coupons.
SpecimenPeak Strain (%)Cycles to Failure
A1.00140,206
B0.95904,807
C0.90503,096
D0.871,265,287
Publisher’s Note: MDPI stays neutral with regard to jurisdictional claims in published maps and institutional affiliations.