Article

The Influence of Pulling Up on Micropitting Location for Gears with Interference Fit Connections of Their Conical Surface

1
State Key Laboratory of Mechanical Transmission, Chongqing University, Chongqing 400044, China
2
Science and Technology on Vehicle Transmission Laboratory, China North Vehicle Research Institute, Beijing 100072, China
*
Author to whom correspondence should be addressed.
Coatings 2020, 10(12), 1224; https://doi.org/10.3390/coatings10121224
Submission received: 19 November 2020 / Revised: 2 December 2020 / Accepted: 8 December 2020 / Published: 14 December 2020
(This article belongs to the Special Issue Mechanical Properties of Advanced Multifunctional Coatings)

Abstract

:
Micropitting is a surface fatigue phenomenon that occurs in Hertzian type of rolling and sliding contact that operates in elastohydrodynamic or boundary lubrication regimes and can progress both in terms of depth and extent. If micropitting continues to propagate, it may result in reducing gear tooth accuracy, increasing dynamic loads and noise. Eventually, it can develop into macropitting and other modes of gear failure such as flank initiated bending fatigue. Micropitting has become a particular problem in the gear surface fatigue. Usually micropitting initiates in the dedendum of the driver and driven at the asperities on the surface. However, the authors found for some gears with interference fit connections of their conical surface, micropitting on the pinion occurs in the addendum. This study attempted to find the reason using a 3D–TCA method based on ISO/TR 15144-1 to predict the micropitting and try to understand the key influence likely to affect micropitting location.

1. Introduction

Contact fatigue damage is a common mode of gear failure that is generally manifested as the initiation and progression of micropitting on the flank surface of gear teeth [1,2,3,4,5,6,7,8,9,10]. Micropitting is a phenomenon that occurs in Hertzian type of rolling and sliding contact that operates in elastohydrodynamic or boundary lubrication regimes [11,12]. Micropitting can affect all types of gears, it has been extensively studied by researchers [13,14,15,16] and is well known to gear designers [17]. Besides operating conditions such as load, speed, sliding, temperature, surface topography and specific film thickness, the chemical composition of lubrication strongly influences micropitting [18,19,20,21,22,23,24,25]. While these parameters are known to affect the performance of micropitting for a gear set, the subject area remains a topic of research. There has been a lot of research done on the impact of surface roughness, load, temperature, hardness and slide to roll ratio on micropitting [26,27,28,29,30]. The asperity contact stress between contact surfaces is one of the main reasons to promote micropits [25,26]. It is therefore generally considered that micropits can be prevented or lessened by reducing the roughness of the surface. Olver [30] found that the micropitting level was lessened by increasing the slide to roll ratio (SRR) but the wear rate did not change significantly.
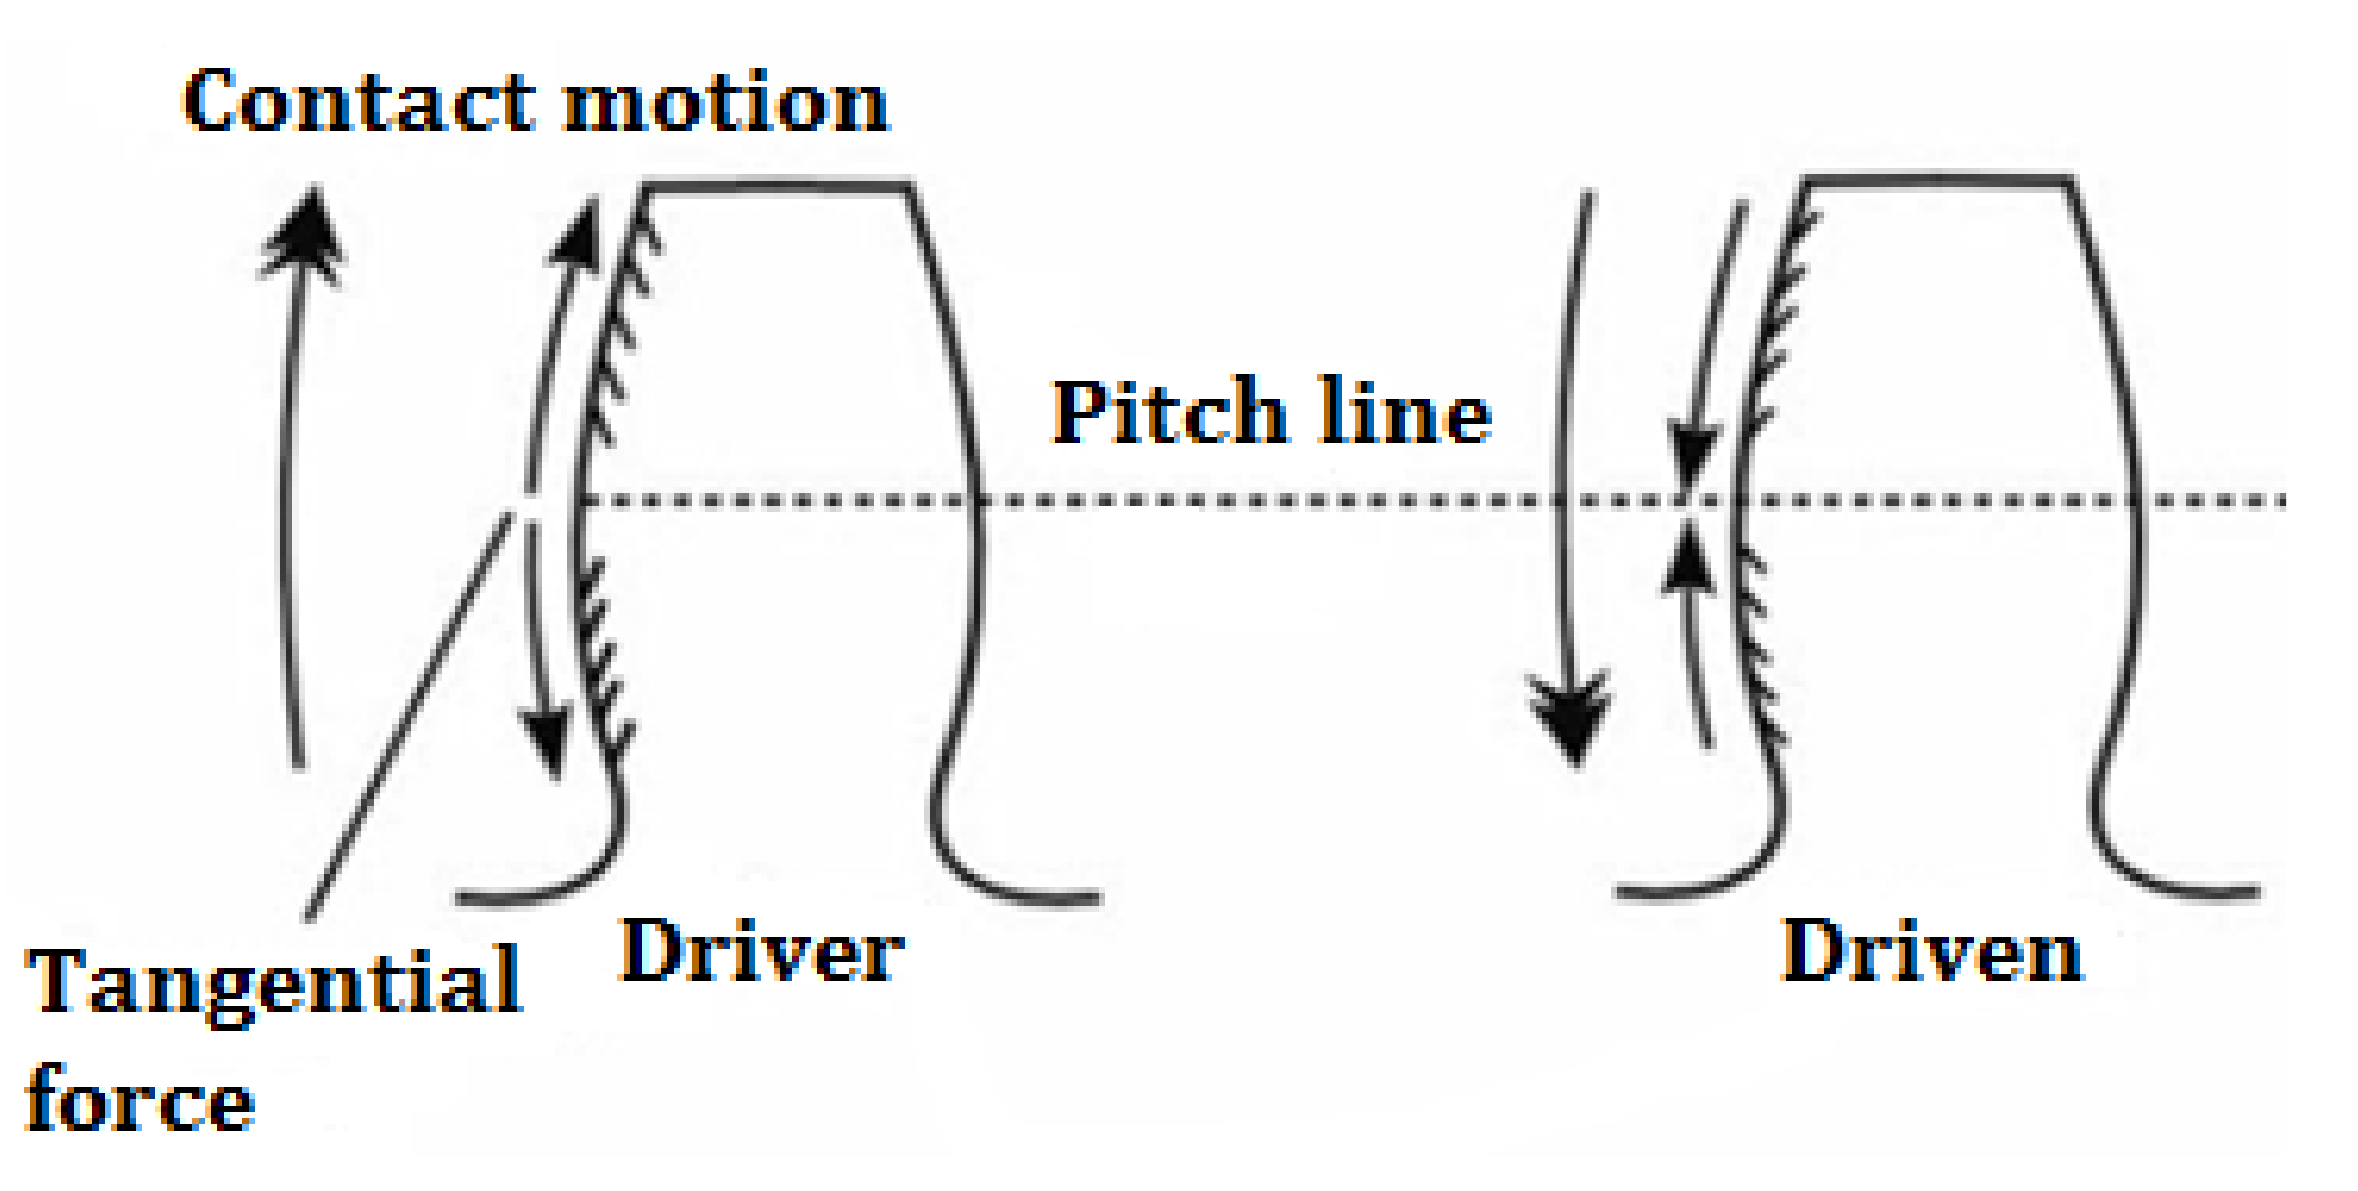
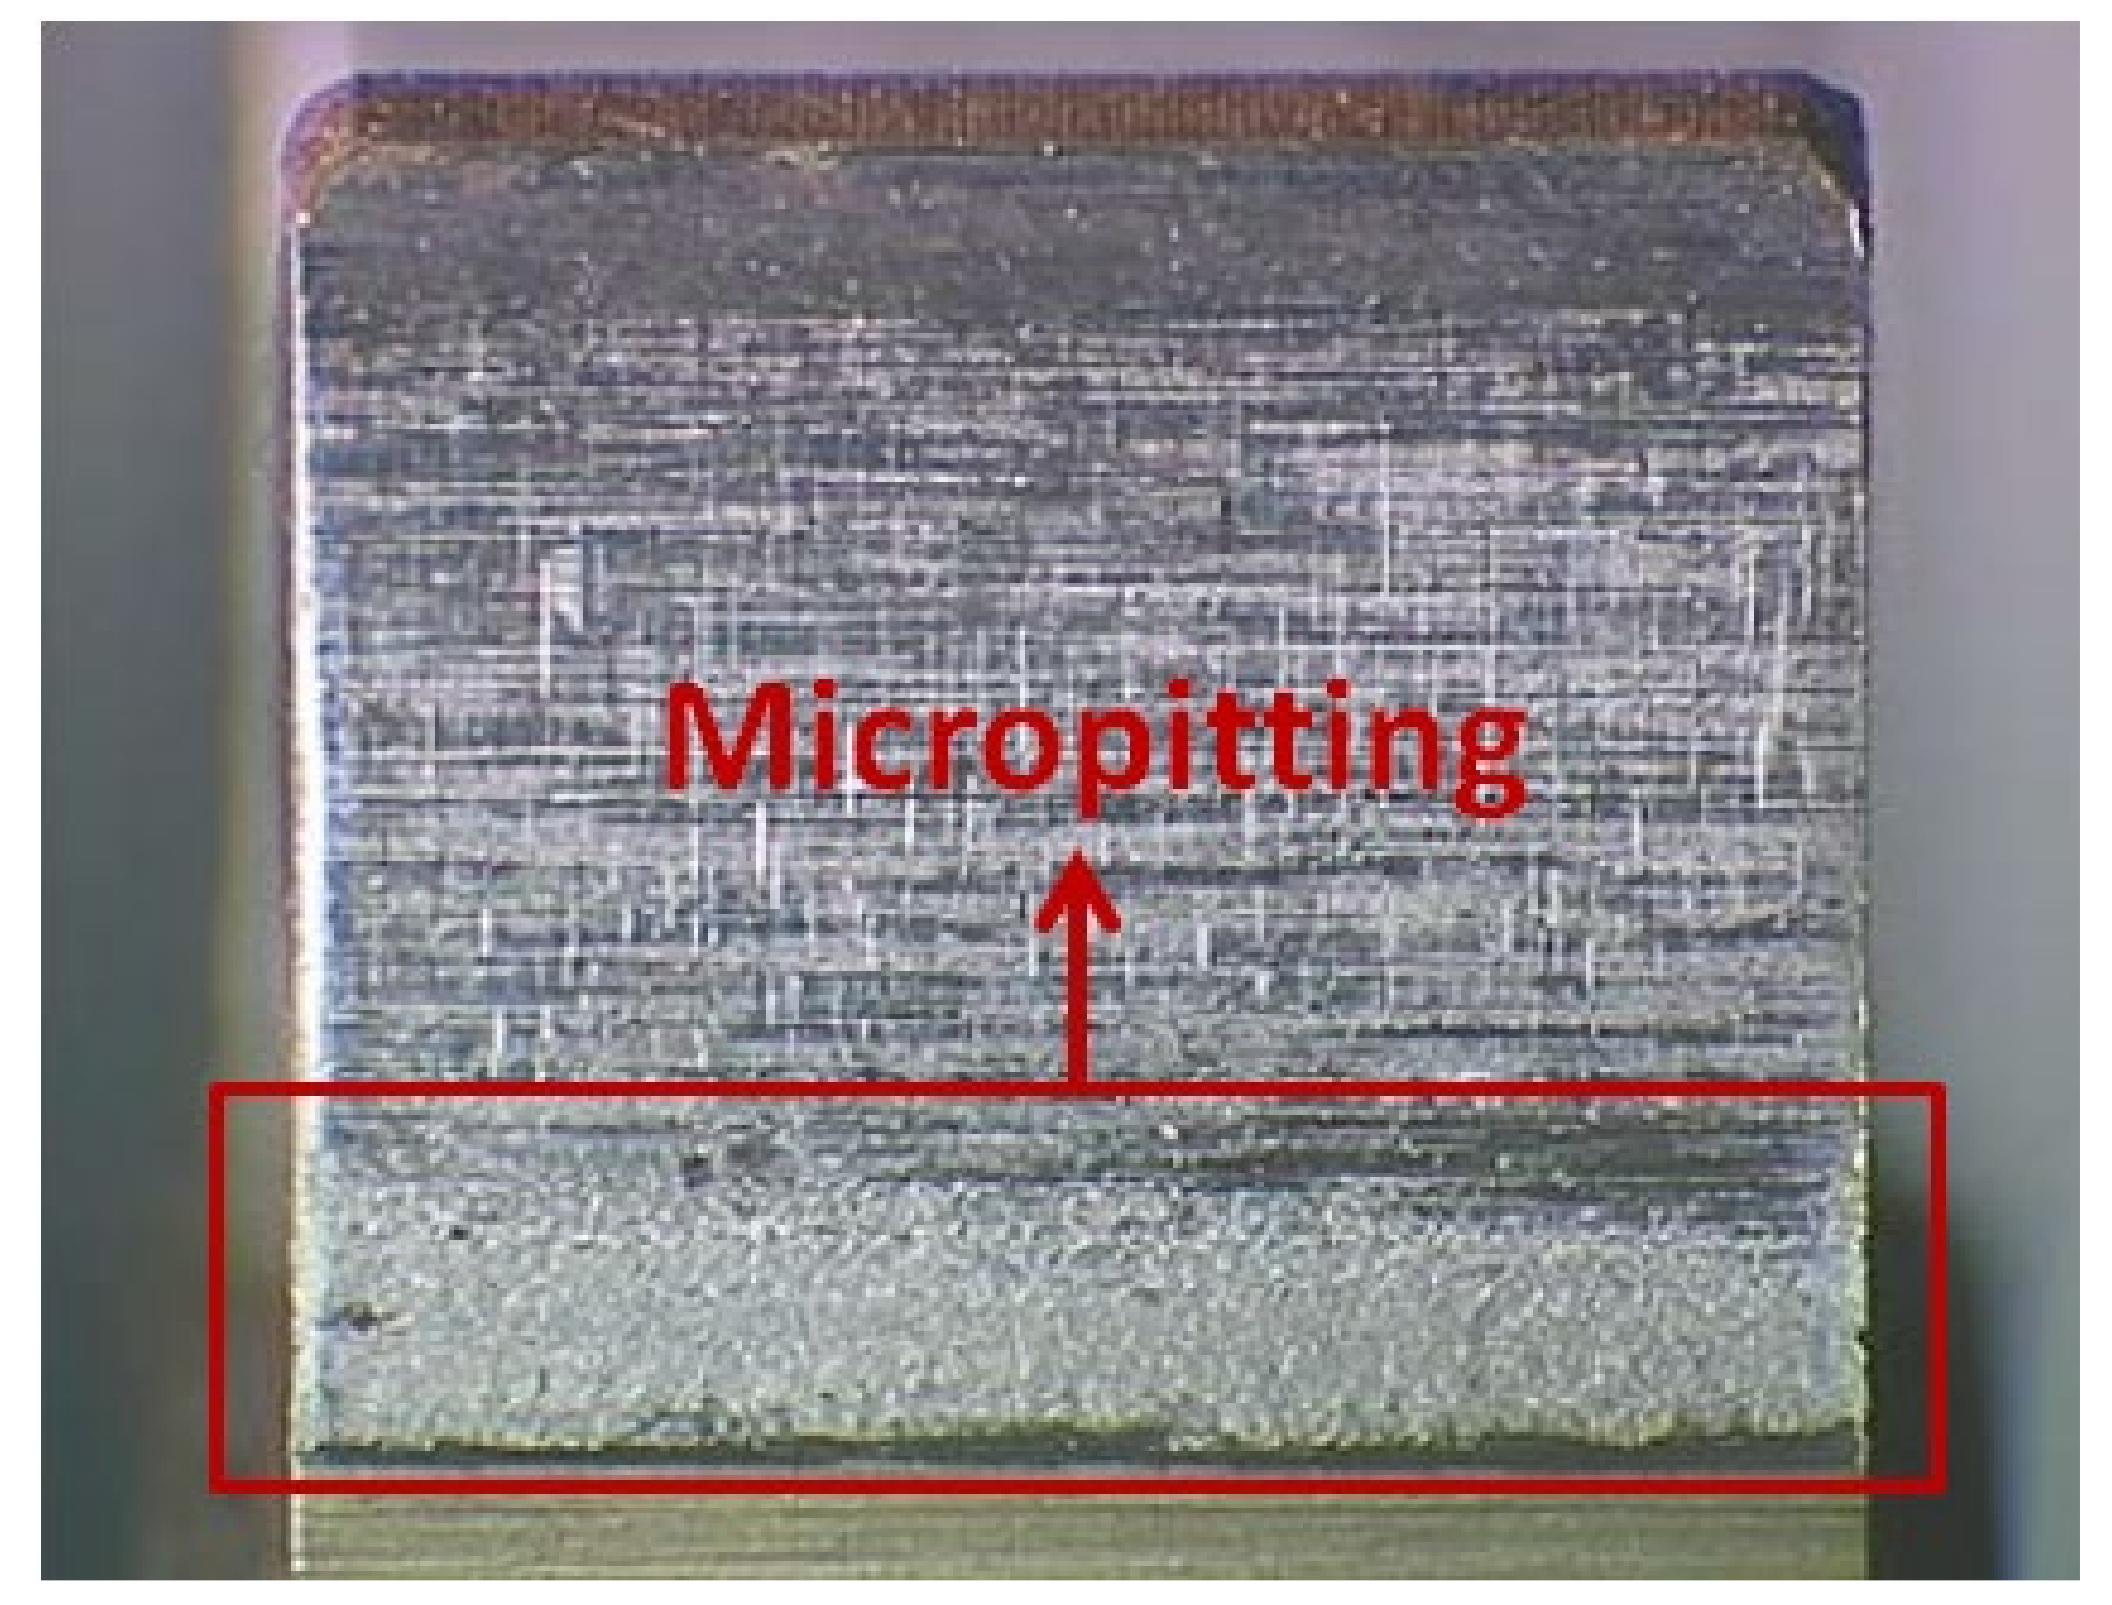
Micropitting is characterized by the presence of fine surface pits and the occurrence of local plastic deformation and shallow surface cracks. Shallow cracks grow against the sliding direction on the gear flank, i.e., towards the pitch point on the driver tooth, and away from the pitch point on the driven tooth as illustrated in Figure 1. The cracks progress to form micropits which appears as a dull, matte surface to the observer, as shown in Figure 2.
Micropitting can initiate during running and initial operation and then stop and stabilize. However, if micropitting continues to propagate, it may result in reduced gear tooth accuracy and increasing dynamic loads and noise. Eventually, it can develop into macropitting and other modes of gear failure such as flank-initiated bending fatigue. As a result of this, solutions avoiding micropitting of gear teeth are gaining interest with recent studies including the investigation of improved surface finishes, optimized microgeometry to minimize applied stress, modification of near surface residual stresses and the use of coatings. Zhang [31] investigated influence of shot-peening and surface finish on the fatigue of gears. A superfinished surface was found to be the most resistant to contact fatigue damage whereas shot peening resulted in a rougher tooth surface and a decreased contact fatigue life. Britton [32] used a special four-gear rig to determine gear tooth frictional losses and found that superfinishing resulted in a reduction of friction of typically 30 percent with correspondingly lower tooth surface temperatures under the same conditions of load and speed. Frazer [33] optimized micro-geometry to minimize applied stress for low friction losses. Moorthy [34] found that both BALINITs C and Nb–Scoated gears showed enhanced resistance to micro-pitting damage by removing localized stress concentration at microvalleys present on as ground gears.
Micropitting has become a particular problem in the gear surface fatigue area over the last 20 years. Remarkable developments in micropitting studies have been achieved recently by many researchers and engineers on both theoretical and experimental fields. Large amounts of investigations are yet to be further launched to thoroughly understand the micropitting mechanism. Morales Espejel [35] studied the occurrence of micropitting damage in gear teeth contacts. In his study, an existing general micropitting model which accounts for mixed lubrication conditions, stress history and fatigue damage accumulation, was adapted to deal with the transient contact conditions that exist during gear teeth meshing. The model considered the concurrent effects of surface fatigue and mild wear on the evolution of tooth surface roughness and therefore captured the complexities of damage accumulation on tooth flanks in a more realistic manner than hitherto possible. Clarke [36] made progress towards an understanding of the basic mechanism of micropitting in gears based on analysis of the contact mechanics and elastohydrodynamic lubrication (EHL) of gear tooth surfaces under realistic operating conditions. Results are presented which demonstrate the crucial influence of EHL film thickness in relation to roughness on predicted contact and near-surface fatigue. Hohn [37] studied the effects of lubricant temperature, circumferential speed and tooth flank roughness, and showed major influences on the micropitting resistance of gear wheels. The lubrication film thickness and the surface roughness were found to be dominant parameters. The chemical characteristics of the lubricant, i.e., the base oil and its additives, are also important factors. However, currently there is no standard evaluation for determining micropitting risk although ISO TR 15144-1 [11] provides guidance on minimum film thickness, linking this to micropitting risk. The prediction of micropitting remains a challenging problem and needs to be investigated further.
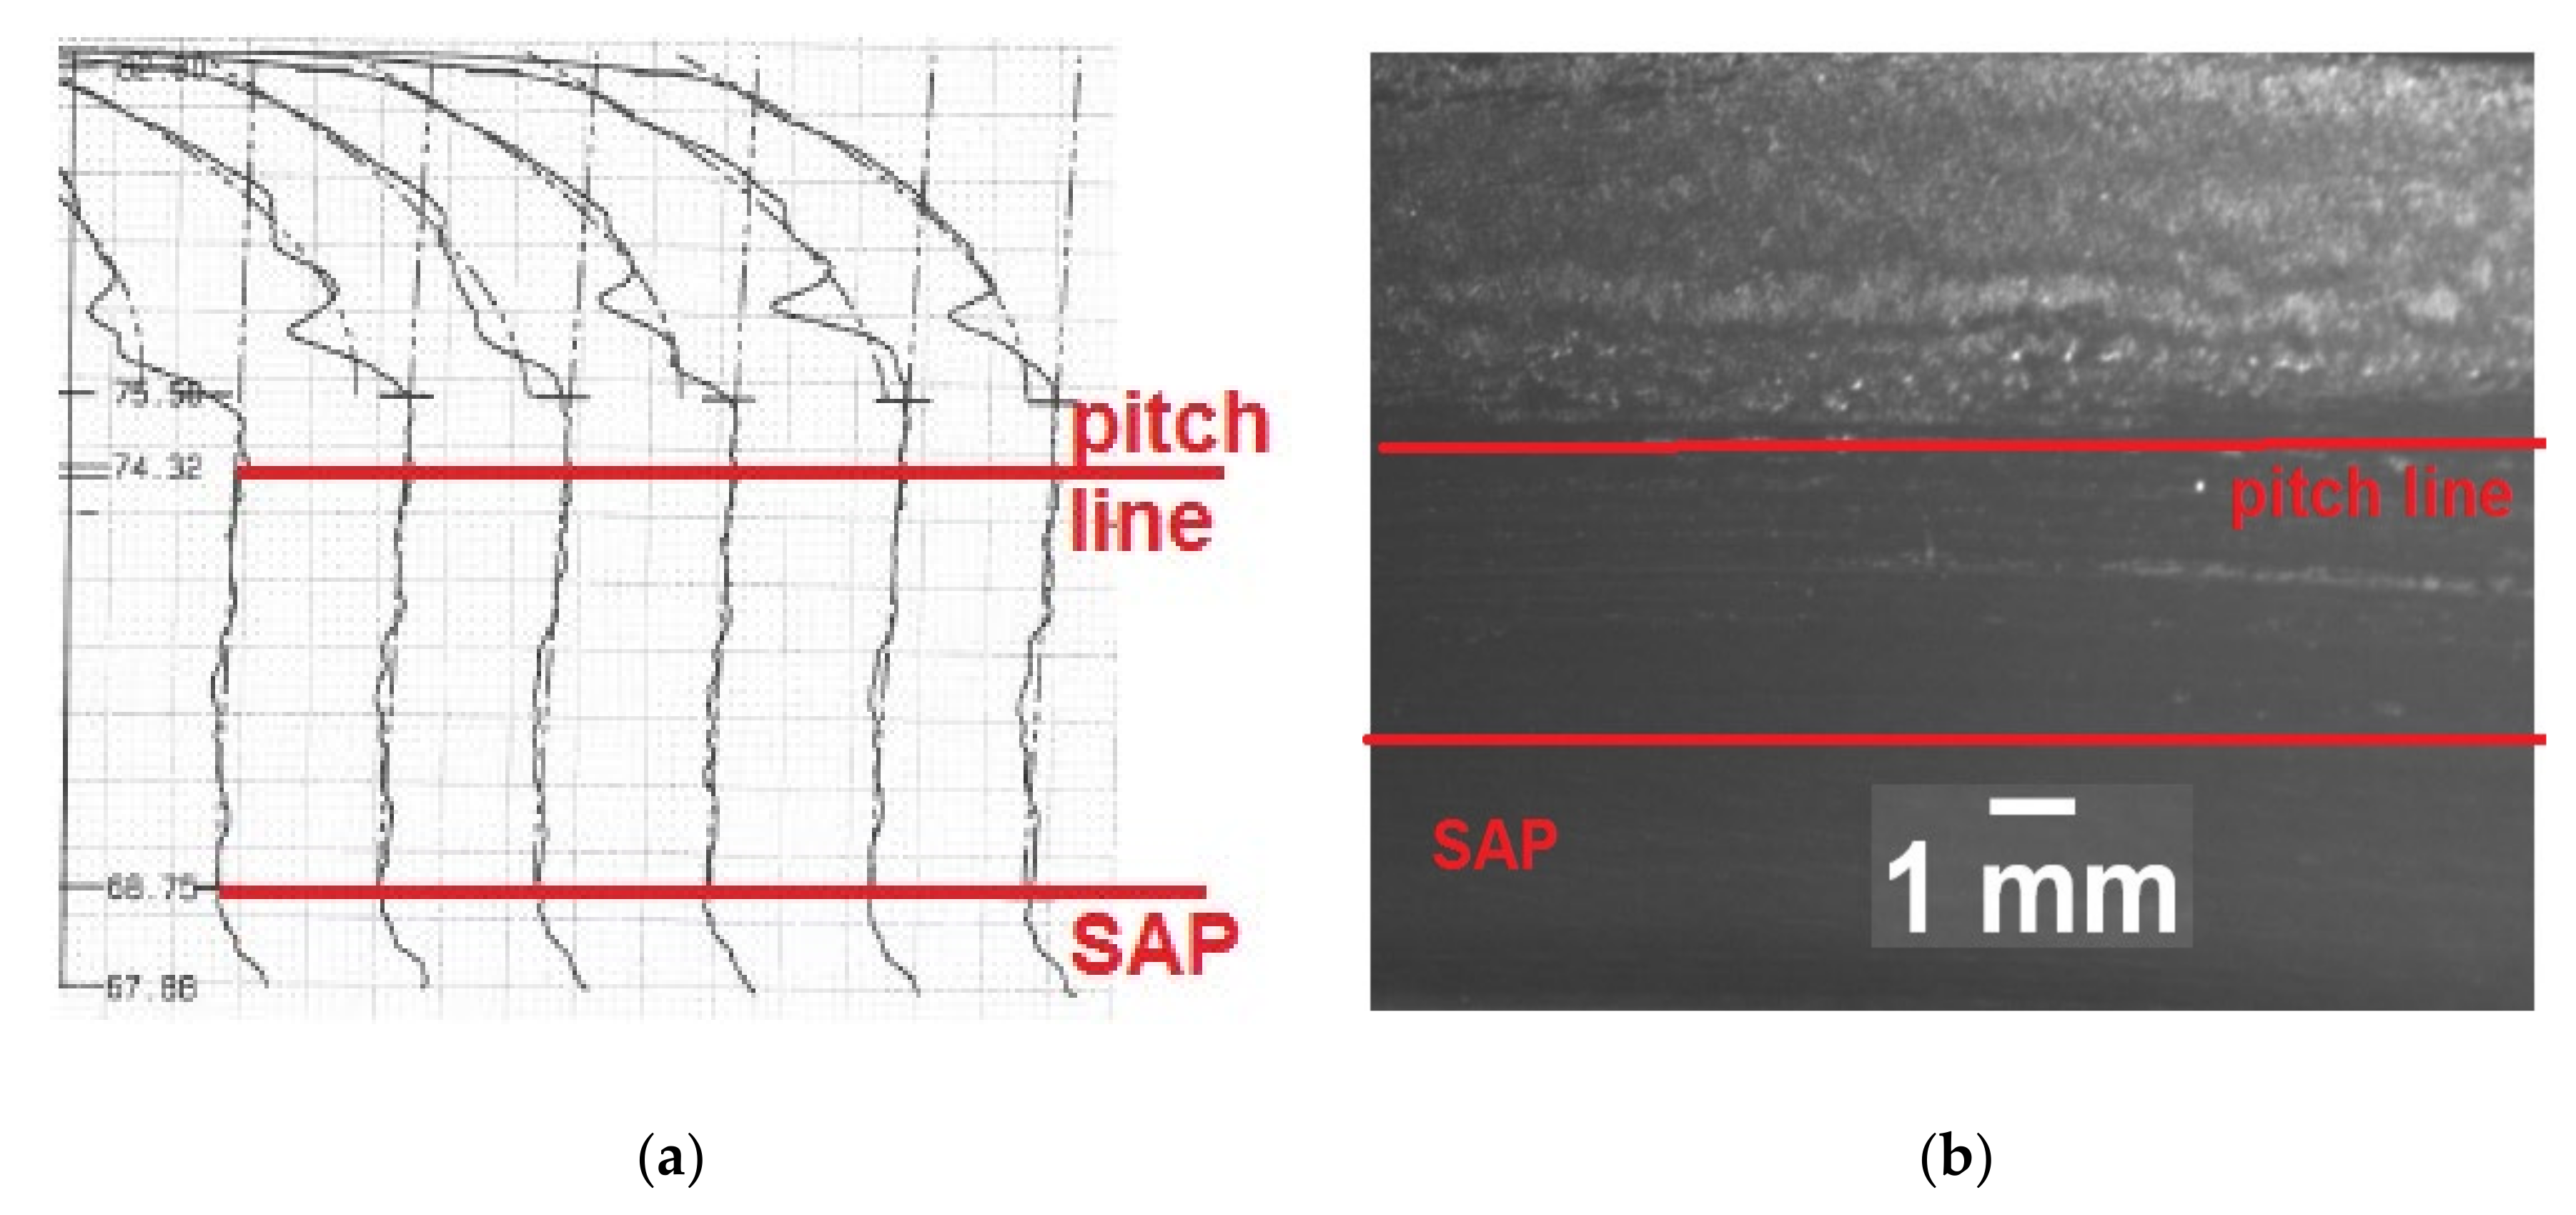
It was demonstrated [38] that the location of micropitting is close to the surface near the root of the teeth (dedendum). Brandão [39] developed a numerical model of surface-initiated failures and then verified it by applying an actual micropitting test on the carburized gears [40]. The results clearly showed that micropitting could be observed between the pitch line region and the tooth root after the loading period. Winkelmann [41] showed that the most common type of micropitting was wear and it mostly occurred in dedendum. However, authors found for some test gears connected with shafts by tapered hole interference fit (the gear geometry is shown in Table 1) in the Design Unit, Newcastle University, micropitting on the pinion occurs at the addendum (the tip region) as shown in Figure 3.
From Figure 3a, we can see that the biggest profile deviation used to represent micropitting occurs above pitch line (addendum). It can be seen from Figure 3b that the micropitting damage (the dull and grey part) is above the pitch line (addendum), which is very different from the usual phenomenon (micropitting in the root region), shown in Figure 2.
This study attempted to find the reason of micropitting occurring at addendum using an experimentally validated 3D–TCA method—Gear Analysis for Transmission Error and Stress (GATES) [42] based on ISO/TR 15144-1 [11] to predict the micropitting and tried to understand the key influences likely to affect micropitting location.

2. Prediction of Micropitting

Micropitting is a very complicated surface fatigue and involves material, lubrication, speed, load, temperature, surface roughness, etc. Currently, there is no standard for determining micropitting. However, some methods attempt to predict micropitting. ISO/TR 15144-1:2014 [11] is one of the methods and provides principles for calculation of micropitting load capacity of cylindrical involute spur and helical gears with external teeth. The basis for the calculation of the micropitting load capacity of a gear set is the model of the minimum operating specific lubricant film thickness in the contact zone. Although the calculation of specific lubricant film thickness does not provide a direct method for assessing micropitting load capacity, it can serve as an evaluation criterion when applied as part of a suitable comparative procedure based on known gear performance.
In ISO/TR 15144-1:2014, the calculation of micropitting load capacity is based on the local specific film thickness λGF,Y in the contact zone and the permissible specific film thickness λGFP. To account for micropitting load capacity, the safety factor Sλ according to Equation (1) is defined [11]:
S λ = λ GF , min λ GFP S λ , min
It is assumed that micropitting can occur when the safety factor is less than the minimum required safety factor. For the determination of the safety factor Sλ, the minimum specific film thickness has to be obtained from Equation (2):
λ G F , Y = h Y R a
where:
R a = 0.5 R a 1 + R a 2
h Y = 1600 · ρ n , Y · G M 0.6 · U Y 0.7 · W Y 0.13 · S G F , Y 0.22
where:
G M = 10 6 · α θ M · E r
U Y = η θ M · v , Y 2000 · E r · ρ n , Y
W Y = 2 · π · P d y n , Y 2 E r 2
S G F , Y = α θ B , Y · η θ B , Y α θ M · η θ M
The symbols are explained in the nomenclature section. There are no standard values for permissible specific film thickness. The determination of the permissible specific film thickness needs lots of experimental investigations and careful comparative studies, so it is very hard to obtain the exact permissible specific film thickness. Usually we just calculate the specific film thickness. Although the calculation of specific film thickness does not provide a direct method for assessing micropitting risk, it can serve as an evaluation criterion of comparative analysis.
In this study, we just calculate the specific film thickness to do some comparative analysis using GATES, an experimentally validated 3D–TCA method. This TCA method is based on ISO/TR 15144-1:2014 [11], using a full 3D FEA stiffness model to estimate the gear stiffness as the 1st stage and a 2nd stage tooth contact analysis to estimate the specific film thickness and other functional parameters. Its primary advantage is to predict specific film thickness by applying manufacturing deviations and specifying micro geometry corrections to consistent with the actual state of gears.
The procedures to calculate specific film thickness in GATES are as follows:
(1)
Define the gear macro geometry, including tooth number, module, pressure angle, helix angle, face width, profile shift coefficient, tip diameter, root diameter and etc.
(2)
Input rating parameters, including material data, duty cycle, quality and roughness, application data, misalignment, lubrication and etc.
(3)
Input additional micropitting data, including lubricant viscosity at 40 °C and 100 °C, lubricant density at 15 °C, lubricant inlet temperature, lubricant method and etc. which are required in ISO/TR 15144-1:2014 [11].
(4)
Check micropitting report in the theoretical analysis package Dontyne.
(5)
Run GATES-TCA to check some results related with micropitting including sliding velocity, contact temperature and specific film thickness.
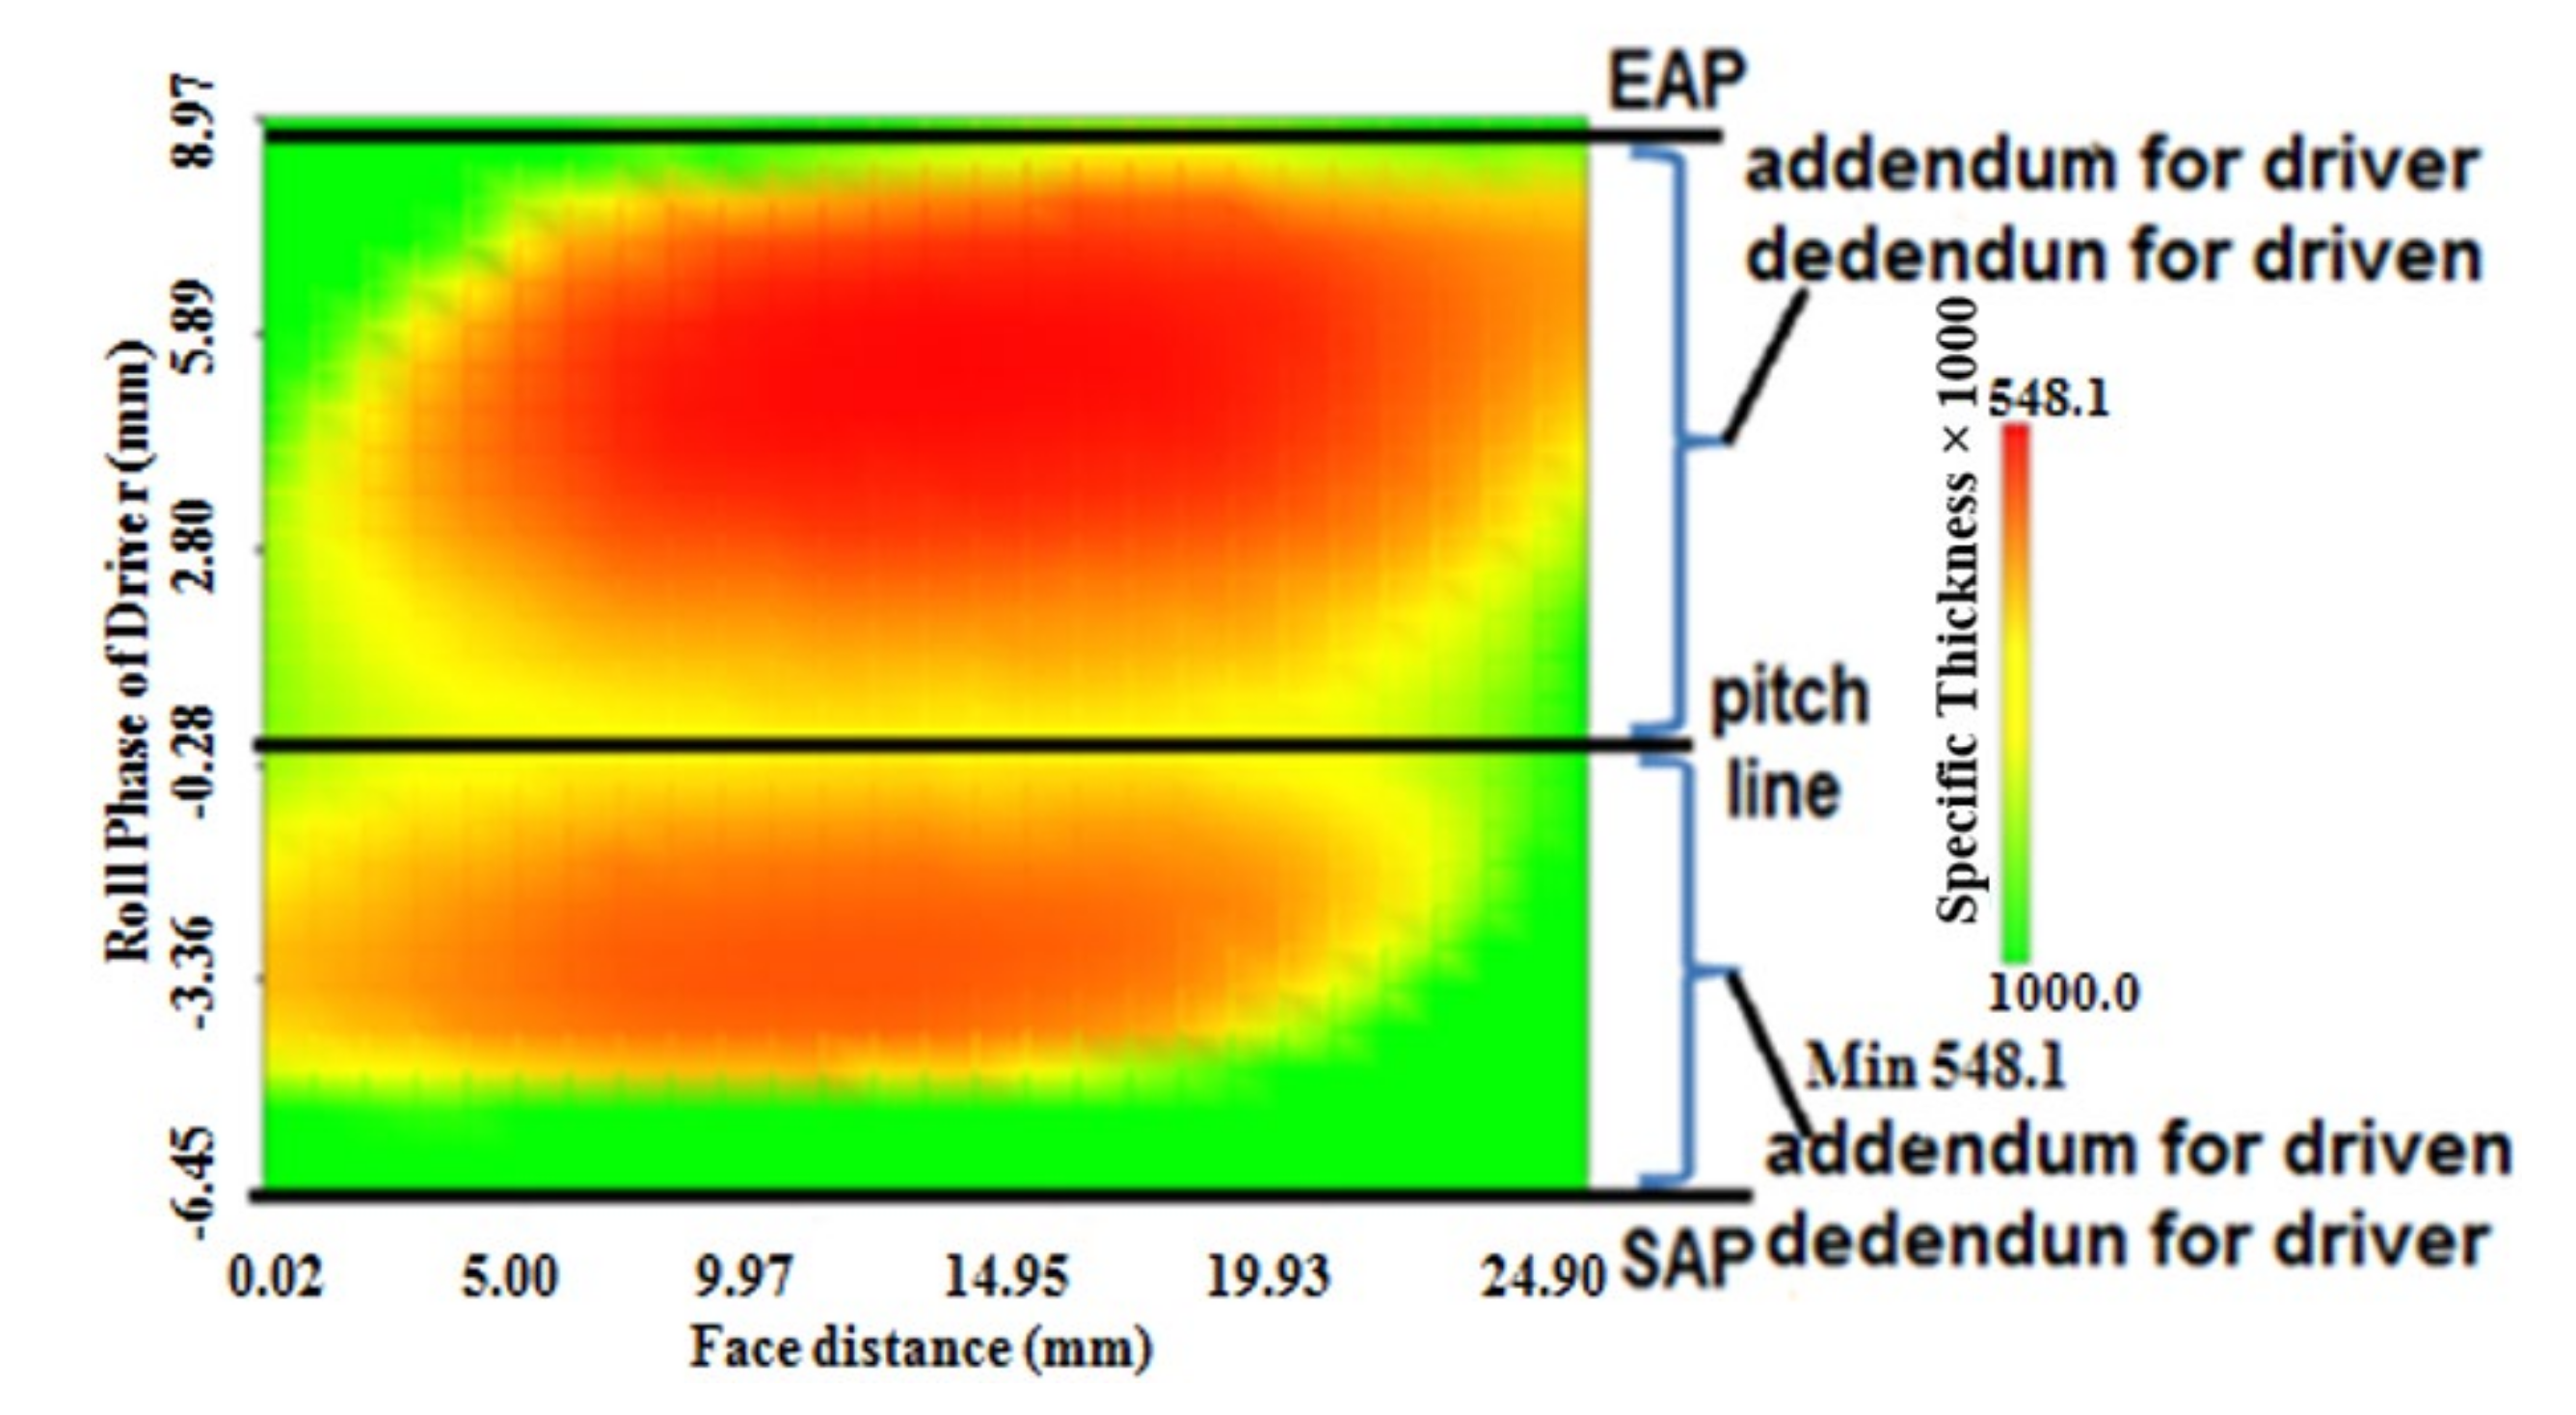
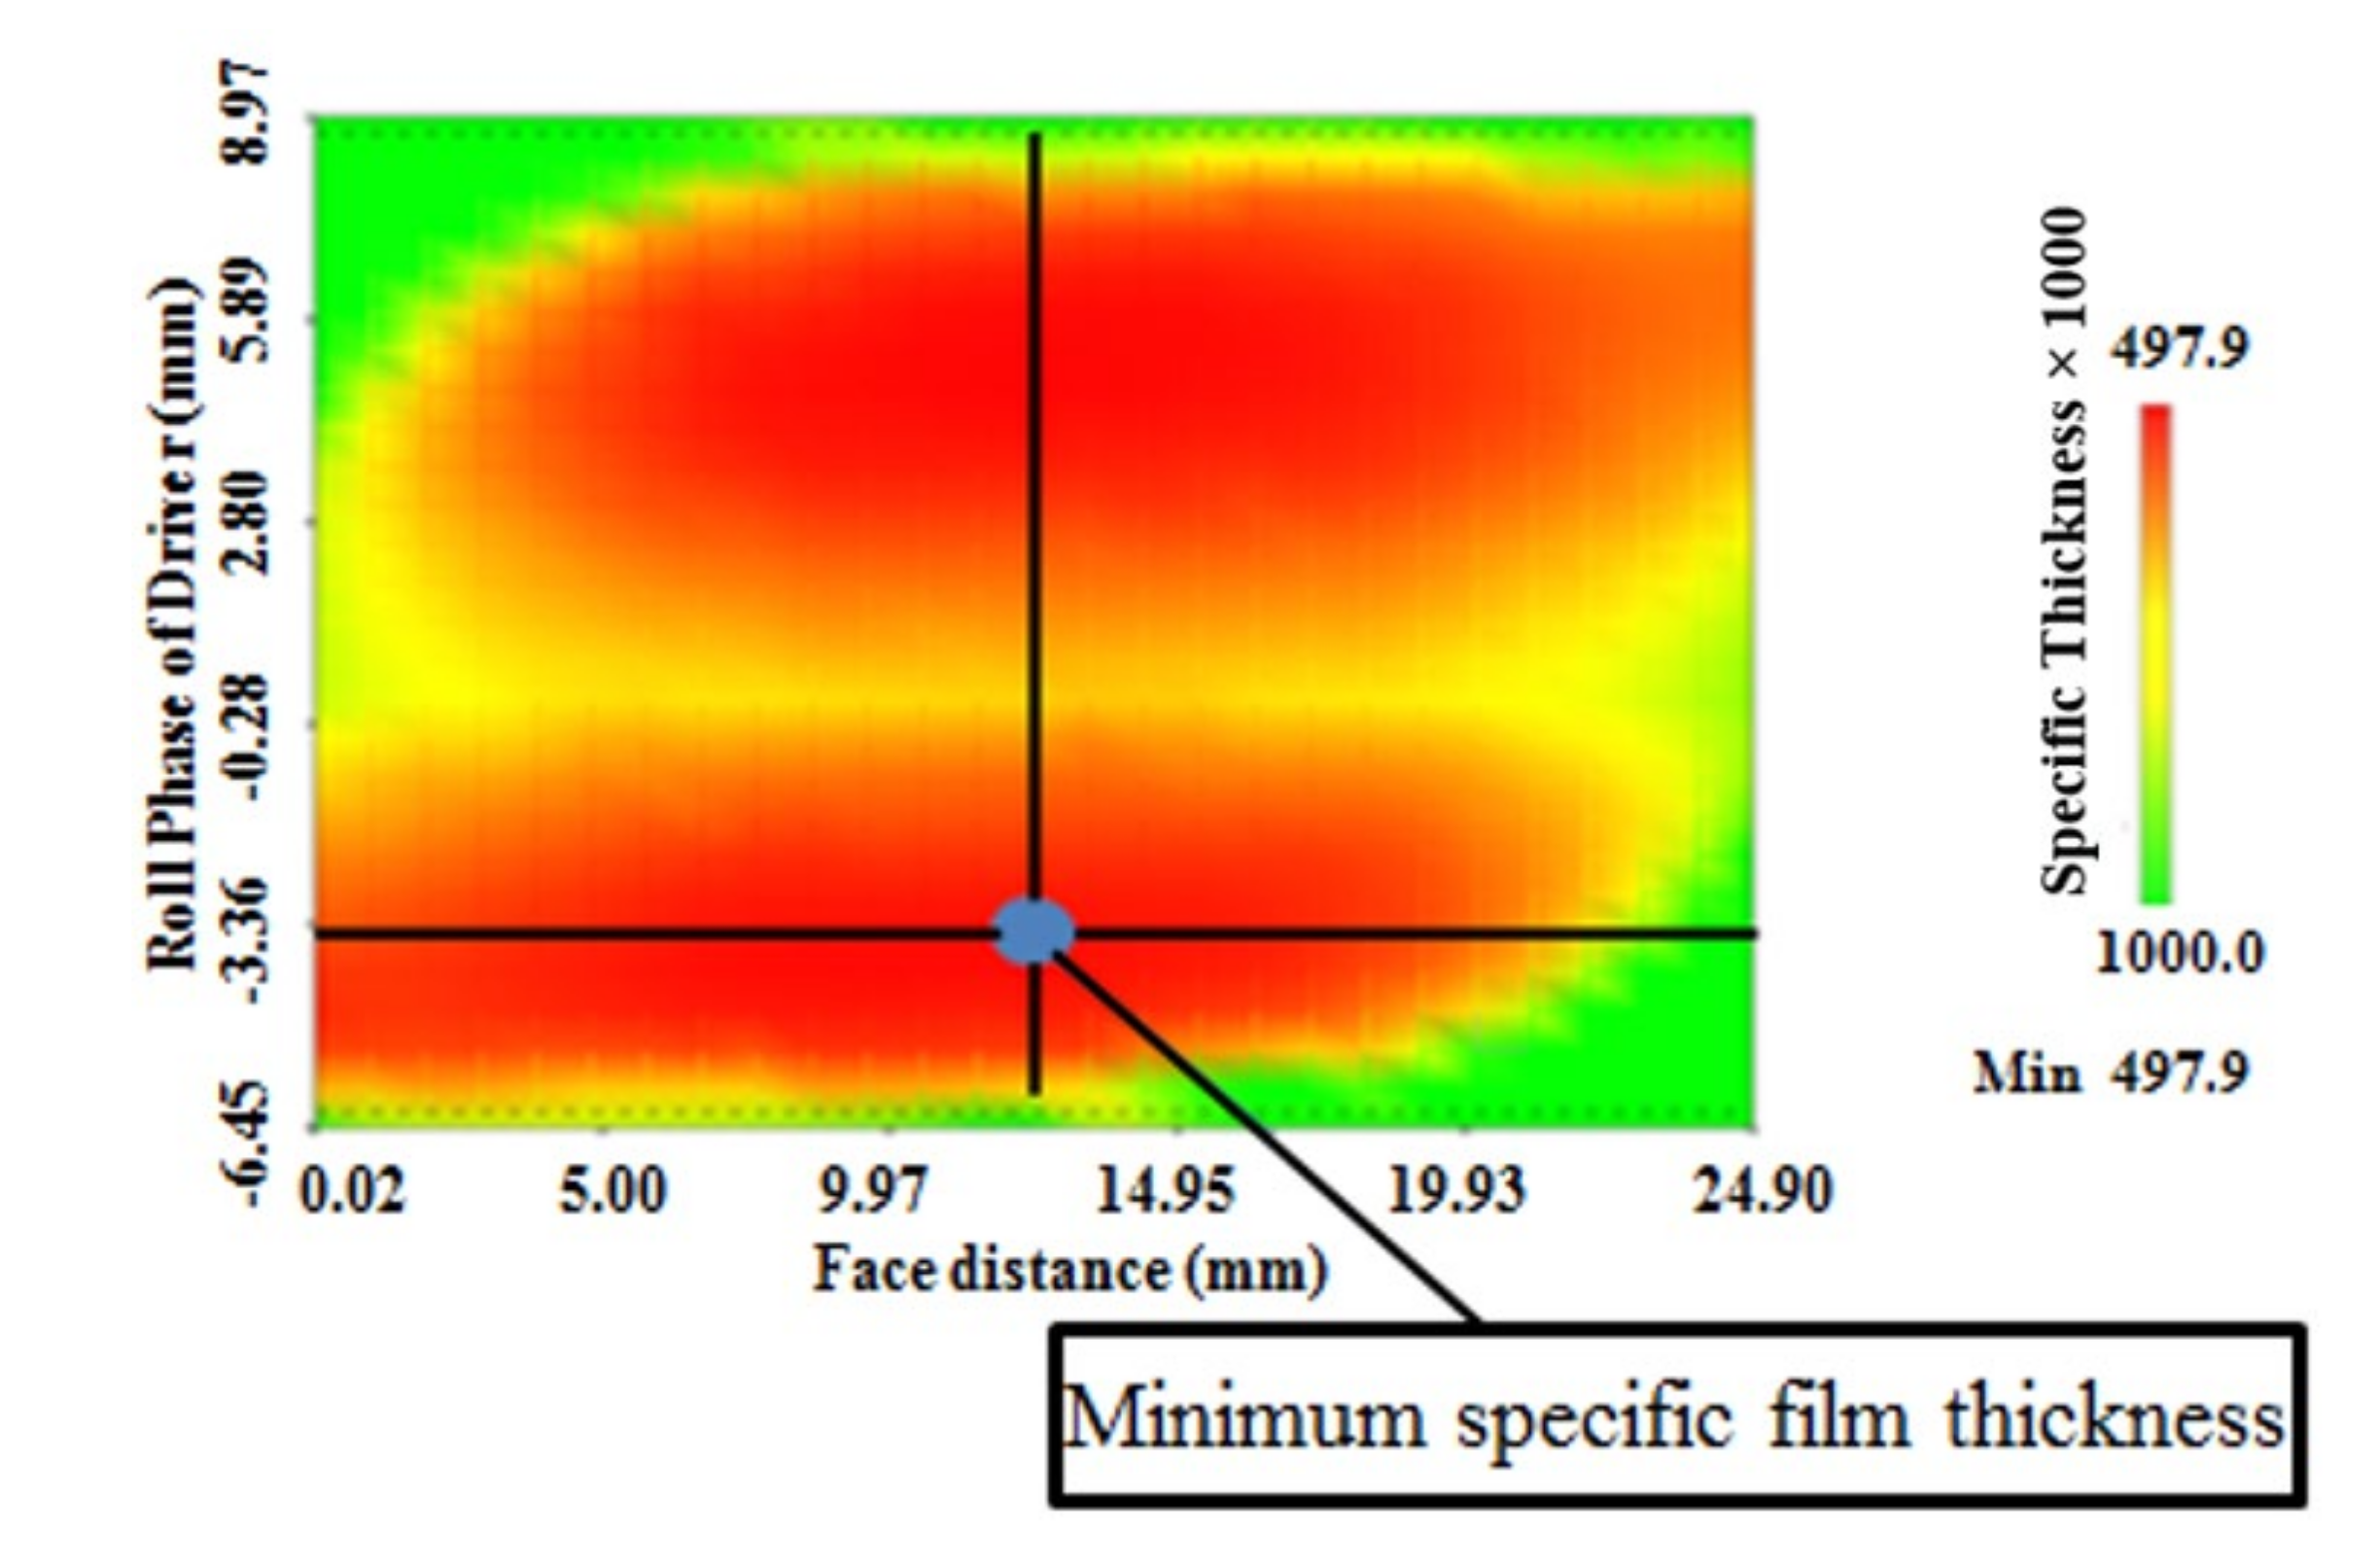
A specific film thickness result determined by GATES is shown in Figure 4. From Figure 4, we can see that the X-axis represents gear’s facewidth, Y-axis represents the roll phase of driver, different colors represent different value of specific film thickness, the deepest red indicates the minimum specific film thickness. The area between SAP and pitch line of driver symbolizes the dedendum of driver and addendum of driven. The area between pitch line and EAP of driver symbolizes the addendum of driver and dedendum of driven. We can clearly see the amount and distribution of specific film thickness from GATES-3D result contour. We will use it to do the later comparative analysis.

3. Measurement Procedures

In order to find the reason of micropitting problem mentioned above, we did some tests of gears with all known parameters in the Design Unit, Newcastle University.
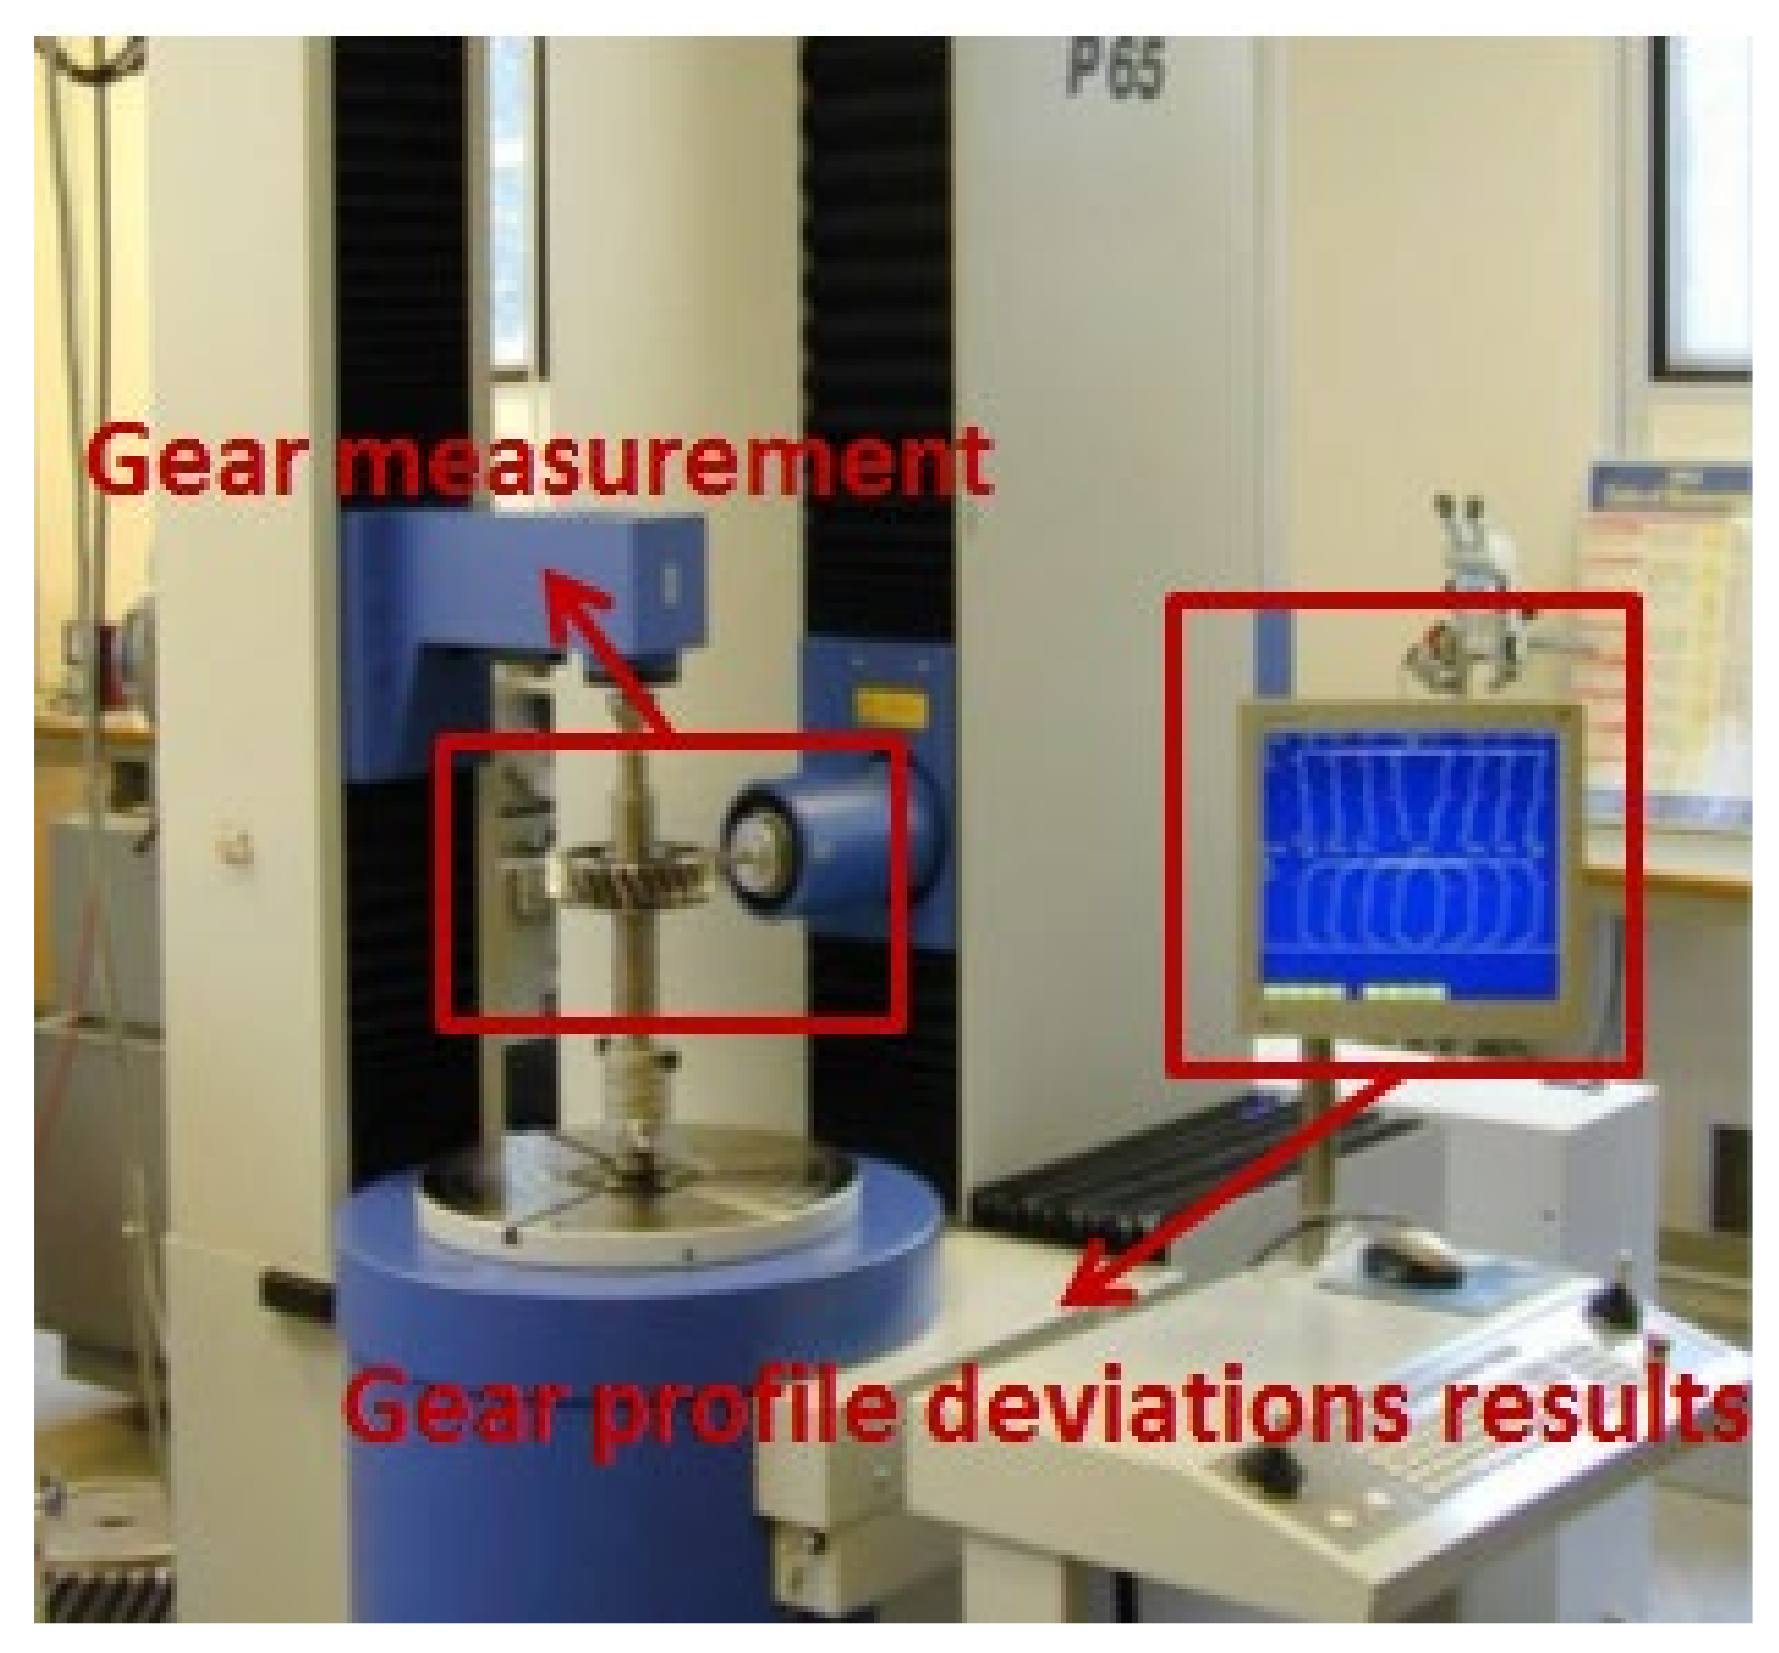
Before test, we measured the gears on a Klingelnberg P65 gear measuring machine (produced by Klingelnberg Co. Ltd., Ettlingen, Germany) that uses an involute generation measurement method to measure gear profile form deviations (Figure 5) to record the original profile/lead deviation and other parameters.
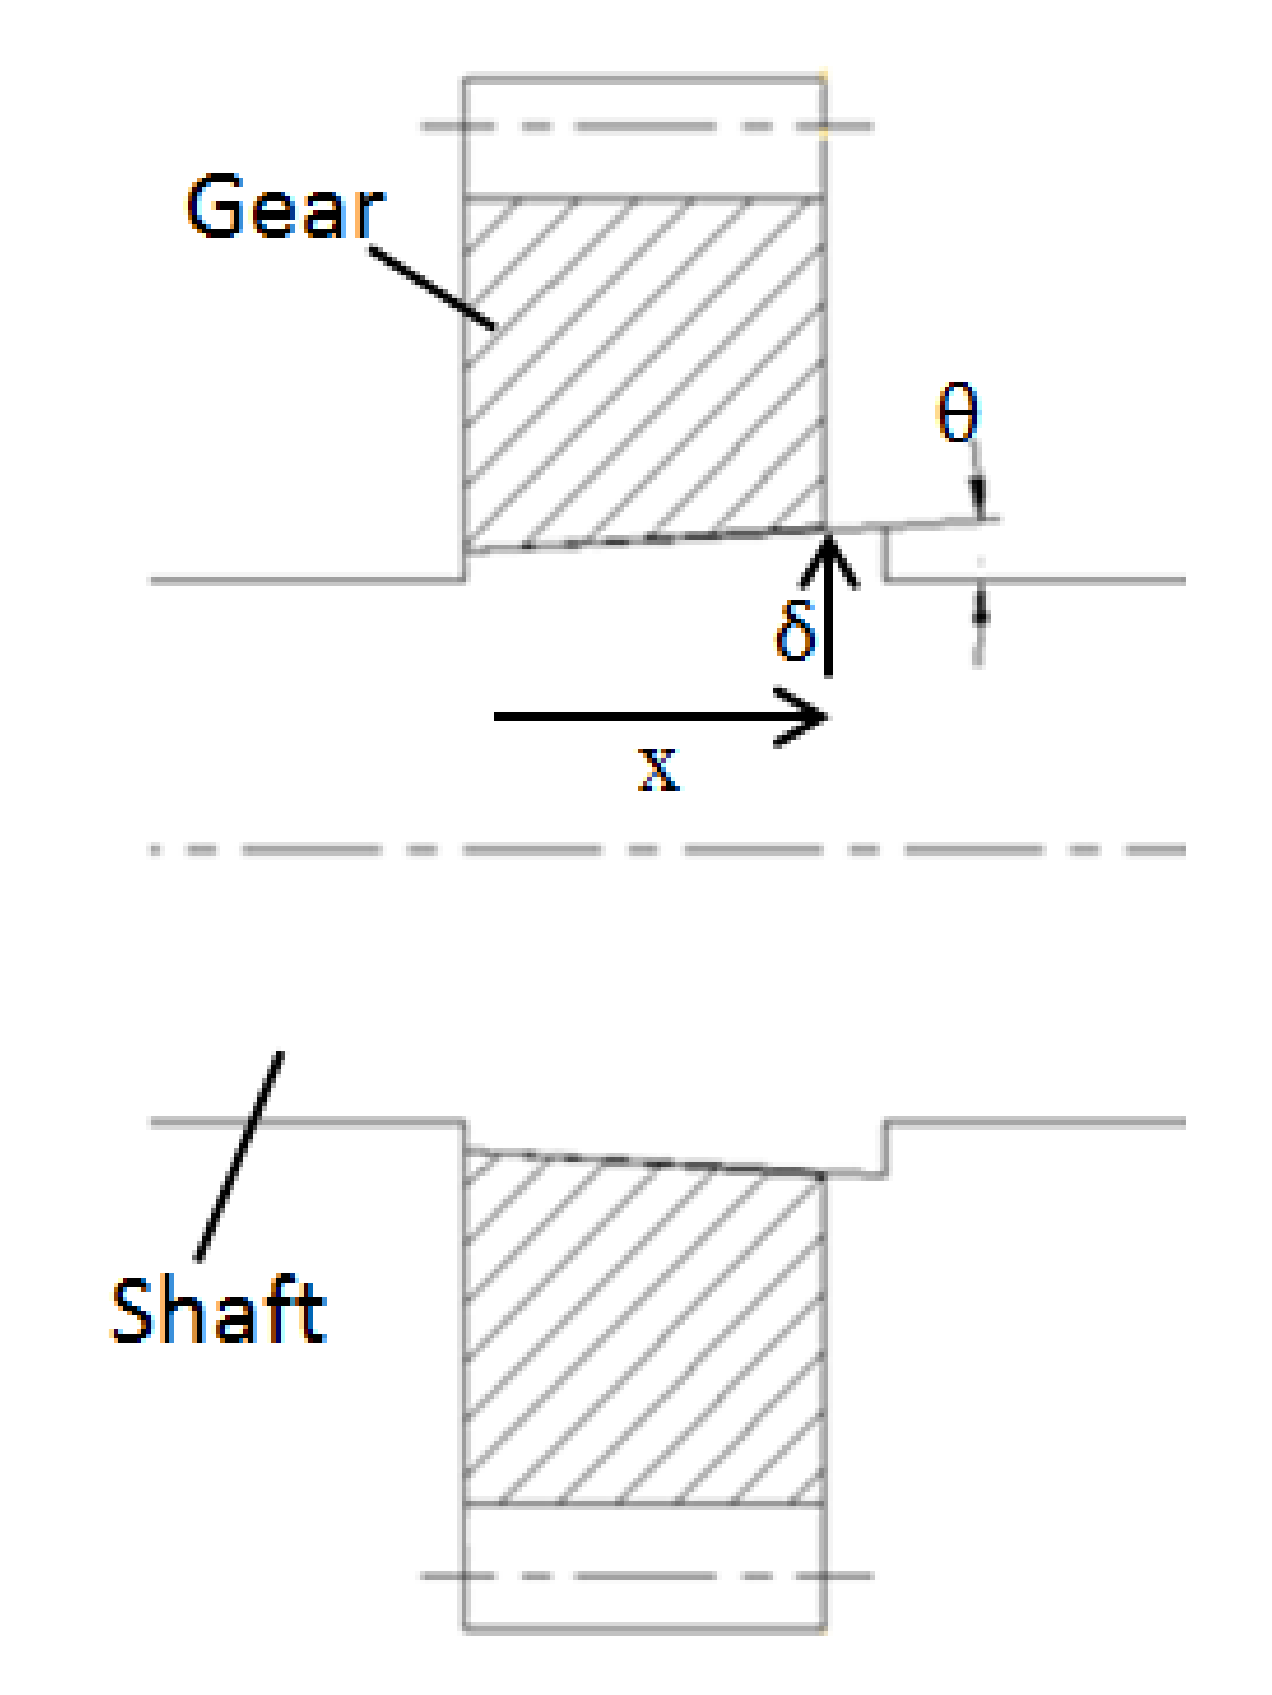
The test gears and shafts are connected by interference fit connection of their conical surface. Before test, gears must be pulled up on shaft to ensure accurate location and enough interference between gear bore and shaft must be guaranteed to transfer torque. The relationship between the distances of pulling up (x) and interference (δ) shown in Figure 6 is given by the following expression:
δ = x · tan θ
where θ is the angle of taper, tanθ = 1/60 for the test gears.
In order to ensure that the connection of gear and shaft still has good tightness after multiple assembly and disassembly operations, the assembly and disassembly of gear with interference fit connection of conical surface adopts the hydraulic method, that is, injecting high-pressure oil between the mating surfaces, so as to increase the outer diameter of the hub housing and reduce the inner diameter of the shaft, it makes assembly and disassembly of the gear easily and also reduces the scratching on the mating surface. When using this method, it is necessary to open oil holes and grooves on the wheel hub, and special disassembly tools such as high-pressure oil pump, axial propeller, etc.
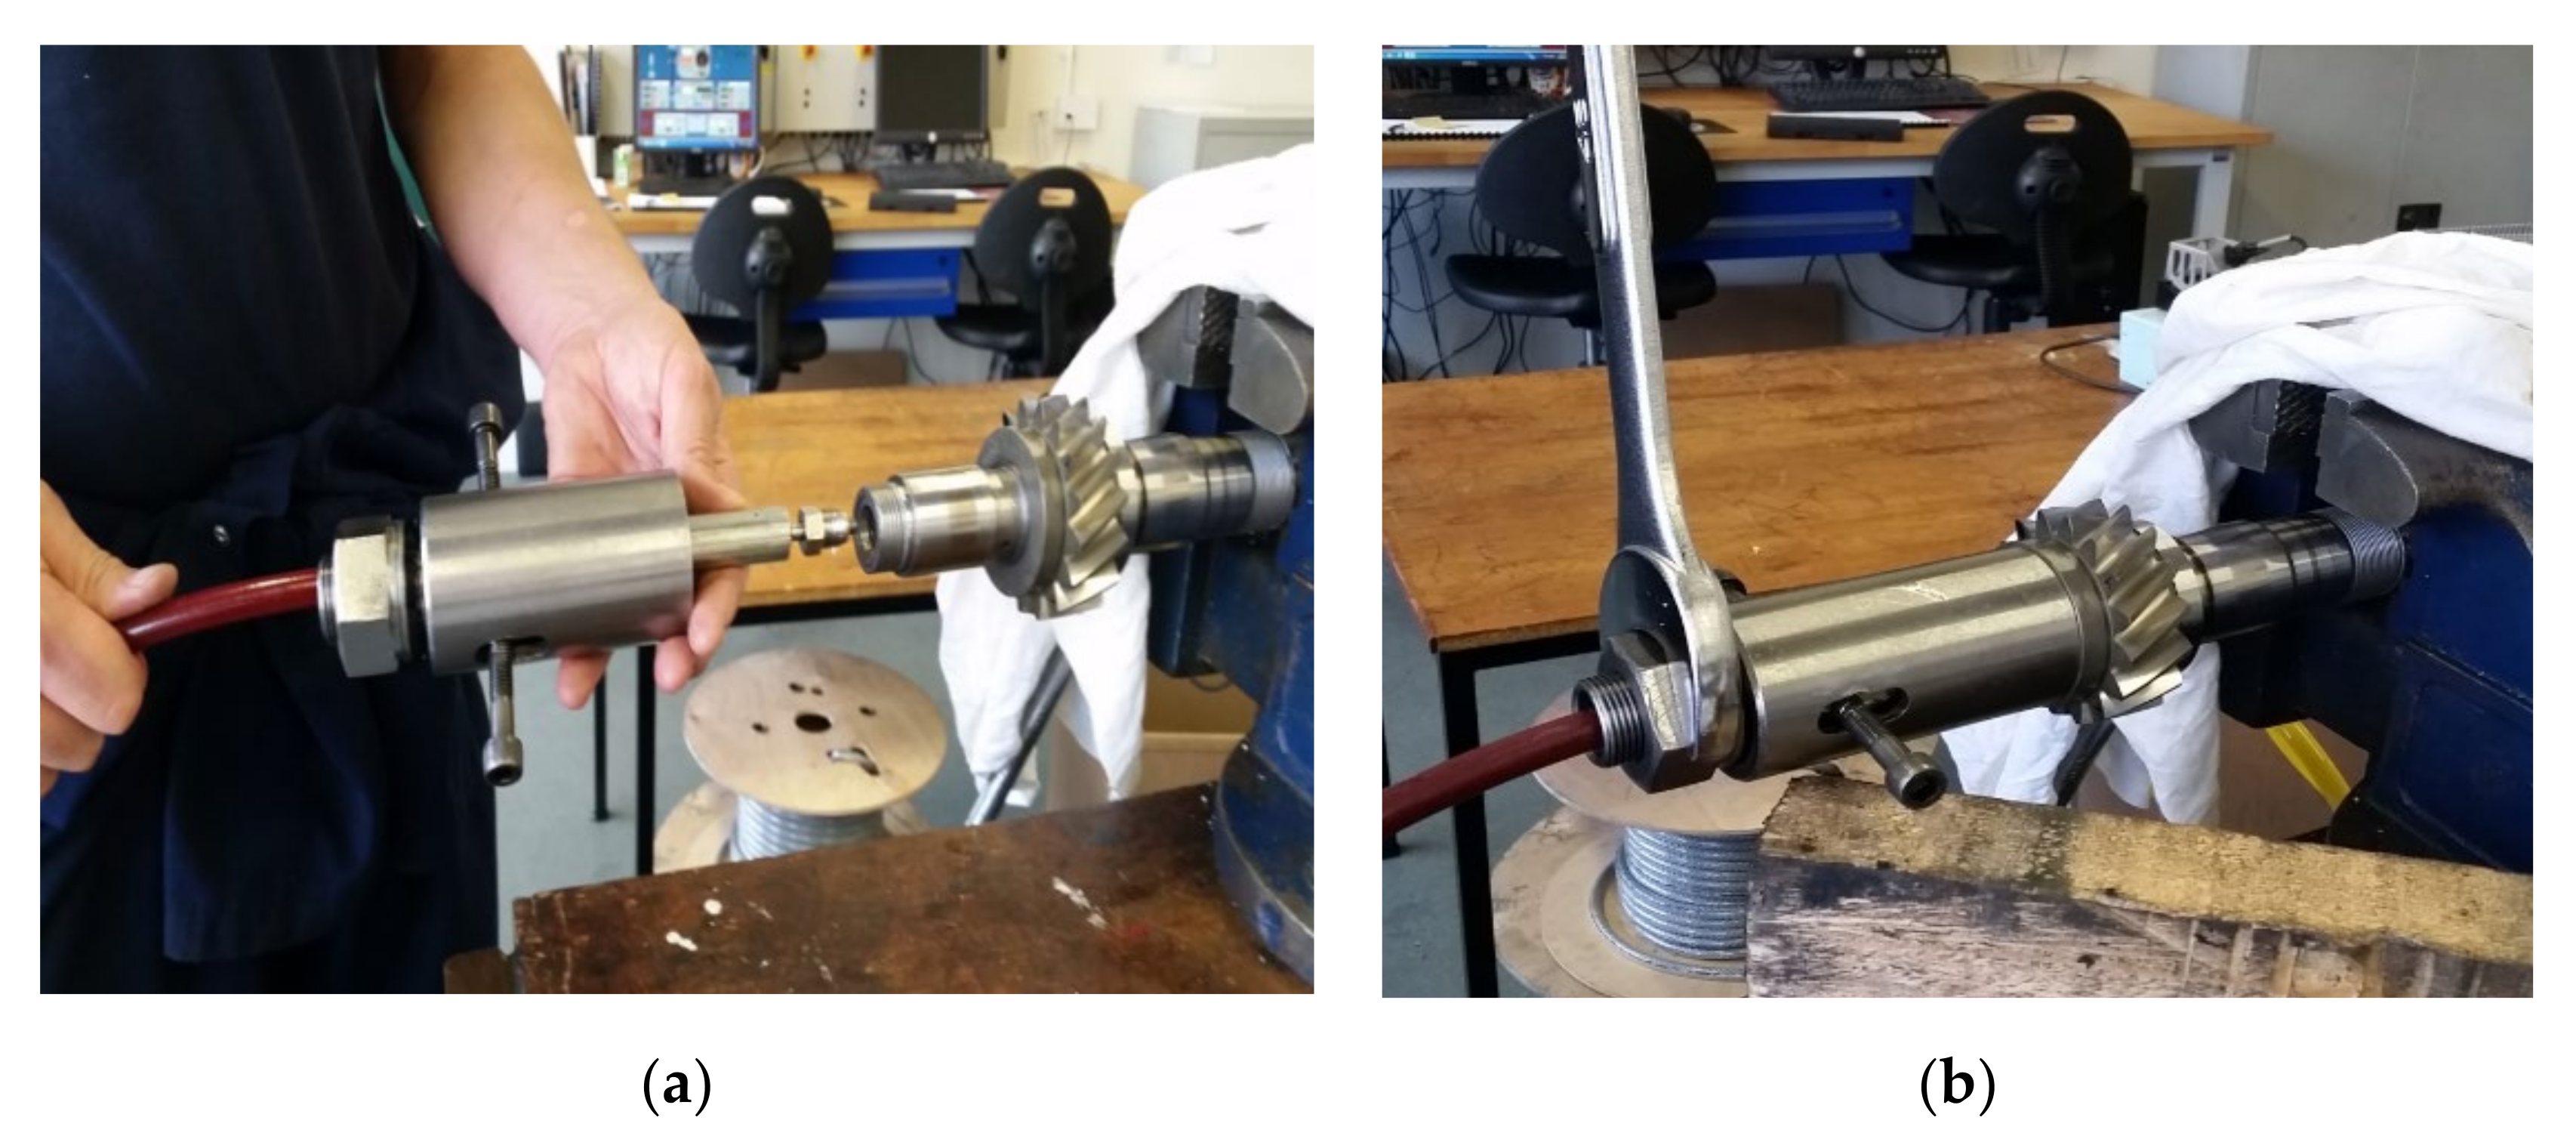
The procedures of pulling up gear on shaft showed in Figure 7 are as follows:
(1)
Clean the assembly joint surface of gear and shaft with clean lubricating oil.
(2)
Put the gear set on the shaft, turn it gently by hand, and push it up at the same time.
(3)
Press the axial propulsion piston of the axial propeller into the guide cylinder, and then install the axial propeller on the shaft, and the axial propulsion piston can contact with the hub.
(4)
Connect the oil pump and the pipeline to the shaft and the axial propeller, respectively.
(5)
Start the high-pressure oil pump, inject oil into the oil hole on the shaft first, and then close the oil return valve after reaching a certain oil pressure to keep the oil pressure unchanged. The oil pressure value can be determined by GB/T 15755-1995 [43].
(6)
Then, oil is injected into the axial thruster, and the axial propulsion piston pops out and the gear is pushed in. The distance of gear moving axially is the distance of pulling up.
(7)
Open the return valve of the high-pressure oil pump; release the oil pressure of the high-pressure oil pump after releasing the oil pressure on the shaft.
(8)
After installation, remove the oil injection pipeline and axial thruster.
The steps of pulling out gears with interference fit connection of conical surface are as follows:
(1)
In order to prevent the hub from popping out and damaging the parts, install the axial propeller on the shaft first, and leave a certain clearance between the hub and the axial press in device
(2)
Connect the oil filling pipeline of the high-pressure oil pump to the oil filling hole of the shaft, and inject oil to a certain oil pressure (which can be determined by GB/T 15755-1995 [43]), and the rear wheel will pop out automatically
(3)
Remove the oil injection pipeline and axial compressor.
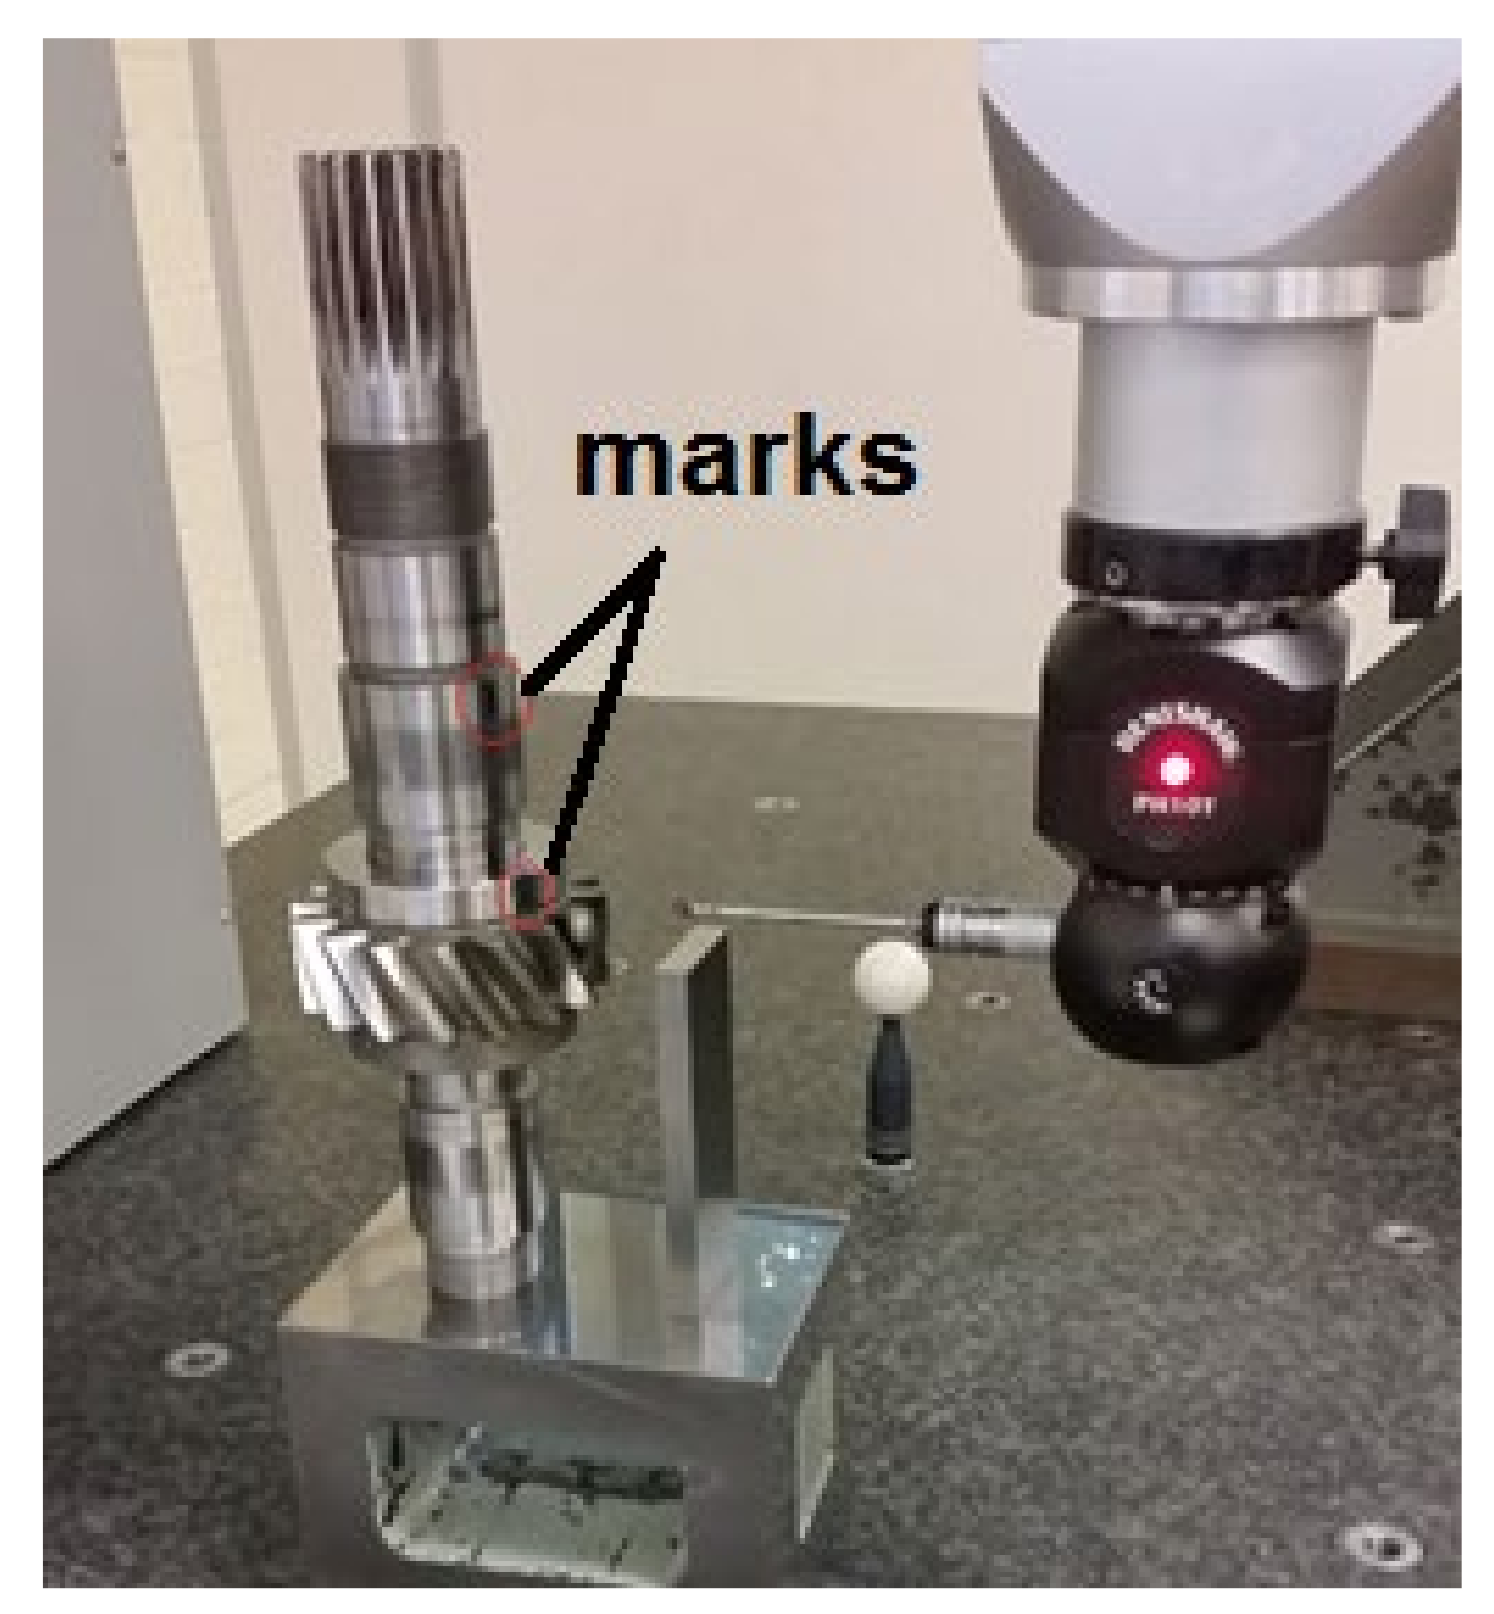
To ensure the exact distance of pulling up are known, we measured the position of gears on shaft using an Endeavor 122010 coordinate measuring machine (CMM) (produced by Sheffield Company, Ruskin, FL, USA, and its measurement resolution is 0.1 μm) before and after pulling up. The measurement process is shown in Figure 8.
To make sure we measure the same location of gears, we made some marks on the gear hub and shaft as shown in Figure 8. After pulling up, we measured the gears on the Klingelnberg P65 gear measuring machine again to record the change of profile /lead deviation and other parameters.
4. Results and Discussion

4.1. Measurement Results

We chose one test gear pair to measurement. Gears were pulled up with very different distances, shown in Table 2.
We measured the gears before and after pulling up in gear measuring machine Klingelnberg P65, the profile slope deviation (f) were showed in Table 3.
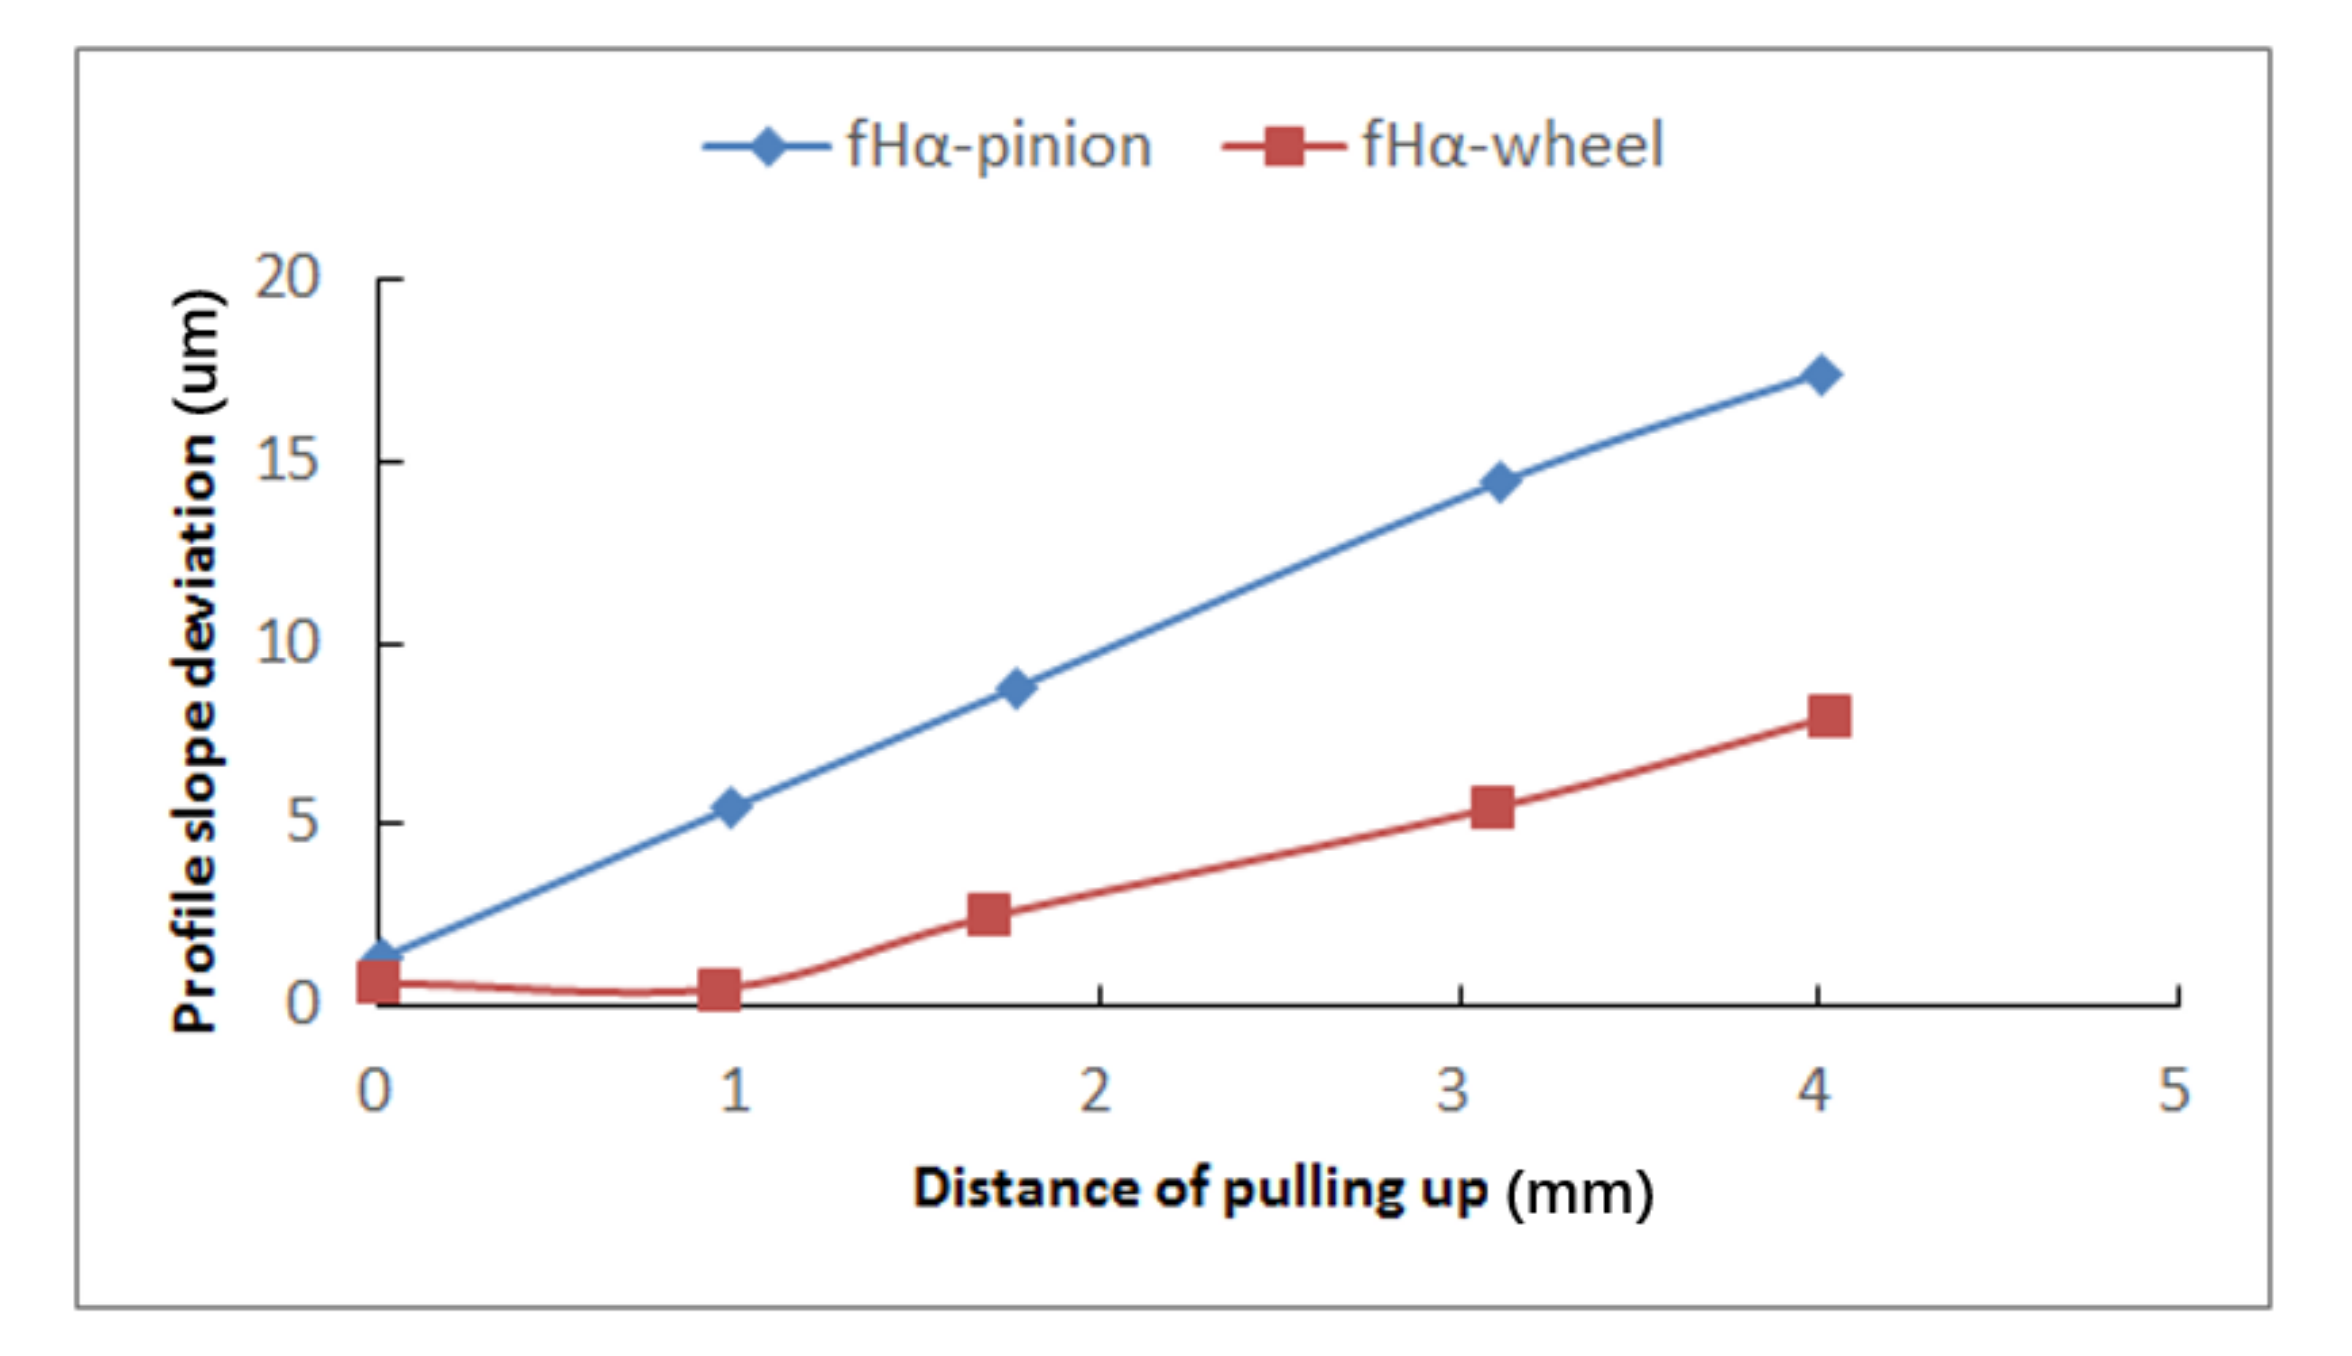
It is obvious that the pulling up distance influences the profile slope deviation (f) of the pinion and wheel, the profile slope deviation of the pinion is greater than that of the wheel with a similar pulling up distance and the bigger the pulling up, the greater the difference, which we can clearly see from Figure 9.
In the process of pulling up, we know that it is difficult to control the pulling up distance so it is hard to ensure the distance of pulling up for pinion and wheel is the same. We found that when the distance of pulling up is equal to or slightly greater than 3.0 mm, the end of the gears will reach the edge of shaft shoulder, so for those test gears, the maximum distance of pulling up may be 3.0 mm or slightly greater than 3.0 mm. From the process of pulling up, we also found that it is easier to pull up the pinion than the wheel, so the distances of pulling up for the pinion and wheel are probably different, as represented in Table 4. We can see that the difference profile slope deviation between pinion and wheel are 9–10 um when the distance of pulling up is close to 3.0 mm, and the profile slope deviation of pinion is greater than wheel.

4.2. Simulation Results

We simulated test gears using GATES analysis based on measurement data showed in Table 3 to predict specific film thickness (which can be used to evaluate micropitting) at one load stage. Some results are shown in Figure 10 and Figure 11.
From Figure 10 and Figure 11, we can clearly see that the minimum specific film thickness of the pinion does change from dedendum to addendum when the pulling up distance changes from 0 mm to 3.1 mm.
We compared all the minimum specific film thicknesses on the dedendum and addendum at mid-facewidth which is comparable to measurement data and replica images. The results are listed in Table 5.
From Table 5, we can see that the location of minimum specific film thickness will change from dedendum to addendum for the pinion when the pulling up distance is greater than 1.7. For this test gear pair, the distance of pulling up is usually 3.0 mm or slightly greater than 3.0 mm, so the location of minimum specific film thickness (micropiting) of the pinion may occur in the addendum.

4.3. Discussions

In order to understand the key influences likely to affect the location of micropitting, some other parameters were also investigated, including profile shift coefficient, start of tip relief and lead slope deviation. The results are as follows.

4.3.1. The Influence of Profile Shift Coefficient on Location of Micropitting

From Table 1, we can see that the biggest difference between test pinion and wheel is the profile shift coefficient (x1 = 0.29, x2 = 0). If the difference profile shift coefficient can lead to different micropitting results, we checked it taking four kinds of combination of profile shift coefficient. The results from GATES are shown in Table 6.
Misalignment and manufacturing deviation are not considered in this calculation. From Table 6, we can see that the different profile shift coefficients between pinion and wheel do influence the location of micropitting if the profile shift coefficient of the pinion is bigger enough than that of the wheel. For example, the minimum specific film thickness on the addendum is less than on the dedendum for the condition of x1 = 0.5, x2 = 0.
However, the profile shift coefficient of those test gears (x1 = 0.29, x2 = 0) is not enough to change the location of minimum specific film thickness. F. If the profile shift coefficient is the reason, and all gears would have the same results, so we can conclude that the current profile shift coefficient is not the reason for the uncommon micropitting location results.

4.3.2. The Influence of Start of Tip Relief on Location of Micropitting

For those test gears, tip reliefs are applied to reduce transmission error. The start of tip relief of pinion is at 75.58 mm diameter which is between pitch diameter (73.2 mm) and highest point of single tooth contact (HPSTC) diameter (79.572 mm), the start of the tip relief of the wheel is at 110.14 mm diameter which is also between pitch diameter (109.8 mm) and HPSTC diameter (113.665 mm). If the start of tip relief can affect the location of minimum specific film thickness, we can recalculated the micropitting by changing the start of tip relief to check the results.
From Table 7, we can see that no matter whether the start of tip relief is at the pitch diameter or HPSTC diameter or between them, the minimum specific film thickness is always at the dedendum, so the current start of tip relief also isn’t the reason of the uncommon micropitting location results.

4.3.3. The Influence of Lead Slope Deviation on Location of Micropitting

From the above, we can see the differences of profile slope deviation between pinion and wheel influence the location of the minimum specific film thickness. To see if the differences of lead slope deviation (f) have the same influence we defined different lead slope deviations to check the results, including fHβ1 = 5 μm and fHβ2 = 0, fHβ1 = 10 μm and fHβ2 = 0, fHβ1 = 15 μm and fHβ2 = 0, fHβ1 = 20 μm and fHβ2 = 0, fHβ1 = 0 and fHβ2 = 5 μm, fHβ1 = 0 and fHβ2 = 10 μm, fHβ1 = 0 and fHβ2 = 15 μm, fHβ1 = 0 and fHβ2 = 20 μm, where, fHβ1 is the lead slope deviation of pinion, fHβ2 is the lead slope deviation of wheel. The results of micropitting from GATES are shown in Table 8.
From Table 8, it is obvious that the difference of lead slope deviation between the pinion and wheel cannot affect the location of the minimum specific film thickness and the minimum specific film thickness always occurs at the dedendum, so we can conclude that the lead slope deviation is not the reason for the uncommon micropitting location results.
For some test gears with interference fit connections of their conical surface, micropitting on the pinion occurs at the addendum, which is very different from the usual phenomenon (micropitting in the dedendum). We tried to find the reasons from all aspects we can think of, including profile slope deviation, profile shift coefficient, start of tip relief and lead slope deviation. From the calculation results, we can know that the profile shift coefficient, start of tip relief and lead slope deviation are not the possible reasons of the problem. From the results of minimum specific film thickness influenced by profile slope deviation which is caused by pulling up, we did find that if the profile slope deviation of pinion is much greater than that of the wheel, the position of minimum specific film thickness of pinion will be changed from the dedendum to the addendum, so the difference of profile slope deviation between the pinion and wheel caused by pulling up is a probable reason affecting the location of micropitting.

5. Conclusions

From the measurement and simulation presented in this study, the following conclusions can be drawn:
(1)
Profile shift coefficient, start of tip relief and lead slope deviation cannot affect the location of micropitting.
(2)
Pulling up gears with interference fit connection of their conical surface can affect the profile slope deviation.
(3)
For the test gears with interference fit connection of the conical surface, profile slope deviations on pinion resulting from pulling up are always greater than those of the wheel and the bigger the pulling up, the greater this difference is.
(4)
For those studied test gears, pulling up can lead to a 9–10 μm difference of profile slope deviation between the pinion and wheel.
(5)
The difference of profile slope deviation between pinion and wheel may affect the micropitting location. If the profile slope deviation of the pinion is much greater than that of the wheel, the minimum specific film thickness on the pinion can change from the dedendum to addendum. This is a probable reason for the mcropitting on the test pinion with interference fit connection of the conical surface occurring at the addendum.

Author Contributions

Conceptualization, L.Z. and Y.S.; methodology, L.Z.; software, L.Z.; validation, L.Z., Y.S., M.D., Y.Y., and J.B.; formal analysis, M.D.; investigation, Y.Y.; resources, J.B.; data curation, L.Z.; writing—original draft preparation, L.Z.; writing—review and editing, M.D.; visualization, M.D.; supervision, Y.S.; project administration, L.Z. All authors have read and agreed to the published version of the manuscript.

Funding

This research received no external funding.

Acknowledgments

The authors gratefully acknowledge the support from the Design Unit, Newcastle University UK, which provided technical support for gear measurement.

Conflicts of Interest

The authors declare no conflict of interest. The funders had no role in the design of the study; in the collection, analyses, or interpretation of data; in the writing of the manuscript, or in the decision to publish the results.

Nomenclature

λGF,minThe minimum specific lubricant film thickness in the contact area
λGF,YThe local specific lubricant film thickness
λGFPThe permissible specific lubricant film thickness
Sλ,minThe minimum required safety factor
RaThe effective arithmetic mean roughness value, um
Ra1The arithmetic mean roughness value of pinion, um
Ra2The arithmetic mean roughness value of wheel, um
hYThe local lubricant film thickness, um
ρn,YThe normal radius of relative curvature at point Y, mm
GMThe material parameter
UYThe local velocity parameter
WYThe local load parameter
SGF,YThe local sliding parameter
αθMThe pressure-viscosity coefficient at bulk temperature, m2/N
ErThe reduced modulus of elasticity, N/mm2
ŋθMThe dynamic viscosity of the lubricant at bulk temperature, N·s/m2
v∑,YSum of tangential velocities, m/s
Pdyn,YThe local Hertzian contact stress, N/mm2
αθB,YThe pressure-viscosity coefficient at local contact temperature, m2/N
ŋθB,YThe dynamic viscosity at local contact temperature, N·s/m2
fThe profile slope deviation, μm
f1The profile slope deviation of pinion, μm
f2The profile slope deviation of wheel, μm
x1The profile shift coefficient of pinion
x2The profile shift coefficient of wheel
f1The lead slope deviation of pinion, μm
f2The lead slope deviation of wheel, μm

References

  1. Brandão, J.A.; Martins, R.C.; Seabra, J.H.O.; Castro, M.J. Calculation of gear tooth flank surface wear during an FZG micropitting test. Wear 2014, 311, 31–39. [Google Scholar] [CrossRef]
  2. Sheng, S. Wind Turbine Micropitting Workshop: A Recap; National Renewable Energy Laboratory: Golden, CO, USA, 2010. [Google Scholar]
  3. Clarke, A.; Weeks, I.J.J.; Snidle, R.W.; Evans, H.P. Running-in and micropitting behavior of steel surfaces under mixed lubrication conditions. Tribol. Int. 2016, 101, 59–68. [Google Scholar] [CrossRef] [Green Version]
  4. Al-Mayali, M.F.; Hutt, S.; Sharif, K.J.; Clarke, A.; Evans, H.P. Experimental and Numerical Study of Micropitting Initiation in Real Rough Surfaces in a Micro-elastohydrodynamic Lubrication Regime. Tribol. Lett. 2018, 66, 150. [Google Scholar] [CrossRef] [PubMed] [Green Version]
  5. Weibring, M.; Gondecki, L.; Tenberge, P. Simulation of fatigue failure on tooth flanks in consideration of pitting initiation and growth. Tribol. Int. 2019, 131, 299–307. [Google Scholar] [CrossRef]
  6. Zhou, Y.; Zhu, C.; Gould, B.; Demas, N.G.; Liu, H.; Greco, A.C. The effect of contact severity on micropitting: Simulation and experiments. Tribol. Int. 2019, 138, 463–472. [Google Scholar] [CrossRef]
  7. Evans, H.P.; Snidle, R.W.; Sharif, K.J.; Shaw, B.A.; Zhang, J. Analysis of Micro-Elastohydrodynamic Lubrication and Prediction of Surface Fatigue Damage in Micropitting Tests on Helical Gears. J. Tribol. 2012, 135, 011501. [Google Scholar] [CrossRef]
  8. Oila, A. Micro-Pitting and Related Phenomena in Case-Carburised Gears. Ph.D. Thesis, Newcastle University, Newcastle upon Tyne, UK, 2003. [Google Scholar]
  9. Hu, Y.-Z.; Zhu, D. A Full Numerical Solution to the Mixed Lubrication in Point Contacts. J. Tribol. 2000, 122, 1–9. [Google Scholar] [CrossRef]
  10. D’Errico, F. Micro-pitting damage mechanism on hardened and tempered, nitrided and carburizing steels. Metall. Ital. 2012, 104, 5–11. [Google Scholar]
  11. ISO/TR 15144-1. Calculation of Micropitting Load Capacity of Cylindrical Spur and Helical Gears—Introduction and Basic Principles: 2014; International Organization for Standardization: Geneva, Switzerland, 2014. [Google Scholar]
  12. Effect of Lubrication on Gear Surface Distress; AGMA: Alexandria, VA, USA, 2003.
  13. Berthe, D.; Flamand, L.; Foucher, D.; Godet, M. Micro-pitting in Hertzian contacts. Trans. ASME J. Lubr. Tech. 1980, 102, 478–489. [Google Scholar] [CrossRef]
  14. Spikes, H.; Olver, A.; MacPherson, P. Wear in rolling contacts. Wear 1986, 112, 121–144. [Google Scholar] [CrossRef]
  15. Zhou, R.S.; Cheng, H.S.; Mura, T. Micropitting in Rolling and Sliding Contact Under Mixed Lubrication. J. Tribol. 1989, 111, 605–613. [Google Scholar] [CrossRef]
  16. Webster, M.N.; Norbart, C.J.J. An Experimental Investigation of Micropitting Using a Roller Disk Machine. Tribol. Trans. 1995, 38, 883–893. [Google Scholar] [CrossRef]
  17. Shotter, B.A. Micropitting: Its characteristics and implications, in performance and testing of gear oils and transmission fluids. Inst. Pet. 1981, 53, 320–323. [Google Scholar]
  18. Zhao, J.; Sadeghi, F.; Michael, H. Analysis of EHL Circular Contact Start Up: Part I—Mixed Contact Model with Pressure and Film Thickness Results. J. Tribol. 2001, 123, 67–74. [Google Scholar] [CrossRef]
  19. O’Connor, B.M. The influence of additive chemistry on micropitting. Gear Technol. 2005, 22, 34–41. [Google Scholar]
  20. Snidle, R.W.; Evans, H.P.; Alanou, M.; Holmes, M. Understanding Scuffing and Micropitting of Gears. In The Control and Reduction of Wear in Military Platforms, Proceedings of the RTO AVT Specialists’ Meeting on “The Control and Reduction of Wear in Military Platforms”; RTO-MP-AVT-109, Williamsburg, VA, USA, 7–9 June 2003; NATO STO: Williamsburg, VA, USA, 2004. [Google Scholar]
  21. Oila, A.; Bull, S. Assessment of the factors influencing micropitting in rolling/sliding contacts. Wear 2005, 258, 1510–1524. [Google Scholar] [CrossRef]
  22. Roy, S.; Ooi, G.T.C.; Sundararajan, S. Effect of retained austenite on micropitting behavior of carburized AISI 8620 steel under boundary lubrication. Mater. 2018, 3, 192–201. [Google Scholar] [CrossRef]
  23. Sun, Y.; Bailey, R. Effect of sliding conditions on micropitting behaviour of AISI 304 stainless steel in chloride containing solution. Corros. Sci. 2018, 139, 197–205. [Google Scholar] [CrossRef] [Green Version]
  24. Cen, H.; Morina, A.; Neville, A. Effect of slide to roll ratio on the micropitting behaviour in rolling-sliding contacts lubricated with ZDDP-containing lubricants. Tribol. Int. 2018, 122, 210–217. [Google Scholar] [CrossRef]
  25. Guangteng, G.; Spikes, H. An Experimental Study of Film Thickness in the Mixed Lubrication Regime. Tribol. Ser. 1997, 32, 159–166. [Google Scholar] [CrossRef]
  26. Soltanahmadi, S.; Morina, A.; Van Eijk, M.C.P.; Nedelcu, I.; Neville, A. Investigation of the effect of a diamine-based friction modifier on micropitting and the properties of tribofilms in rolling-sliding contacts. J. Phys. D Appl. Phys. 2016, 49, 505302. [Google Scholar] [CrossRef]
  27. Rycerz, P.; Olver, A.; Kadiric, A. Propagation of surface initiated rolling contact fatigue cracks in bearing steel. Int. J. Fatigue 2017, 97, 29–38. [Google Scholar] [CrossRef] [Green Version]
  28. Maya-Johnson, S.; Santa, J.F.; Toro, A. Dry and lubricated wear of rail steel under rolling contact fatigue—Wear mechanisms and crack growth. Wear 2017, 240–250. [Google Scholar] [CrossRef]
  29. Hutt, S.; Clarke, A.; Evans, H. Generation of Acoustic Emission from the running-in and subsequent micropitting of a mixed-elastohydrodynamic contact. Tribol. Int. 2018, 119, 270–280. [Google Scholar] [CrossRef]
  30. Lainé, E.; Olver, A.; Beveridge, T. Effect of lubricants on micropitting and wear. Tribol. Int. 2008, 41, 1049–1055. [Google Scholar] [CrossRef]
  31. Zhang, J. Influence of Shot-Peening and Surface Finish on the Fatigue of Gears. Ph.D. Thesis, Newcastle University, Newcastle upon Tyne, UK, 2005. [Google Scholar]
  32. Britton, R.D.; Elcoate, C.D.; Alanou, M.P.; Evans, H.P.; Snidle, R.W. Effect of Surface Finish on Gear Tooth Friction. J. Tribol. 1999, 122, 354–360. [Google Scholar] [CrossRef]
  33. Frazer, R.C.; Shaw, B.A.; Palmer, D.; Fish, M. Optimizing Gear Geometry for Minimum Transmission Error, Mesh Friction, Losses and Scuffing Risk through Computer Aided Engineering. (AGMA Technical Paper 09FTM07). In Proceedings of the AGMA Fall Technical Meeting, Alexandria, VA, USA, 2009. Available online: https://www.geartechnology.com/articles/0810/Optimizing_Gear_Geometry_for_Minimum_Transmission_Error,_Mesh_Friction_Losses_and_Scuffing_Risk_Through_Computer-_Aided_Engineering/ (accessed on 8 August 2020).
  34. Moorthy, V.; Shaw, B.A. An observation on the initiation of micro-pitting damage in a s-ground and coated gears during contact fatigue. Wear 2013, 297, 878–884. [Google Scholar] [CrossRef]
  35. Morales-Espejel, G.; Rycerz, P.; Kadiric, A. Prediction of micropitting damage in gear teeth contacts considering the concurrent effects of surface fatigue and mild wear. Wear 2018, 99–115. [Google Scholar] [CrossRef]
  36. Clarke, A.; Evans, H.; Snidle, R. Understanding micropitting in gears. Proc. Inst. Mech. Eng. Part C 2015, 230, 1276–1289. [Google Scholar] [CrossRef] [Green Version]
  37. Hohn, B.R.; Oster, P.; Schrade, U. Studies on the micropitting resistance of case-carburized gears—Industrial application of the new calculation method. VDI Ber. 2005, 1904, 1287–1307. [Google Scholar]
  38. Snidle, R.W.; Evans, H.P. Some aspects of gear tribology. Proc. Inst. Mech. Eng. Part C J. Mech. Eng. Sci. 2008, 223, 103–141. [Google Scholar] [CrossRef] [Green Version]
  39. Brandão, J.; Seabra, J.; Castro, J. Surface initiated tooth flank damage: Part I: Numerical model. Wear 2010, 268, 1–12. [Google Scholar] [CrossRef]
  40. Brandão, J.A.; Seabra, J.H.O.; Castro, M.J. Surface initiated tooth flank damage. Part II: Prediction of micropitting initiation and mass loss. Wear 2010, 268, 13–22. [Google Scholar] [CrossRef]
  41. Winkelmann, L. Surface Roughness and Micropitting, Proceedings of the Wind Turbine Tribology Seminar, Bromfield, Golden, CO, USA, 2010; National Renewable Energy Laboratory: Golden, CO, USA, 2010. [Google Scholar]
  42. Gear Production Suite Brochure; Dontyne Systems: Newcastle upon Tyne, UK, 2018.
  43. GB/T15755. The Calculation and Selection of Cone Interference Fits; Technical Committee for Standardization of Tolerances and Fits: Beijing, China, 1995. [Google Scholar]
Figure 1. Illustration of direction of growth of micro cracks on the gear teeth from reference [19].
Coatings 10 01224 g001
Figure 2. Gear tooth showing micropitting damage in the root region. (Design Unit, Newcastle University from reference [20]).
Coatings 10 01224 g002
Figure 3. Micropitting on a pinion of test gears (a) Measurement data from gear measurement machine, (b) Optical image of the pinion flank replica.
Coatings 10 01224 g003
Figure 4. Example of specific film thickness determined by GATES.
Coatings 10 01224 g004
Figure 5. Gear measurement before testing on a gear measurement machine.
Coatings 10 01224 g005
Figure 6. Relationship between pulling up x and interference δ.
Coatings 10 01224 g006
Figure 7. Pulling up gear on shaft. (a) putting the gear set on the shaft; (b) injecting oil into the oil hole on the shaft and gear is pushed in
Coatings 10 01224 g007
Figure 8. Measurement of gear location.4. Results and Discussion.
Coatings 10 01224 g008
Figure 9. Relationship between pulling up and profile slope deviation for pinion and wheel.
Coatings 10 01224 g009
Figure 10. Specific film thickness of pinion for distance of pulling up equal to 0 mm.
Coatings 10 01224 g010
Figure 11. Specific film thickness of pinion for distance of pulling up equal to 3.1 mm.
Coatings 10 01224 g011
Table 1. Gear parameters of test gears with interference fit connection of conical surface.
ParametersPinionWheelParametersPinionWheel
Z1624Number teeth spanned/K44
mn (mm)3.93.9Wk nom (mm)42.38542.268
αn (°)2020Wk min (mm)42.2842.17
β (°)3030Wk max (mm)42.1842.07
Hand of helixleftrightgrade55
x0.290Centre distance a (mm)91.591.5
h/mn2.42.4Surface roughness Ra (um)0.80.8
b (mm) 2525Nominal backlash (mm)0.249
da (mm)82.12115.88Backlash-max (mm)0.45
df (mm)63.497.16Backlash-min (mm)0.65
Table 2. Distance of pulling up of test gears.
Pulling Up StagePinionWheel
Z Position (mm)Distance of Pulling Up (mm)Z Position (mm)Distance of Pulling Up (mm)
0119.7489-120.1788-
1120.71930.9704121.12680.948
2121.5111.7621121.87631.6975
3122.85643.1075123.27443.0956
4123.74813.9992124.20644.0276
Table 3. Profile slope deviation of test gears before and after pulling up.
Pulling Up Stagef (um)
PinionWheel
01.3180.660
15.4440.495
28.7542.482
314.4185.475
417.4357.974
Table 4. Difference of profile slope deviation between pinion and wheel.
Distance of Pulling Up (mm)f1-f2 (μm)
Pinion (mm)Wheel (mm)
0.97040.9484.949
1.76211.69756.272
3.10753.09568.943
3.99924.02769.461
Table 5. Variation of specific film thickness with distance of pulling up changing.
Distance of Pulling Up (mm)Minimum Specific Film Thickness λ min × 1000 λ min dedendum λ min addendum
DedendumAddendum
0497.9527.60.944
1.0522.3523.30.998
1.7526.5521.81.009
3.1531.6519.11.024
4.0532.6519.11.026
Table 6. Minimum specific film thickness for different profile shift coefficient.
Profile Shift CoefficientMinimum Specific Film Thickness λ min × 1000 λ min dedendum λ min addendum
DedendumAddendum
x1 = 0.29, x2 = 01452240.647
x1 = 0.3834, x2 = 02232430.918
x1 = 0.5, x2 = 02502481.008
x1 = 0.8, x2 = 03202581.240
Note: The lubricant which is used to calculate the micropitting is different from the above calculation. It is no problem if we just check the trend.
Table 7. Minimum specific film thickness for different start of tip relief.
Start of Tip ReliefMinimum Specific Film Thickness λ min × 1000 λ min dedendum λ min addendum
DedendumAddendum
At pitch diameter232.7255.20.912
At HPSTC diameter222.3247.00.900
Between pitch diamete and HPSTC diameter240.2267.20.899
Table 8. Variation of minimum specific film thickness with different lead slope deviations.
Lead Slope Deviation (um)Minimum Specific Film Thickness × 1000 λ min dedendum λ min addendum
PinionWheelDedendumAddendum
00360.6365.60.986
50361.3364.80.990
100362.0364.80.992
150362.8364.70.995
200363.6364.70.997
05359.9365.40.985
010359.3365.20.984
015358.4365.10.982
020357.6365.20.979
Publisher’s Note: MDPI stays neutral with regard to jurisdictional claims in published maps and institutional affiliations.