Article

Production of Microbial Cellulose Films from Green Tea (Camellia Sinensis) Kombucha with Various Carbon Sources

by
Mayra Z. Treviño-Garza
1,
Ana S. Guerrero-Medina
2,
Ricardo A. González-Sánchez
3,
Celestino García-Gómez
2,
Antonio Guzmán-Velasco
1,
Juan G. Báez-González
1 and
Julia M. Márquez-Reyes
2,*
1
Facultad de Ciencias Biológicas, Universidad Autónoma de Nuevo León (UANL), Av. Pedro de Alba s/n, Cd. Universitaria, San Nicolás de los Garza 66455, Mexico
2
Facultad de Agronomía, Universidad Autónoma de Nuevo León (UANL), Francisco I. Madero S/N, Ex Hacienda el Cañada, Escobedo 66050, Mexico
3
Departamento de Innovación Biomédica, Centro de Investigación Científica y de Educación Superior de Ensenada, Carretera Ensenada-Tijuana, Ensenada 22860, Mexico
*
Author to whom correspondence should be addressed.
Coatings 2020, 10(11), 1132; https://doi.org/10.3390/coatings10111132
Submission received: 30 October 2020 / Revised: 18 November 2020 / Accepted: 18 November 2020 / Published: 22 November 2020

Abstract

:
The aim of this study was to evaluate the production of microbial cellulose films (MCFs) in culture media based on green tea and different carbon sources, using two microbial consortia (COr and CFr). During the fermentation process, there was a reduction in the total soluble solids (TSS) content and pH, as well as an increase in the acidity in all treatments. Furthermore, fluctuations in the total sugar content and proteins during the fermentation process were associated with the consumption of carbon and nitrogen sources, as well as the production of MCFs. In the color analysis, a decrease in the L* value was observed while the rest of the parameters remained stable. Production of films was observed between days 6 and 9 of fermentation; the preferred substrate for COr was glucose (wet base yields = 603.61% and dry base yields = 22.37%), whereas for CFr was dextrose (wet base yields = 601.49% and dry base yields = 28.14%). Finally, the MCFs produced by COr and CFr showed a homogeneous, thick appearance, slight flexibility, and the characteristic brown color of the fermentation medium.

Graphical Abstract

1. Introduction

At present, there is a greater interest by people towards the damage generated by the manufacture of products used in everyday life. In recent decades, this problem has resulted in increased research efforts focused on promoting the development of sustainable biomaterials obtained from renewable sources [1]. Kombucha tea is a slightly alcoholic beverage of Manchurian origin obtained from sweet tea infusions that are fermented by a microbial consortium (bacteria and yeasts); traditionally, black tea is the most used substance for its preparation [2]. However, due to the properties and beneficial effects of green tea (Camellia sinensis), it also represents an alternative source for obtaining this type of product [3]. Green tea is considered a suitable fermentation medium due to its content of polyphenols (catechins), flavonoids, (quercetin, kaempferol, and myricetin), proteins, and amino acids, among other components [4,5]. During the fermentation process of kombucha tea, a solid polymeric film is formed at the air-liquid interface of the culture medium [2,6]; this film is composed by a polymeric matrix of microbial cellulose (MCF) and by the symbiotic consortium of bacteria and yeasts (SCOBY), also known as tea fungus [7]. Populations of microorganisms that are part of SCOBY, include different bacteria such as Komagataeibacter xylinus, Acetobacter aceti, Acetobacter pasteurianus, and Gluconobacter oxydans, and yeasts such as Brettanomyces, Zygosaccharomyces, and Saccharomyces [8,9,10,11,12]. Polymeric structures have emerged as a sustainable alternative of raw material due to their structural characteristics; particularly, MCFs have a high purity degree, crystallinity, porosity, water absorption capacity, tensile strength, and excellent biocompatibility [13,14,15]. Based on these properties, MCFs represent a good alternative to be used in distinct areas such as food, biomedical, cosmetic, paper, textiles, and packing and packaging [11,16,17,18,19].
The production of MCFs is influenced by various factors, such as the culture medium, type of sugars, nutrients, temperature, pH, dissolved oxygen, fermentation time, container geometry, and microbial diversity [2]. The main obstacle in the production of low-cost and large-scale microbial cellulose is the low conversion rate of sugars (culture medium) into cellulose [20]. The most widely used synthetic medium for the production of microbial cellulose is Hestrin–Schramm (HS), this culture medium is characterized by the presence of glucose as the only carbon source [21]; however, different studies have focused on the evaluation of other carbon sources such as maltose, fructose, cellobiose, mannitol, xylose, saccharose, and galactose in order to increase the production yield of MCFs [3,7,22,23,24,25,26,27,28]. On the other hand, various studies have also focused on the use of substrates with high sugar content, such as residues of alcoholic and non-alcoholic beverages [29,30,31,32] and tobacco residues [33], as low-cost alternatives.
Finally, the properties of MCFs such as water retention capacity, surface area, porosity, degree of polymerization, molecular weight, crystallinity index (67%–96%), average crystallite size (5.7–6.4 nm), intrinsic viscosity, water, and oxygen vapor transmission rates, as well as their mechanical properties are determined by the carbon source used during the fermentation process, as well as by the microbial strains that synthesize this polymer [22]. The main differences in the investigated components are related to Kombucha tea infusions [23,34]; the conditions and times of fermentation [35,36] and isolated consortia [37]. However, there is little information on the production performance of MCFs using green tea against different carbon sources with consortia isolated in Nuevo Leon Mexico.
Based on the above, the main factors to consider in the production of films are the microbial consortium, as well as the carbon source used to obtain this polysaccharide. Therefore, the objective of the present work was to evaluate the production of MCFs in culture media based on green tea and various carbon sources (glucose, dextrose, fructose, and saccharose), using two microbial consortia (COr and CFr).

2. Materials and Methods

2.1. Materials

The green tea (Hill Country Fare) used as a substrate during the fermentation process was purchased at a local supermarket (Monterrey, Nuevo León, Mexico). On the other hand, sugars such as glucose, dextrose, fructose, and saccharose, were analytical reagents (99%) purchased from Jalmek (Nuevo León, Mexico). The kombucha cultures used as starters for the fermentation process, named as the COr and CFr consortium, were kindly provided by the Environmental Remediation Laboratory of the Agronomy Faculty of the Universidad Autónoma de Nuevo León (UANL); these consortia were previously isolated from kombucha samples produced in an artisanal way in the region (Nuevo Leon State, Mexico).

2.2. Preparation of Kombucha Cultures and Fermentation

In this process, four different carbon sources were evaluated: Glucose, dextrose, fructose, and saccharose. The methodology was carried out as described in previous studies [25,28,38], but with some modifications related to water temperature, amount of sugar, and fermentation time. First, two liters of water were heated to a temperature of 85 °C. Once this temperature was reached, 3.6 g of green tea was added to each solution liter. The medium (250 mL) was then dispensed into eight glass containers (500 mL capacity); 12.5 g of sugar was added to each container to finally obtain two containers for each sugar. The sections were allowed to settle for 15 min and then they were placed in a cold bath until they reached room temperature (25 ± 2 °C). Two different kombucha cultures, COr and CFr, were tested as experimental inocula; the cultures were kept for 15 days at 25 ± 2 °C (HerathermTM Incubator, ThermoFisher ScientificTM, Waltham, MA, USA).
For the fermentation process, glass flasks (175 mL capacity) containing 60 mL of the green tea infusion were used and inoculated with 10% (V/V) of the COr, and CFr cultures, obtained during the previous stage. The bottles were covered with gauze and kept in storage at a temperature of 25 ± 2 °C for 15 days.

2.3. Physicochemical Analysis of Fermentations

2.3.1. Determination of pH, Total Acidity, and a Total of Soluble Solids

The pH was determined using a multiparametric pH meter, previously calibrated to a pH of 4.0 and 7.0. (Orion Star™ A215, ThermoFisher ScientificTM, Waltham, MA, USA) [3,39]. On the other hand, the content of total soluble solids (TSS) was determined using an analogous hand refractometer (Atago Co., Ltd., Nonthaburi, Thailand) and the results were expressed in °Brix [40]. Finally, titratable acidity (TA) was determined based on previous studies [28,38] with some modifications. Briefly, 10 mL of the fermentation was titrated with a standard solution of NaOH (0.1 N), using phenolphthalein as an indicator. The results were expressed as a percentage of acetic acid based on the following equation:
acetic acid (%) = (NaOH mL) (N NaOH) (0.06)/(sample mL) × 100

2.3.2. Determination of Total Sugars and Proteins

The determination of total sugar content was carried out using the phenol-sulfuric acid method [41] with some modifications. First, 10 µL of the sample was added to test tubes containing 15 and 25 mL of water and 1 mL of 5% phenol, respectively. Subsequently, 5 mL of concentrated sulfuric acid was added to these mixtures and they were slightly stirred. The solutions were allowed to settle for 10 min at room temperature (25 ± 2 °C) and then were vortexed for 30 sec. Finally, the tubes were placed in a cold-water bath for 20 min, and the samples were analyzed in a spectrophotometer (Evolution 201/220 UV Vis, ThermoFisher ScientificTM, Waltham, MA, USA) at 490 nm.
The quantification of total proteins during the fermentation process was carried out using the Bradford technique. Briefly, Bradford reagent (800 µL) and sample (200 µL) were added to the test tubes; the solutions were allowed to settle for 5 min and subsequently, they were measured in a spectrophotometer at 595 nm [42].

2.3.3. Color Analysis

The fermentation color was determined with a portable digital colorimeter (HP-2132, INTEKE, manufacturer, Hong Kong, China), using the CIELAB color parameters, L* (luminosity), a* (−green to +red), b* (−blue to +yellow), chroma (C*), and hue (H*) [43].

2.3.4. Production of MCFs

The generation of MCFs in the different culture media was monitored based on the reported by Amarasinghe et al. [3], through observations and changes in the clarity of the culture medium (clear/cloudy) every 3 days, during the 15 days of fermentation.

2.3.5. Determination of Wet Weight, Dry Weight, and Yields of the MCFs

At the end of the fermentation process (day 15), the MCFs produced in the different culture media were carefully removed with the help of a spatula. Moisture excess was removed with paper towels, and the fresh weight was determined on a digital scale (hr-i, Orion). Subsequently, the MCFs were placed in an oven (Fe-253D, Felisa, Zapopan, Jalisco México) at 45 ± 2 °C until a constant dry weight was obtained [23]. Wet weight and dry weight results were expressed in g/L. Finally, the yield was determined according to the following equation [25,28]:
Yield (%) = Microbial cellulose film weight (g/L)/Sugar concentration (g/L) × 100

2.4. Statistical Analysis

Determination of total sugar content and proteins were carried out every three days during the 15 days of fermentation. On the other hand, the evaluations of pH, TSS, TA, and color were carried out on days 0 and 15. Finally, the determinations of the weights and yields of MCFs were made at the end of the fermentation period (day 15).
The data obtained from the aforementioned parameters were analyzed using a Student’s t test for independent samples or a variance analysis (ANOVA), followed by a mean comparison analysis using a Tukey test, with a significance level of 0.05, employing the SPSS software (IBM version 25, SPSS Inc., Chicago, IL, USA). All figures were prepared with the OriginPro 6.0 package.

3. Results and Discussion

3.1. pH, TSS and TA

Regarding the pH parameter, the initial values of the fermentation medium containing different carbon sources (i.e., glucose, dextrose, fructose, and saccharose) fluctuated between 2.97–3.03 and 2.94–2.99 for COr and CFr, respectively (Table 1), similar to the reported in previous studies [25,44]. Moreover, a significant decrease (p < 0.05) in the pH values was observed in all treatments by day 15 of fermentation for both consortia (COr = 2.20−2.73 and CFr = 2.24−2.53), whose values were similar (p > 0.05) among the different carbon sources (Table 1). According to Vitas et al. [30], the decrease in pH values in the culture medium is an indicator of the activity of kombucha microbial cultures on substrates. This effect has previously been reported in some studies using white, red, black, green, and oolong tea-based culture media [39,40]; as well as in some herbal extracts (e.g., winter savory, peppermint, stinging nettle, wild thyme, elderberry, and quince) and has been associated with the metabolism of sugars in organic acids by bacteria and yeasts during the fermentation process [28].
In the TSS content, the initial values fluctuated between 4.30–4.95 °Brix (COr) and 4.60–4.80 °Brix (CFr), with a significant decrease (p < 0.05) towards day 15 of fermentation in all treatments and for both consortiums, whose values were similar (p > 0.05) at the end of the storage period (COr = 3.43–3.93 °Brix and CFr = 3.83–4.07 °Brix) (Table 1). These results agree with those reported by Jakubczyk et al. [39]; likewise, other studies indicate that the decrease in the TSS content during the fermentation process can be attributed to the consumption of the different carbon sources during the microbial growth [3,40]. Additionally, some references that indicate that glucose, fructose, and saccharose are the sugars preferred by the kombucha starter culture. A decrease in saccharose content can be attributed to the production of invertase or saccharose enzymes that catalyze the hydrolysis of the disaccharide into glucose and fructose, which are subsequently used for microbial development [27].
Regarding the TA parameter, the initial values fluctuated between 0.10%–0.12% and 0.09%–0.11% for COr and CFr, respectively. By day 15 of storage, a significant increase (p <0.05) was observed in the TA values, which fluctuated between 0.42%–1.61% (COr) and 0.44%–1.46% (CFr); the lowest values corresponded to the media containing saccharose as a carbon source (Table 1). According to previous studies [27,28,38,45], an increase in the TA values during the fermentation process can be associated with the metabolism of sugars into organic acids due to the effect of some yeasts and bacteria. The low TA values found in the saccharose-based medium can be attributed to the time of fermentation; since for this disaccharide, it is necessary first that the yeast converts the saccharose into glucose, and fructose through glycolysis, so that acetobacter can subsequently ferment these sugars for the acetic acid production.

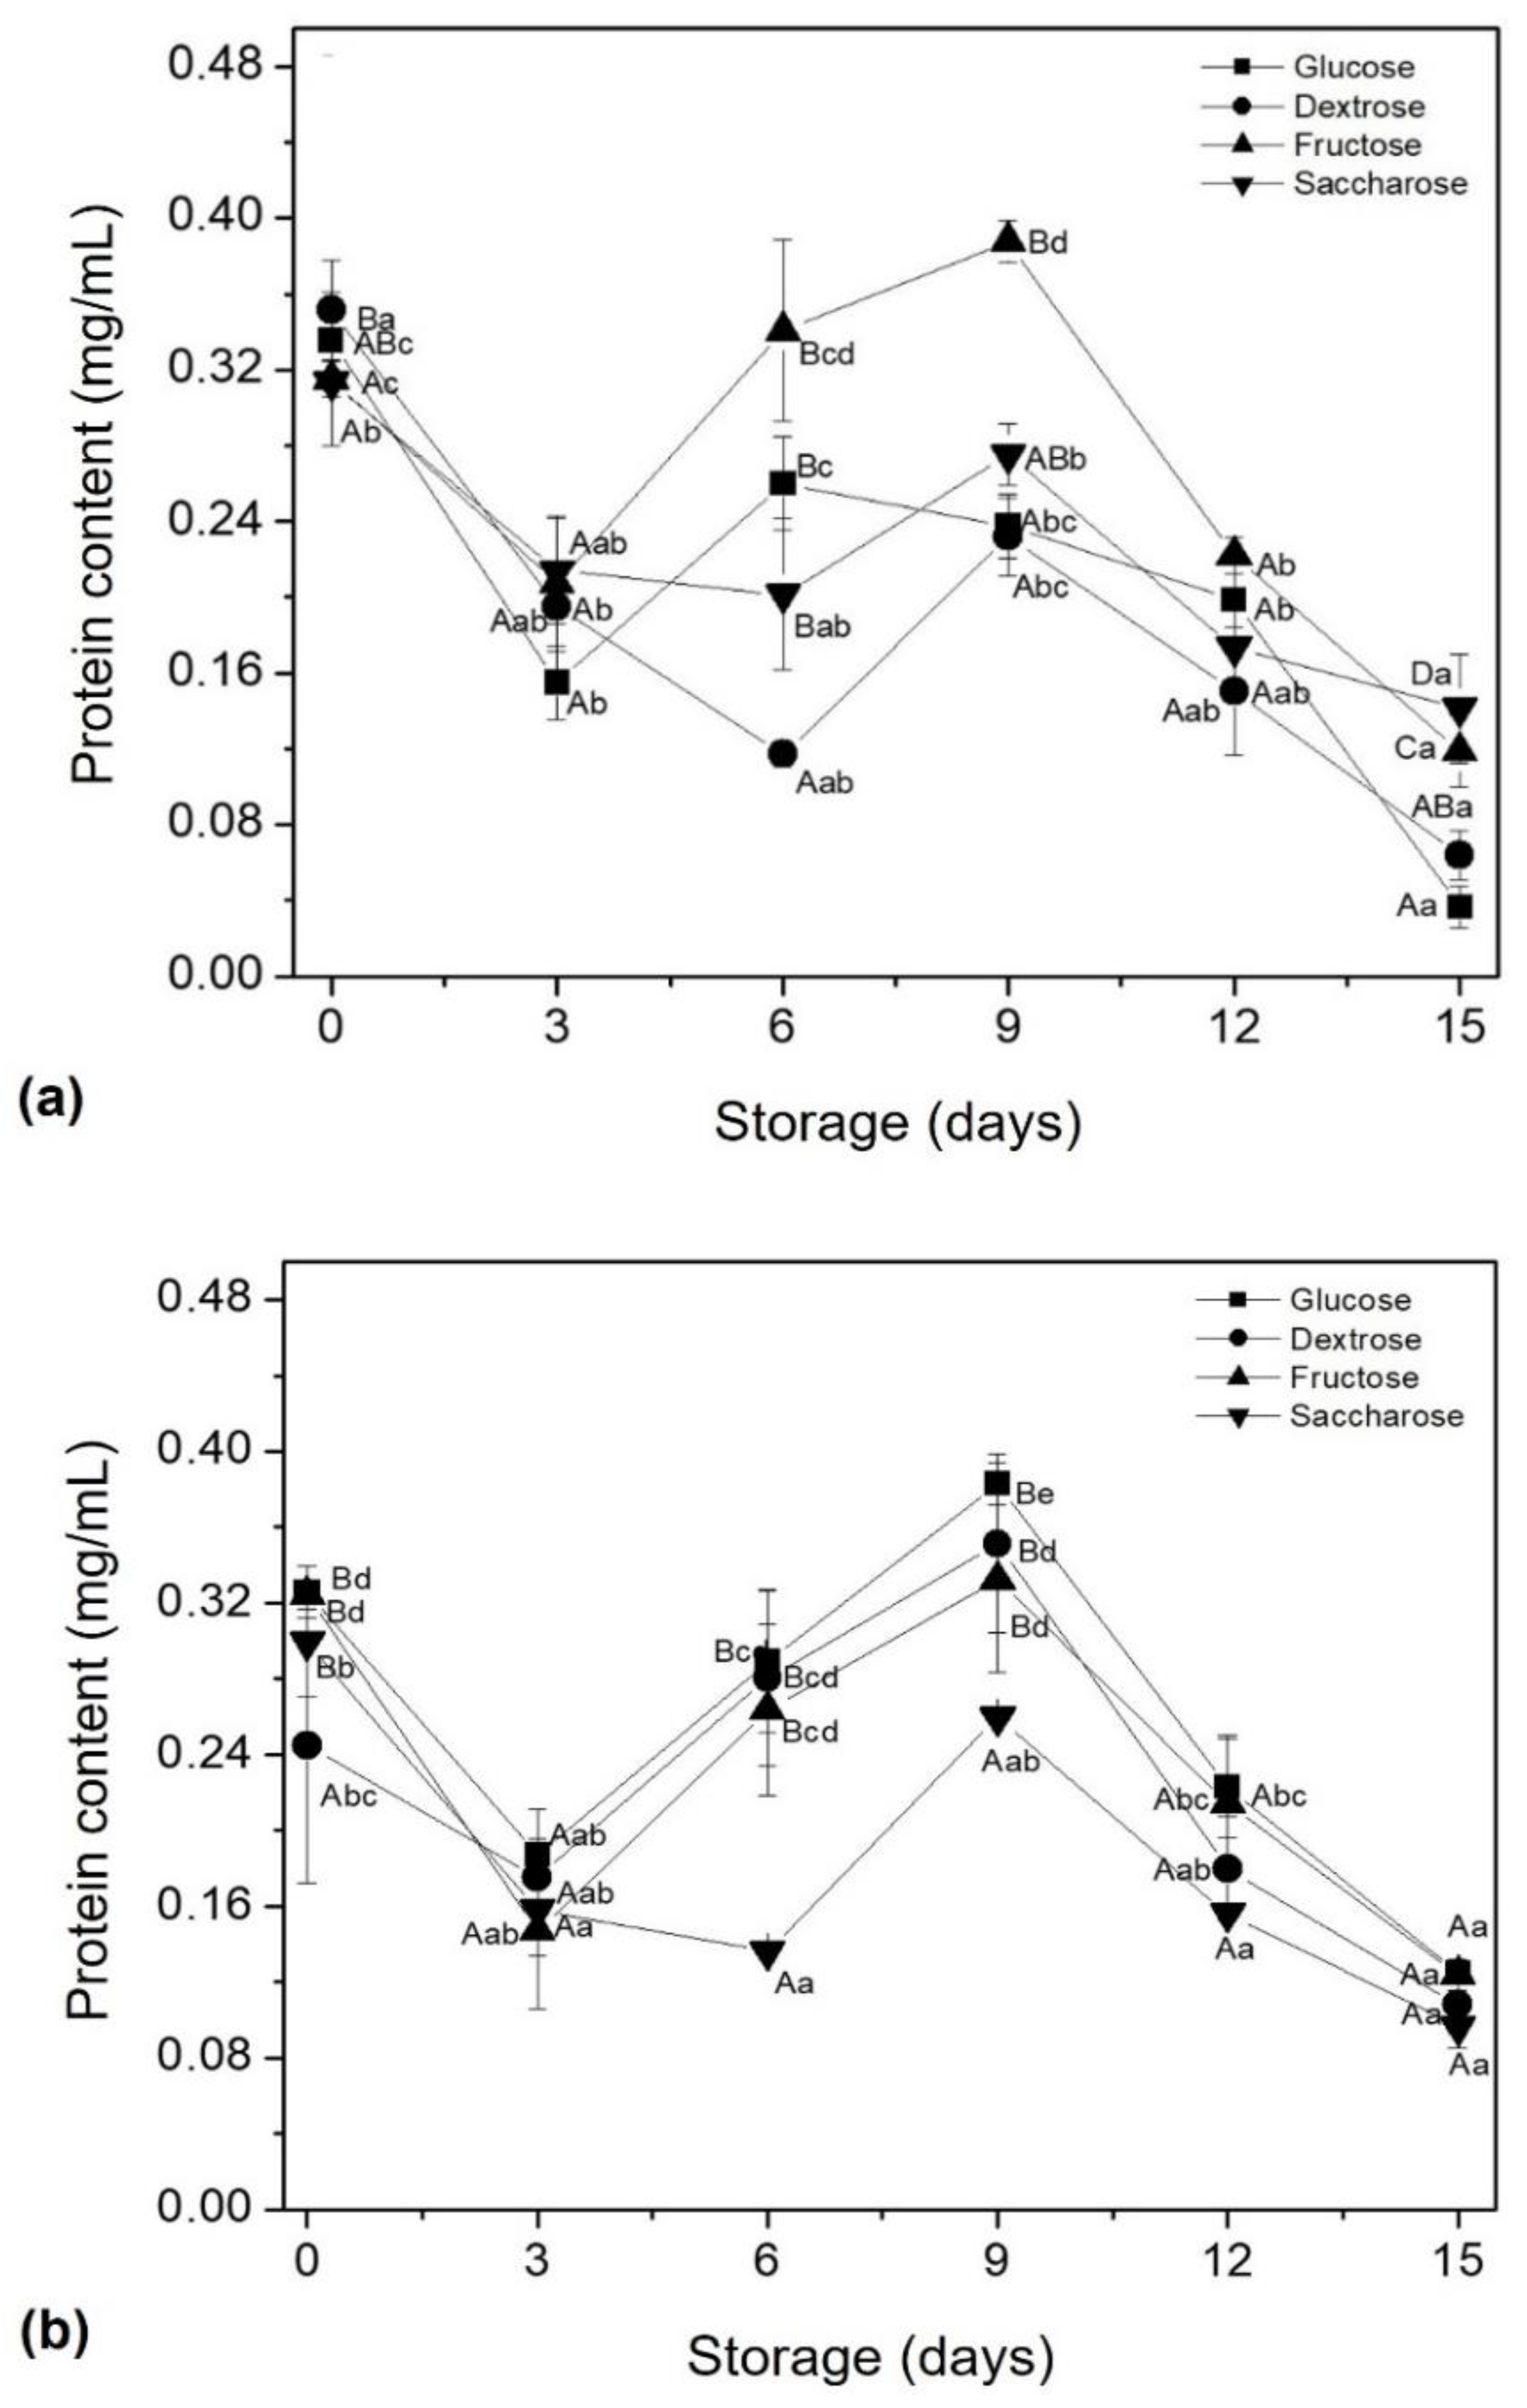
3.2. Total of Sugars and Protein Content

Results regarding the determination of total sugar content are shown in Figure 1. The values for this parameter fluctuated between 825.74–1150.62 and 798.51–1276.24 mg/L for COr and CFr, respectively. These differences could be associated with the presence of trace components, which may be present in lower amounts in the kombucha starter culture [37,41]. A significant decrease (p < 0.05) was observed between the days 0 and 6 of storage in the values of total sugars in all treatments, and for both consortia; this effect may be associated with the consumption of the different carbon sources during the fermentation process [7,46]. However, between days 6–12 and 6–9, a significant increase (p < 0.05) was observed in the total sugars content of COr, and CFr, respectively, followed by a decrease towards days 12–15 (Figure 1). This effect may be associated with the production of MCF (β-glucose homopolysaccharide linked by β-1,4-glucosidic bonds) due to the effect of acetic acid bacteria in the culture broth during the fermentation process, since, the determination of total sugars also includes the quantification of mono, di, and polysaccharides [3]. Finally, by day 15, the glucose and dextrose were almost completely consumed in the culture medium with COr, followed by fructose and saccharose. Additionally, the preferred substrate for the CFr consortium was glucose, followed by fructose, dextrose, and saccharose (Figure 1). This effect could be associated with the ratio of bacteria-yeasts in the different consortia, since, according to previous studies, bacteria preferentially consume glucose while yeasts preferentially consume fructose [27,46].
The initial values in the determination of proteins fluctuated between 0.31–0.35 (COr) and 0.24–0.33 mg/mL (CFr; Figure 2), similar to that found in previous studies [4,26]. Between days 0 and 3 of storage, a significant decrease (p < 0.05) in the protein content of all treatments was observed for both consortia; this effect can be attributed to the consumption of this nitrogen source during microbial development in the fermentation process [27]. Subsequently, an increase in protein content was observed between days 3 and 9 with a subsequent reduction towards days 12 to 15. According to Ahmed et al. [28] and Kallel et al. [26], the increase in protein content can be attributed to the release of extracellular proteins associated with the growth of bacteria and yeasts throughout the fermentation process. Finally, at the end of the storage period, the protein content fluctuated between 0.04–0.11 (COr) and 0.10–0.13 mg/mL (CFr), similar to the content found by Ahmed et al. [28] in tea, rice, and barley culture media.

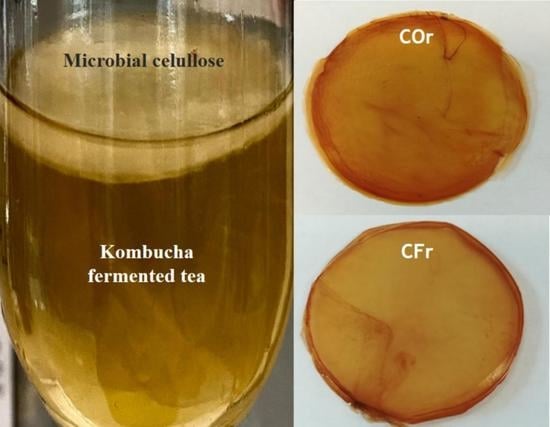
3.3. Color Analysis and Formation of MCFs
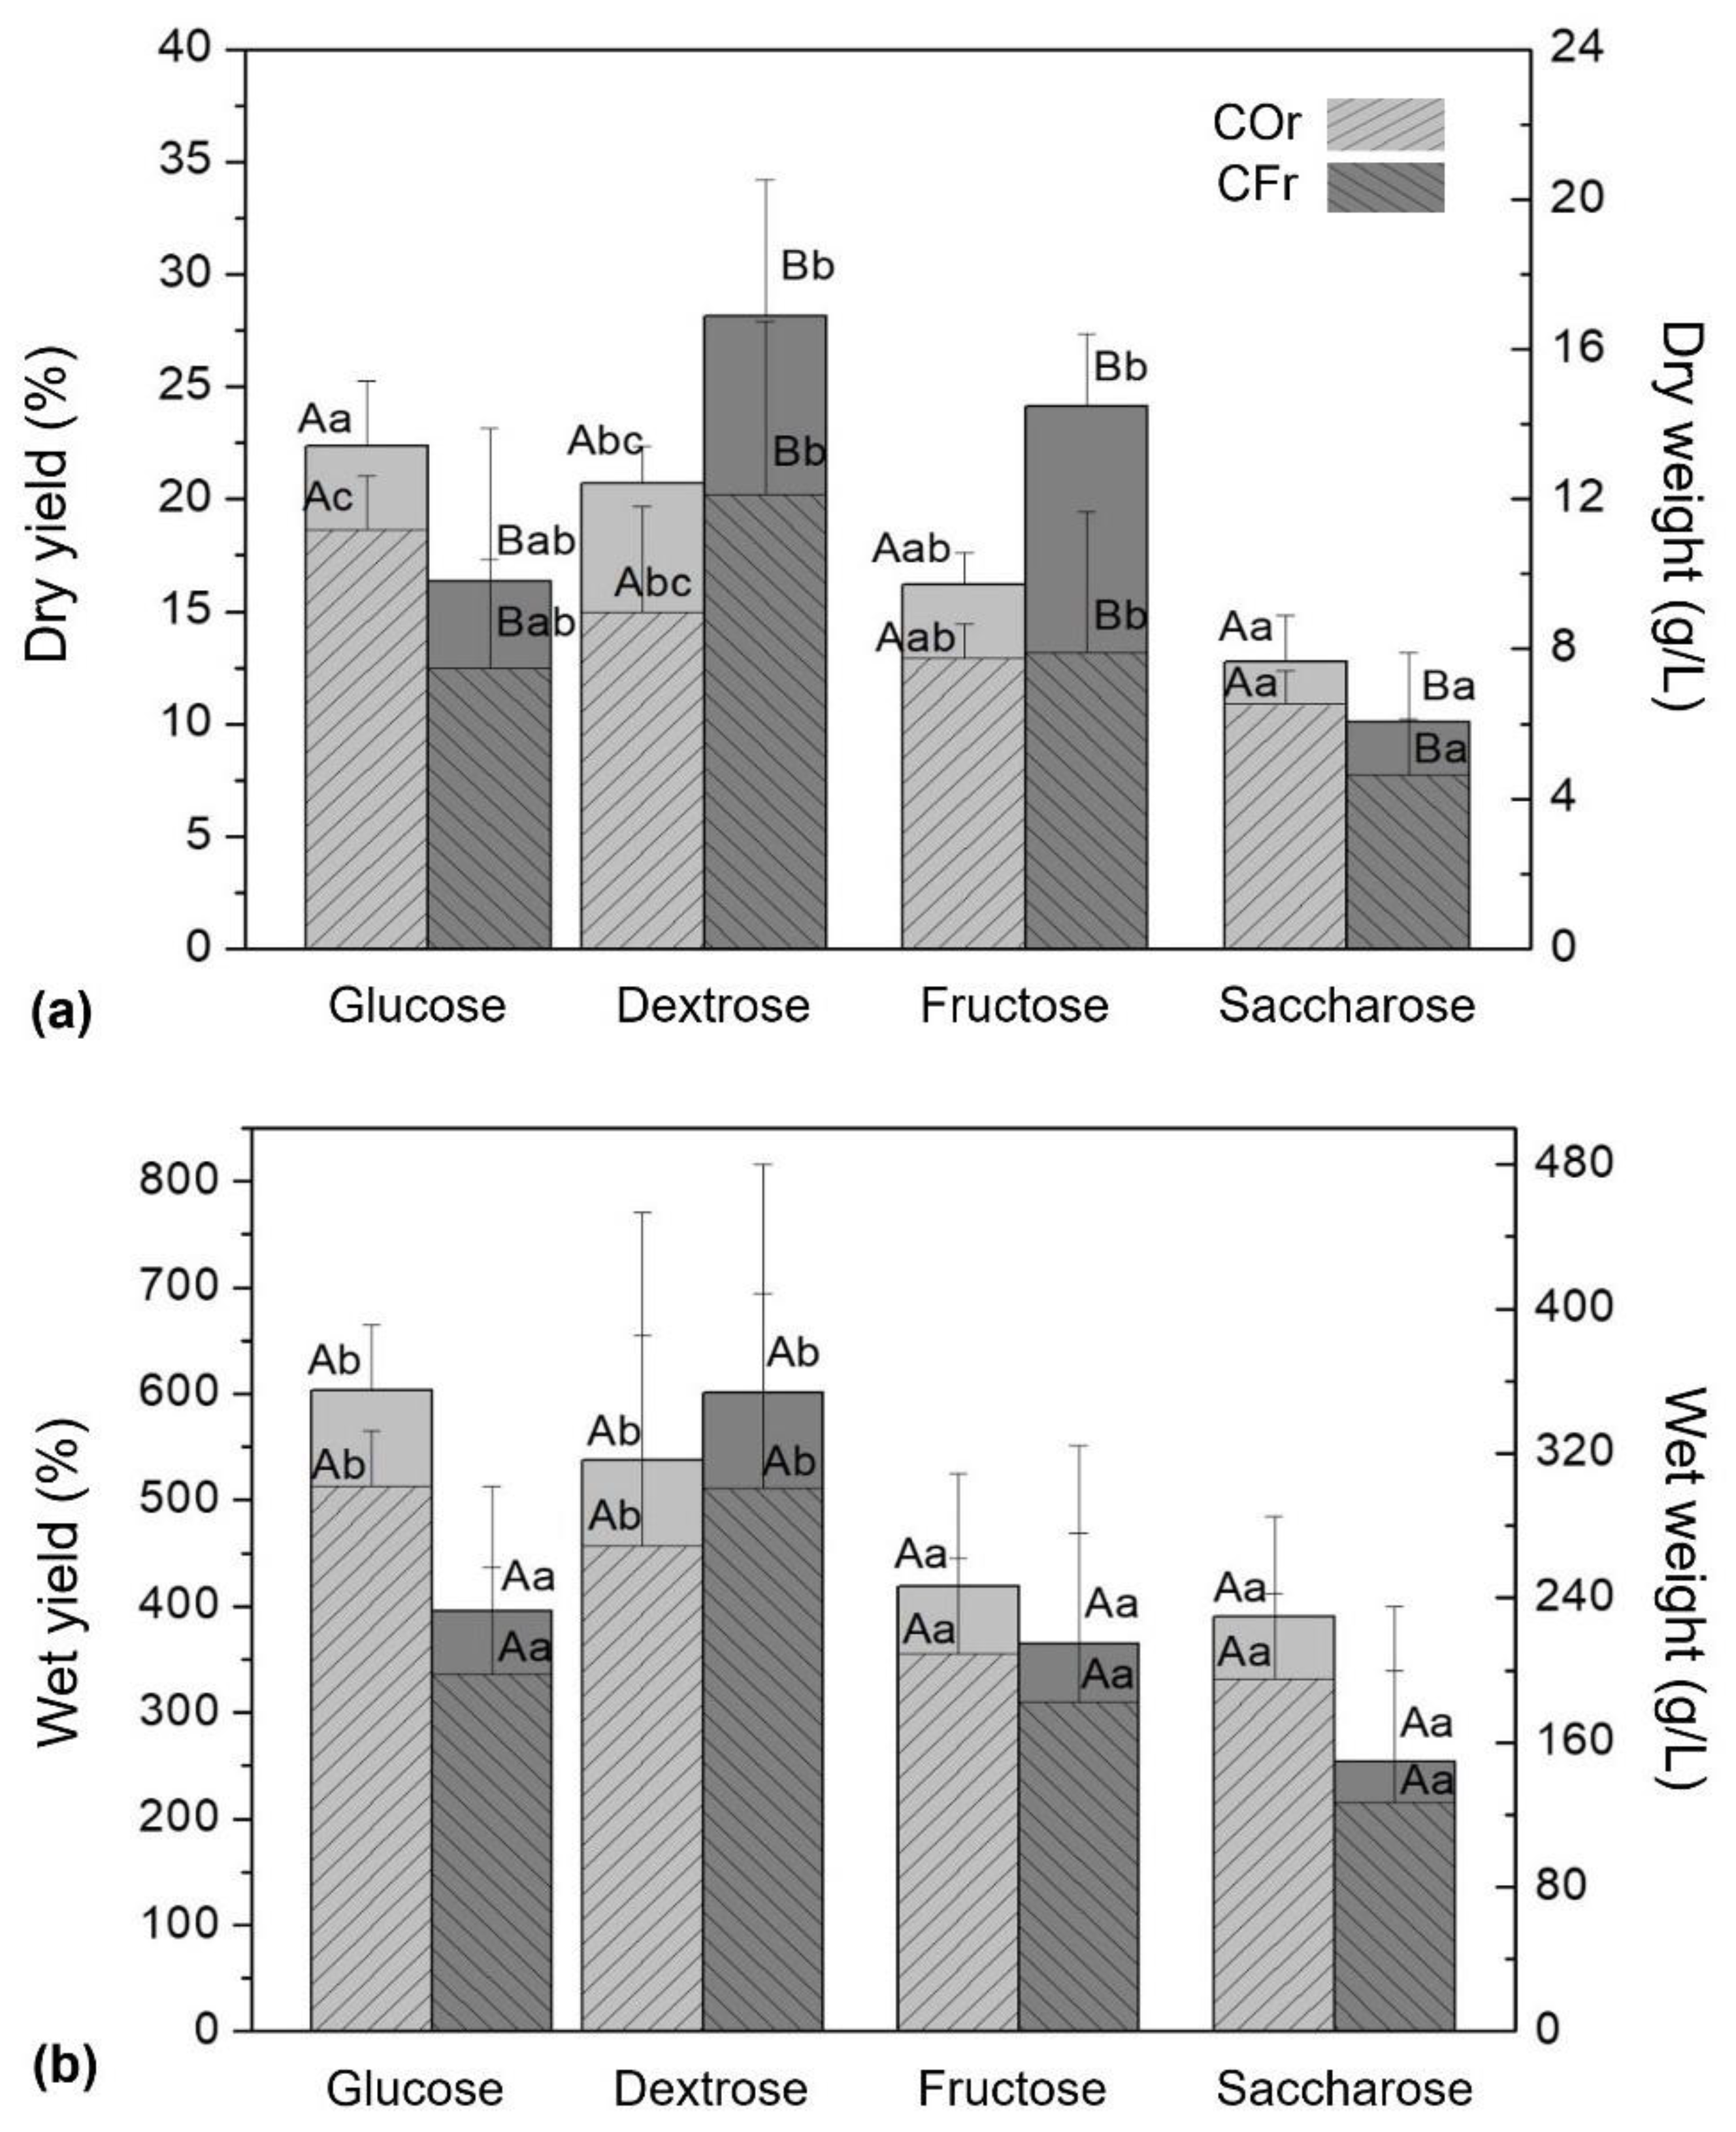
In color evaluations, the initial values were similar in the color coordinates L* (21.60–28.45; slightly dark), a* (1.45–4.75; + red) and b* (10.05–21.90; + yellow), as well as in C* (11.25–22.15) and H* (65.20–85.20), for the different treatments in both consortia (Table 2), indicating a characteristic amber coloration for the green tea, similar to the reported in previous studies [47]. On day 15 of storage, a decreasing tendency in the luminosity values was observed in all treatments for both consortia (L*; 18.10–20.67); however, the values of the parameters a* (3.83–5.13), b* (14.57–16.27), C* (15.10–16.77), and H* (70.77–75.37) showed similar ranges to those found at the beginning of fermentation. These findings are consistent with the ones reported by Yıkmış et al. [5], who referred that the fermentation process generally has little effect on the color parameters in culture media based on black tea and purple basil during a fermentation period of 30 days. The increase in L* values during the fermentation process has been reported in culture media based on green tea and saffron extract; this effect can be attributed to the chemical modifications of polyphenols as a consequence of microbial growth during storage time [43].
During the fermentation process, changes in culture media were monitored to detect the formation of MCF. Between days 0 and 3 of storage culture media with different carbon sources and inoculated with COr and CFr, a very clear and clear appearances were, respectively, observed (Table 3). Subsequently, between days 6 and 9, an increase in the turbidity of the culture medium was observed in all treatments; this effect is related to an increase in cellulose production due to the action of acetic acid bacteria in the fermentation process [3,48]. Finally, between days 12 and 15, a very turbid appearance and the formation of MCFs floating on the surface of the culture media were observed in all treatments (Table 3; Figure 3), according to previous studies [34,40].

3.4. MCFs Yields

MCFs produced by the COr and CFr consortia in the various culture media showed a homogeneous, thick appearance, slight flexibility, and a characteristic brown color of the fermentation culture (Figure 4). The wet-basis yields fluctuated between 195.39–301.81 g/L (390.77%–603.61%; COr) and 126.79–300.74 g/L (253.58%–601.49%; CFr). In addition, the yields of the MCFs on a dry basis fluctuated between 6.54–11.19 g/L (12.76%–22.37%; COr) and 4.64–12.12 g/L (10.10%–28.14%; CFr) (Figure 5). In general, the highest values (p < 0.05) were found in glucose (COr) and dextrose (CFr)-based media, followed by fructose and saccharose, similar to those found in previous studies [23,24,26,27]. Compared with previous research, the yields of the COr and CFr consortia were similar to those reported by Ahmed et al. (black tea, rice, and barley) [28] and Neera et al. (G. xylinum in pineapple juice and cornstarch) [24], but higher than those reported by Nguyen et al. (G. xylinum in HS, green tea, and black tea media) [23], Goh et al. (black tea) [25], Kallel et al. (green tea and black tea) [26], and Khosravi et al. (black tea) [27]. According to Nguyen et al. [23], the preferences of carbon sources for the production of cellulose may vary depending on the microbial strains. Furthermore, the behavior found in the saccharose-based medium can be attributed to the need to hydrolyze this disaccharide into glucose and fructose by the effect of microbial invertase, for the subsequent metabolism of these monosaccharides during fermentation and the consequent MCF formation [27,28,34,46,47]. Finally, different factors such as the fermentation medium, carbon, and nitrogen sources, among others, can influence the production and yield of MCFs [25,48].

4. Conclusions

In general, during the fermentation process of the COr and CFr consortia in the green tea medium with glucose, dextrose, fructose, and saccharose, a reduction in the content of TSS and pH was observed, as well as an increase in the acidity content, indicating the consumption of the carbon source and the development of acetic acid-producing bacteria. Moreover, changes in the total sugar content during fermentation indicated the consumption of different carbon sources, as well as the production of microbial cellulose in the culture media. Likewise, the changes found in the protein content showed the consumption of the nitrogen source, as well as the microbial development throughout the fermentation process. On the other hand, a decrease in the L* coordinate was observed in the color analysis, whereas a*, b*, C* and H* values remained stable. During days 6 and 9, turbidity and cellulose production increased in the distinct culture media; the preferred substrate for COr was glucose, while for CFr was dextrose, followed by fructose and saccharose in both consortia. Additionally, COr and CFr produced MCFs with a homogeneous, thick appearance, slight flexibility, and the characteristic brown color of the fermentation medium. The highest yields for COr were 603.61% and 22.37% (glucose), and were 601.49% and 28.14% (dextrose) for CFr on a wet and dry basis, respectively. Finally, it is necessary to continue with this research to know the physical, chemical, and mechanical properties of the MCFs produced by COr and CFr consortia in order to determine their possible application or the improvement of some of their properties.

Author Contributions

Conceptualization, J.M.M.-R., R.A.G.-S., and A.S.G.-M.; methodology, A.S.G.-M., C.G.-G., and J.G.B.-G.; formal analysis, J.M.M.-R. and M.Z.T.-G.; investigation, J.M.M.-R. and A.S.G.-M.; resources, J.M.M.-R.; data curation, J.M.M.-R.; writing—original draft preparation, A.S.G.-M., J.M.M.-R., J.G.B.-G., A.G.-V., and M.Z.T.-G.; writing—review and editing, J.M.M.-R. and M.Z.T.-G.; visualization, J.M.M.-R. and A.S.G.-M.; supervision, J.M.M.-R.; project administration, J.M.M.-R.; funding acquisition, J.M.M.-R. All authors have read and agreed to the published version of the manuscript.

Funding

This research received no external funding.

Conflicts of Interest

The authors declare no conflict of interest.

References

  1. Sederavičiūtė, F.; Bekampienė, P.; Domskienė, J. Effect of pretreatment procedure on properties of kombucha fermented bacterial cellulose membrane. Polym. Test. 2019, 78, 10594. [Google Scholar] [CrossRef]
  2. Villarreal-Soto, S.A.; Beaufort, S.; Bouajila, J.; Souchard, J.P.; Renard, T.; Rollan, S.; Taillandier, P. Impact of fermentation conditions on the production of bioactive compounds with anticancer, anti-inflammatory and antioxidant properties in kombucha tea extracts. Process Biochem. 2019, 83, 44–54. [Google Scholar] [CrossRef] [Green Version]
  3. Amarasinghe, H.; Weerakkody, N.S.; Waisundara, V.Y. Evaluation of physicochemical properties and antioxidant activities of kombucha “Tea Fungus” during extended periods of fermentation. Food Sci. Nutr. 2018, 6, 659–665. [Google Scholar] [CrossRef] [PubMed] [Green Version]
  4. Joshi, V.K.; Kumar, V. Influence of different sugar sources, nitrogen sources and inocula on the quality characteristics pf apple tea wine. J. Inst. Brew. 2017, 123, 268–276. [Google Scholar] [CrossRef]
  5. Yıkmış, S.; Tuğgüm, S. Evaluation of Microbiological, Physicochemical and sensorial properties of purple basil kombucha beverage. Turk. J. Agric. Food Sci. Technol. 2019, 7, 1321–1327. [Google Scholar] [CrossRef] [Green Version]
  6. Ashrafi, A.; Jokar, M.; Nafchia, A.M. Preparation and characterization of biocomposite film based on chitosan and kombucha tea as active food packaging. Int. J. Biol. Macromol. 2018, 108, 444–454. [Google Scholar] [CrossRef] [PubMed]
  7. Amarasekara, A.S.; Wang, D.; Grady, T.L. A comparison of kombucha SCOBY bacterial cellulose purification methods. SN Appl. Sci. 2020, 2, 240. [Google Scholar] [CrossRef] [Green Version]
  8. Greenwalt, C.J.; Steinkraus, K.H.; Ledford, R.A. Kombucha, the fermented tea: Microbiology, composition, and claimed health effects. J. Food Prot. 2000, 63, 976–981. [Google Scholar] [CrossRef]
  9. Carreño, L.D.; Caicedo, L.A.; Martínez, C.A. Técnicas de fermentación y aplicaciones de la celulosa bacteriana: Una revisión. Ing. Cienc 2012, 8, 307–335. [Google Scholar] [CrossRef] [Green Version]
  10. Spedding, G. So What Is Kombucha? An Alcoholic or a Non-Alcoholic Beverage? A Brief Selected Literature Review and Personal Reflection; Abstract-Overview; Bdas, Llc Wpsp#2; Brewing and Distilling Analytical Services, LLC: Lexington, KY, USA, 2015. [Google Scholar]
  11. Gomes, R.J.; de Borges, M.F.; de Rosa, M.F.; Castro-Gómez, R.J.H.; Spinosa, W.A. Acetic acid bacteria in the food industry: Systematics, characteristics and applications. Food Technol. Biotechnol. 2018, 56, 139–151. [Google Scholar] [CrossRef]
  12. Villarreal-Soto, S.A.; Beaufort, S.; Bouajila, J.; Souchard, J.; Taillandier, P. Understanding kombucha tea fermentation: A review. J. Food Sci. 2018, 83, 580–588. [Google Scholar] [CrossRef] [PubMed]
  13. Römling, U.; Galperin, M.Y. Bacterial cellulose biosynthesis: Diversity of operons, subunits, products, and functions. Trends Microbiol. 2015, 23, 545–557. [Google Scholar] [CrossRef] [PubMed] [Green Version]
  14. Lin, D.; Lopez-Sanchez, P.; Gidley, M.J. Binding of arabinan or galactan during cellulose synthesis is extensive and reversible. Carbohydr. Polym. 2015, 126, 108–121. [Google Scholar] [CrossRef] [PubMed]
  15. Lin, D.; Lopez-Sanchez, P.; Gidley, M.J. Interactions of pectins with cellulose during its synthesis in the absence of calcium. Food Hydrocoll. 2016, 52, 57–68. [Google Scholar] [CrossRef]
  16. Chawla, P.R.; Bajaj, I.B.; Survase, S.A.; Singhal, R.S. Microbial Cellulose: Fermentative production and applications. Food Technol. Biotechnol. 2009, 47, 107–124. [Google Scholar]
  17. Pereda, M.; Dufresne, A.; Aranguren, M.I.; Marcovich, N.E. Polyelectrolyte films based on chitosan/olive oil and reinforced with cellulose nanocrystals. Carbohydr. Polym. 2014, 101, 1018–1026. [Google Scholar] [CrossRef] [PubMed]
  18. Ng, M.C.F.; Wang, W. A Study of the Receptivity to Bacterial Cellulosic Pellicle for Fashion. Res. J. Text. Apparel. 2015, 19, 65–69. [Google Scholar] [CrossRef]
  19. Frone, A.N.; Panaitescu, D.M.; Chiulan, I.; Nicolae, C.A.; Casarica, A.; Gabor, A.R.; Tusca, R.; Damian, C.M.; Purcar, V.; Alexandrescu, E.; et al. Surface Treatment of Bacterial Cellulose in Mild, Eco-Friendly Conditions. Coatings 2018, 8, 221. [Google Scholar] [CrossRef] [Green Version]
  20. Sharma, C.; Bhardwaj, N.K. Biotransformation of fermented black tea into bacterial nanocellulose via symbiotic interplay of microorganisms. Int. J. Biol. Macromol. 2019, 132, 166–177. [Google Scholar] [CrossRef]
  21. Schramm, B.M.; Hestrin, S. Factors affecting production of cellulose at the air/liquid interface of a culture of acetobacter xylinum. Microbiology 1954, 11, 123–129. [Google Scholar] [CrossRef] [Green Version]
  22. Gorgieva, S.; Trcek, J. Bacterial cellulose: Production, modification and perspectives in biomedical applications. Nanomaterials 2019, 9, 1352. [Google Scholar] [CrossRef] [PubMed] [Green Version]
  23. Nguyen, V.T.; Flanagan, B.; Gidley, M.J.; Dykes, G.A. Characterization of cellulose production by a Gluconacetobacter xylinus strain from kombucha. Curr. Microbiol. 2008, 57, 449. [Google Scholar] [CrossRef] [PubMed]
  24. Neera, K.; Ramana, V.; Batra, V.H. Occurrence of cellulose-producing gluconacetobacter spp. in Fruit samples and kombucha tea, and production of the biopolymer. Appl. Biochem. Biotechnol. 2015, 176, 1162–1173. [Google Scholar] [CrossRef] [PubMed]
  25. Goh, W.N.; Rosma, A.; Kaur, B.; Fazilah, A.; Karim, A.A.; Bhat, R. Fermentation of black tea broth (Kombucha): I. effects of sucrose concentration and fermentation time on the yield of microbial cellulose. Int. Food Res. J. 2012, 19, 109–117. [Google Scholar]
  26. Kallel, L.; Desseaux, V.; Hamdi, M.; Stocker, P.; Ajandouz, E.H. Insights into the fermentation biochemistry of kombucha teas and potential impacts of kombucha drinking on starch digestion. Food Res. Int. 2012, 49, 226–232. [Google Scholar] [CrossRef]
  27. Khosravi, S.; Safari, M.; Emam-Djomeh, Z.; Golmakani, M.T. Development of fermented date syrup using kombucha starter culture. J. Food Process. Preserv. 2018, 43, e13872. [Google Scholar] [CrossRef]
  28. Ahmed, R.F.; Hikal, M.S.; Abou-Taleb, K.A. Biological, chemical and antioxidant activities of different types Kombucha. Ann. Agric. Sci. 2020, 65, 35–41. [Google Scholar] [CrossRef]
  29. Matsuoka, M.; Tsuchida, T.; Matsushita, K.; Adachi, O.; Yoshinaga, F. A Synthetic medium for bacterial cellulose production by acetobacter xylinum subsp. sucrofermentans. Biosci. Biotechnol. Biochem. 2011, 60, 575–579. [Google Scholar] [CrossRef]
  30. Lin, D.; Lopez-Sanchez, P.; Li, R.; Li, Z. Production of bacterial cellulose by gluconacetobacter hanseniiCGMCC3917 using only waste beer yeast as nutrient source. Bioresour. Technol. 2014, 151, 113–119. [Google Scholar] [CrossRef]
  31. Huang, C.; Yang, X.-Y.; Xiong, L.; Guo, H.J.; Luo, J.; Wang, B.; Zhang, H.R.; Lin, X.Q.; Chen, X.D. Evaluating the possibility of using acetone-butanol-ethanol (ABE) fermentation wastewater for bacterial cellulose production by Gluconacetobacter xylinus. Lett. Appl. Microbiol. 2015, 60, 491–496. [Google Scholar] [CrossRef]
  32. Bayrak, E.; Büyükkileci, A.O. Utilization of white grape pomace for lactic acid production. Gıda J. Food. 2018, 43, 129–138. [Google Scholar] [CrossRef]
  33. Toda, K.; Asakura, T.; Fukaya, M.; Entani, E.; Kawamura, Y. Cellulose production by acetic acid-resistant Acetobacter xylinum. J. Ferment. Bioeng. 1997, 84, 228–231. [Google Scholar] [CrossRef]
  34. Srihari, T.; Satyanarayana, U. Changes in free radical scavenging activity of kombucha during fermentation. J. Pharm. Sci. Res. 2012, 4, 1978. [Google Scholar]
  35. Martínez, J.; Valenzuela, L.; Jayabalan, R.; Huerta, J.; Escalante-Aburto, A. A review on health benefits of kombucha nutritional compounds and metabolites. CyTA J. Food 2018, 1, 390–399. [Google Scholar] [CrossRef] [Green Version]
  36. Juyoung, K.; Koushik, A. Current trends in Kombucha: Marketing perspectivesand the need for improved sensory research. Beverages 2020, 6, 15. [Google Scholar]
  37. Jayabalan, R.; Malbasa, R.V.; Loncar, E.S.; Vitas, J.S.; Stahishkumar, M. A Review on kombucha tea–microbiology, composition, fermentation, beneficial effects, toxicity, and tea fungus. Compr. Rev. Food Sci. Food Saf. 2014, 13, 538–550. [Google Scholar] [CrossRef]
  38. Vitas, J.; Vukmanovic, S.; Cakarevic, J.; Popovic, L.; Malbasa, R. Kombucha fermentation of six medicinal herbs: Chemical profile and biological activity. Chem. Ind. Chem. Eng. Q. 2020, 26, 157–170. [Google Scholar] [CrossRef]
  39. Jakubczyk, K.; Ladunska, J.; Kochman, J.; Janda, K. Chemical profile and antioxidant activity of the kombucha beverage derived from white, green, black and red tea. Antioxidants 2020, 9, 447. [Google Scholar] [CrossRef]
  40. Kaewkod, T.; Bovonsombut, S.; Traagoolpua, Y. Efficacy of kombucha obtained from green, oolong, and black teas on inhibition of pathogenic bacteria, antioxidation, and toxicity on colorectal cancer cell line. Microorganisms 2019, 7, 700. [Google Scholar] [CrossRef] [Green Version]
  41. López-Legarda, X.; Taramuel-Gallardo, A.; Arboleda-Echavarría, C.; Segura-Sánchez, F.; Restrepo-Betancur, L.F. Comparison of methods using sulfuric acid for determination of total sugars. Rev. Cubana Quím. 2017, 29, 180–198. [Google Scholar]
  42. Bradford, M. A rapid and sensitive method for the quantitation of microgram quantities of protein utilizing the principle of protein-dye binding. Anal. Biochem. 1976, 72, 248–254. [Google Scholar] [CrossRef]
  43. Suna, S.; Çiftçi1, K.; Tamer, C.E. Determination of physicochemical and sensory properties of kombucha beverage prepared with saffron. GIDA 2020, 45, 20–30. [Google Scholar]
  44. Shahbazi, H.; Gahruied, H.; Golmakani, M.T.; Eskandari, M.H.; Movahedi, M. Effect of medicinal plant type and concentration on physicochemical, antioxidant, antimicrobial, and sensorial properties of Kombucha. Food Nutr. Res. 2018, 6, 2568–2577. [Google Scholar] [CrossRef] [PubMed]
  45. Tu, C.; Tang, S.; Azi, F.; Hu, W.; Dong, M. Use of kombucha consortium to transform soy whey into a novel functional beverage. J. Funct. Foods 2019, 52, 81–89. [Google Scholar] [CrossRef]
  46. Neffe-Skocinska, K.; Sionek, B.; Scibisz, I.; Kolozyn-Krajewska, D. Acid contents and the effect of fermentation condition of kombucha tea beverages on physicochemical, microbiological, and sensory properties. CyTA J. Food 2017, 15, 601–607. [Google Scholar] [CrossRef] [Green Version]
  47. Nurikasari, M.; Puspitasari, Y.; Yoni Siwi, R.P. Characterization and analysis kombucha tea antioxidant activity based on long fermentation as a beverage functional. J. Glob. Res. Public Health 2017, 2, 90–96. [Google Scholar]
  48. AL-Kalifawi, E.J.; Hassan, I.A. Factors Influence on the yield of bacterial cellulose of kombucha (khubdat humza). Baghdad Sci. J. 2014, 11, 1420–1428. [Google Scholar]
Figure 1. Total sugar content of kombucha fermentations (a) COr and (b) CFr stored at 25 °C for 15 days. Mean ± standard deviation. Letters (A, B, C) indicate significant differences between carbon sources by day, and letters (a, b, c) indicate a significant difference for the same carbon source during storage.
Coatings 10 01132 g001
Figure 2. Protein content of kombucha fermentations (a) COr and (b) CFr stored at 25 °C for 15 days. Mean ± standard deviation. Letters (A, B, C) indicate significant differences between carbon sources by day, and letters (a, b, c) indicate a significant difference for the same carbon source during storage.
Coatings 10 01132 g002
Figure 3. Representative images of the microbial cellulose films (a) COr + Glucose; (b) COr + Dextrose; (c) COr + Fructose; (d) COr + Saccharose; (e) CFr + Glucose; (f) CFr + Dextrose; (g) CFr + Fructose; and (h) CFr + Saccharose obtained after 15 days of fermentation at 25 °C.
Coatings 10 01132 g003
Figure 4. Representative images of the microbial cellulose films produced by the consortia (a) COr + Glucose and (b) CFr + Dextrose in a medium based on green tea after 15 days of fermentation at 25 °C.
Coatings 10 01132 g004
Figure 5. Yields of the microbial cellulose films obtained from COr and CFr consortia after 15 days of fermentation at 25 °C. (a) Dry basis and (b) wet basis.
Coatings 10 01132 g005
Table 1. Chemical composition of kombucha fermentations with various carbon sources stored at 25 °C for 15 days.
Initial
(day 0)
Final
(day 15)
Carbon SourcepH
COrCFrCOrCFr
GlucoseB3.03 ± 0.01aA2.96 ± 0.02aB2.28 ± 0.01bA2.24 ± 0.07b
DextroseAB3.01 ± 0.04aA2.96 ± 0.01aA2.20 ± 0.01bA2.48 ± 0.19b
FructoseA2.97 ± 0.00aB2.99 ± 0.01aC2.62 ± 0.04bA2.50 ± 0.26b
SaccharoseAB2.98 ± 0.04aA2.94 ± 0.01aD2.73 ± 0.02bA2.53 ± 0.06a
Carbon SourceTSS (°Brix)
COrCFrCOrCFr
GlucoseC4.95 ± 0.07aA4.65 ± 0.35aA3.80 ± 0.17bA4.07 ± 0.12b
DextroseB4.70 ± 0.14aA4.60 ± 0.57aA3.43 ± 0.35bA3.97 ± 0.06a
FructoseA4.30 ± 0.14aA4.80 ± 0.28aA3.73 ± 0.06bA3.83 ± 0.38b
SaccharoseB4.60 ± 0.00aA4.70 ± 0.14aA3.93 ± 0.12bA4.07 ± 0.12a
Carbon SourceTA (acetic acid %)
COrCFrCOrCFr
GlucoseA0.12 ± 0.03aA0.09 ± 0.02aB1.61 ± 0.08bAB1.25 ± 0.14b
DextroseA0.10 ± 0.03aA0.11 ± 0.05aAB1.20 ± 0.59bB1.46 ± 0.09b
FructoseA0.12 ± 0.03bA0.09 ± 0.02aA0.54 ± 0.11bAB0.96 ± 0.62b
SaccharoseA0.12 ± 0.00aA0.10 ± 0.02aA0.42 ± 0.12bA0.44 ± 0.17b
Note: Mean ± standard deviation. Letters in columns (A, B, C) indicate significant differences between the carbon sources, and letters in rows (a, b) indicate significant differences between the fermentation time (days 0 and 15).
Table 2. Color determinations of kombucha fermentations with various carbon sources stored at 25 °C for 15 days.
Carbon SourceInitial
(day 0)
Final
(day 15)
Carbon SourceL*
COrCFrCOrCFr
GlucoseA23.73 ± 0.87bA21.60 ± 0.23bA18.33 ± 0.59aA18.10 ± 0.35a
DextroseA24.85 ± 0.98aA23.10 ± 3.58aA20.67 ± 4.82 aA19.00 ± 0.78a
FructoseA23.63 ± 0.06bA22.50 ± 2.42bA19.60 ± 0.69aA18.70 ± 0.56a
SaccharoseB28.45 ± 0.17bA25.15 ± 2.14bA18.10 ± 2.96aA19.30 ± 1.04a
Carbon Sourcea*
COrCFrCOrCFr
GlucoseA2.95 ± 0.64aA4.75 ± 1.79aA4.07 ± 0.72aA4.07 ± 0.81a
DextroseA1.45 ± 0.40aA2.30 ± 2.66aA3.83 ± 0.91bA4.47 ± 1.89a
FructoseA3.10 ± 1.73aA2.65 ± 2.02aA5.13 ± 1.76aA4.83 ± 0.12a
SaccharoseA3.20 ± 0.92aA2.35 ± 0.29aA3.70 ± 1.18aA4.83 ± 0.06b
Carbon Sourceb*
COrCFrCOrCFr
GlucoseA14.00 ± 0.81aA10.05 ± 0.52aA14.90 ±1.40aA15.60 ± 2.94b
DextroseB17.55 ± 0.17aB15.35 ± 3.52aA16.27 ± 4.45aA15.47 ± 1.53a
FructoseC15.75 ± 0.98aAB12.30 ± 3.00aA14.90 ± 1.65aA14.73 ± 1.89a
SaccharoseD21.90 ± 0.23bB17.30 ± 1.39aA14.57 ± 4.35aA15.10 ± 0.69
Carbon SourceC
COrCFrCOrCFr
GlucoseA14.30 ± 0.92aA11.25 ± 1.21aA15.47 ± 1.29aA16.17 ± 3.06b
DextroseAB17.65 ± 0.17aAB15.60 ± 3.81aA16.77 ± 4.10aA16.13 ± 1.79a
FructoseAB16.1 ± 1.27aAB12.65 ± 3.41aA15.87 ± 1.48aA15.53 ± 1.79a
SaccharoseB22.15 ± 0.40bB17.45 ± 1.33aA15.10 ± 4.11aA15.90 ± 0.69a
Carbon SourceH
COrCFrCOrCFr
GlucoseA77.95 ± 1.79aA65.20 ± 7.39aA74.60 ± 3.15aA75.33 ± 0.29a
DextroseB85.20 ± 1.39bB82.90 ± 8.08aA75.37 ± 7.23aA74.20 ± 5.63a
FructoseAB79.05 ± 5.37aB78.80 ± 6.41aA70.77 ± 6.99aA71.60 ± 1.80a
SaccharoseAB81.60 ± 2.19aB81.90 ± 1.56bA74.40 ± 6.74aA72.23 ± 0.98a
Note: Mean ± standard deviation. Letters in columns (A, B, C) indicate significant differences between the carbon sources, and letters in rows (a, b) indicate significant differences between the fermentation time (days 0 and 15).
Table 3. Changes in the clarity level of kombucha fermentations with various carbon sources stored at 25 °C for 15 days.
COr
Storage (days)GlucoseDextroseFructoseSaccharose
0Very clearVery clearVery clearVery clear
3TurbidClearClearClear
6TurbidTurbidTurbidTurbid
9Very TurbidTurbidTurbidTurbid
12Very turbidVery turbidVery turbidVery turbid
15Very turbidVery turbidVery turbidVery turbid
CFr
Storage (days)GlucoseDextroseFructoseSaccharose
0Very clearVery clearVery clearVery clear
3TurbidClearClearClear
6TurbidTurbidTurbidTurbid
9TurbidTurbidTurbidTurbid
12Very turbidVery turbidVery turbidVery turbid
15Very turbidVery turbidVery turbidVery turbid
Publisher’s Note: MDPI stays neutral with regard to jurisdictional claims in published maps and institutional affiliations.

