Article

Fabrication and Property Evaluation of the Al2O3-TiO2 Composite Coatings Prepared by Plasma Spray

1
EHV Transmission Company, China Southern Power Grid Co., Ltd., Guangzhou 540000, China
2
Liuzhou Bureau of EHV Transmission Company, China Southern Power Grid Co., Ltd., Liuzhou 545006, China
3
Merchant Marine College, Shanghai Maritime University, Shanghai 201306, China
*
Authors to whom correspondence should be addressed.
Coatings 2020, 10(11), 1122; https://doi.org/10.3390/coatings10111122
Submission received: 21 October 2020 / Revised: 15 November 2020 / Accepted: 18 November 2020 / Published: 20 November 2020
(This article belongs to the Special Issue New Advances in Thermal Spraying)

Abstract

:
The Al2O3-13 wt.% TiO2 (AT13) composite coatings were prepared on Q235 steel by plasma spray technique. The spray parameters were designed by the orthogonal experiments, and the properties of the coating were evaluated. Results showed that with respect to the bond strength of the coating, the optimized spraying parameters were the plasma current of 530 A, Ar flow of 41 L/min, H2 flow of 10 L/min, and spray standoff distance of 100 mm. The plasma spray process led to the transition of α-Al2O3 to γ-Al2O3, resulting in the increase in the porosity of AT13 coating prepared at nonoptimized parameters. Meanwhile, the porosity and cracks were also increased due to the decrease in the Ar flow and the increase in spray standoff distance. The low porosity, a few cracks, and the uniformly dispersed TiO2 particles contributed the enhanced properties including mechanical and corrosion behaviors of the AT13 coating prepared at optimized parameters. The bond strength, microhardness, and thermal shock resistance of the AT13 coating could reach 25.01 MPa, 1000.6 HV0.5, and 40 times when the coating was prepared at optimized parameters, respectively. Especially, the static Icorr of the AT13 coating prepared at optimized parameters was two order of magnitude less than that of Q235 steel. In addition, the erosion weight loss of Q235 steel could be decreased about 30 times by the protection of the AT13 coating.

1. Introduction

Due to the high strength, low density, and good welding property, the Q235 steels have been widely used as the main materials of the steel structures in many fields like electric transmission system and marine engineering [1]. However, the resistances of the Q235 steels to outside impacts are not good enough when they confront the severe working surroundings. Especially, the working environments related to wear, corrosion, high-temperature oxidation, etc. can bring into the severe failure behaviors of the Q235 steels, which can lead to the terrible challenge in security of the working systems [2,3]. Therefore, the effective and protective coatings are in great request for enhancing the working properties of the Q235 steels.
In recent decades, a kind of novel high-performance A12O3-TiO2 (AT) ceramic composite coating has been extensively researched due to the superior hardness, corrosion resistance, wear resistance, and high-temperature stability. The researches have suggested that the AT coatings could be the qualified protection for Q235 steels [4,5,6,7,8,9,10,11,12]. For example, Zorawsk et al. [4,5] fabricated the nanostructured A12O3-13 wt.% TiO2 (AT13) coatings by plasma spray and found that the coating possessed the superior microhardness, modulus, and tribological properties. Celik [6] utilized the plasma spray technique to fabricate the AT13 and AT40 (40 wt.% TiO2) coatings, and their microhardness were 800 ± 39 HV0.1 and 1500 ± 35 HV0.1, respectively, which could improve the tribological property of the substrates. Cui et al. [7] sprayed AT20 (20 wt.% TiO2) coatings on Grade D steel and found that the wear rate of the coating was less than 2% of that of the steel. Among these AT series coatings, the plasma-sprayed AT13 coatings have attracted the main research interest due to their superior integrated mechanical properties including hardness, Young’s modulus, toughness, wear resistance, etc. [4,5,8,9,10,11]. For instance, Zou et al. [13] adopted the air plasma spray (APS) to fabricate the AT13 coatings and found that the spraying current had strong effects on the mechanical and tribological properties of the coatings. In addition, the best wear resistance of the coatings was obtained at the spraying current range from 600 to 650 A. Mehar et al. [14] found that the addition of 20 wt.% Y2O3 particles resulted in the better densification and enhanced fracture strength of AT13 coating. In addition, the Y2O3 could reduce the friction coefficient and wear rate. Lu et al. [15] investigated the phase composition of the plasma-sprayed AT13 coatings and found that the α-Al2O3 phase of the raw particles was transformed into the metastable γ-Al2O3 phase of the AT13 coating. Although many investigations on the fabrication and characterization of the AT13 coatings were carried out, the detailed investigations on the influences of the plasma spray parameters on the microstructure and properties of the AT13 coatings are inadequate, consequently limiting the broadening applications of the coatings. As the main parameters, Ar flow [11], plasma current [16], H2 flow, and spray standoff distance have greatly important effects on the establishment of the AT13 coatings [17,18,19]. Therefore, the effects of these parameters on the fabrication of the AT13 coatings need to be comprehensively explored. Especially, how the microstructure and property of the coatings evolve with various parameters should be deeply investigated, which is greatly meaningful for enhancing the applications of the AT13 coatings.
Herein, the various AT13 coatings were fabricated on the substrates of Q235 steels via plasma spray process with a series of different parameters including plasma current, Ar flow, H2 flow, and spray standoff distance. The morphology, composition, microstructure, and property of the AT13 coatings were analyzed. Especially, the properties of the coatings including bond strength, microhardness, erosion, corrosion, and thermal shocks were deeply evaluated. The relationship between parameters, microstructure, and properties of the AT13 coatings were established.

2. Materials and Experiments

2.1. Fabrications of the AT13 Coatings

The Q235 steels with the size of 25 mm × 25 mm × 5 mm worked as the substrates for the fabrication of the AT13 coatings. The as-received AT13 composite particles (agglomerated and sintered particles, Harbin peize material technology co., LTD, Harbin, China, as shown in Figure 1a,b) worked as the feeding materials for the establishment of the AT13 coatings by plasma spray technique. To improve the adhesion strength of the ceramic coatings, a kind of bonding layer of Ni5Al (Ni-5 wt.% Al) composite metals was firstly prepared on Q235 steels before fabrication of the ceramic coatings. The surface morphologies of the as-received Ni5Al particles (Shanghai Yongan welding materials company, Shanghai, China) are exhibited in Figure 1c,d. From Figure 1, it can be seen that the composite particles are all approximately spherical shaped, which consist of two different ceramics or metals. In addition, the average sizes of the as-received AT13 and Ni5Al particles are almost 45 and 75 μm, respectively. The composite coatings were fabricated by plasma spray instruments (UniCoatProTM, Oerlikon Metco Co., Ltd., Pfäffikon, Switzerland) with F4MB-XL spray gun and PT3X IPS-1000 power supply employing the Ar and H2 gas. By adjusting the spray gun moving speed and spray passes, the thickness of all the coatings could reach about 130 μm.
Before plasma spraying, a 25 × 25 mm2 surface of Q235 substrates were treated by Al2O3 sand blasting to remove the surface contamination and optimize the surface conditions of the substrates. After that, the substrates were ultrasonically cleaned by the pure water and ethanol in sequence for 5 min.
In the plasma spray process, the main parameters to be investigated were plasma current, Ar flow, H2 flow, and spray standoff distance, which had the relative more effects on the fabrication of the coatings. Other spray parameters were fixed, like Ar carrier gas flow of 3.2 L/min, spray scanning speed of 200 cm/s, and step of 2 mm. For the establishment of Ni5Al bonding layer, the plasma current, Ar flow, H2 flow, and spray standoff distance were fixed to 650 A, 45 L/min, 13 L/min, and 90 mm, respectively. These parameters endowed the coating with the good bond strength (27.37 ± 1.18 MPa) and mechanical property, which was verified by previous experiments.
After plasma spraying, the samples were ultrasonically cleaned by the ethanol for the further characterization. The cross-sections of coatings were fabricated by polishing and etching in mixed solutions of 500 mL/L nitric acid (H3NO3) and 500 mL/L glacial acetic acid (C2H4O2) for 10 s to exhibit clear cross-sections of the samples.

2.2. Characterization of the AT13 Coatings

For the accurate evaluation on microstructure and properties of the coatings, three samples were prepared at the same parameters and repeatedly characterized.
The surface and cross-section morphology and composition distribution of the coatings were characterized by the scanning electron microscope (SEM, Hitachi TM3030, Tokyo, Japan) and energy dispersive spectroscopy (EDS, Oxford Swift 3000, Oxford, UK). With the assist of ImageJ software, the porosity of the coatings could be evaluated from the SEM morphology in a fixed threshold value. The determination principle of the threshold value was that adjusting the values of red color to exhibit as many pores as possible. The phase composition of the coatings was analyzed by X-ray diffraction (XRD, Rigaku Ultima IV, Tokyo, Japan) with Cu-Ka radiation (wave length = 0.154 nm). The voltage and current of XRD were 40 kV and 30 mA, respectively. The detected angles were ranged from 20° to 100°. The X-ray scanning speed was 2°/min, and the step was 0.02°.
The bond strength of the whole sprayed coatings was evaluated by the pull-out tester (BGD 500 Digital Display Adhesion Tester, Guangzhou Biaogeda Laboratory Instrument Supplies Co., Ltd., Guangzhou, China). The 3 M Scotch-Weld structural glue worked as the bonding medium between coatings and buttons/dollies of the pull-out tester with the diameter of 10 mm. After being coated with the scotch-weld glue, the samples were placed in the oven and solidified at 100 °C for 3 h.
The microhardness of the coatings was measured using a Vickers Microhardness Tester (HXD-100 TMC/LCD microhardness tester, Shanghai Taiming, Shanghai, China) along the cross-section. The working load and loading time were 500 gf and 15 s, respectively. To ensure the accuracy of the microhardness value, 3 points of the same depth with an interval of 0.5 mm were measured in each test area, and the average value was taken.
The thermal shocks property of the coatings was evaluated by the heating–cooling experiments, which were conducted by a KSJO chamber electric furnace (Shanghai Yanshi electric furnace company, Shanghai, China). In priority, the samples were heated at 550 °C for 15 min. After that, the heated samples were placed into the pure water at room temperature to rapidly cool down. Consequently, the resistance to thermal shock of the coatings were investigated by the repetition of the above heating and cooling process. The repetition times were the final evaluation of the resistance to thermal shocks when peeling off about one-third of surface area of the coating.
The corrosion behaviors of the coatings were analyzed by an electrochemical workstation (Swiss Metrohm Autolab Electrochemical Workstation, Herisau, Switzerland) with standard three electrodes system at room temperature. The corrosion media was 3.5 wt.% NaCl solution. In the three electrodes, the coating, platinum plate, and Ag/AgCl electrode worked as the working, counter, and reference electrodes, respectively. The open-circuit potential (OCP) of the coating was measured for 1 h. The potentiodynamic polarization experiments of the coatings were carried out with the scanning speed of 1 mV/s around OCP. Before each corrosion experiments, the samples were firstly immersed in 3.5 wt.% NaCl solution for 2 h.
The erosion behaviors of the coatings were characterized by an erosion test setup [20]. The experimental solution consisted of the 3.5 wt.% NaCl and 40 wt.% SiC sands (~100 μm) suspension. The rotation speed of impeller was kept at 550 rpm and the stirring time was 10 h. After erosion experiments, the samples were rinsed by the pure water and ultrasonically cleaned in ethanol. After that, the samples were completely dried by the warm hairdryer. The weight loss of the samples was evaluated by a precision electronic balance model FA1004N (Shanghai Precision Scientific Instrument Co., Ltd. Shanghai, China). Moreover, the surface morphology of the coating after erosion was characterized by SEM.

3. Results and Discussion

3.1. Fabrication of the Optimized AT13 Coatings

The orthogonal experiment method was used to select the optimized spray parameters in terms of bond strength [21,22,23], which was essentially important for safeguarding the service of the coating. In the orthogonal experiments, the plasma current, Ar flow, H2 flow, and spray standoff distance were the variations, which was adopted as the common four factors and three levels listed in Table 1. Moreover, the Ar carrier gas flow, spray scanning speed, and step were set to 3.2 L/min, 200 cm/s, and 2 mm, respectively. At each set of parameters, three samples were prepared for the evaluation on bond strength.
According to Table 1, the orthogonal experimental parameters are listed in Table 2 in detail to explore the effects of various parameters combinations on establishment of the AT13 coatings. The bond strength of three samples prepared under each combined parameter were examined. The bond strength results of the coatings are listed in Table 3. It can be found that the effects of the parameters on the bond strength were much severe. The bond strength of some coatings could reach 23 MPa, while some were less than 10 MPa.
Table 4 shows the range analysis of the bond strength of the AT13 coatings prepared at three levels. It is observed that the effects of four factors on the bond strength of the coatings are very different. The maximum value of bond strength appears at the level I, level III, level I and level II for the plasma current, Ar flow, H2 flow, and spray standoff distance, respectively. The spray standoff distance has more effects on the bond strength of the coating than other parameters. Thus, the plasma current (530 A), Ar flow (41 L/min), H2 flow (10 L/min), and spray standoff distance (100 mm) were determined to be the optimized spray parameter combination. To further verify the accuracy of the optimized spray parameter combination, the bond strength of the coating prepared at the optimized parameters were examined to be 25.01 ± 2.20 MPa derived from the average value of 23.41, 25.10, and 26.52 MPa of three samples, which was higher than that of the coating prepared at other parameters listed in Table 3. This further illustrated that the determination of the optimized parameters could be appropriate.

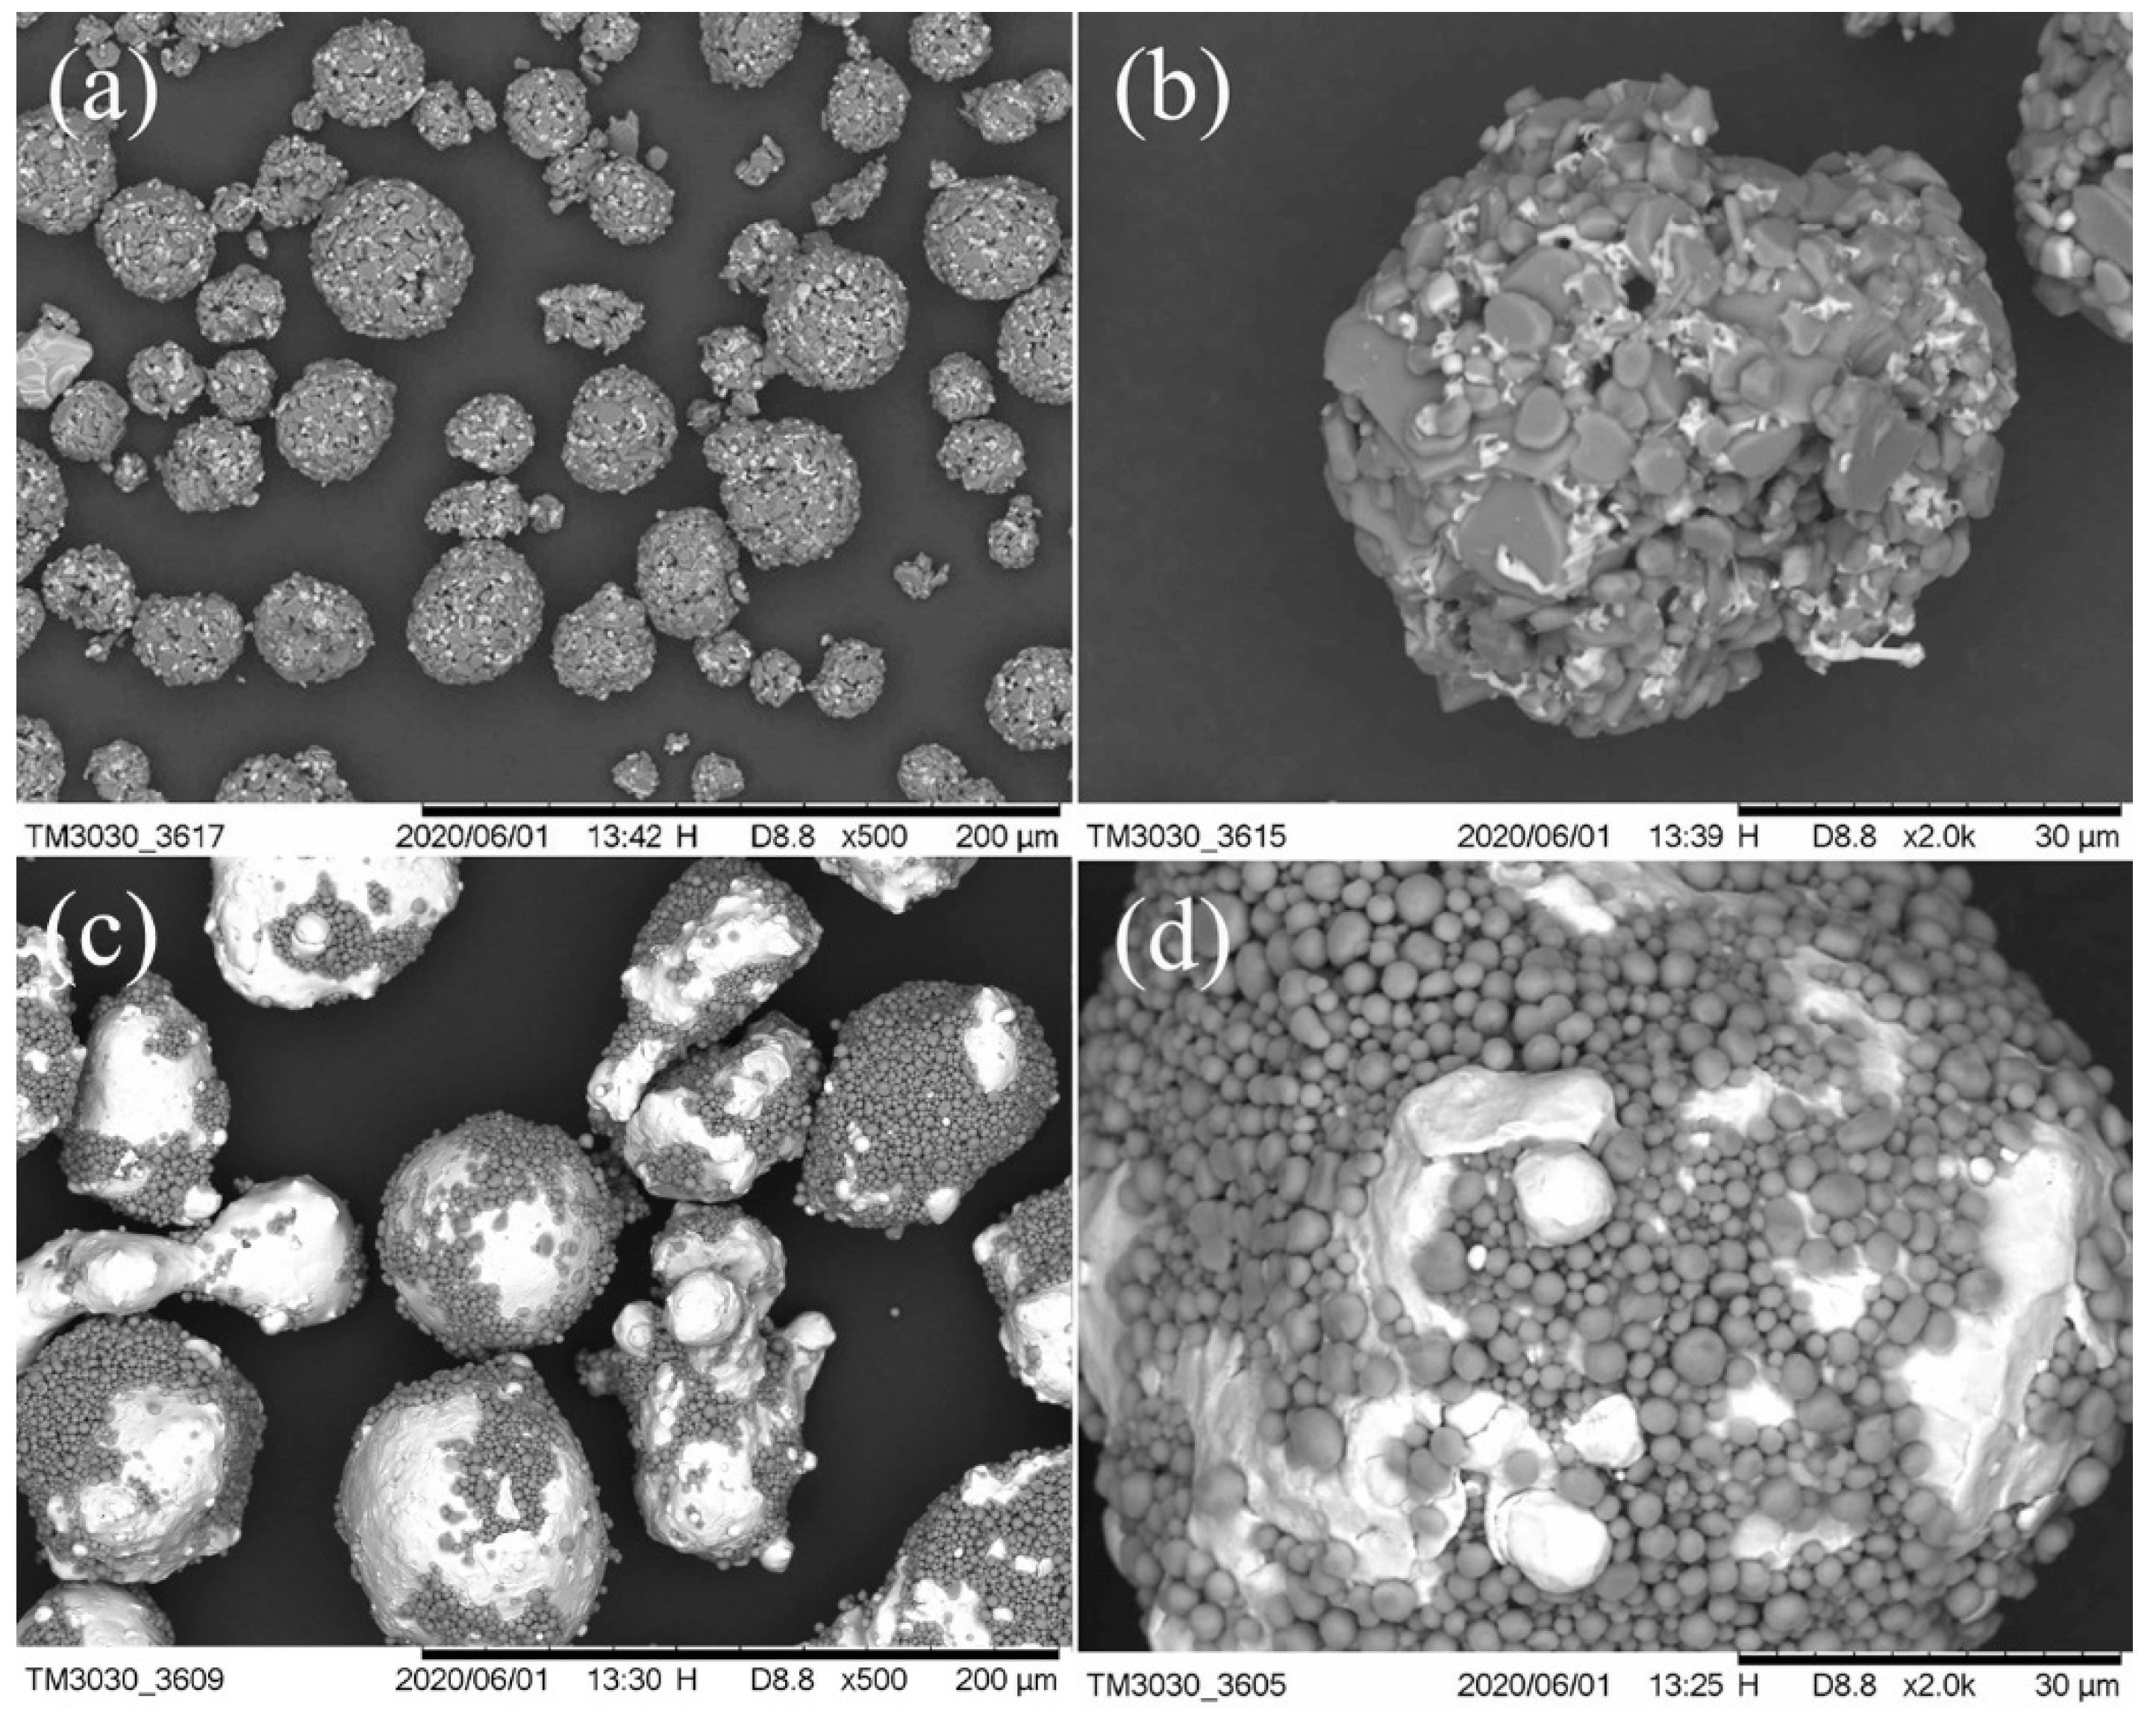
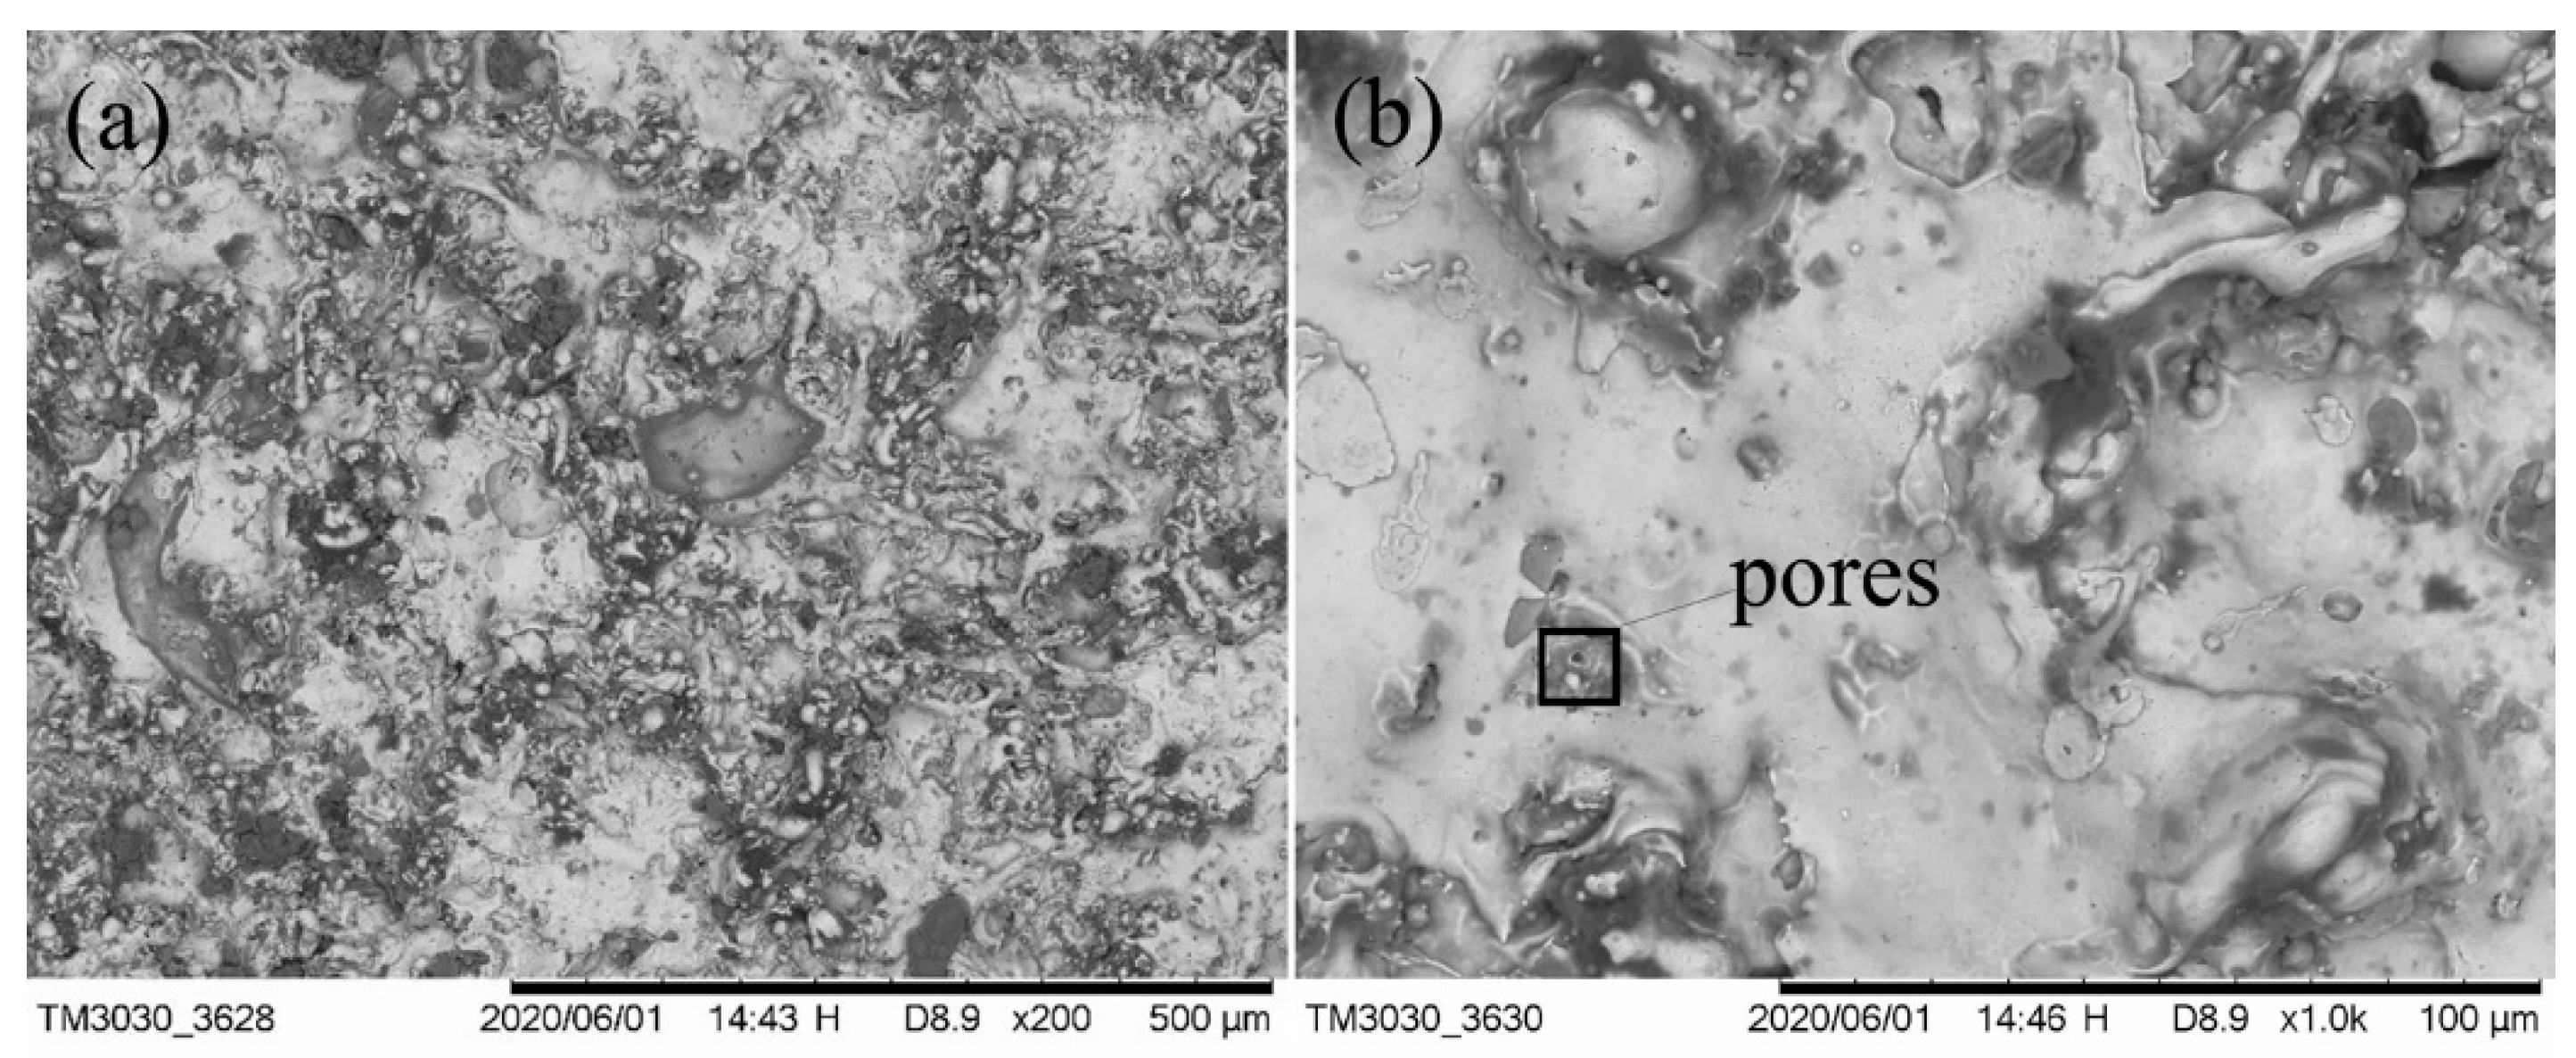
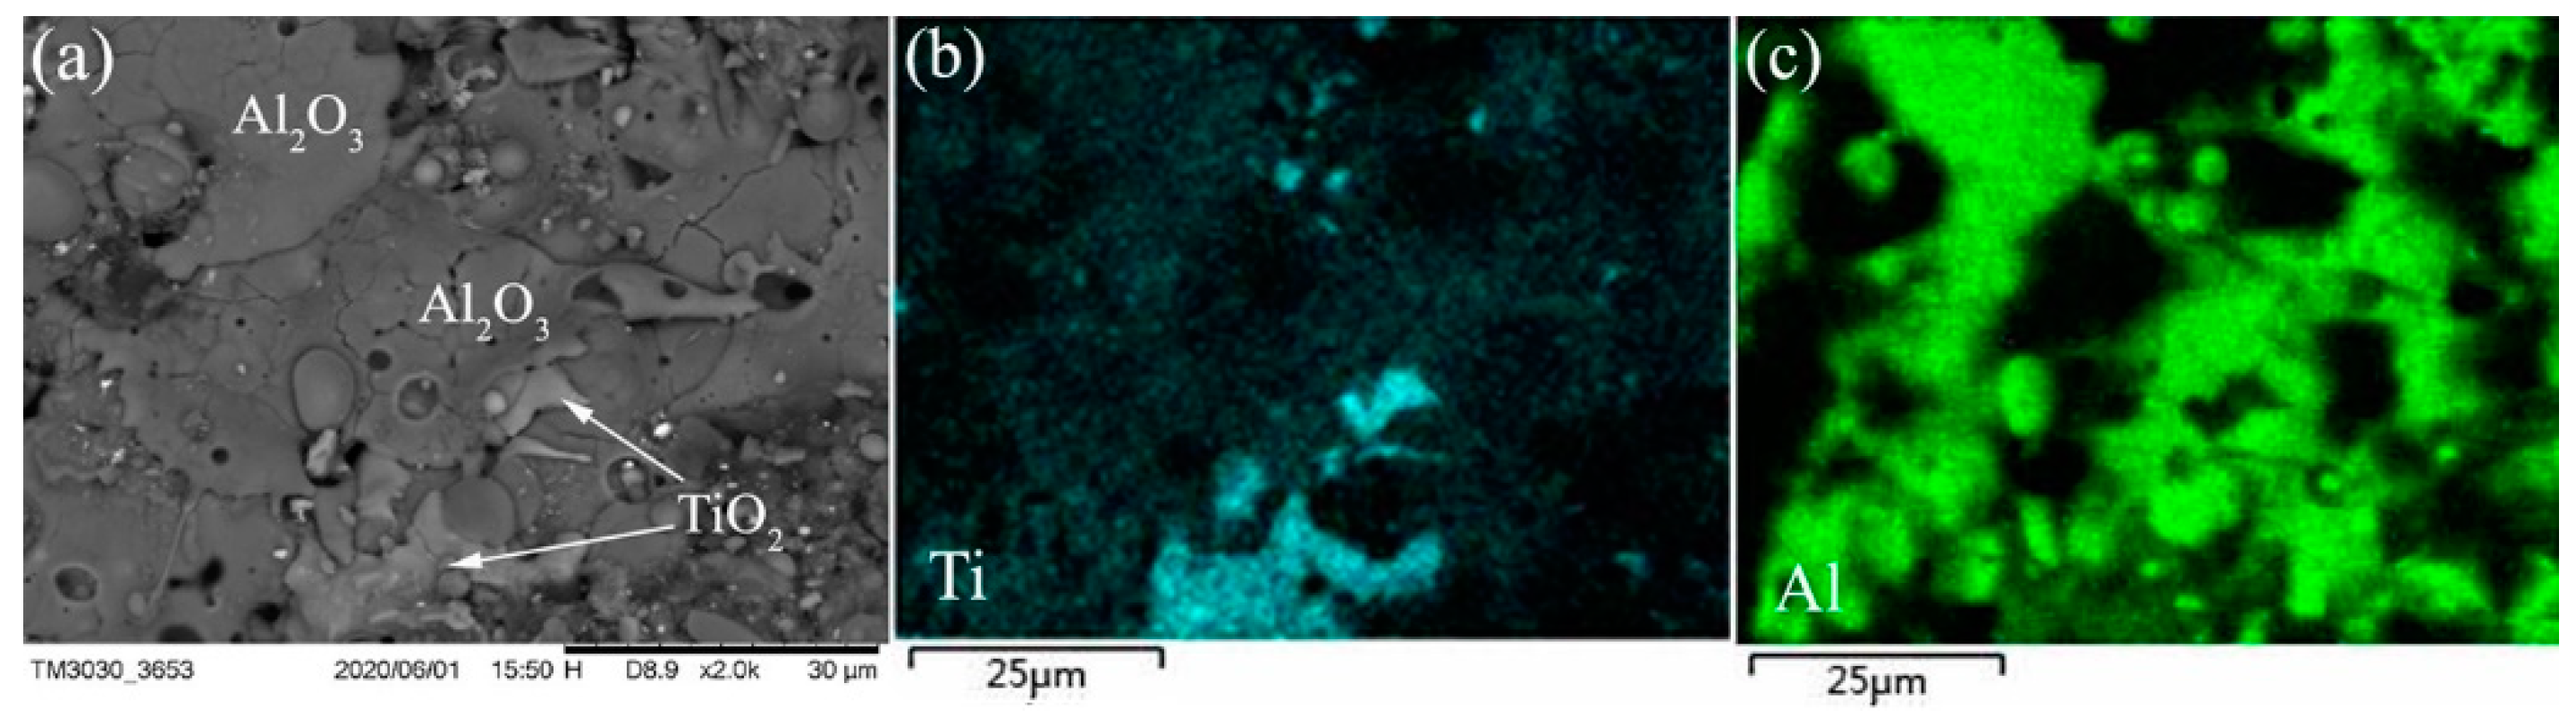
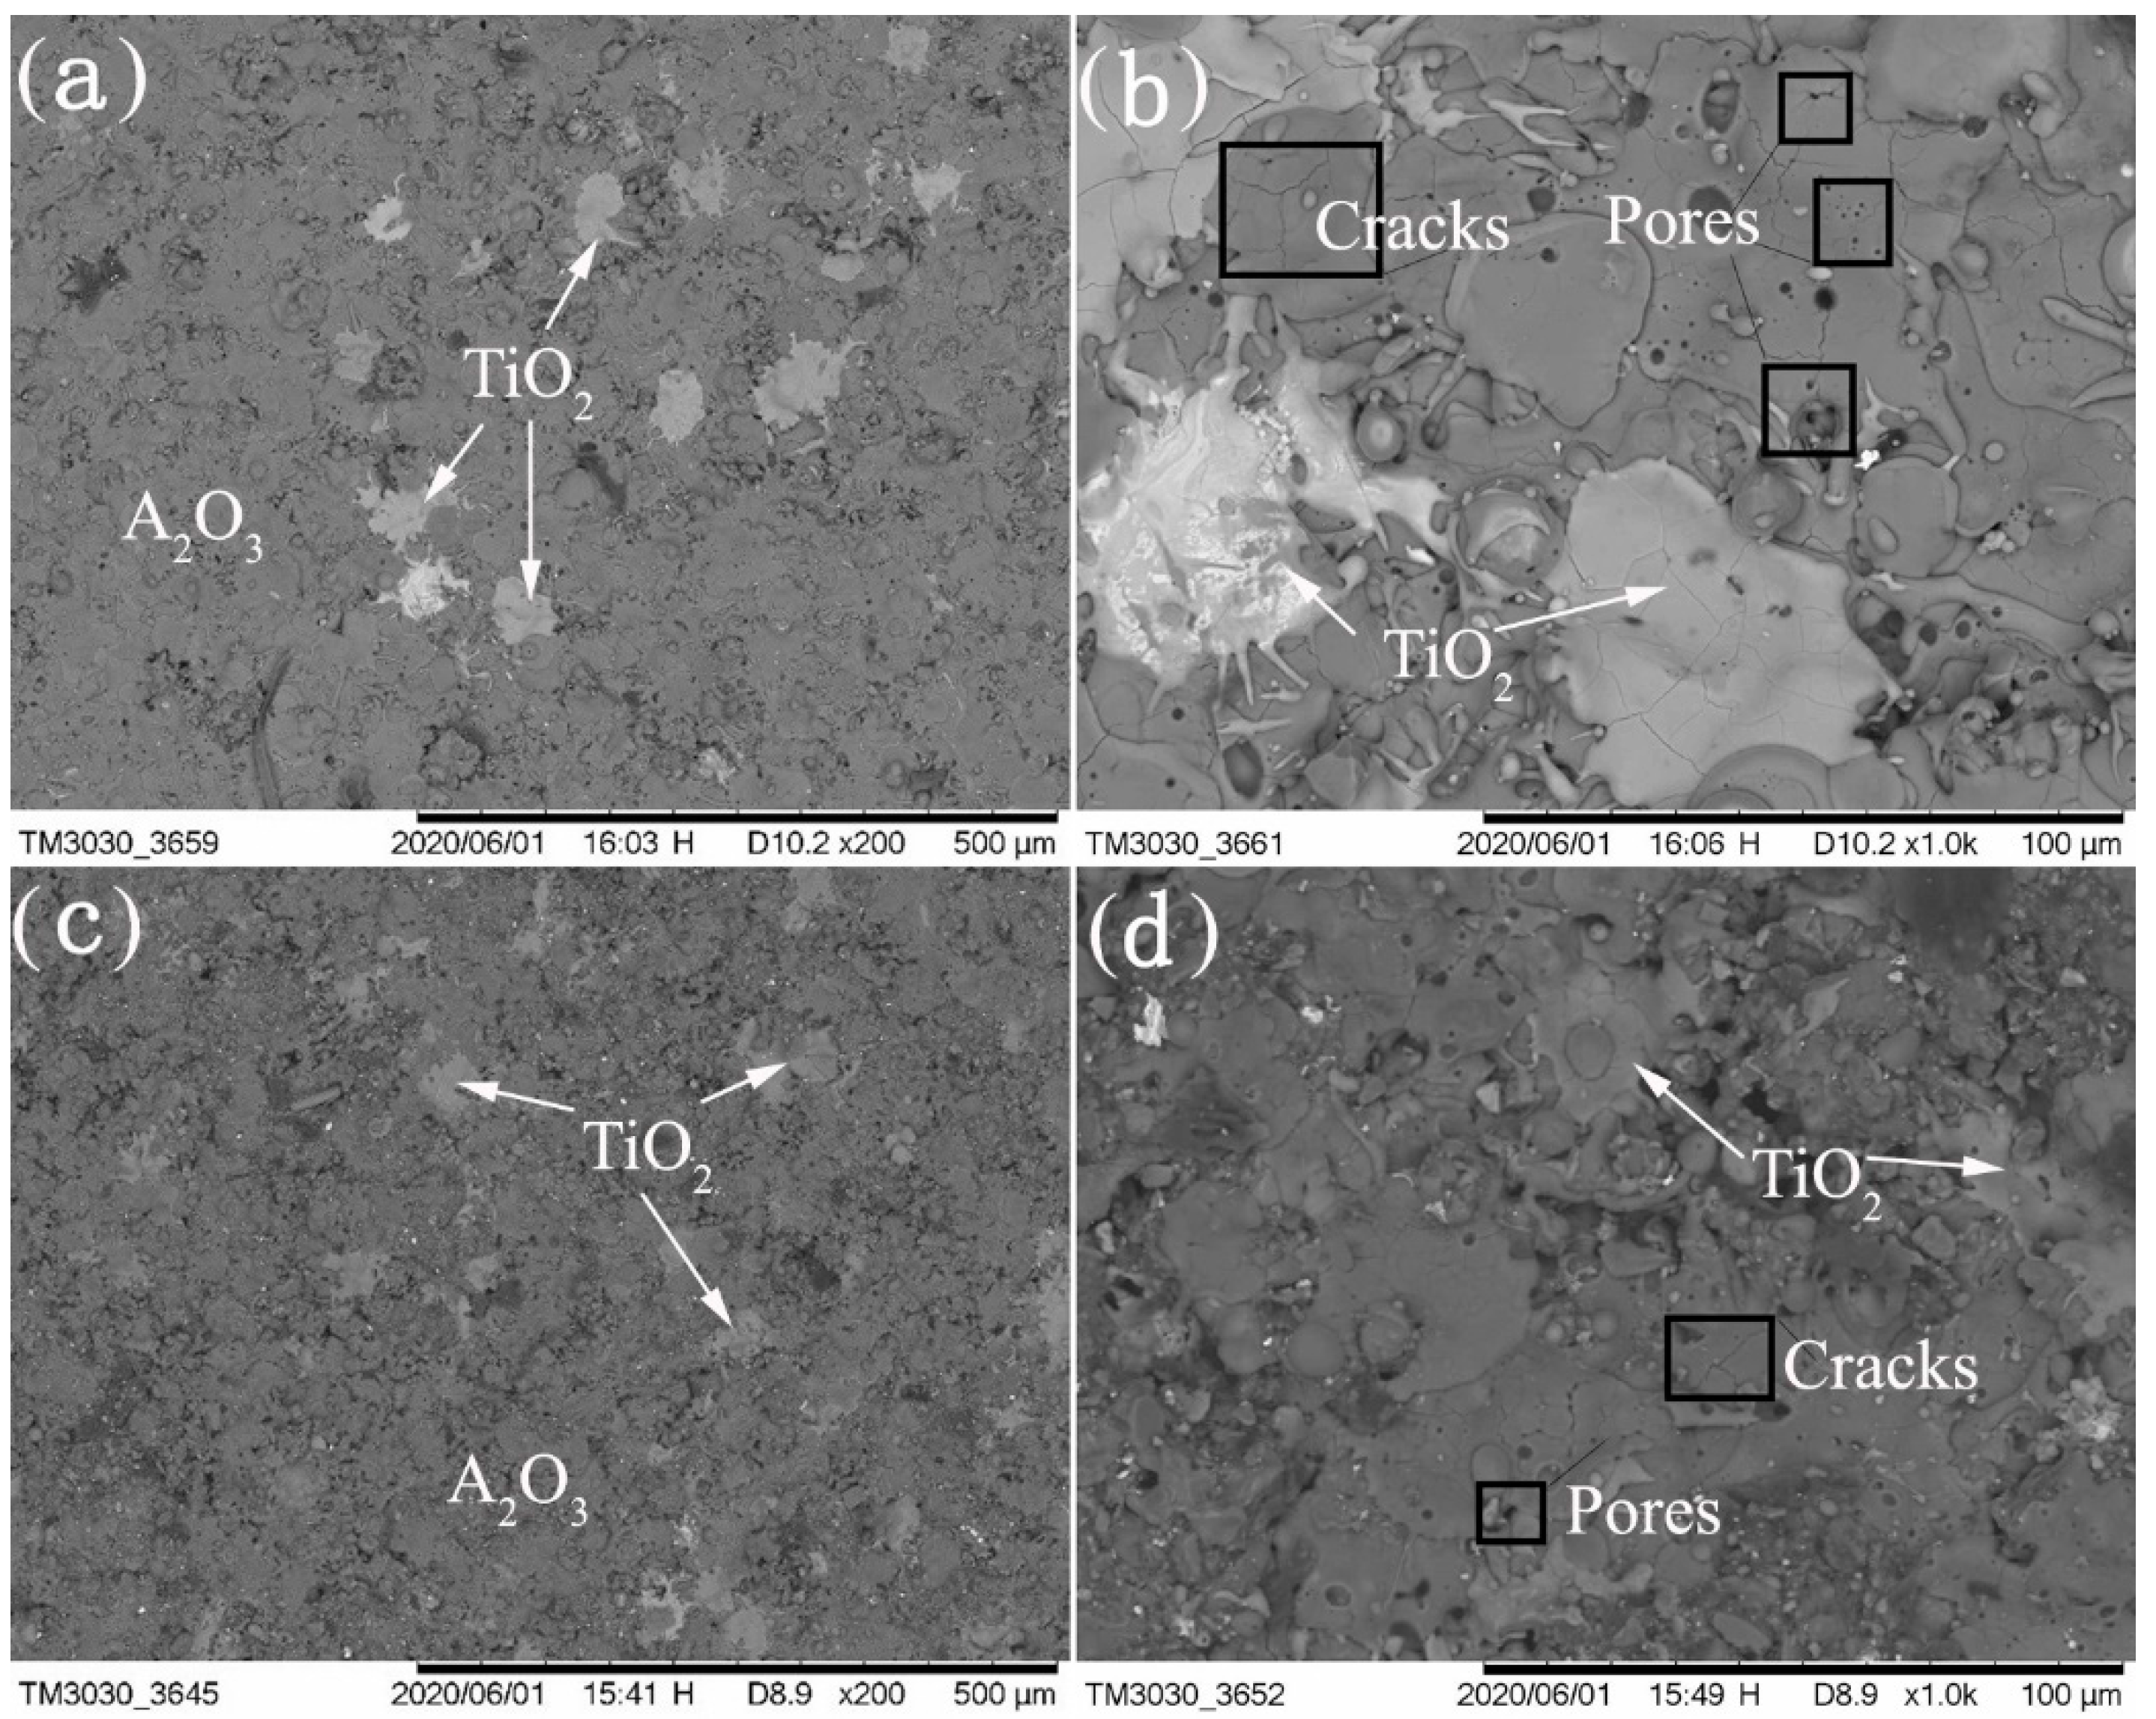
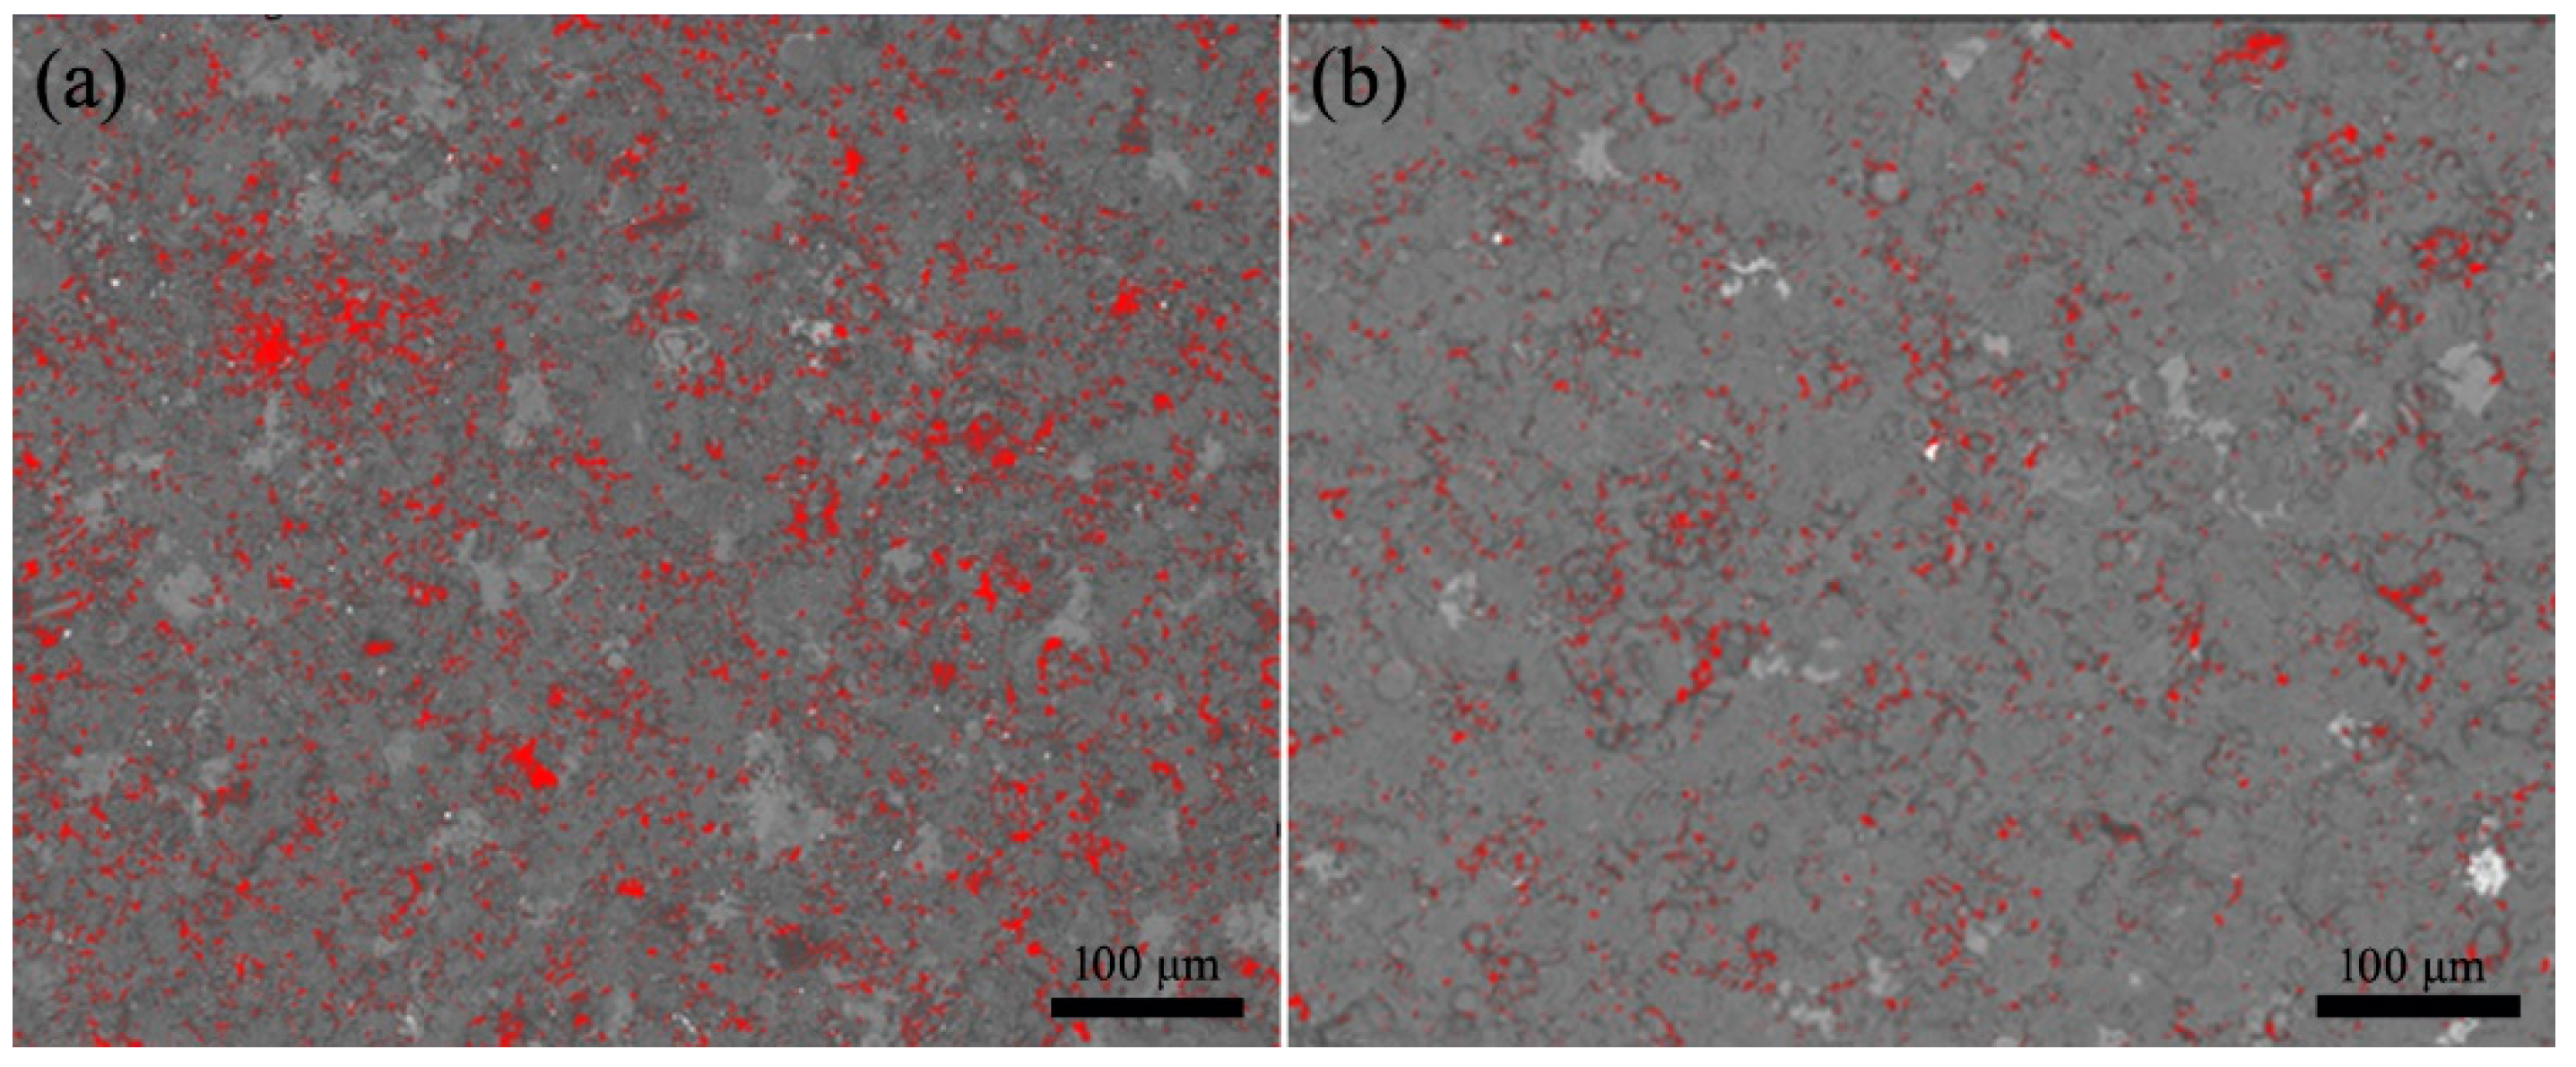
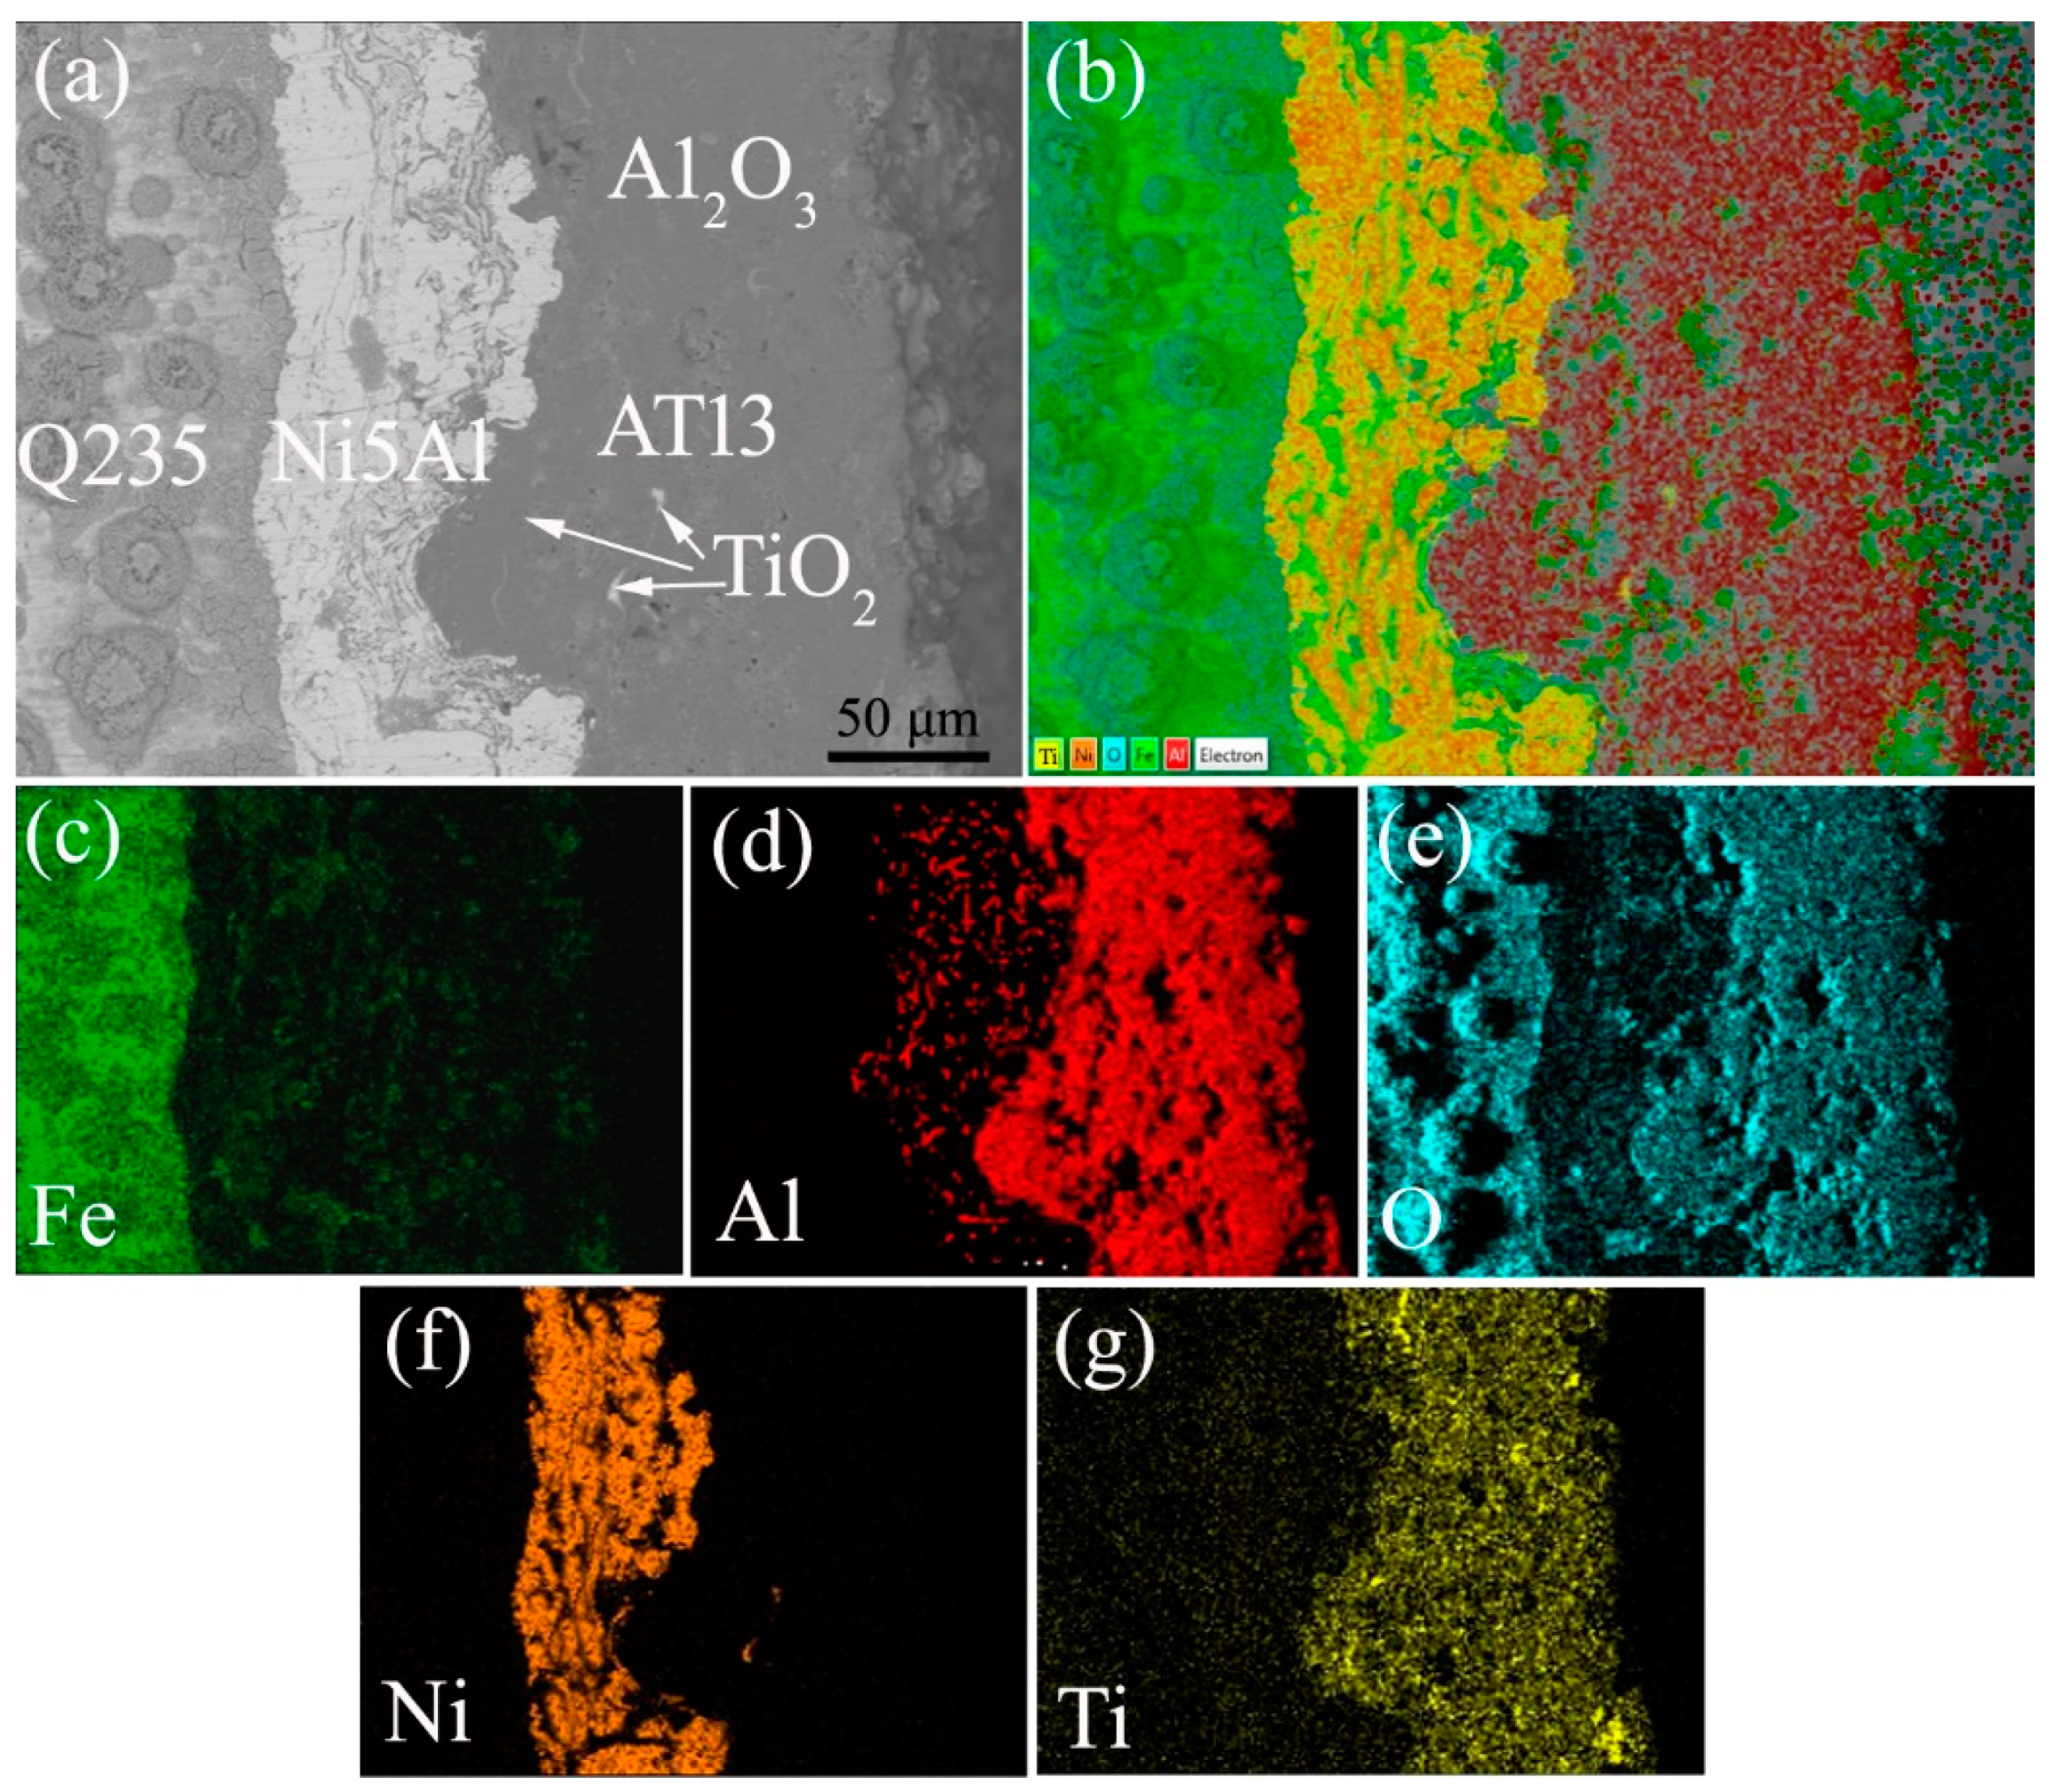
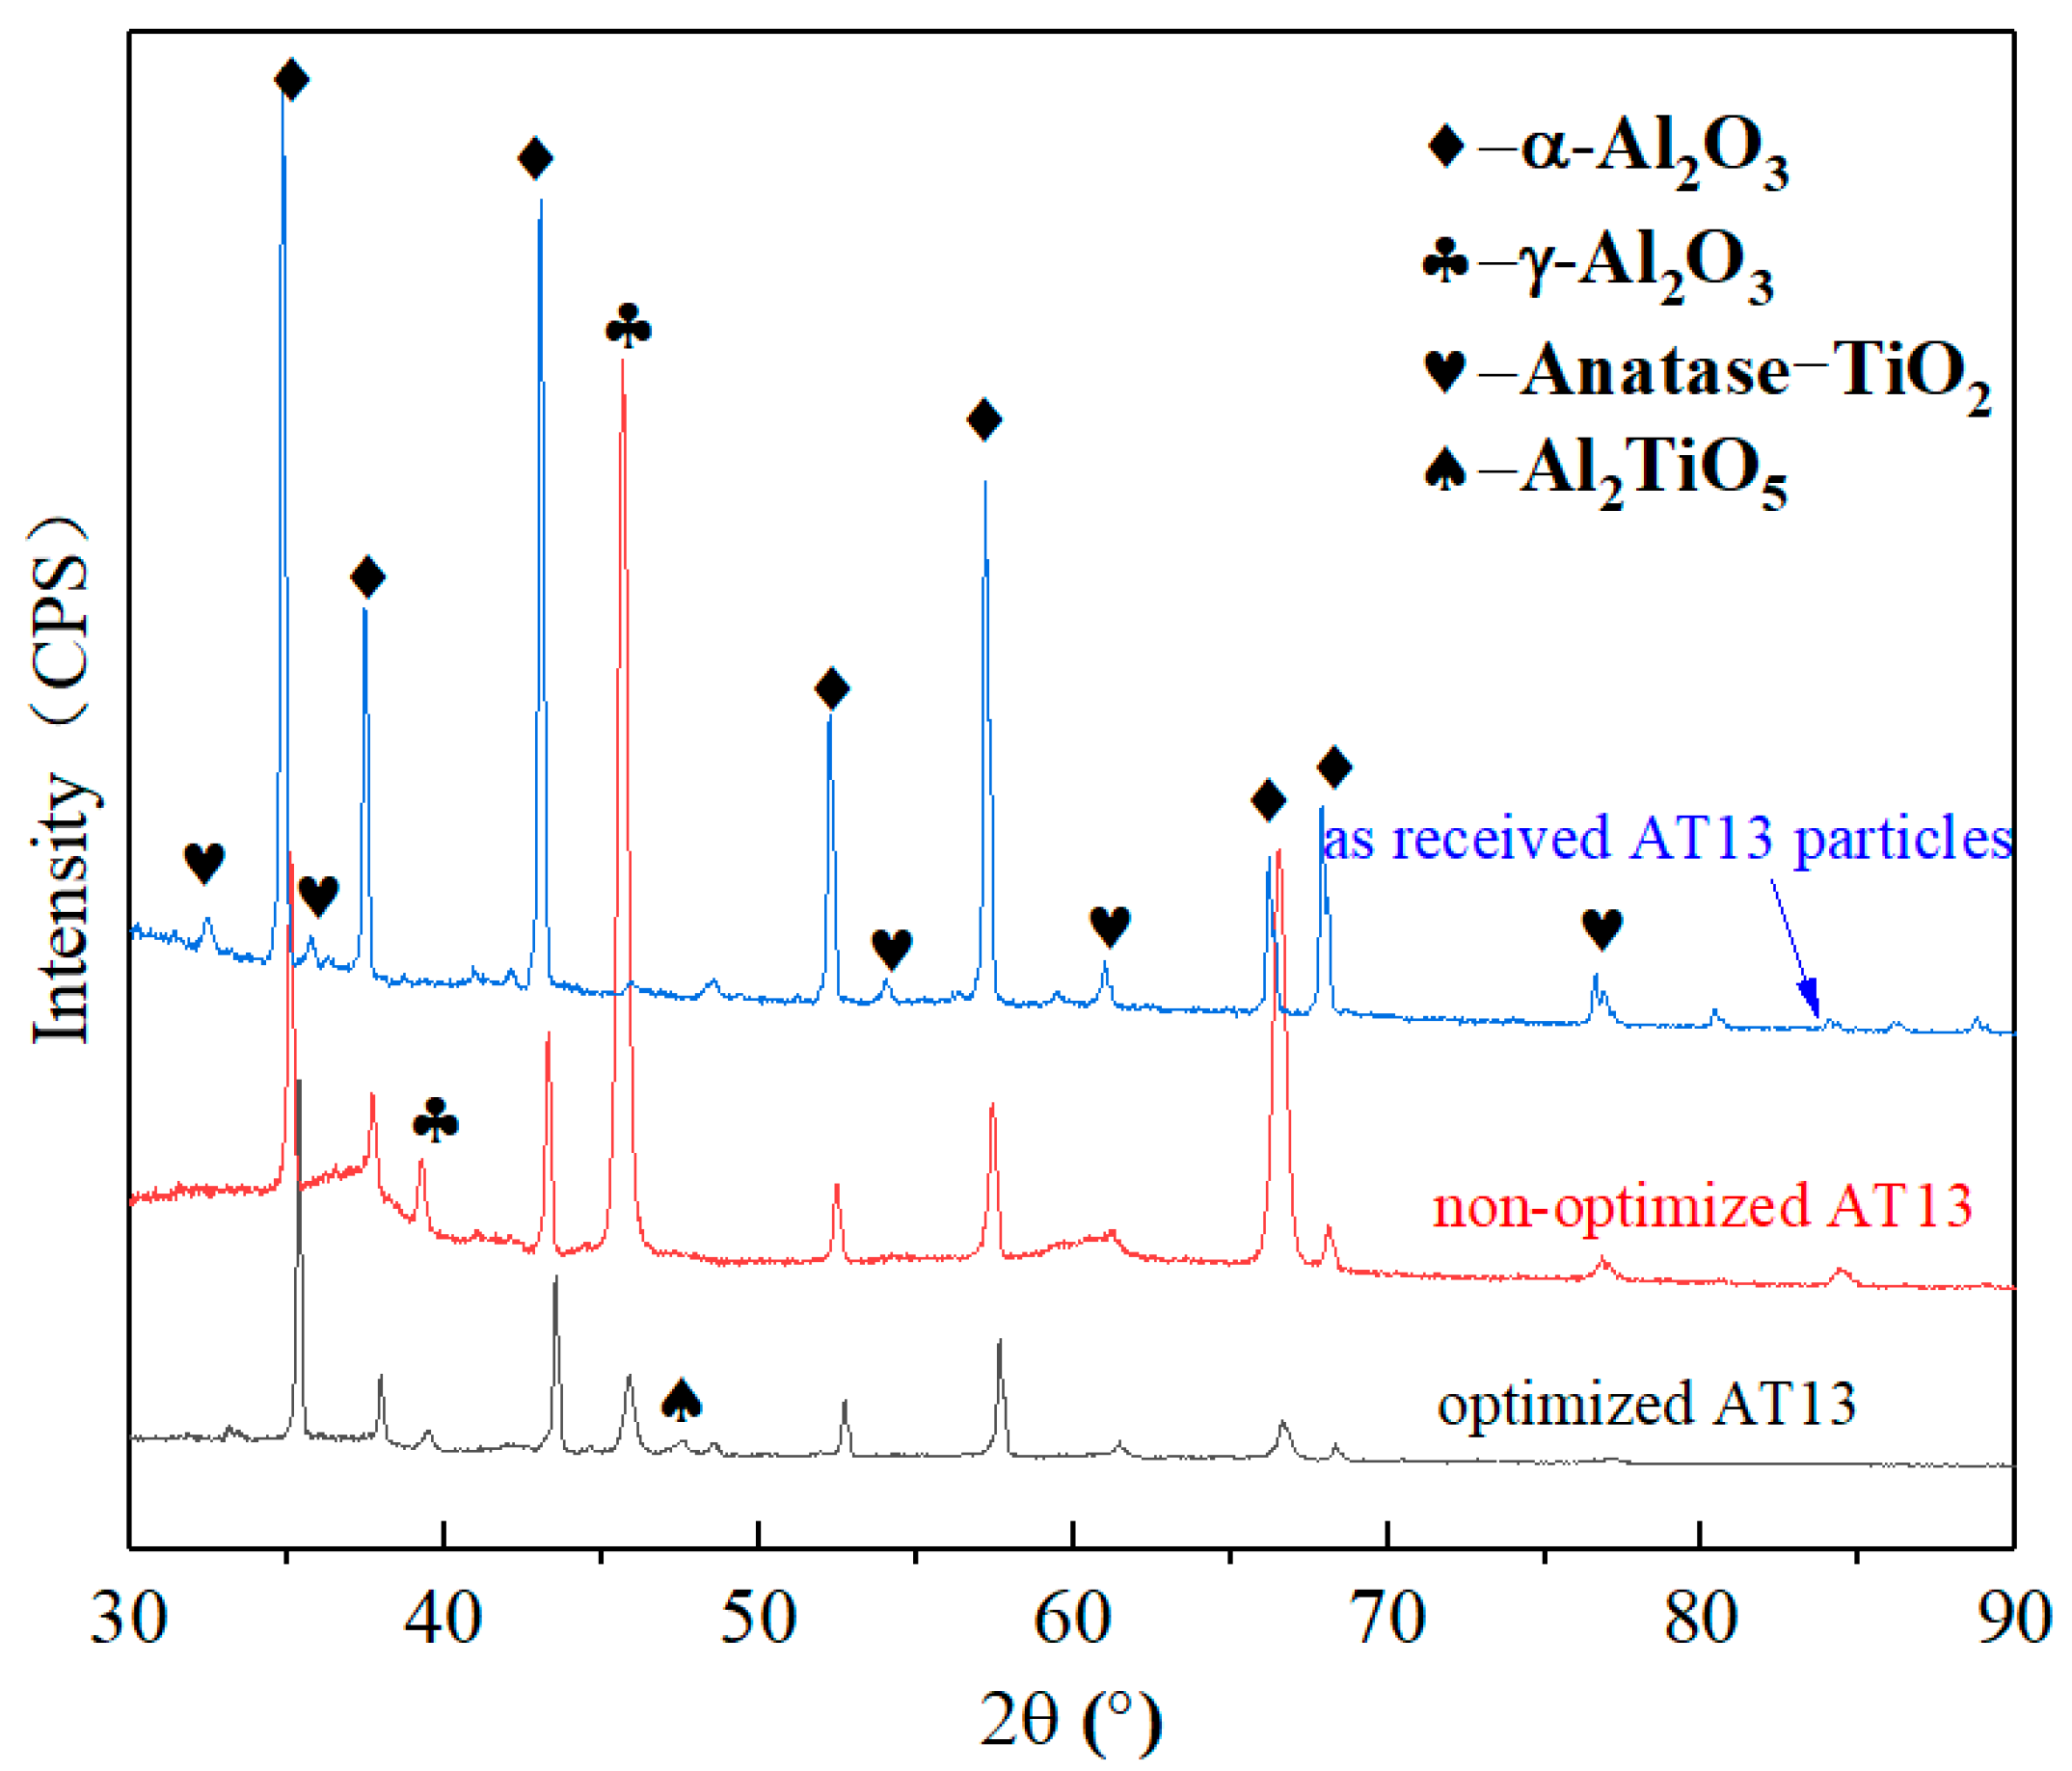
3.2. Morphology and Composition of the AT13 Coatings

The surface morphology of sprayed Ni5Al layer is exhibited in Figure 2. It is observed that the surface of the Ni5Al coating is coarse with some hills and pores. This coarse surface is beneficial to the enhancement in the bond strength of the AT13 coatings.
To investigate the effects of spray parameters on the establishment of AT13 coatings, the optimized spray parameters and the parameters of No. 8 in Table 4 (nonoptimized parameters) were selected to fabricate the AT13 coatings. Their surface morphologies are exhibited in Figure 3 and Figure 4. Figure 3 also shows the element mapping of a representative surface morphology of the coating prepared at the optimized parameters. It is observed that the brighter area is the TiO2 area, while the darker area is the Al2O3. From Figure 4, it is seen that the TiO2 areas are larger and brighter in the coating prepared at nonoptimized parameters than optimized parameters. This demonstrates that the distribution of TiO2 is not uniform in the AT13 coating prepared at nonoptimized parameters. Moreover, lots of cracks and pores appear on the surface of AT13 coating prepared at the nonoptimized parameters. These defects were bad for enhancing the service property of the coatings. However, a few TiO2 appear on the surface of the coating prepared at the optimized parameters and they are uniformly distributed. In Figure 4d, a few cracks can be found on the surface of the coating, while a relative high content of pores appear.
These surface morphologies and structures were caused by the intrinsic characteristics of the plasma spray technique [24]. The establishment of the AT13 coatings was the accumulated results of the successively solidification of melt particles when they arrived on the surface of the substrates. Thus, the spaces between the melt particles on the substrate could lead to the formation of lots of pores and cracks during the plasma spraying. At the nonoptimized parameters, high plasma current (565 A) could directly decrease the plasma voltage and subsequently melt degree of the AT13 feedstock although the high H2 flow (14 L/min) favored the enhanced the plasma voltage. The low Ar flow (31 L/min) also decreased the heat output to lower the melt degree of the AT132 feedstock. Meanwhile, a large spray standoff distance (120 mm) lead to the rapid decrease in temperature of the melt particles before the particles arrived on the substrate [24]. Thus, the melt particles were easier to solidify during spraying at nonoptimized parameters than at optimized parameters (plasma current of 530 A, Ar flow of 41 L/min, and spray standoff distance of 100 mm). Consequently, more cracks appeared in the coating prepared at nonoptimized parameters due to the weak adhesion force among the particles on the substrate, whereas the low plasma current, high Ar flow, and short standoff distance at the optimized parameters decreased the cracks of the coating as shown in Figure 4d.
The porosities of the AT13 coatings prepared at nonoptimized and optimized parameters were evaluated by Image J software [25]. The results are shown in Figure 5, in which the red area represent the pores. It is observed that the porosity is much higher in the coating prepared at nonoptimized parameters than that at optimized parameters, which are 5.62 ± 1.71% and 3.05 ± 1.07%, respectively. The formation of porosity was also induced by the intrinsic characteristics of the plasma spray technique as discussed above. The faster cooling and solidification of the melt particles at nonoptimized parameters led to the increased possibility of large spaces among the melt particles, which brought into the high porosity.
The cross-sectional morphology and element mapping of the Ni5Al layer and AT13 coating prepared at optimized parameters is exhibited in Figure 6, which is obtained from the BSE (backscattered electrons) mode of SEM. The brighter area represents the Ni5Al layer and the darker top layer is the AT13 coating. The thickness of the Ni5Al and AT13 composite coating are about 80 and 130 μm, respectively. The TiO2 phases are uniformly distributed in the AT13 coating, which is induced by the good melting conditions of the TiO2 particles during spraying. At the optimized parameters, the TiO2 particles could be melted throughout, so that the TiO2 melting pool could be diluted by the subsequent melt Al2O3 particles. Consequently, the TiO2 particles were not accumulated at some area. Additionally, there are two slight transition zones appearing between Q235 and Ni5Al, Ni5Al, and AT13 coating, which is caused by the high melt temperature of spray particles.
The XRD patterns of the as-received AT13 particles and AT13 coatings are exhibited in Figure 7. It is observed that the main phases of as-received AT13 particles are α-Al2O3 and anatase TiO2 phases. After spraying at nonoptimized parameters, lots of γ-Al2O3 phases appear and the XRD peak of γ-Al2O3 phase is the strongest one as shown in Figure 7, whereas, a few α-Al2O3 phases were transformed into γ-Al2O3 phases at nonoptimized parameters, in which the α-Al2O3 phases are still the dominated phases. The phase transformation from α-Al2O3 to γ-Al2O3 was also verified in related literatures [5,8,15]. They believed that the formation of γ-Al2O3 was induced by the preferential nucleation of metastable γ-Al2O3 with low surface energy during solidification. During solidification, the much rapid cooling of the melt Al2O3 particles led to the numerous nucleation and the survival of the metastable γ-Al2O3. The formation of numerous γ-Al2O3 phases was favorable for the increase in porosity of the coating prepared at nonoptimized parameters [15]. Moreover, another new phase of Al2TiO5 was formed and some of α-Al2O3 were retained, which was induced by the roles of TiO2 particles. The mixture of melt Al2O3 and TiO2 particles led to the eutectic products of Al2TiO5. The retained α-Al2O3 was caused by the inhibiting effects of TiO2 on phase transition of α-Al2O3 and a few not completely melted α-Al2O3 particles. The phase transition and the content of various phase could greatly affect the property of the AT13 coatings prepared at different parameters.

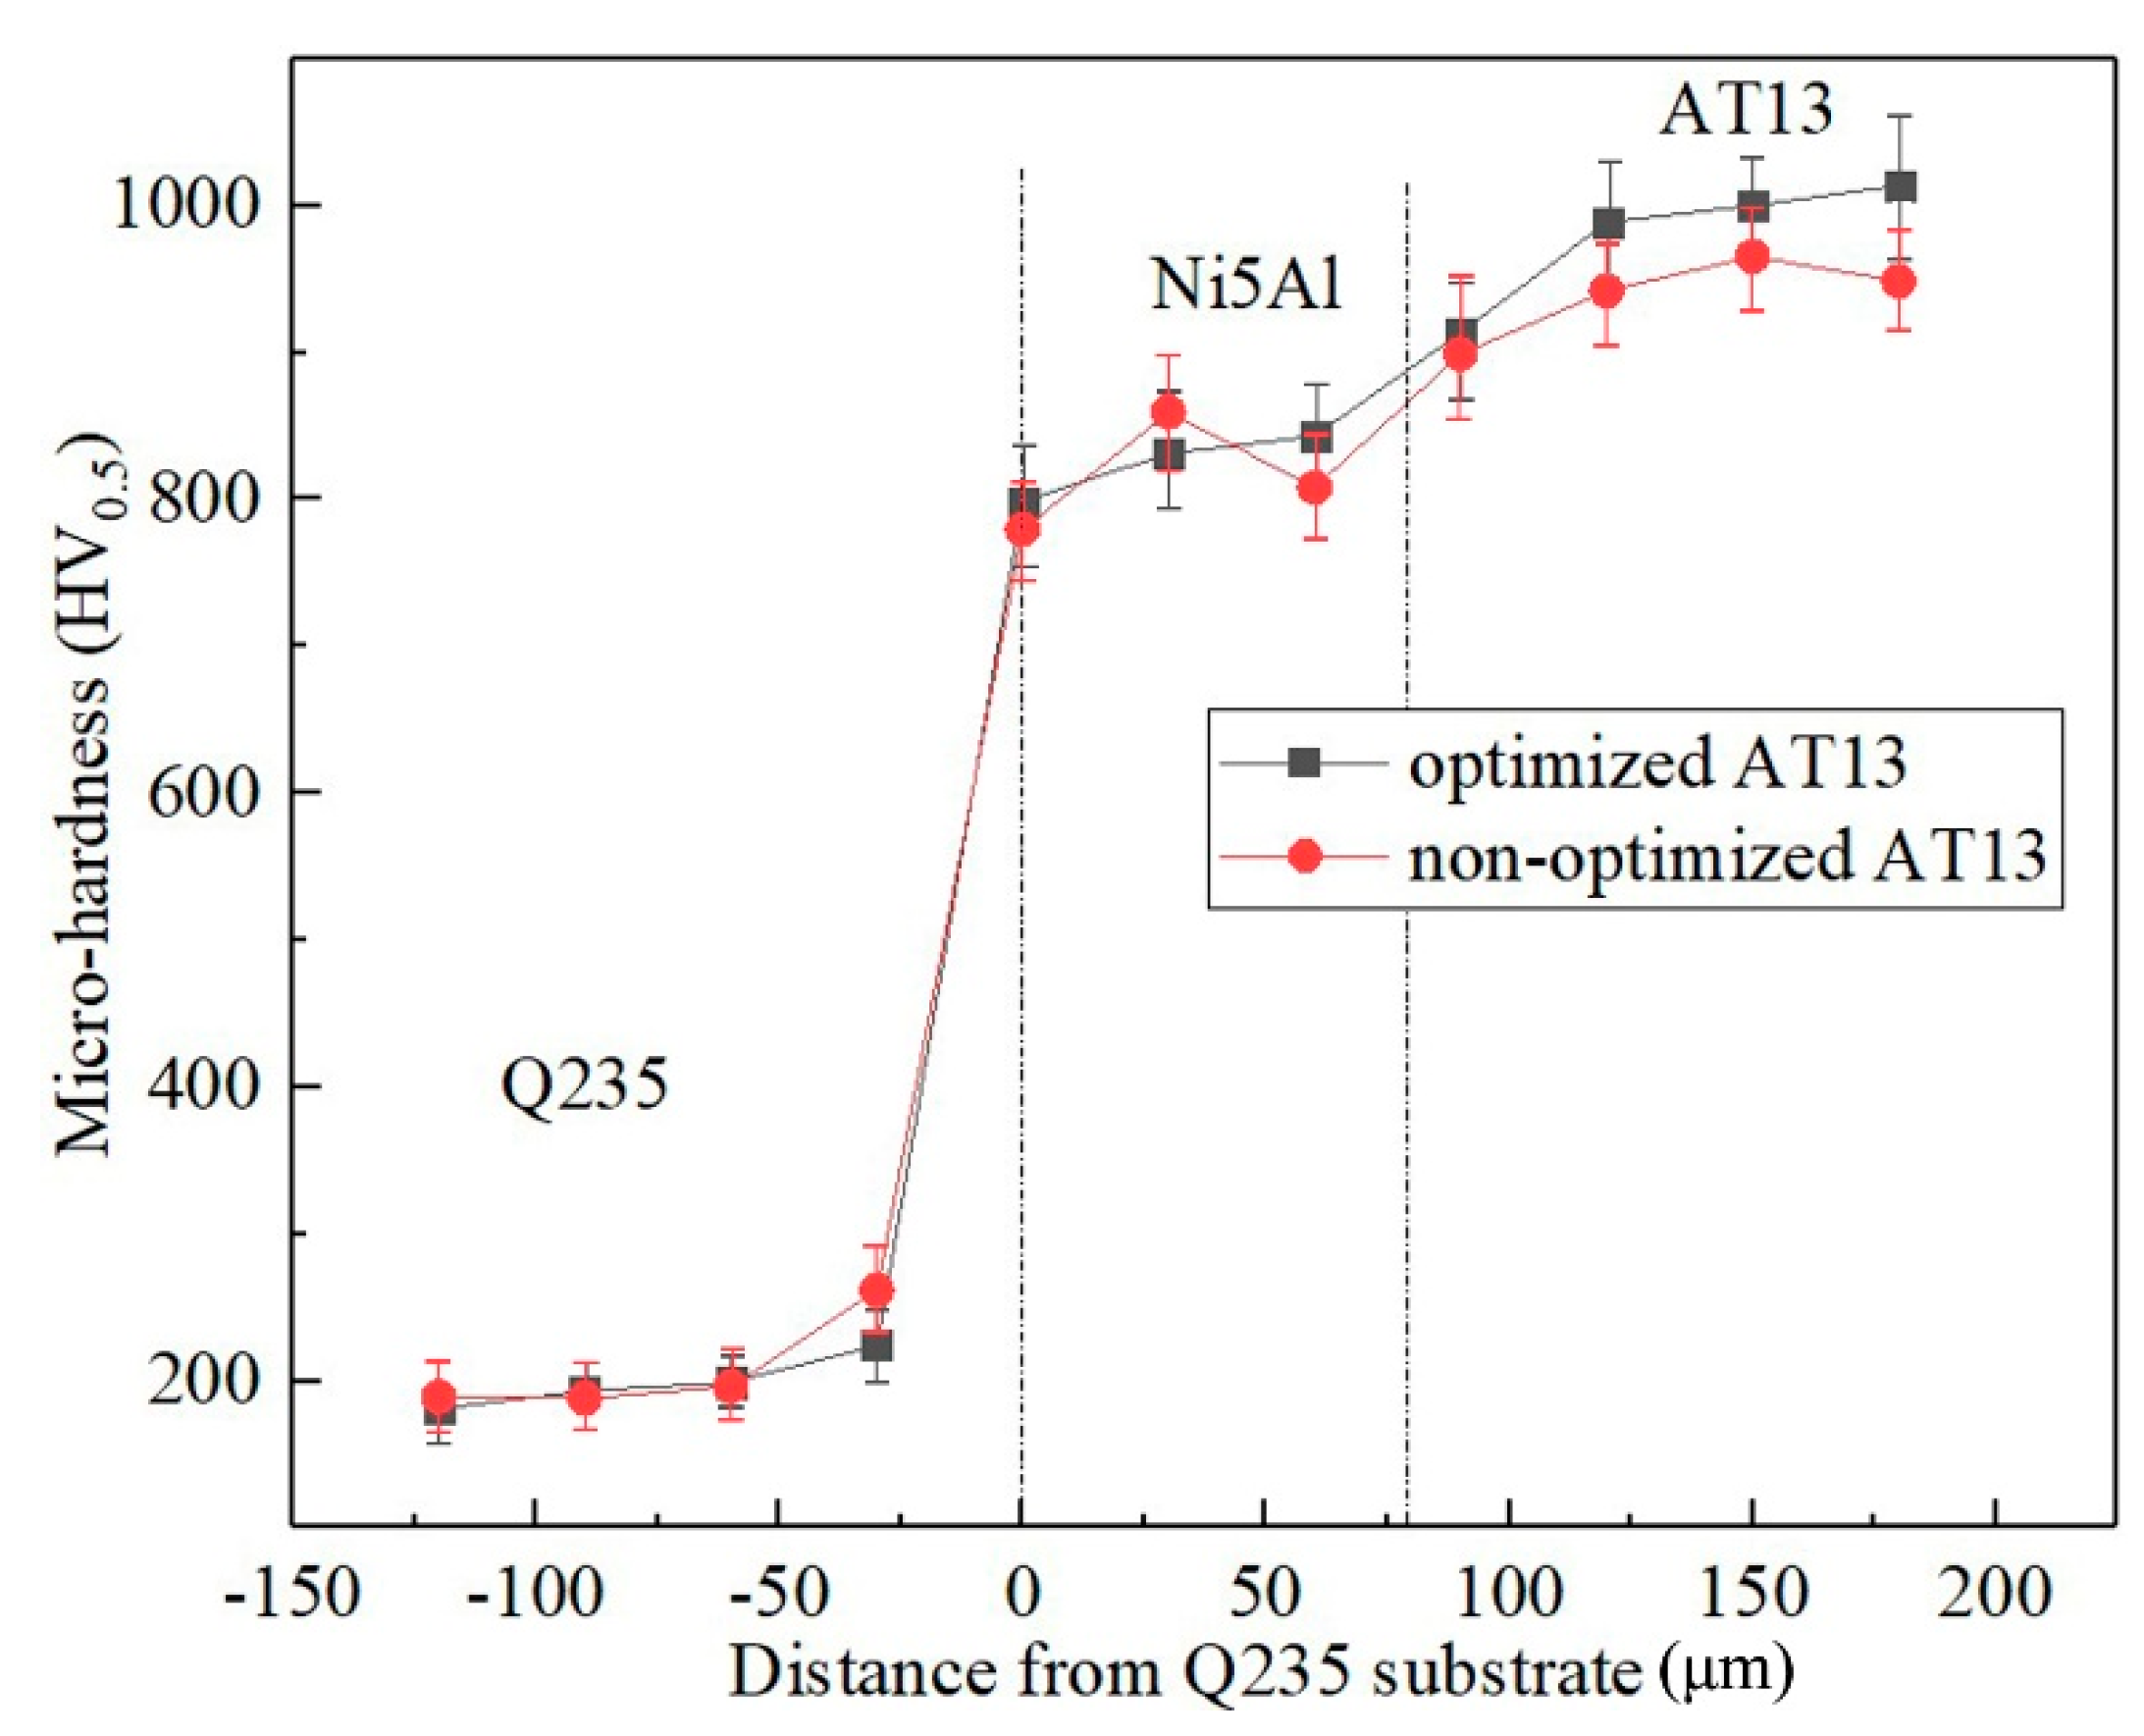
3.3. Mechanical Property of the AT13 Coatings

From Table 3, it can be found that the bond strength (cohesive strength) of the AT13 coatings prepared at nonoptimized parameters is 5.39 MPa, which is much lower than that of the coating prepared at optimized parameters (25.01 MPa). This was induced by the porosity and cracks of the coatings. From Figure 4 and Figure 5, it is observed that the coating prepared at nonoptimized parameters possessed high content of pores and cracks, which led to the poor bond strength among solidified particles in the coating. This poor bond strength could bring into the easy peeling off of the coating from the substrate. As shown in Figure 8, the more surface area of the AT13 coating prepared at nonoptimized parameters are peeled off, which proves the weak bond strength of the coating.
The microhardness distribution of the sprayed samples along cross-section are shown in Figure 9. It is seen that the microhardness of the samples gradually increases from the Q235 substrate to AT13 coating along cross-section direction, no matter the samples are prepared at the nonoptimized or optimized parameters. The microhardness evolution of the samples along cross-section are divided into 3 stages, which represent the microhardness of Q235 substrate, Ni5Al, and AT13 coating, respectively. The microhardness of the substrate and Ni5Al are the same in all samples, whose average values are 191.2 ± 8.7 and 837.1 ± 19.2 HV0.5, respectively, whereas, the microhardness of the AT13 coatings in both samples are much different. The average microhardness of the AT13 coating prepared at optimized parameters is 1000.6 ± 30.8 HV0.5, which is higher than that of the coating prepared at nonoptimized parameters (951.8 ± 25.7 HV0.5). This difference in microhardness of the AT13 coating was caused by the pores and cracks in the coating. The high content of pores and cracks more easily led to the expansion of the indentation, so that the microhardness of the coating was decreased. Additionally, it can be found that there is a gradual microhardness increase between the substrate and Ni5Al, Ni5Al, and AT13 coating, which is induced by the formation of the transition layers among them. The transition layers are derived from the mixture of the high-temperature melting particles and the substrates.
The thermal shock behaviors of the AT13 coatings were examined. The surface morphologies of the coatings after different times of heat shock experiments are presented in Figure 10. It is observed that the coating prepared at the optimized parameters possesses the better thermal shock resistance. The coating still keeps the integrated surface morphology even through 45 heat shock experiments. However, after 30 times of heat shock, the severe peeling off of the coatings prepared at nonoptimized parameters already appears. The porosity, cracks, and the distribution of TiO2 particles in the coating also strongly affected the thermal shock behaviors of the AT13 coatings. The high content of pores and cracks contributed to the stress concentration in the locations of the defects, which brought in the rapid development and extension of the cracks under the alternating stress during heating and cooling. The nonuniform distribution of the TiO2 particles also could increase the severe differences in volume changes of adjacent TiO2 and Al2O3 phases during cooling of the coating due to their different thermal expansion coefficient. Especially in the area of lots of TiO2 phases, the differences in volume changes between TiO2 and Al2O3 were more severe than that in area of a few TiO2 particles, which consequently induces the development of the cracks. Additionally, the multitimes heat treatment could lead to the transition of the γ-Al2O3 to α-Al2O3, causing changes in the volume of the coatings and subsequent peeling off. Therefore, the AT13 coating prepared at optimized parameters possessed better thermal shock resistance.

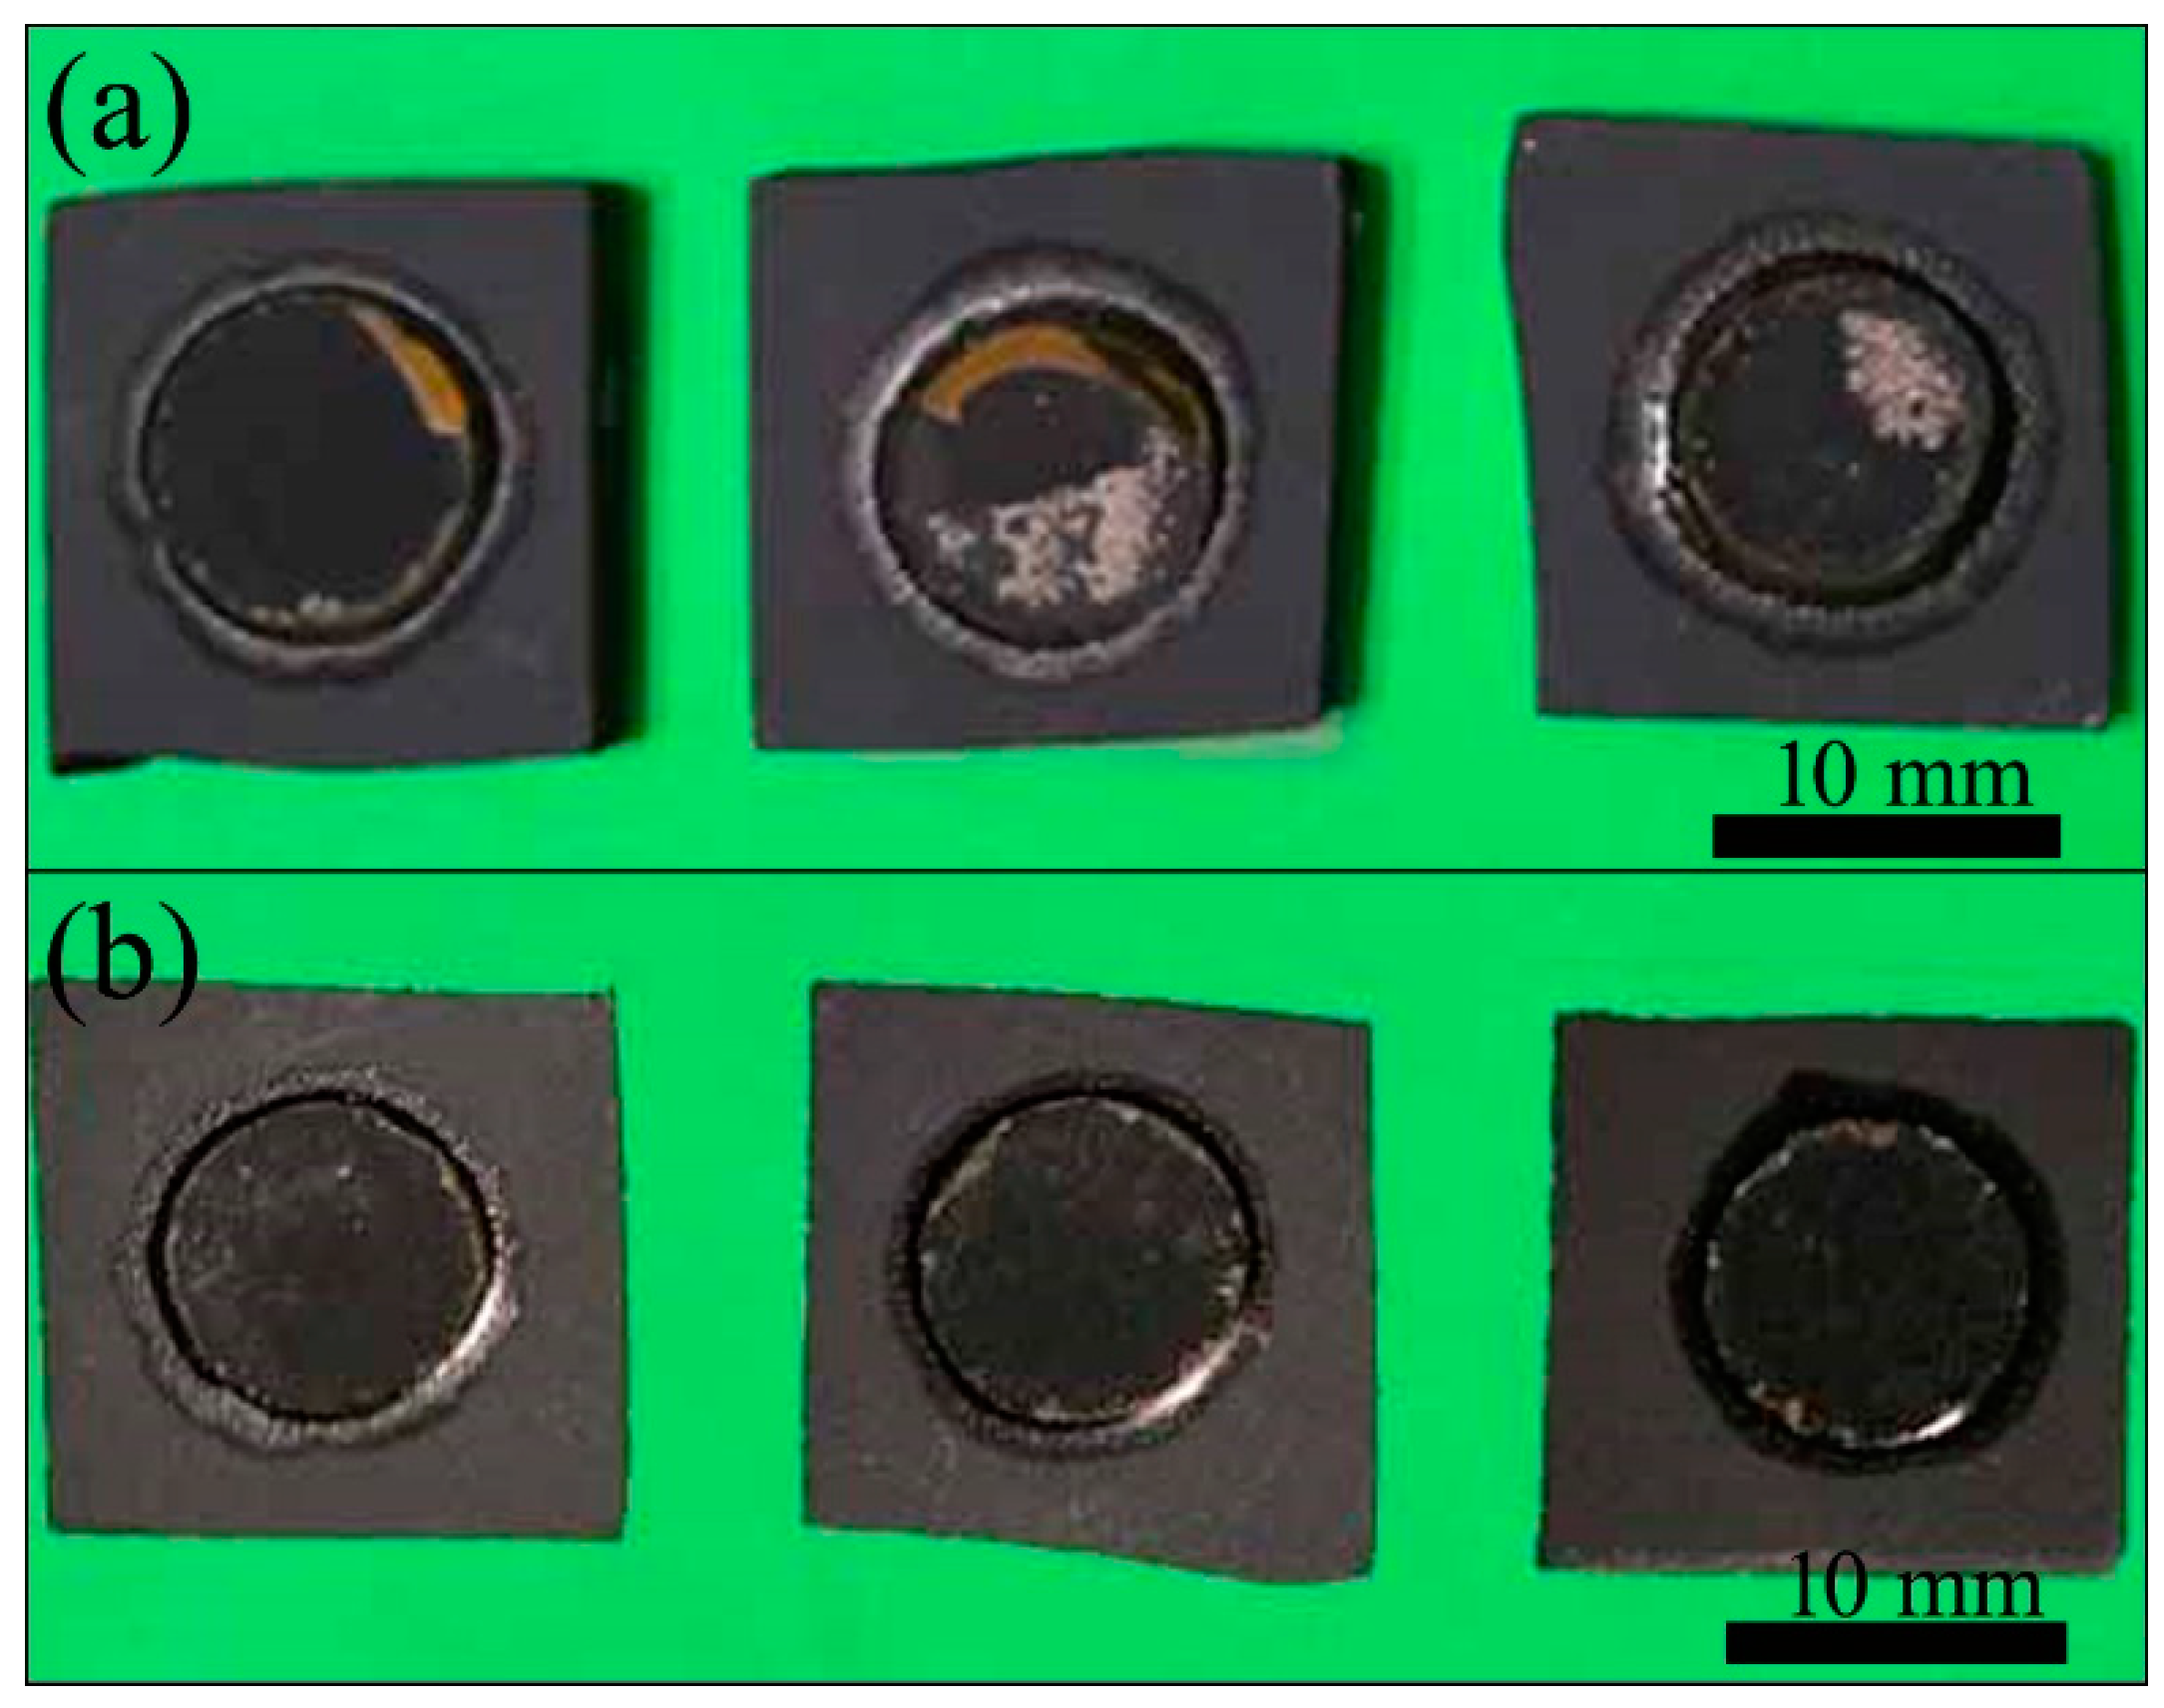
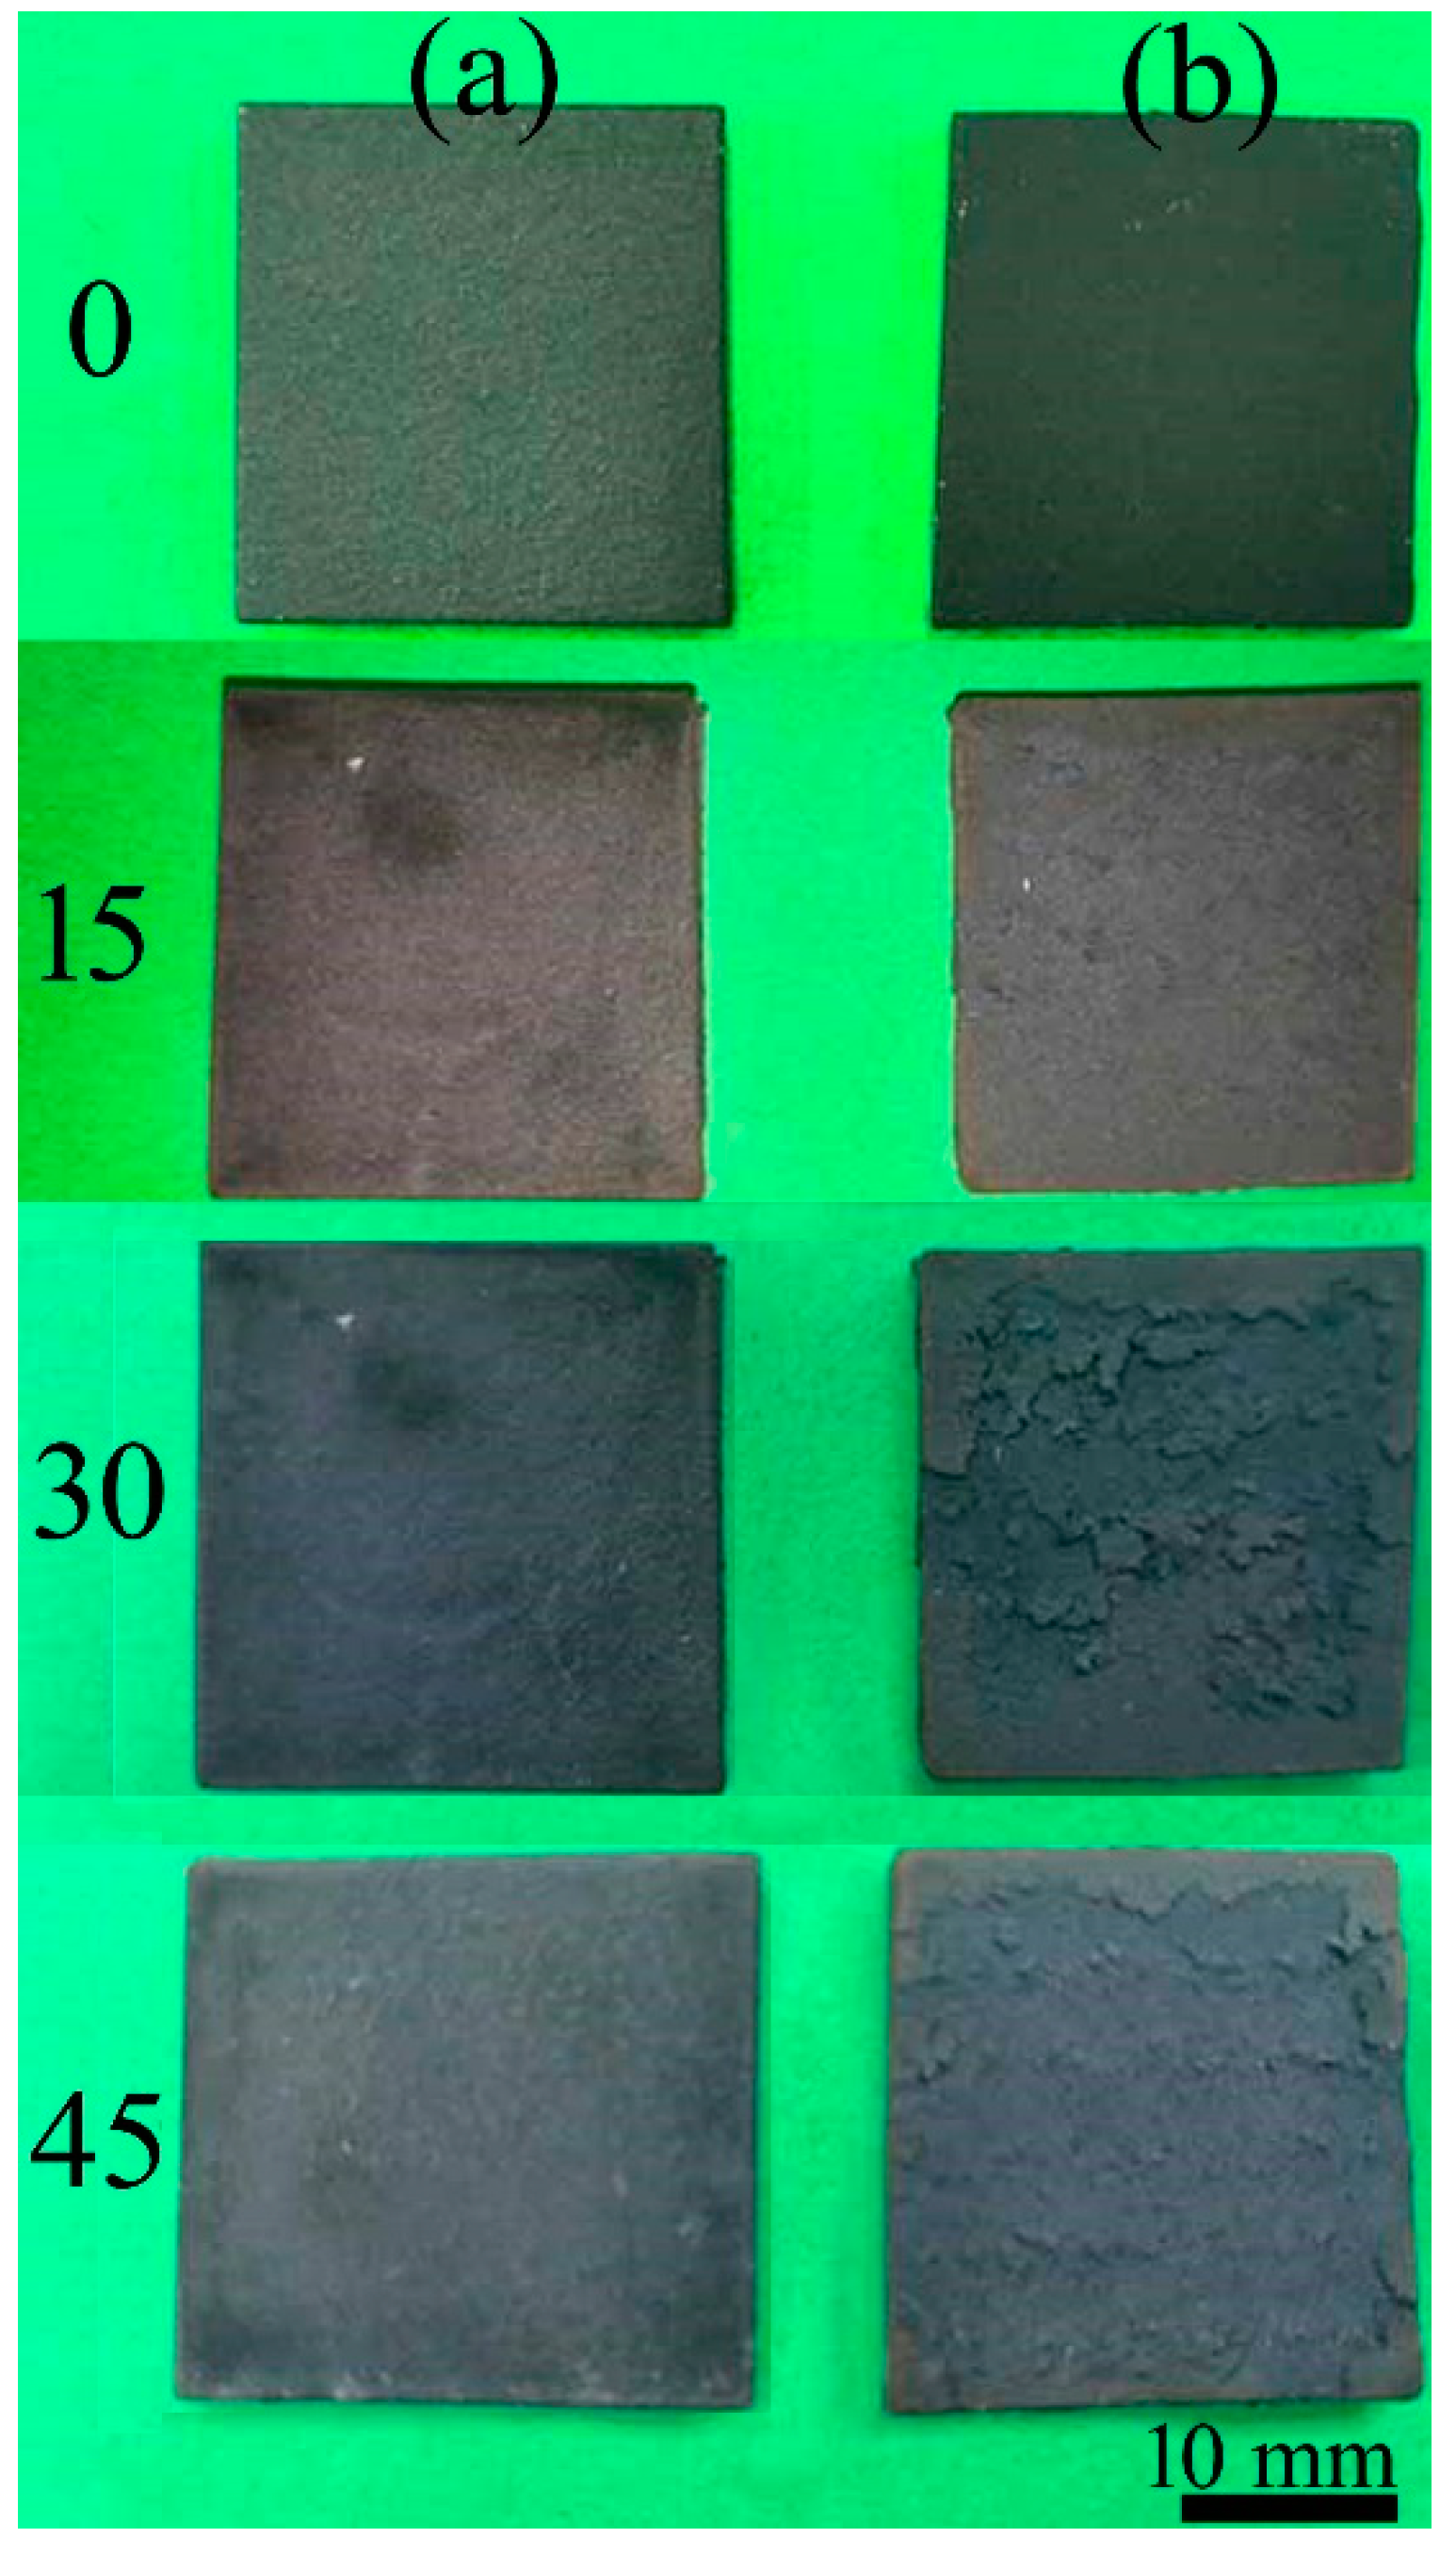
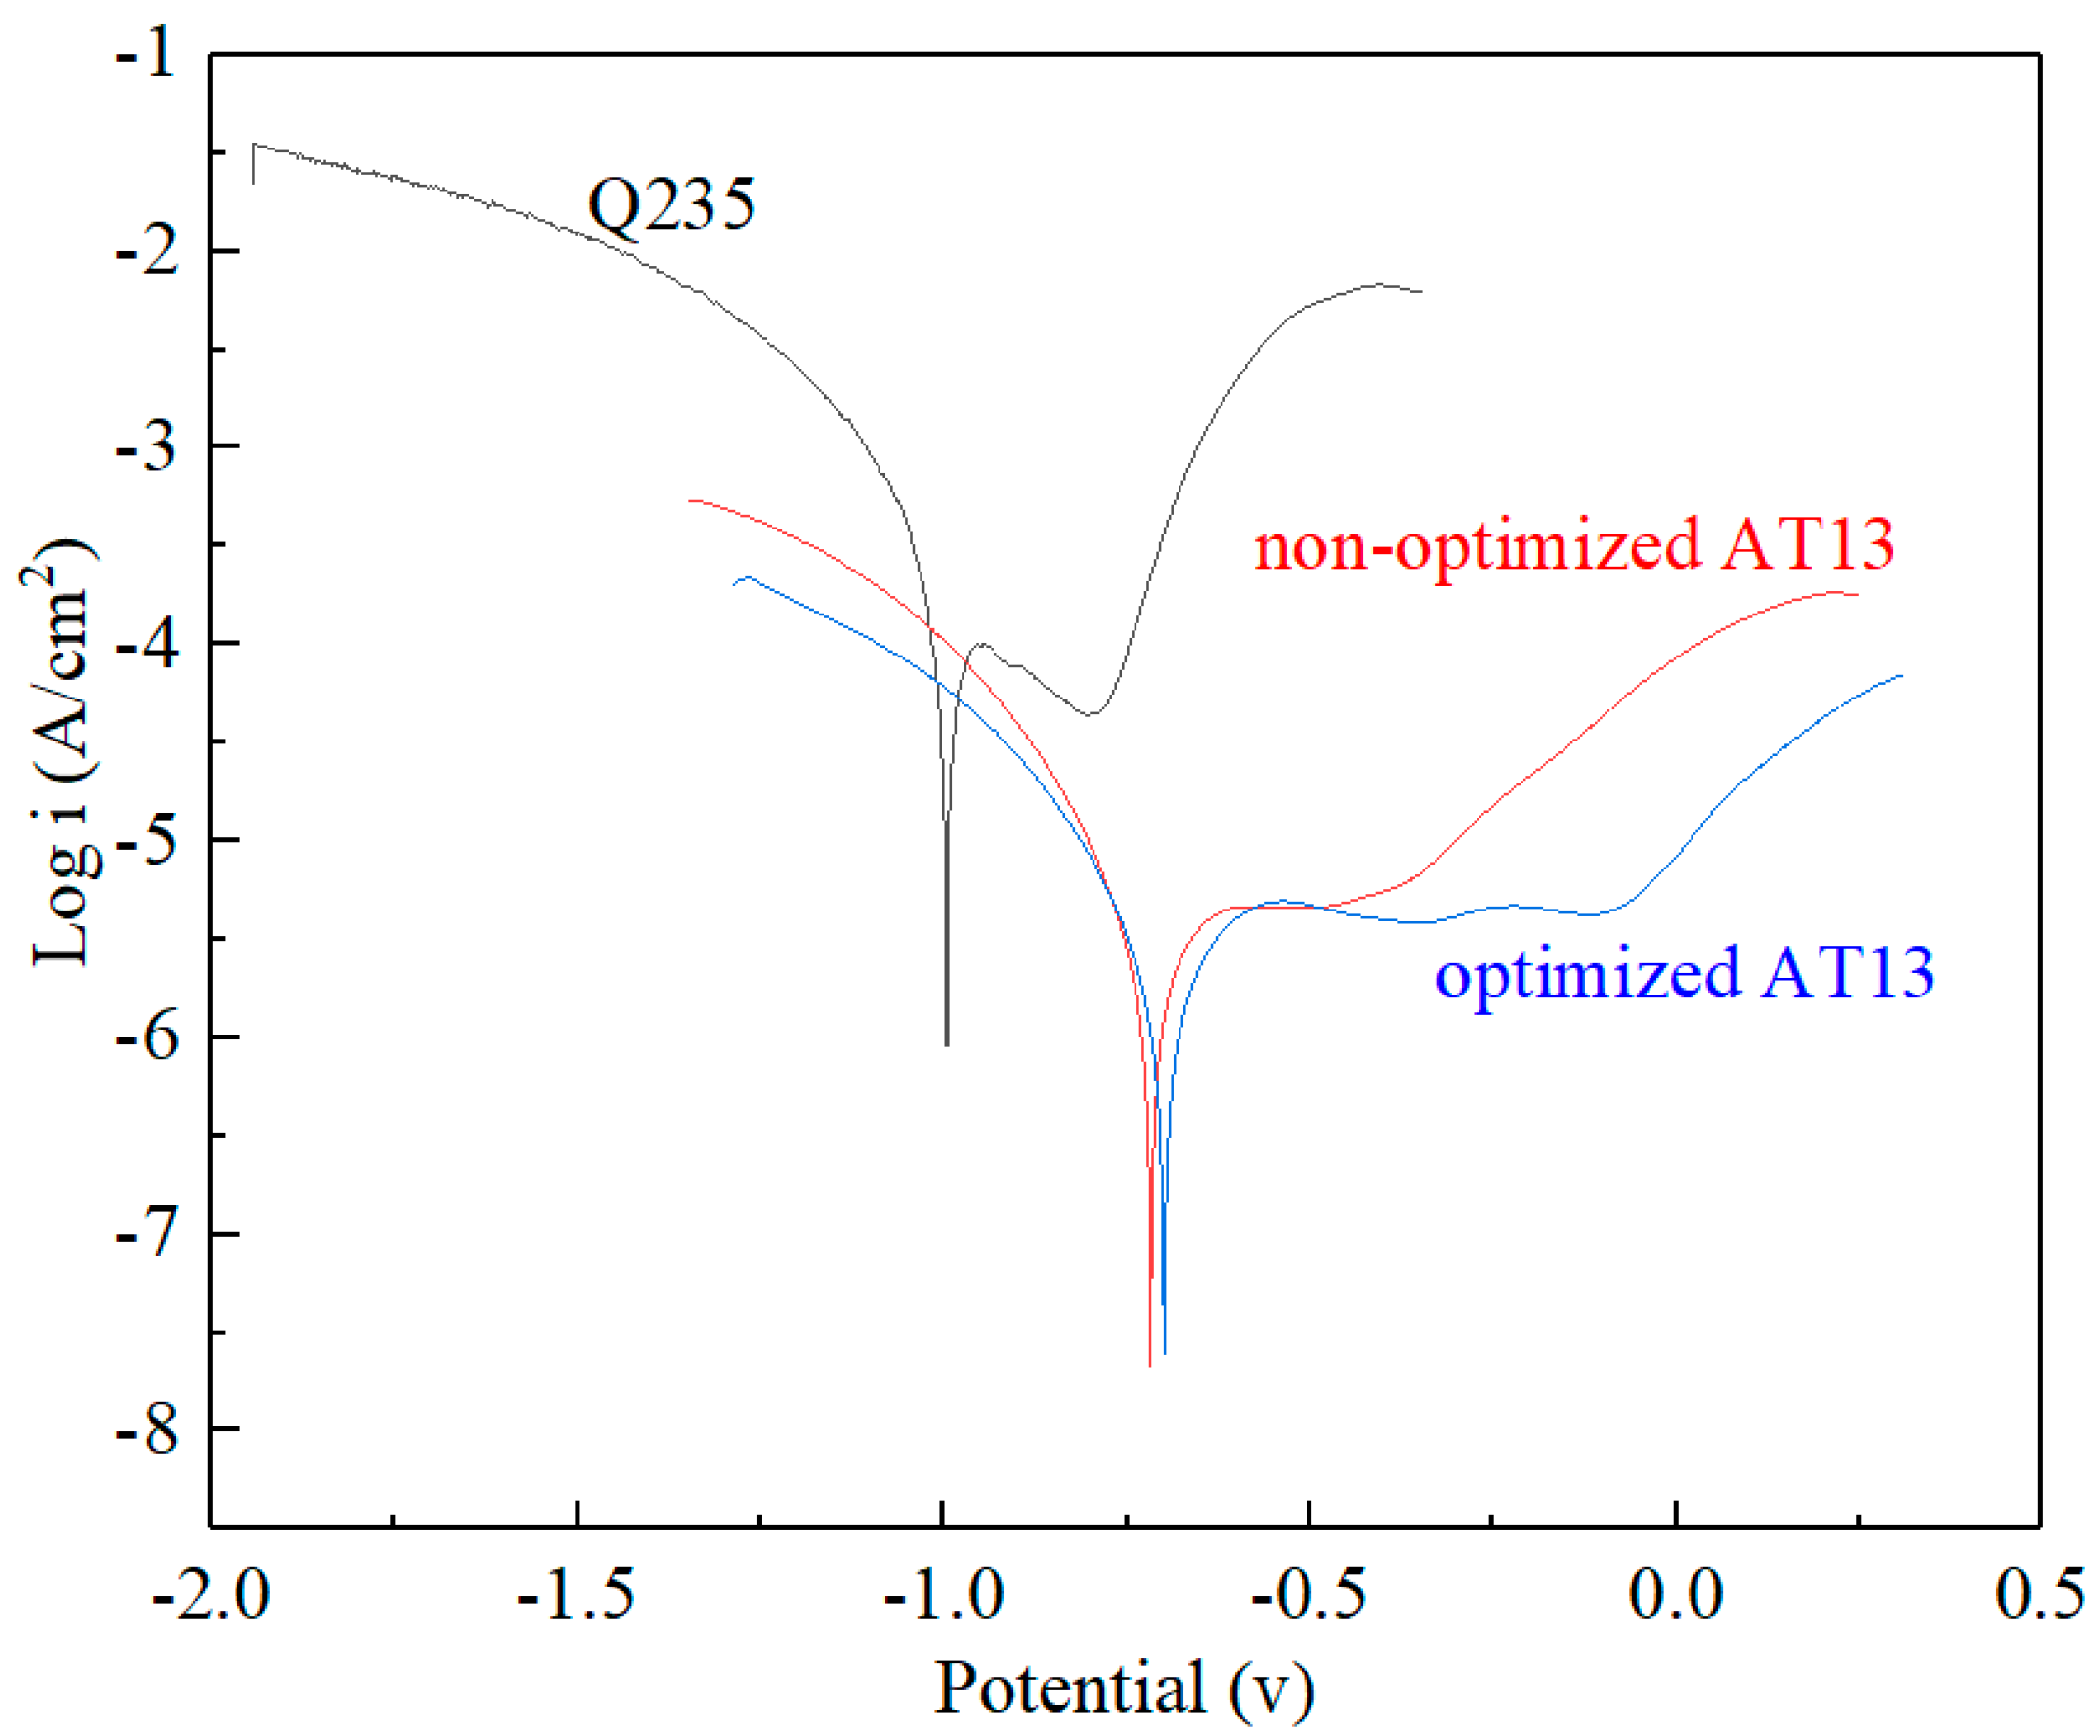
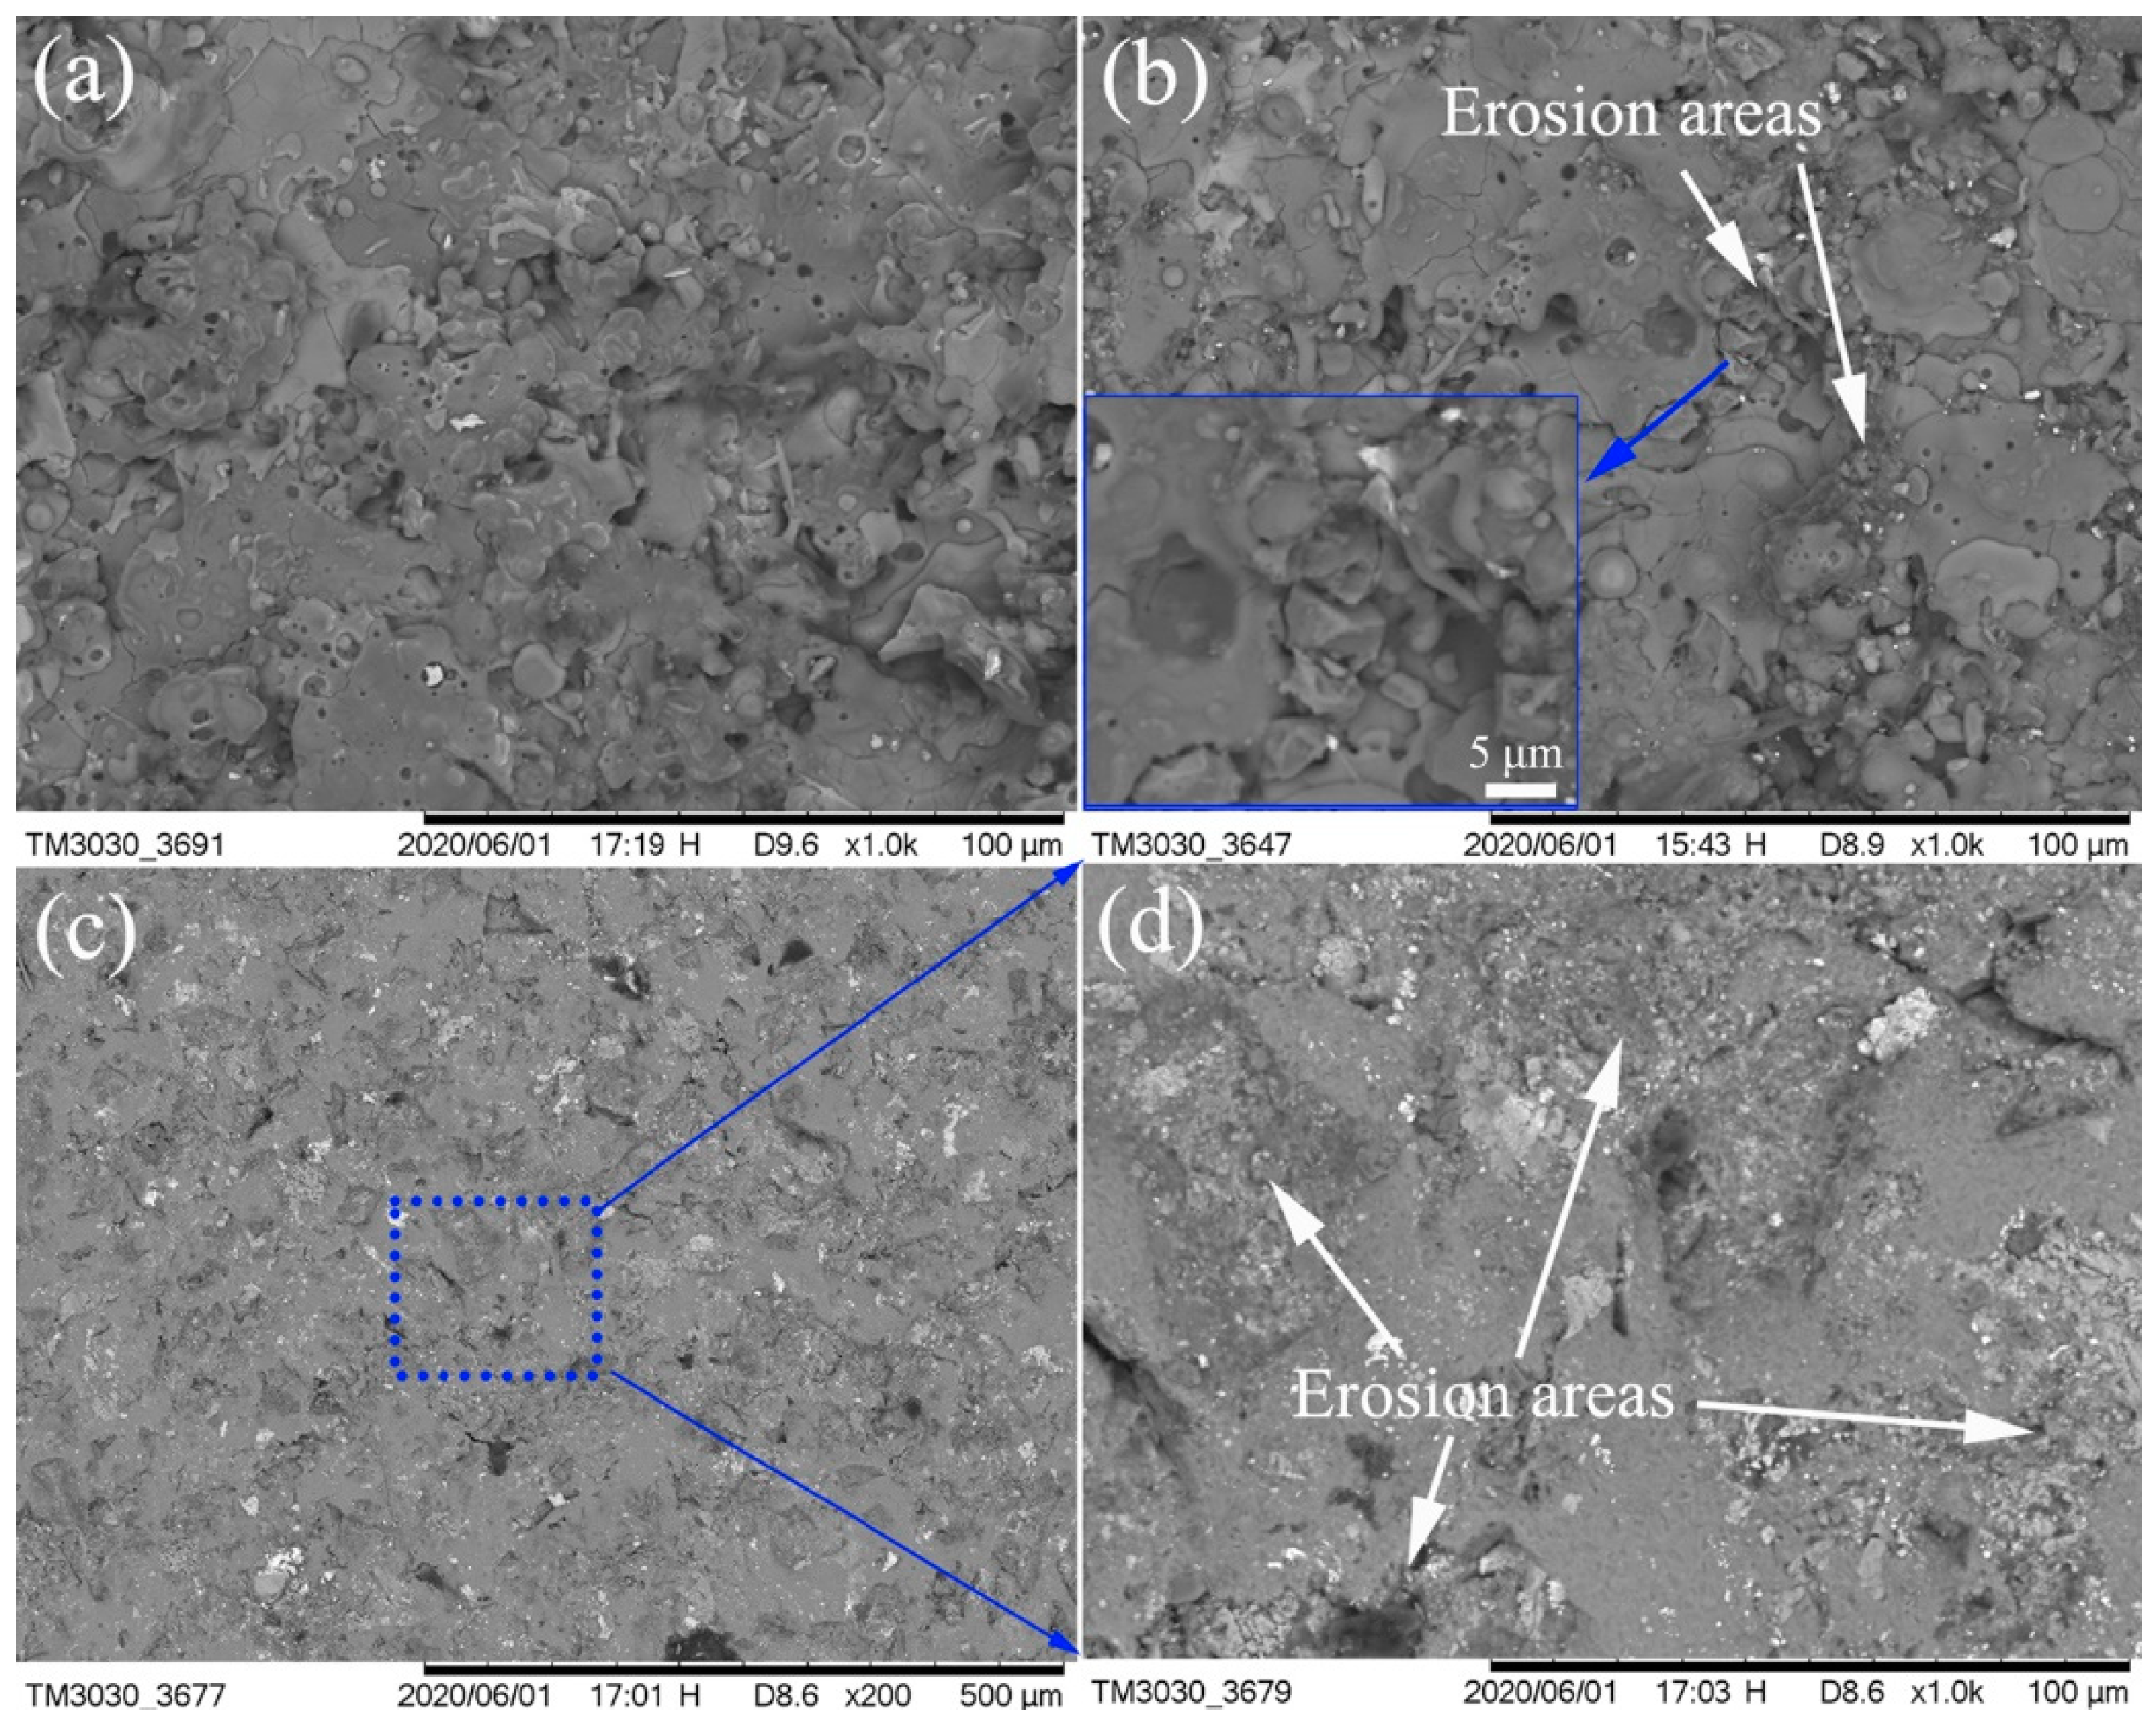
3.4. Corrosion Behaviors of the AT13 Coatings

The static corrosion behaviors of the coatings were characterized by the potentiodynamic polarization curves as exhibited in Figure 11. It is obvious that the corrosion potential (Ecorr) value of the coating prepared at optimized parameters is the most positive one, whereas that of the Q235 substrate is the most negative one. The extrapolation method was utilized to calculate the Ecorr and corrosion current (Icorr) of the coatings from the potentiodynamic polarization curves, which are listed in Table 5. It is observed that the Ecorr values of the coatings prepared at optimized and nonoptimized parameters, and Q234 substrate are −699 ± 15, −718 ± 21, and −997 ± 9 mV, respectively. The corresponding Icorr of the coatings and substrates are 1.41 ± 0.51, 1.96 ± 0.48, and 103.1 ± 1.9 μA/cm2, respectively.
The positive shift of Ecorr accompanied by a decrease in Icorr indicated a decreased tendency to corrosion of AT13-coated samples produced by optimized parameters. The polarization test results led directly to the conclusion that AT13-coatings produced by optimized parameters could significantly improve the overall corrosion protection of Q235 components. The Icorr of the AT13 coating prepared at optimized parameters decreased two order of magnitude than that of the Q235. The enhanced resistance to corrosion of the AT13 coating prepared at optimized parameters was attributed to the low content of pores and cracks in the coating. The less pores and cracks could prevent the extending of corrosion media to the internal metals, consequently reducing the occurrence of the corrosion. The enhanced resistance to corrosion of plasma-sprayed AT13 coatings was also verified by the related works that illustrated also the significant dependence of the corrosion on the spray parameters [26].
The dynamic corrosion behaviors (erosion) of the AT13 coatings and Q235 substrate were evaluated. The surface morphology of the AT13 coatings and Q235 substrates after erosion are shown in Figure 12. Compared to Figure 4d, it is observed that the surface of AT13 coating prepared at optimized parameters is seem to be changed a little with the impact of the erosion as shown in Figure 12a, while some erosion areas including pits and cracks as shown in magnified image of Figure 12b appear in the surface of the AT13 coating prepared at nonoptimized parameters. This was attributed to the microstructure and properties including microhardness and corrosion resistance of the AT13 coatings. The AT13 coating with the microstructure of more pores, cracks, and the properties of low microhardness and corrosion resistance could be easily damaged by the outside impacts, which was caused by the synergy of corrosion and friction [20,27]. The low microhardness and corrosion resistance accelerated the wear and corrosion failure of the coatings, consequently bringing in the more weight loss in locations of pores and cracks. Thus, the coating prepared at optimized parameters possessed the low weight loss. The high microhardness and corrosion resistance of the coating could enhance the ability of specimen surface to resist the outside erosion impacts. With respect to the substrate of Q235 as shown in Figure 12c,d, lots of erosion areas appear on the surface of Q235 substrate when erosion rest. Especially in Figure 12d, some pits, cracks, and scratches are formed in the erosion area with a larger size. These erosion areas were caused by the poor microhardness and corrosion resistance of the substrate. The corresponding weight loss of the coatings and substrate are listed in Table 6. The weight loss results exactly supported the surface conditions of the samples, in which the weight loss of the AT13 coatings prepared at nonoptimized and optimized parameters and Q235 substrates were 12.4, 5.7, and 155.8 mg, respectively. The weight loss of the AT13 coating prepared at optimized parameters was about 30 times less than that of the Q235 substrate.

4. Conclusions

The Ni5Al and AT13 composite coatings were successfully established on the substrates of Q235 by plasma spray technique. The spray parameters of the AT13 coatings were designed by the orthogonal experiment method with 4 factors and 3 levels, in which plasma current, Ar flow, H2 flow, and spray standoff distance worked as the main variables. With respect to the bond strength of the coating, the enhanced bond strength of the coating could reach to 25.01 MPa, which was prepared at the optimized spray parameters, i.e., the plasma current of 530 A, Ar flow of 41 L/min, H2 flow of 10 L/min, and spray standoff distance of 100 mm.
In this work, the presprayed Ni5Al layer with coarse surface conditions worked as the middle layer between the AT13 coating and the substrate of Q235. The AT13 coating prepared at the optimized parameters possessed less pores and cracks in the coating than at nonoptimized parameters, in which the porosities were 3.05% and 5.62%, respectively. Moreover, the TiO2 particles were also more uniformly distributed in the coating prepared at optimized parameters, in which the less amount of γ-Al2O3 was formed. The plasma current, Ar flow, and spray standoff distance played more important roles in changing the microstructure of the AT13 coatings, in which the low plasma current, high Ar flow, and small spray standoff distance could bring into the low porosity and the uniform distribution of TiO2.
The less porosity and cracks of the AT13 coating with the uniformly distributed TiO2 endowed the coating with the better mechanical properties including bond strength, microhardness, thermal shock resistance, and corrosion resistance including static and dynamic corrosion. The bond strength, microhardness, and thermal shock resistance of the AT13 coating could reach 25.01 MPa, 1000.6 HV0.5, and 40 times when the coating was prepared at optimized parameters, respectively. Especially, the static Icorr of the AT13 coating prepared at optimized parameters was two order of magnitude less than that of Q235 steel. The erosion weight loss of Q235 steel could be decreased about 30 times by the protection of the AT13 coating. Therefore, the AT13 coating with the presprayed Ni5Al layer could be fully qualified as the protection of the Q235 steels in harsh environments.

Author Contributions

Conceptualization, J.Z. and Z.H.; methodology, J.Z. and Z.H.; software, S.H.; validation, J.Z. and Z.H.; formal analysis, J.Z., K.S., and S.H.; investigation, J.Z., K.S., S.H., W.C., Y.W., and L.M.; data curation, J.Z, K.S., and W.C.; writing—original draft preparation, J.Z.; writing—review and editing, Z.H.; supervision, W.L.; project administration, Z.H.; funding acquisition, W.L. All authors have read and agreed to the published version of the manuscript.

Funding

This research was sponsored by the Shanghai Sailing Program, grant number 20YF1416400 and China Southern Power Grid Co., Ltd. Liuzhou Bureau of EHV Transmission Company, grant number CGYKJXM2017039.

Acknowledgments

The authors thank the Research Testing Center of Ocean Science and Engineering College for the SEM and XRD measurements.

Conflicts of Interest

The authors declare no conflict of interest.

References

  1. Shi, Z.; Dong, J.; Ma, W. Mean Strain Effect on the Cyclic Stress-Strain Behavior of Steel Structure Materials Q235. Adv. Mater. 2012, 602–604, 430–434. [Google Scholar]
  2. Wang, Q.; Bai, S.; Liu, Z. Surface Characterization and Erosion–Corrosion Behavior of Q235 Steel in Dynamic Flow. Tribol. Lett. 2014, 53, 271–279. [Google Scholar] [CrossRef]
  3. Wang, B.; Xue, W.; Wu, Z.; Jin, X.; Wu, J.; Du, J. Influence of discharge time on properties of plasma electrolytic borocarburized layers on Q235 low-carbon steel. Mater. Chem. Phys. 2015, 168, 10–17. [Google Scholar] [CrossRef]
  4. Zorawski, W.; Goral, A.; Bokuvka, O.; Litynska-Dobrzynska, L.; Berent, K. Microstructure and tribological properties of nanostructured and conventional plasma sprayed alumina-titania coatings. Surf. Coat. Technol. 2015, 268, 190–197. [Google Scholar] [CrossRef]
  5. Goral, A.; Zorawski, W.; Litynska, D.L. Study of the microstructure of plasma sprayed coatings obtained from Al2O3–13TiO2 nanostructured and conventional powders. Mater. Charact. 2014, 96, 234–240. [Google Scholar] [CrossRef]
  6. Çelik, I. Structure and surface properties of Al2O3–TiO2 ceramic coated AZ31 magnesium alloy. Ceram. Int. 2016, 42, 13659–13663. [Google Scholar] [CrossRef]
  7. Cui, S.; Miao, Q.; Liang, W.; Zhang, Z.; Xu, Y.; Ren, B. Tribological Behavior of Plasma-Sprayed Al2O3-20 wt.%TiO2. Coatings 2017, 26, 2086–2094. [Google Scholar] [CrossRef]
  8. Goberman, D.; Sohn, Y.H.; Shaw, L.; Jordan, E.; Gell, M. Microstructure development of Al2O3–13wt%TiO2 plasma sprayed coatings derived from nanocrystalline powders. Acta. Mater. 2002, 50, 1141–1152. [Google Scholar] [CrossRef]
  9. Yang, Y.; Wang, Y.; Tian, W.; Yan, D.; Zhang, J.; Wang, L. Influence of composite powders’ microstructure on the microstructure and properties of Al2O3–TiO2 coatings fabricated by plasma spraying. Mater. Des. 2015, 65, 814–822. [Google Scholar] [CrossRef]
  10. Habib, K.A.; Saura, J.J.; Ferrer, C.; Damra, M.S.; Giménez, E.; Cabedo, L. Comparison of flame sprayed Al2O3/TiO2 coatings their microstructure, mechanical properties and tribology behaviour. Surf. Coat. Technol. 2006, 201, 1436–1443. [Google Scholar] [CrossRef]
  11. Li, G.; Ma, J.; Wang, H.; Kang, J.; Xu, B. Effects of argon gas flow rate on the microstructure and micromechanical properties of supersonic plasma sprayed nanostructured Al2O3-13wt.%TiO2 coatings. Appl. Surf. Sci. 2014, 311, 124–130. [Google Scholar] [CrossRef]
  12. Luo, H.; Song, P.; Khan, A.; Feng, J.; Zang, J.; Xiong, X.; Lü, J.; Lu, J. Alternant phase distribution and wear mechanical properties of an Al2O3-40 wt%TiO2 composite coating. Ceram. Int. 2017, 43, 7295–7304. [Google Scholar] [CrossRef]
  13. Zou, Z.; Wang, Y.; Zhou, F.; Wang, L.; Liu, S.; Wang, Y. Tribological property of plasma-sprayed Al2O3-13wt%TiO2 coatings onto resin-based composites. Appl. Surf. Sci. 2018, 431, 75–80. [Google Scholar] [CrossRef]
  14. Mehar, S.; Sapate, G.; Vashishtha, N.; Bagde, P. Effect of Y2O3 addition on tribological properties of plasma sprayed Al2O3-13% TiO2 coating. Ceram. Int. 2020, 46, 11799–11810. [Google Scholar] [CrossRef]
  15. Lu, X.; Yan, D.; Yang, Y.; Dong, Y.; He, J.; Zhang, J. Phase evolution of plasma sprayed Al2O3-13%TiO2 coatings derived from nanocrystalline powders. Trans. Nonferr. Met. Soc. China 2013, 23, 2951–2956. [Google Scholar] [CrossRef]
  16. Yugeswaran, S.; Selvarajan, V.; Vijay, M.; Ananthapadmanabhan, P.V.; Sreekumar, K.P. Influence of critical plasma spraying parameter (CPSP) on plasma sprayed Alumina–Titania composite coatings. Ceram. Int. 2010, 36, 141–149. [Google Scholar] [CrossRef]
  17. Wang, H.; Ma, J.; Li, G.; Kang, J.; Xu, B. The dependency of microstructure and mechanical properties of nanostructured Alumina–Titania coatings on critical plasma spraying parameter. Appl. Surf. Sci. 2014, 314, 468–475. [Google Scholar] [CrossRef]
  18. Bounazef, M.; Guessasma, S.; Montavon, G.; Coddet, C. Effect of APS process parameters on wear behaviour of Alumina–Titania coatings. Mater. Lett. 2004, 58, 2451–2455. [Google Scholar] [CrossRef]
  19. Song, E.P.; Ahn, J.; Lee, S.; Kim, N.J. Effects of critical plasma spray parameter and spray distance on wear resistance of Al2O3-8wt%TiO2 coatings plasma-sprayed with nanopowders. Surf. Coat. Technol. 2008, 202, 3625–3632. [Google Scholar] [CrossRef]
  20. Zheng, X.; Liu, Y. Slurry erosion–corrosion wear behavior in SiC-containing NaOH solutions of Mo2NiB2 cermets prepared by reactive sintering. Int. J. Refract. Met. Hard 2019, 78, 193–200. [Google Scholar] [CrossRef]
  21. Şenol, Y.; Mediha, I.; Gozde, F.; Celebi, C. The effect of bond coat on mechanical properties of plasma-sprayed Al2O3 and Al2O3-13wt% TiO2 coatings on AISI 316L stainless steel. Vacuum 2005, 77, 315–321. [Google Scholar]
  22. Kang, J.; Xu, B.; Wang, H.; Wang, C. Influence of spraying parameters on the microstructure and properties of plasma-sprayed Al2O3/40%TiO2 coating. Phys. Procedia 2013, 50, 169–176. [Google Scholar] [CrossRef] [Green Version]
  23. Sreekumar Rajesh, T.; Venkata Rao, R. Experimental Investigation and Parameter Optimization of Al2O3-40% TiO2 Atmospheric Plasma Spray Coating on SS316 Steel Substrate. Mater. Today 2018, 5, 5012–5020. [Google Scholar] [CrossRef]
  24. Odhiambo, J.G.; Li, W.; Zhao, Y.; Li, C. Porosity and Its Significance in Plasma-Sprayed. Coatings 2019, 9, 460. [Google Scholar] [CrossRef] [Green Version]
  25. Rueden, C.T.; Schindelin, J.; Hiner, M.C.; Eliceriri, K.W. ImageJ: ImageJ for the next generation of scientific image data. BMC Bioinform. 2017, 18, 529. [Google Scholar] [CrossRef]
  26. Zavareh, M.A.; Sarhan, A.A.D.M.; Karimzadeh, R.; Singh, R.S.A.l.K. Analysis of corrosion protection behavior of Al2O3-TiO2 oxide ceramic coating on carbon steel pipes for petroleum industry. Ceram. Int. 2018, 44, 5967–5975. [Google Scholar] [CrossRef]
  27. Ramesh, C.S.; Devaraj, D.S.; Keshavamurthy, R.; Sridhar, B.R. Slurry erosive wear behaviour of thermally sprayed Inconel-718 coatings by APS process. Wear 2011, 271, 1365–1371. [Google Scholar] [CrossRef]
Figure 1. (a) As-received A12O3-13 wt.% TiO2 (AT13) particles at X500, (b) as-received AT13 particles at X2000, (c) as-received Ni5Al composite particles at X500, and (d) as-received Ni5Al composite particles at X2000.
Coatings 10 01122 g001
Figure 2. (a) Surface morphology of the Ni5Al layer and (b) the corresponding magnified image.
Coatings 10 01122 g002
Figure 3. (a) Surface morphology and element mapping of (b) Ti and (c) Al of the AT13 coating prepared at the optimized parameters.
Coatings 10 01122 g003
Figure 4. SEM morphologies of the AT13 coatings prepared at (a,b) nonoptimized parameters and (c,d) optimized parameters.
Coatings 10 01122 g004
Figure 5. Image J calculated porosity of the AT13 coatings prepared at (a) nonoptimized parameters and (b) optimized parameters.
Coatings 10 01122 g005
Figure 6. (a) Cross-sectional morphology of the coating prepared at optimized parameters and (b) the corresponding element mapping of (c) Fe, (d) Al, (e) O, (f) Ni, and (g) Ti.
Coatings 10 01122 g006
Figure 7. XRD patterns of as-received AT13 powders and the AT13 coatings prepared at optimized and nonoptimized parameters.
Coatings 10 01122 g007
Figure 8. Morphologies of the AT13 coatings prepared at (a) nonoptimized parameters and (b) optimized parameters after pull-out testing.
Coatings 10 01122 g008
Figure 9. Microhardness distribution along cross-section of the samples prepared at nonoptimized and optimized parameters.
Coatings 10 01122 g009
Figure 10. Surface morphologies of the coatings prepared at (a) optimized and (b) nonoptimized parameters after 0, 15, 30, and 45 times of heat shock.
Coatings 10 01122 g010
Figure 11. Potentiodynamic polarization curves of the AT13 coatings and Q235 substrate.
Coatings 10 01122 g011
Figure 12. Surface morphologies of the AT13 coating prepared at (a) optimized and (b) nonoptimized parameters and (c) Q235 substrate after erosion with (d) the corresponding magnified image.
Coatings 10 01122 g012
Table 1. Four factors and three levels for spraying A12O3-13 wt.% TiO2 (AT13) coatings.
Level NumberPlasma Current (A)Ar Flow (L/min)H2 Flow (L/min)Spray Standoff Distance (mm)
I530311080
II5653612100
III6004114120
Table 2. Designed parameters combination in orthogonal experiments of AT13 coatings.
Sample NumberSpray Current (A)Ar Flow (L/min)H2 Flow (L/min)Spray Standoff Distance (mm)
1I (530)I (31)I (10)I (80)
2II (565)II (36)II (12)I
3III (600)III (41)III (14)I
4IIIIIIII (100)
5IIIIIIII
6IIIIIIII
7IIIIIIIII (120)
8IIIIIIIII
9IIIIIIIII
Table 3. Bond strength of the AT13 coatings prepared at designed parameters.
Sample NumberBond Strength (MPa)Average Bond Strength (MPa)
119.8621.8022.7421.47
214.6113.2314.4114.08
316.3618.3317.0317.24
418.3120.5819.6319.51
523.7624.2821.6923.24
624.2022.5922.0822.96
719.7921.1718.3019.75
816.6314.6814.8515.39
910.4212.6213.2912.11
Table 4. Range analysis of the bond strength of the AT13 coatings prepared at three levels.
Level NumberPlasma Current (A)Ar Flow (L/min)H2 Flow (L/min)Spray Standoff Distance (mm)
I sum60.7359.8256.8252.79
II sum52.7145.7056.7965.71
III sum52.3160.2452.1347.25
I average20.2419.9418.9417.60
II average17.5715.2318.9321.90
III average17.4420.0817.3815.75
Range (D)2.84.851.566.15
Table 5. Ecorr and Icorr calculated from the potentiodynamic polarization curves.
SamplesEcorr (mV)Icorr (μA/cm2)
Nonoptimized AT13−718 ± 211.96 ± 0.48
Optimized AT13−699 ± 151.41 ± 0.51
Q235−997 ± 9103.1 ± 1.9
Table 6. Weight of the samples before and after erosion.
SamplesBefore Erosion (g)After Erosion (g)Weight Loss (mg)
Samples coated by nonoptimized AT1310.079910.067512.4
Samples coated by optimized AT1310.600310.59465.7
Q235 substrate10.322110.1663155.8
Publisher’s Note: MDPI stays neutral with regard to jurisdictional claims in published maps and institutional affiliations.

