Article

Durability of Superamphiphobic Polyester Fabrics in Simulated Aerodynamic Icing Conditions

by
Alexandre Laroche
1,2,
Linda Ritzen
1,3,
Javier Alejandro Mayén Guillén
1,4,
Vittorio Vercillo
1,5,
Maria D’Acunzi
6,
Azadeh Sharifi Aghili
6,
Jeanette Hussong
2,
Doris Vollmer
6,* and
Elmar Bonaccurso
1,*
1
Airbus Central Research & Technology, Materials X, Willy-Messerschmitt-Str. 1, 82024 Taufkirchen, Germany
2
Fachgebiet Strömungslehre und Aerodynamik, Technische Universität Darmstadt, Alarich-Weiss-Str. 10, 64287 Darmstadt, Germany
3
Faculty of Aerospace Engineering, Delft University of Technology, Kluyverweg 1, 2629 HS Delft, The Netherlands
4
École Supérieure de Chimie Physique Électronique (CPE) de Lyon, Chimie génie des procédés, 43 boulevard du 11 Novembre 1918, 69100 Villeurbanne, France
5
Institute für Fertigungstechnik, Technische Universität Dresden, George-Bähr-Str. 3c, 01069 Dresden, Germany
6
Max-Planck Institute for Polymer Research, Ackermannweg 10, 55128 Mainz, Germany
*
Authors to whom correspondence should be addressed.
Coatings 2020, 10(11), 1058; https://doi.org/10.3390/coatings10111058
Submission received: 28 September 2020 / Revised: 28 October 2020 / Accepted: 28 October 2020 / Published: 2 November 2020
(This article belongs to the Special Issue Low Ice Adhesion Coatings)

Abstract

:
Fabrics treated to repel water, superhydrophobic, and water and oil, superamphiphobic, have numerous industrial and consumer-level benefits. However, the liquid repellency decreases in the course of time. This is largely due to chemical or physical changes of the coating due to prolonged exposure to relatively harsh environments. To develop more durable fabric treatments for specific applications, it is necessary to measure the extent to which the treated fabrics retain their low-wettability after being subjected to controlled aggressive environmental conditions. In this study, plain weave fabrics made from polyester filaments and coated with silicone nanofilaments in-solution were exposed to aerodynamic icing conditions. The coated fabrics showed superhydrophobic behavior, or superamphiphobic for those that were fluorinated. The wettability of the fabrics was progressively evaluated by contact angle and roll-off-angle measurements. The coated fabrics were able to maintain their low-wettability characteristics after exposure to water droplet clouds at airspeeds up to 120 m/s, despite damage to the silicone nanofilaments, visible through scanning electron microscopy.

1. Introduction

Fabric aircraft skins have been historically important in aviation. A fabric taught over rigid wing spars provides a smooth aerodynamic surface with minimal weight, ideal for small and ultralight aircraft. Due to its low cost and light weight, this concept is still being used to this day on some small aircraft. Although more robust light aircraft are built using carbon fiber composites, many recent home-built or experimental aircraft make use of fabric-covered wings [1]. These small aircraft typically fly at airspeeds not exceeding 80 m/s or 300 km/h [2,3].
At comparatively low speeds and altitudes, contamination of aircraft surfaces is at best an inconvenience and at worst a serious safety concern. A common in-flight external surface contamination is due to insect impact. Another more severe but less frequent source of damage comes from atmospheric icing experienced, e.g., during flight. It is also known as impact icing. This term refers to the impact of supercooled water droplets, which freeze when they collide with the surface of an aircraft. Aircraft icing does not occur during a typical cruise phase of flight, but is common enough after take-off and before landing to be of great concern for pilots and flight planners. If ignored, ice accretion on aerodynamic surfaces can lead to a loss of aircraft control. Fabric covered aircraft typically do not have the energy resources for ice contamination prevention typically used on metal-skin airframes with larger on-board power plants. For example, for the prevention of icing, most metal-skin airframes use some form of heating on critical surfaces to evaporate impacting supercooled droplets. Others use a pneumatic boot, which once inflated, stresses accreted ice to the point of breaking, relieving the surface of ice contamination [4]. Insect contamination and frost are typically washed off when the aircraft is on-ground. The use of excessive pressure during washing can be problematic for fabric-skin aircraft due to a risk of piercing the skin. An easy-to-clean, superamphiphobic fabric would reduce the pressure needed to remove contamination from a fabric-skin aircraft. It could potentially reduce the risk posed by icing contamination by reducing the adhesion strength to ice, or slowing the accretion of ice entirely.
On the ground, at high altitudes such as in mountainous regions, and at sea [5], icing similar to that seen in-flight can degrade the performance of signal transmission equipment [6], and greatly increase safety hazards. Ice accumulated on such equipment is often removed by hand, meaning physically removing the ice using a hand-tool. One solution that has been proposed to ease the removal of ice is to loosely cover the equipment with some fabric before ice begins to form [7]. The flexible nature of the fabric means it is easy to bend and therefore break ice apart. It logically follows that a fabric with an icephobic or even hydrophobic coating would further ease that process.
A staggering number of hydrophobic technologies and processes has been published in recent years [8,9]. Hydrophobicity is dependent on the microstructure, nanostructure, and chemistry of a surface [10]. On a superhydrophobic or superamphiphobic surface, the droplet partially rests on an air cushion. The reduced contact area helps to support and repel droplets [11]. To design superhydrophobic or superamphiphobic surfaces, the coatings need to have a low surface free energy. The surface energy is a measure for the amount of energy needed for a fluid (air or liquid) to form an interface with the surface [12]. A microstructure can decrease the contact area that a liquid has with a surface if air cushions are formed between asperities. The droplet is in the so termed “Cassie state”. A deposited droplet rolls off if the surface is tilted by a few degrees. However, the large spacing between asperities cannot prevent wetting of the surface at high impact velocities. To increase the energy barrier against wetting of the surface by impacting droplets, a nanostructured surface is favorable. The so termed “Cassie-to-Wenzel transition” is prevented or delayed [13]. Additionally, droplets are less strongly pinned to nanostructures than to microstructures, thus greatly increasing their mobility on a surface [14]. However, microstructures show superior mechanical stability. Rigid nanostructures can be easily eroded. Typically, nanostructures have poor mechanical durability due to their small cross-sections, which induce higher stress for a given force. Surface chemistry modifications (e.g., hydrophobization or fluorination) conceptually do not fail mechanically, but rather from exposure to corrosive chemicals, extreme temperatures, or certain wavelengths of radiation such as UV [15,16].
Coatings composed of silicone nanofilaments (SNFs) have shown superhydrophobicity [17], and durable superamphiphobicity [18]. They are chemically inert so they do not decompose in harsh chemical environments, nor do they degrade from exposure to UV [19]. Conceptually, they show higher toughness (can be deformed more before breaking) than hard nanostructures due to their flexibility. However, on flat glass plates, low mechanical stability of SNF coatings has been reported [20]. Enhanced durability has been achieved using fabric substrates instead of flat glass [21]. Fibers and weaves provide a microstructure to the SNF, which protects the sides not facing the shear stress from abrasion, conserving superamphiphobicity. The sponginess of fabrics effectively reduces contact pressure with SNF, reducing the likelihood of them being abraded.
The durability of superamphiphobic fabrics has been evaluated by prolonged chemical exposure, and by exposure to an urban external environment on the outside of a car. The car was driven at speeds up to 120 km/h (33 m/s) and traveled a distance of more than 5000 km. The most severely damaged fabric suffered a water roll-off-angle increase of 20° (from 5° to 25°) and hexadecane roll-off-angle increase of 40° (from 10° to 50°). Despite its degraded performance, SNF remained attached to the polyester fibers after the 257 days of exposure [18].
The goal of the study was to determine whether superamphiphobic coatings based on SNF are mechanically durable enough for typical flight conditions, including atmospheric icing conditions, experienced by a low-speed aircraft. We investigate whether the bond between SNF coatings and a polyester fabric substrate can withstand aerodynamic shear forces for airspeeds up to 120 m/s (430 km/h). Aerodynamic friction can be considerable, especially at high Reynolds numbers (5.8 × 10⁵ during cruise conditions of one exemplary fabric-covered wing aircraft [
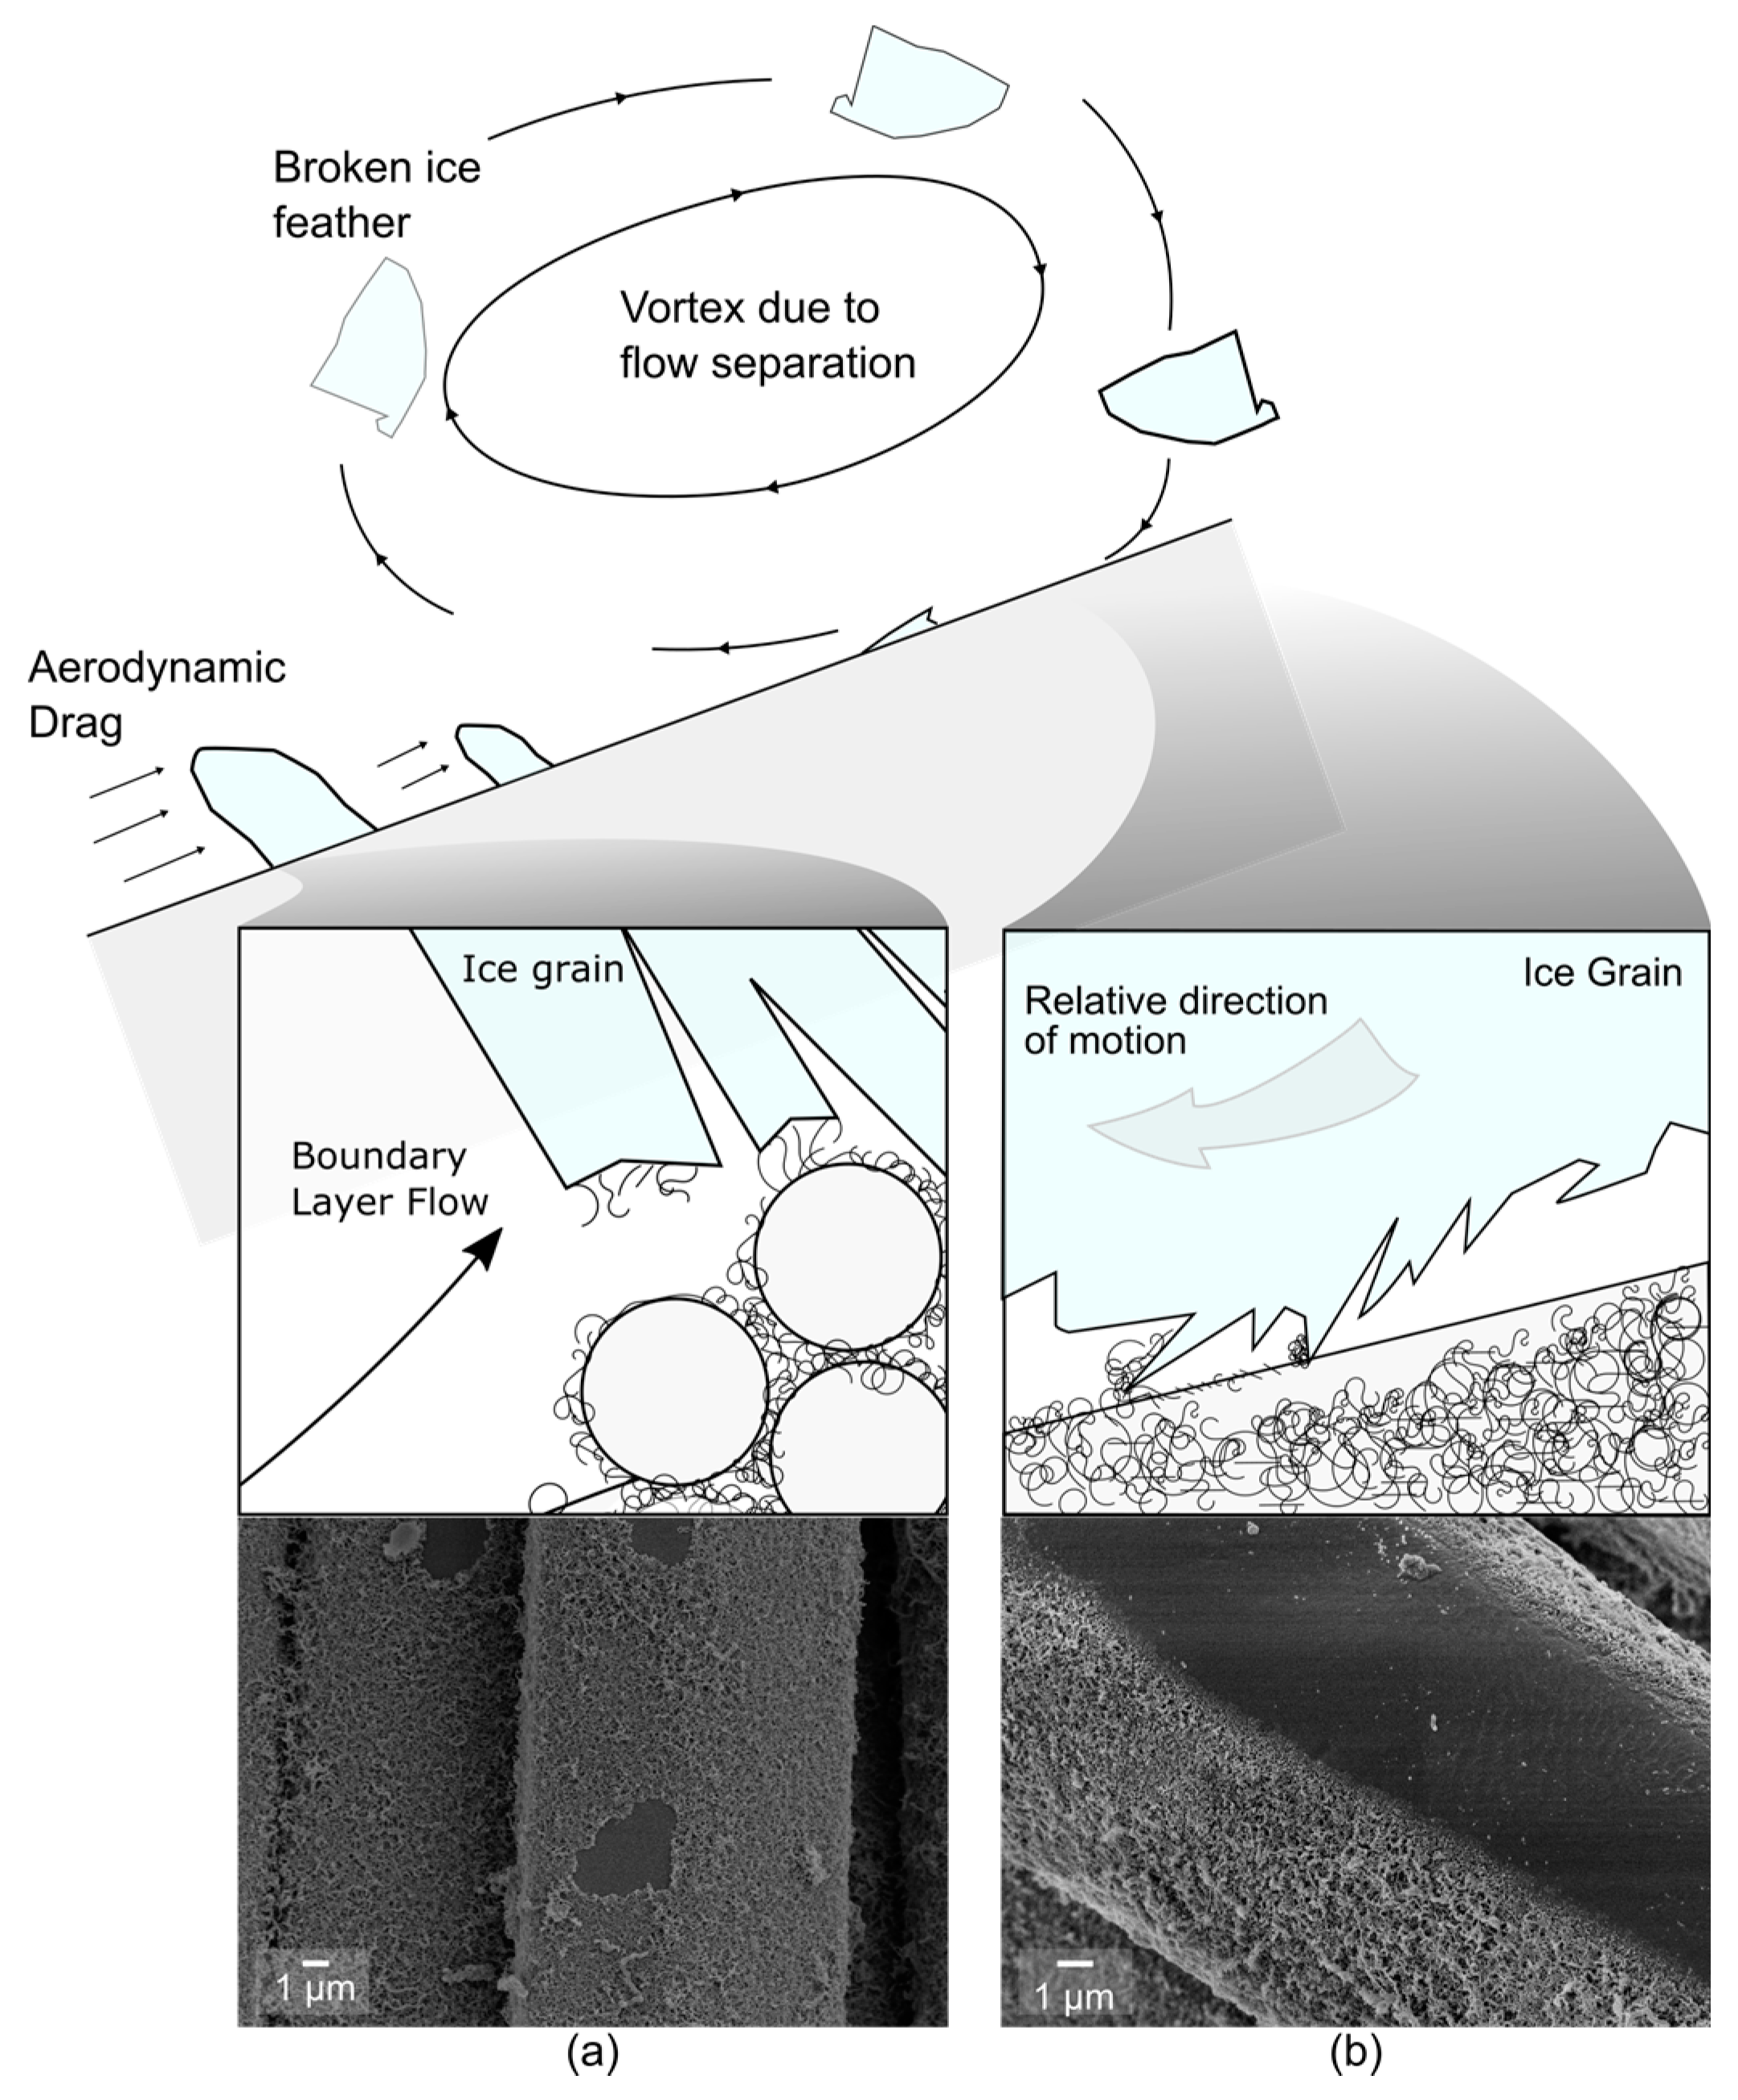
3]). On textured surfaces, such as fabrics, boundary layers become turbulent rather early on. The wear due to aerodynamic friction depends also on parameters such as an angle of attack and air temperature. In an icing wind tunnel, we introduce a cloud of micrometric water droplets to simulate flying into a cloud. This impacting spray is analogous to fog and to sea spray but with non-salinized water. Above freezing temperatures, the impact of droplets can resemble liquid-particle erosion. At sub-zero temperatures, these water droplets are supercooled and freeze on impact, simulating in-flight impact icing. The median volumetric diameter of the particles was 20 µm, smaller than the mean spacing between fiber bundles. That means that droplets can penetrate into the fabric, affecting non-superficial polyester fibers. We demonstrate that the coated fabrics can withstand impact of supercooled water droplets up to 120 m/s for several minutes.

2. Materials and Methods

Commercial fabrics were coated using a well-documented technique [15]. The coated fabrics were exposed to controlled environmental conditions in a small-scale icing wind tunnel and thereafter characterized by wettability to water or oil, and by scanning electron microscopy. For readers unfamiliar with the terminology used in aerodynamics, the terms found in this study have been concisely defined in Appendix B.

2.1. Substrate Preparation

Plain weave polyester fabrics (poly(ethylene terephthalate) or PET), purchased from Karstadt (Essen, Germany), were immersed in a solution of trichloromethylsilane (Sigma-Aldrich Chemie GmbH, Taufkirchen, Germany)(0.4 vol.%) in toluene (Fisher Scientific GmbH, Schwerte, Germany) containing water at 150 ppm, for 3 h (1-step). To increase the thickness of the coating, the solution was exchanged and replaced by a fresh solution (2-step). We refer to them as a 1-step and 2-step procedure. Upon removal from the solution, they were rinsed with n-hexane (Fisher Chemical) and dried with nitrogen. This process was used to grow a SNF network on the fabrics, making them superhydrophobic.
Superamphiphobicity was achieved by binding fluorine groups to the surface of the SNF. Coated fabrics were activated in an oxygen plasma chamber (120 W, Femto, Diener Electronic GmbH + Co. KG, Ebhausen, Germany) for 2 min. They were then immersed in a solution of 1H,1H,2H,2H-perfluorodecyltrichlorosilane (PFDTS, 0.05 vol.%) in n-hexane for 20 min. Upon removal, they were rinsed in n-hexane and dried with nitrogen gas. The procedure has been detailed in [15,18].
Fluorination is necessary to make the fabric superamphiphobic, however, superhydrophobicity is sufficient for many applications. Fluorination improves the water repellency of the coating by lowering its surface energy; contact angles increase and roll-off angles decrease. For comparison, we coated the SNF with a nanometer thin PDMS film. A PDMS film reduces the surface energy of the coating, while being more environmentally friendly than fluorine. Moreover, PDMS provides the filaments with “slippery” properties, potentially reducing the adhesion of ice.
To coat silicone nanofilaments with PDMS brushes, the fabrics coated with SNF were activated in an oxygen plasma (2 min, 120 W) and thereafter dipped into a solution for 15 s. The solution consisted of 0.43 mL (8.0 mmol, 1 wt.%) of sulfuric acid (H2SO4, 95%–97%) and 8.9 mL of dimethoxydimethylsilane (65 mmol, 10 wt.%) in 100 mL of 2-propanol. Prior to dipping the fabrics, the reaction mixture was stirred for 30 s and allowed to be stagnant for 30 min at room temperature. After dipping, excess solution was removed with a paper towel. The sample was then placed in a desiccator for 20 min with the plasma-activated side facing upward. The humidity inside the desiccator was regulated between 50% and 70% by releasing nitrogen gas, that has passed through a wash bottle containing Milli-Q water, into the desiccator. After 20 min, the sample was removed and washed with toluene, 2-propanol, and water respectively, then dried under a nitrogen stream. After coating with PDMS, the surface was superhydrophobic.
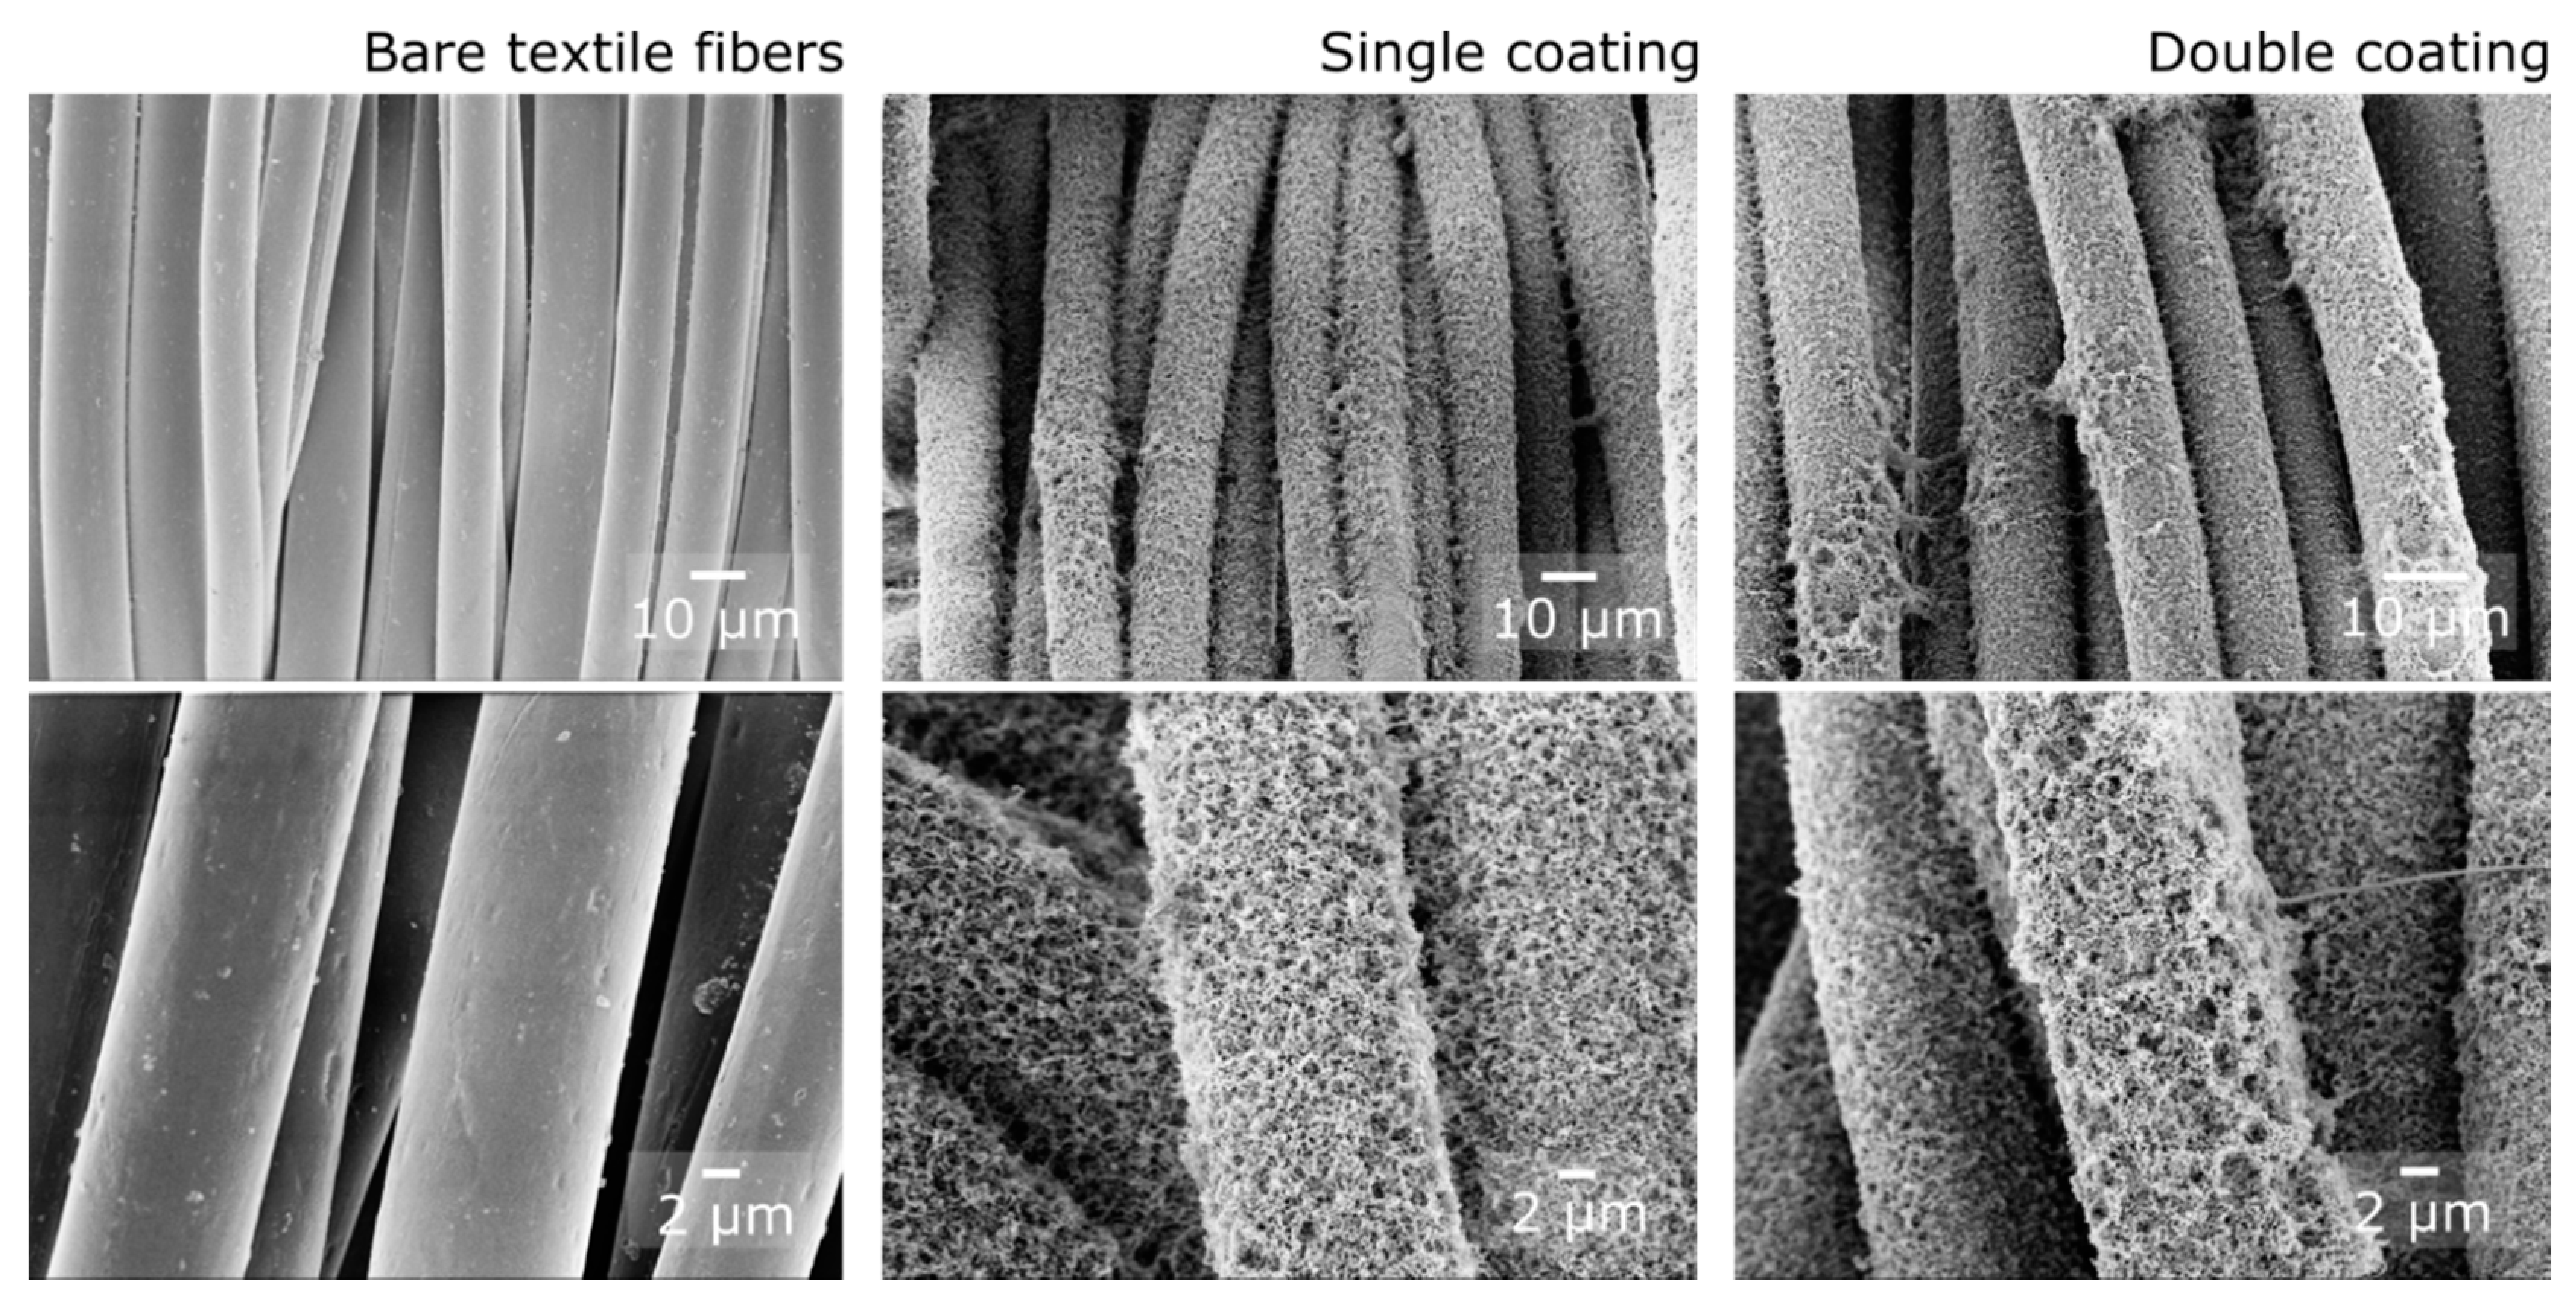
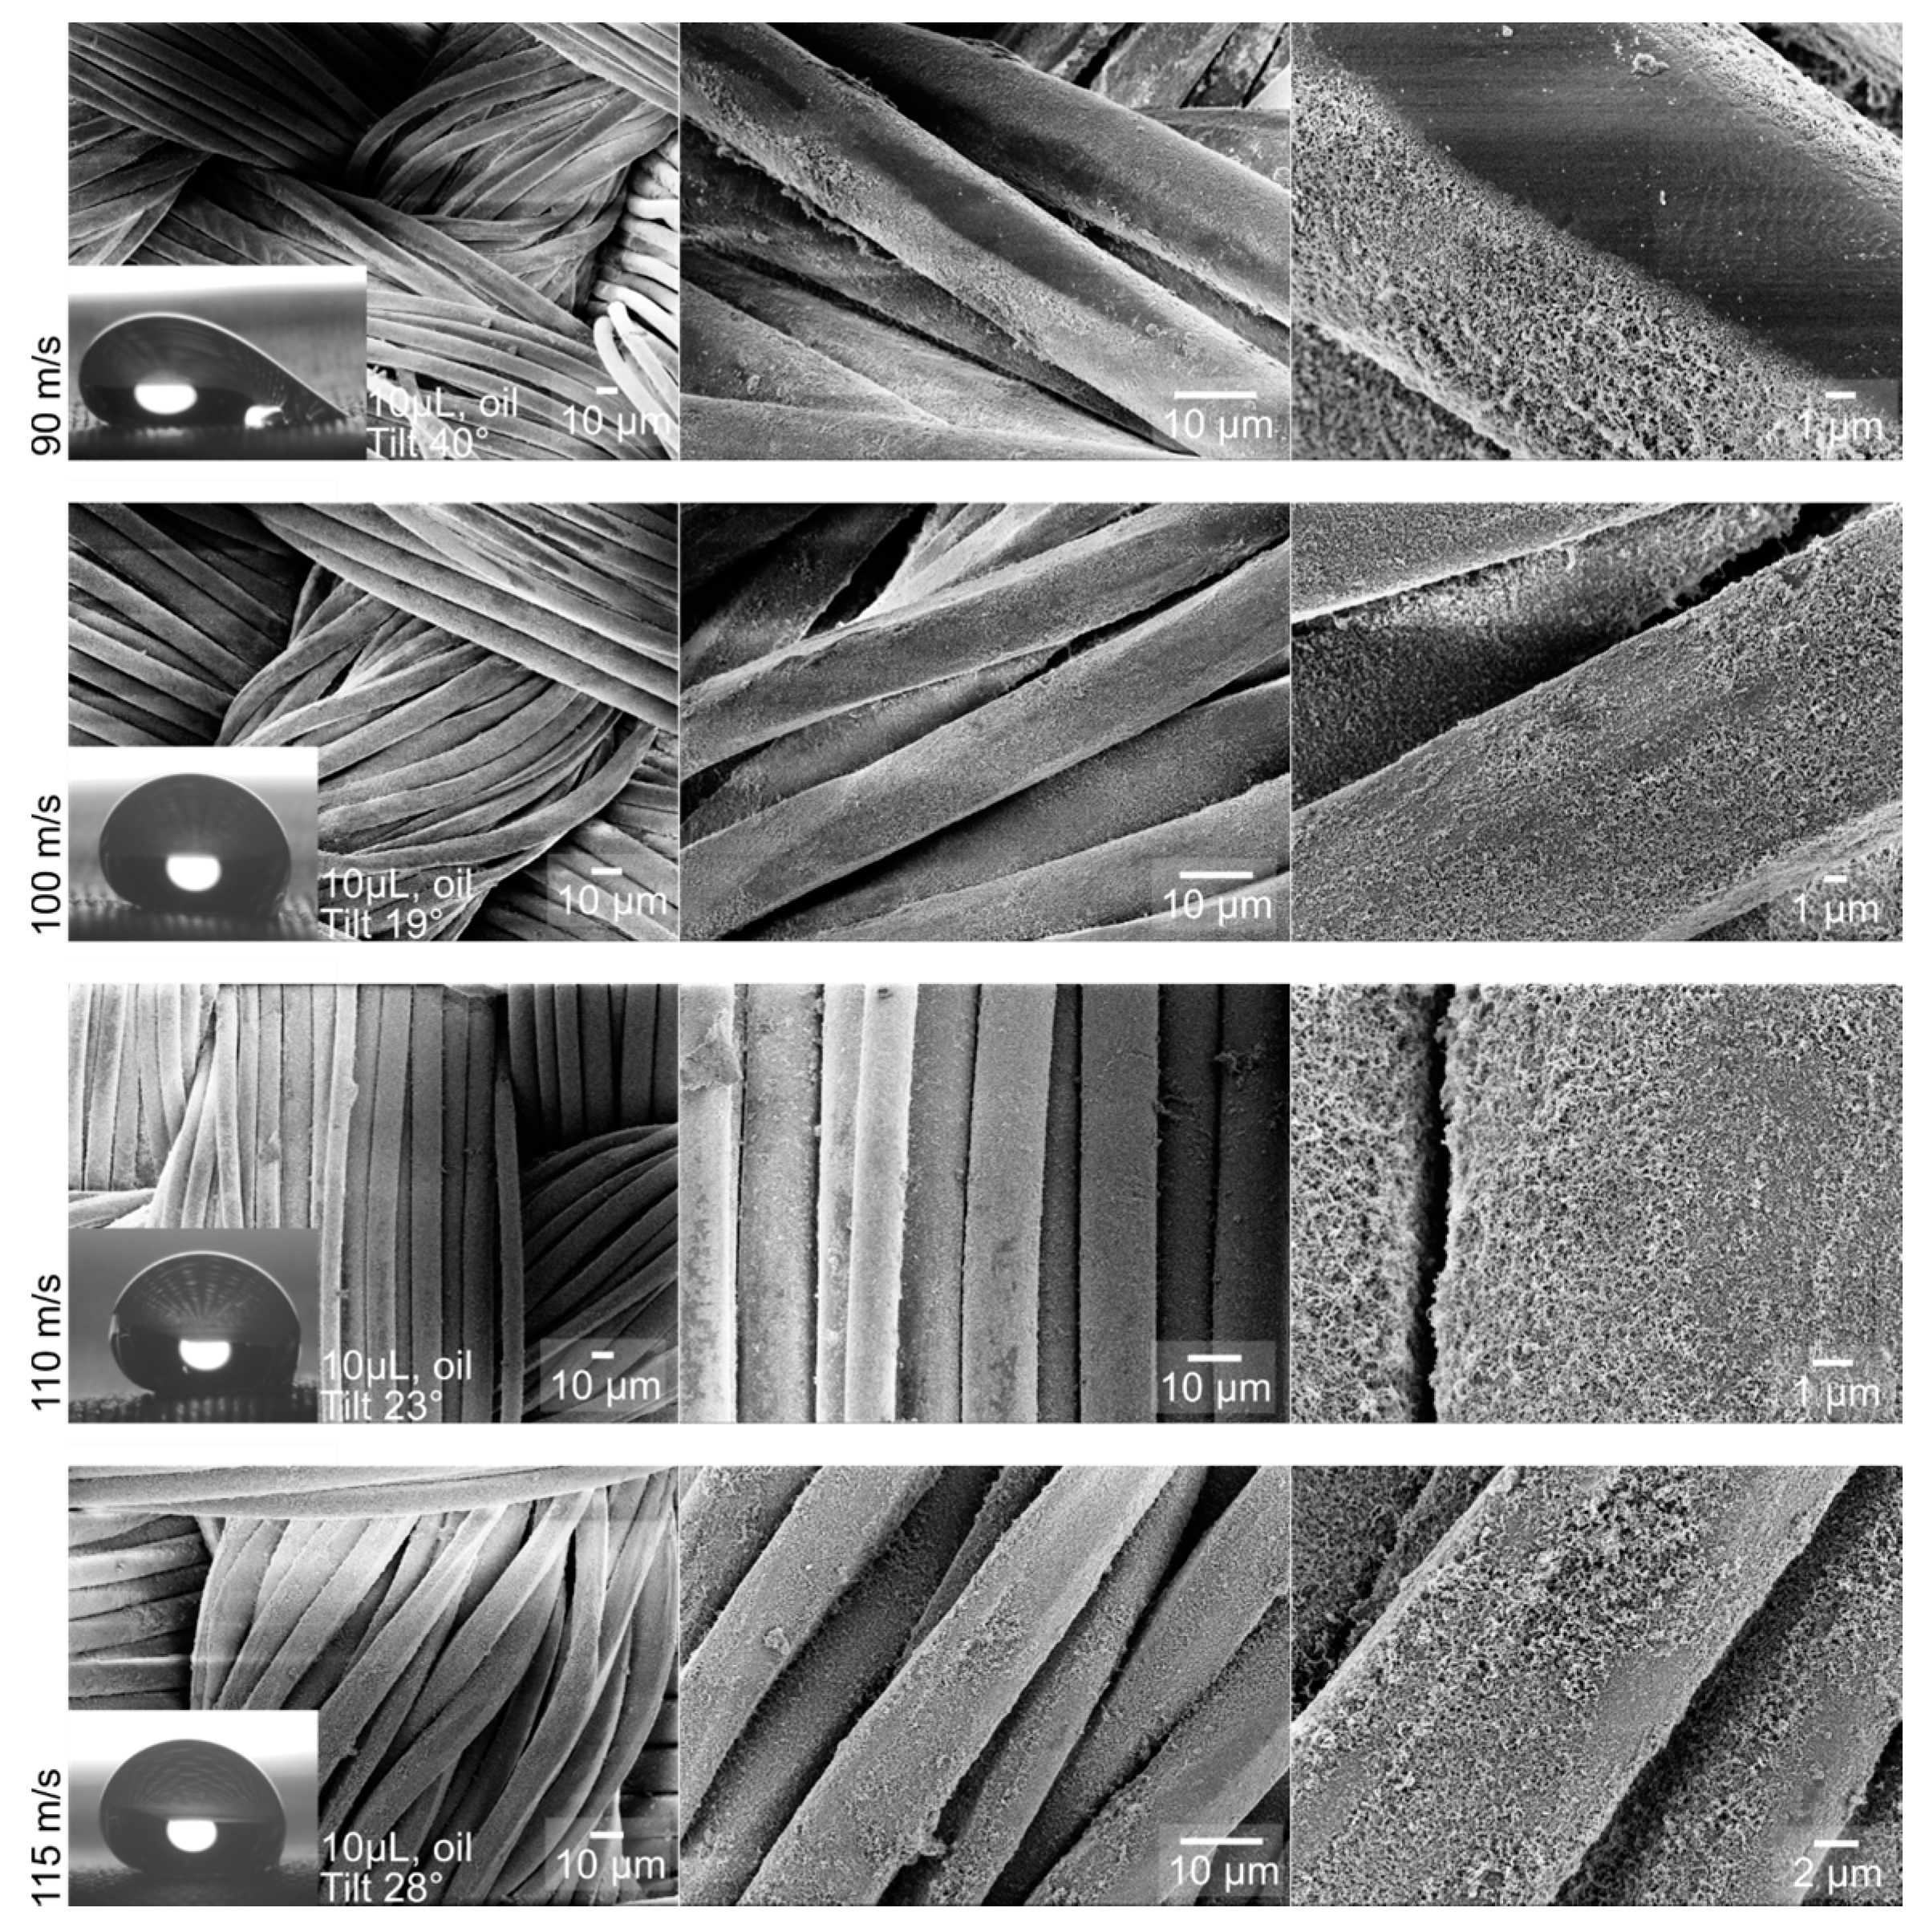
The fabrics were imaged before and after coating by scanning electron microscopy (SEM), Figure 1. SEM images were taken using a Zeiss LEO 1530 Gemini SEM (Carl Zeiss AG, Oberkochen, Germany) at gun voltages of 3 kV with an in-lens detector. To avoid charging, samples were sputtered with 7 nm Pt using a BalTec MED 020 modular high vacuum coating system before measurement, with an argon pressure of 2 × 10⁻⁵ bar and a current of 30 mA (Bal-Tec AG, Balzers, Liechtenstein). The bare fibers in the fabric were smooth with frequent but random minor defects. The fabrics that were coated once (1-step) show a slightly more uniform coverage of SNF on the fibers than those coated twice. The average thickness of the coating increased from approximately 1.5 µm after the first step to approximately 2.5 µm after the second step. The thickness of the nanofilaments varied between 50 and 100 nm and the spacing between filaments ranged from 100 nm to 2 µm (2 step). No change of the morphology could be detected after fluorination or coating with PDMS.

2.2. Icing Wind Tunnel Testing

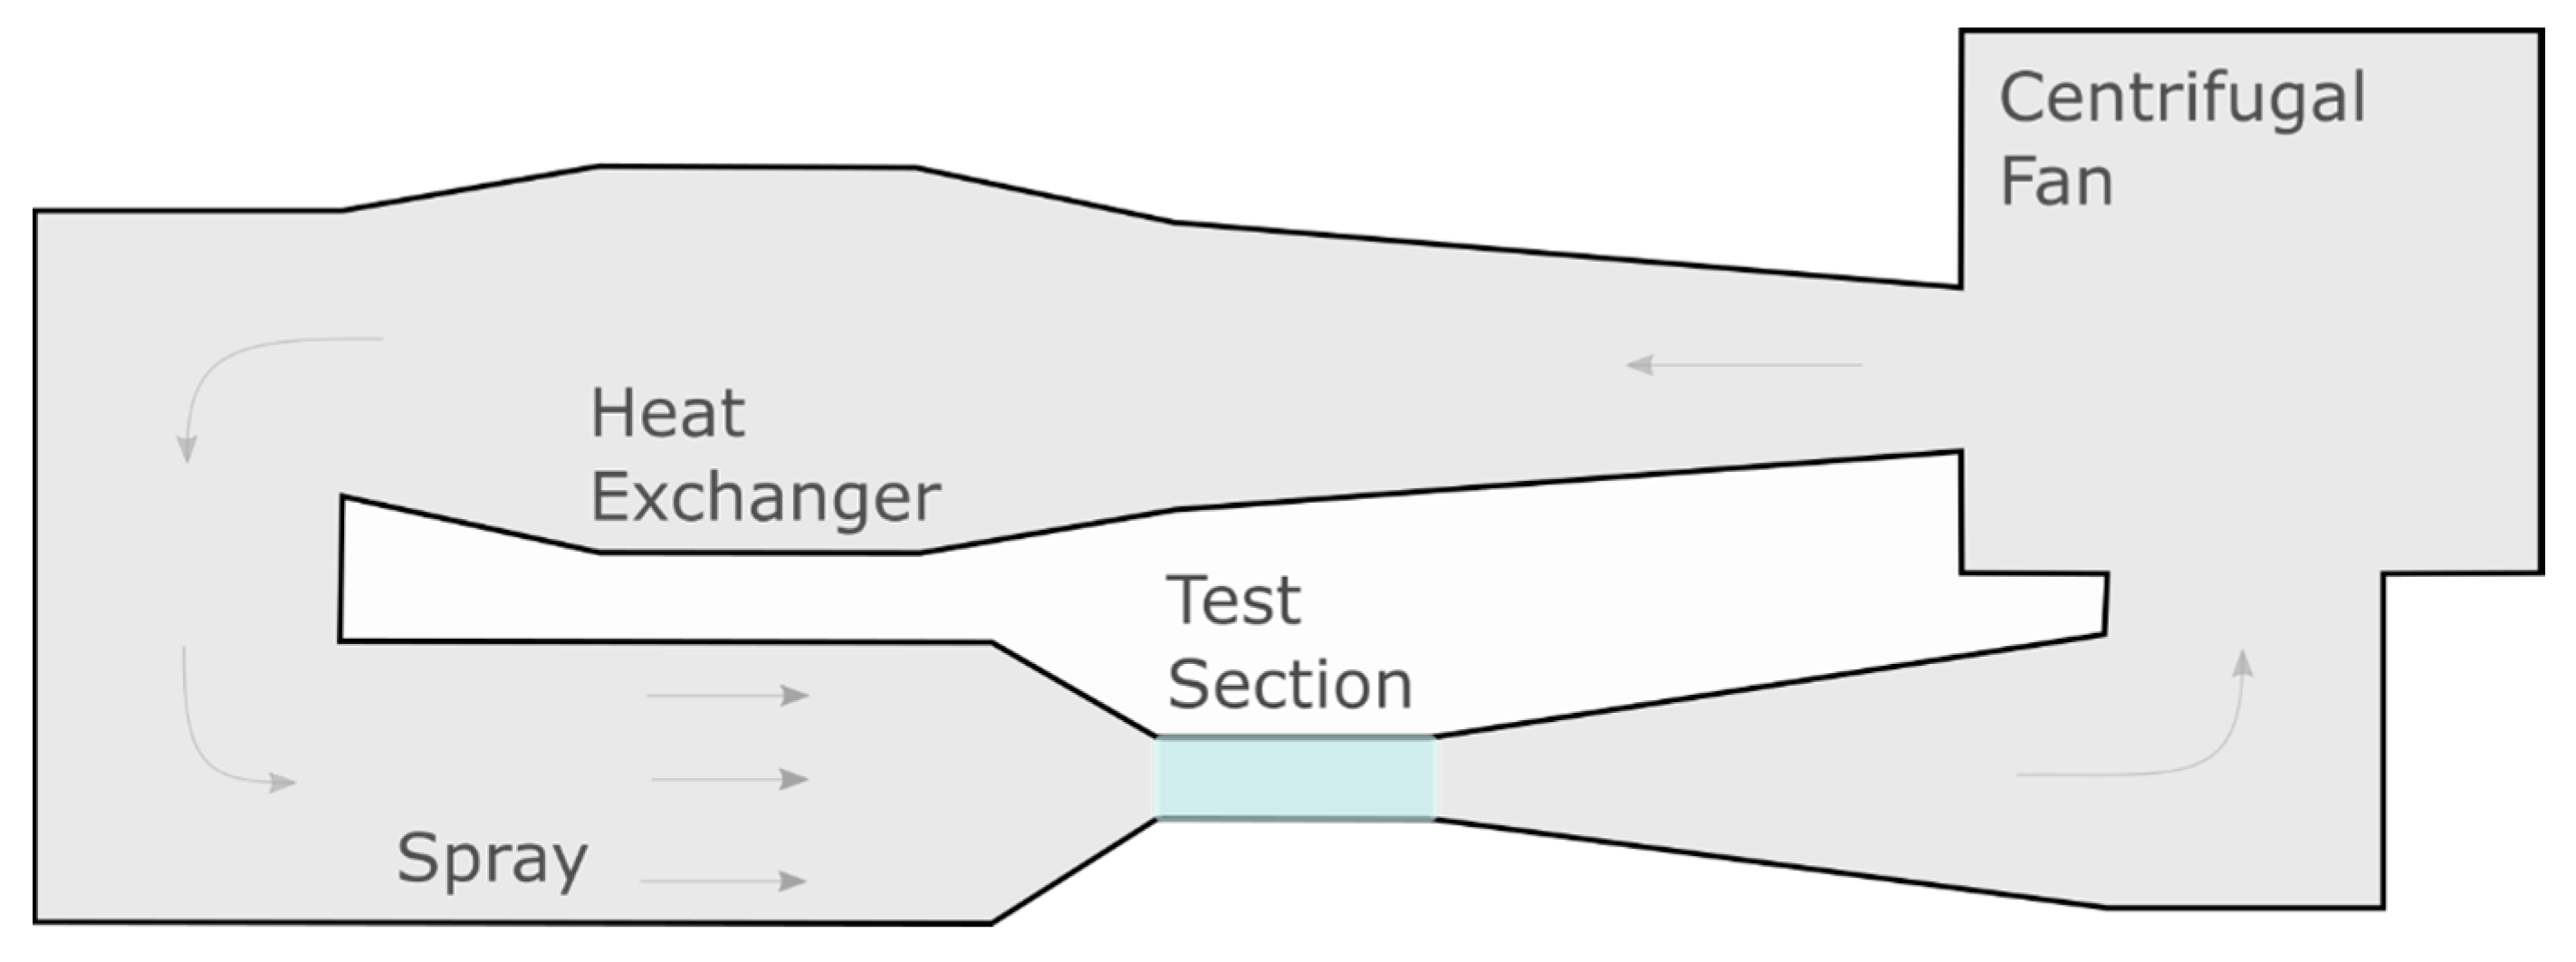
The icing and contamination research facility (iCORE) is a closed-loop wind tunnel equipped with a test section 100 mm wide and 150 mm high. The wind tunnel is fitted with an additional cooling section and spray section, Figure 2. The coolant flowing through the heat exchanger in the cooling section is pressurized by three compressors, one of which with variable power, allowing the air in the wind tunnel to reach temperatures as low as −40 °C. The spray section, upstream of the test section, includes three horizontally aligned, internal mix, air atomizing nozzles capable of producing water droplet clouds with a median volumetric droplet diameter (MVD) of 2 R = 20 µm, and a resulting liquid water content (LWC) of up to 2.0 g/m3 in the test section. The icing wind tunnel is driven by a fan, which can force air into the tests section up to a speed of U = 140 m/s. Assuming laminar flow, a water droplet in the test section would have a Weber number, We   =   ρ U 2 R γ = 2800, and a dynamic wetting pressure of P   =   0 . 5 ρ U 2   =   9 . 8   ×   10 6   Pa . Here, ρ is the density of water, U the impact velocity,   γ the interfacial tension, and R the radius of the droplet. Further details on the icing wind tunnel and its calibration have been presented by Hauk et al. [22].
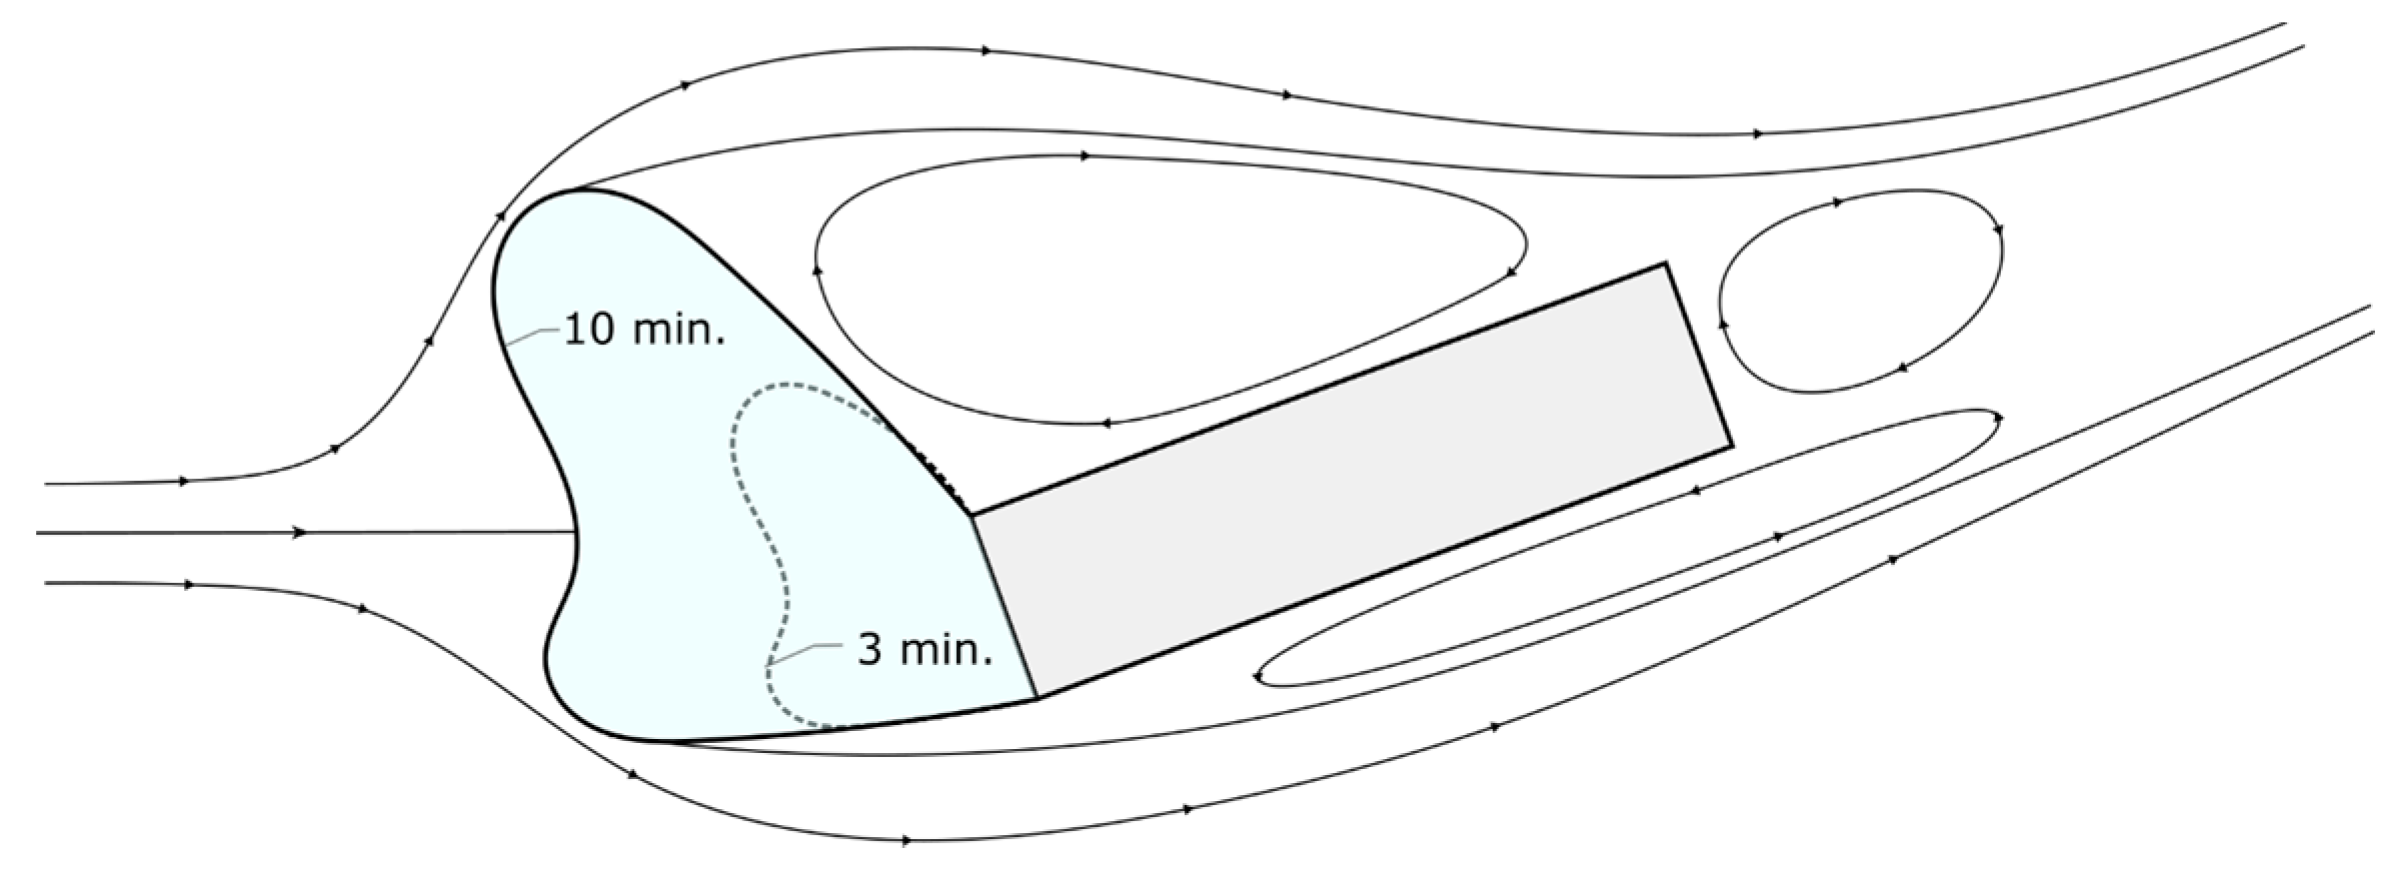
The superamphiphobic fabrics were mounted in the icing wind tunnel test section in two different configurations: on the leading edge of an airfoil (Figure 3), and on the top of an inclined flat plate (Figure 4). The airfoil profile provided a more realistic aerodynamic shape, giving insight into the specific wear conditions that the fabrics would see in-flight. The NACA 0012 shape was chosen because it is a relatively simple shape without camber, making it easy to manufacture and analyze [23,24,25]. The flat plate configuration was useful for studying relatively uniform wear conditions and controlling the angle of attack.
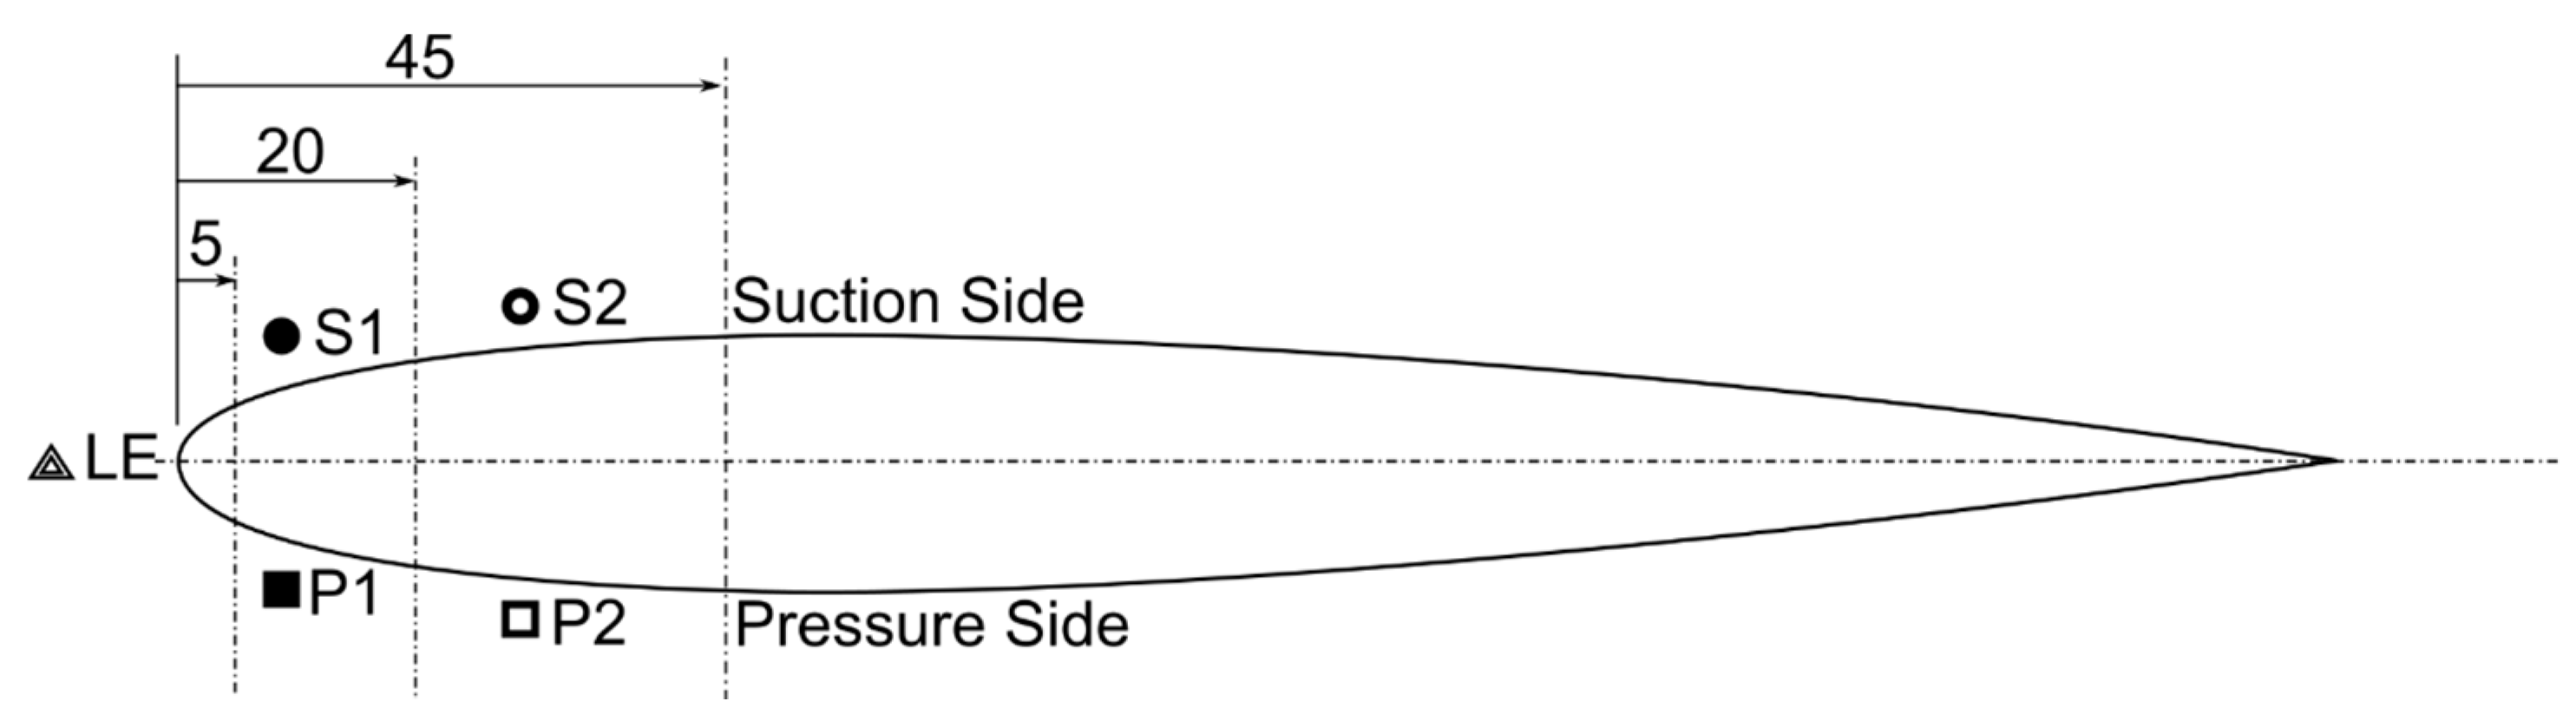
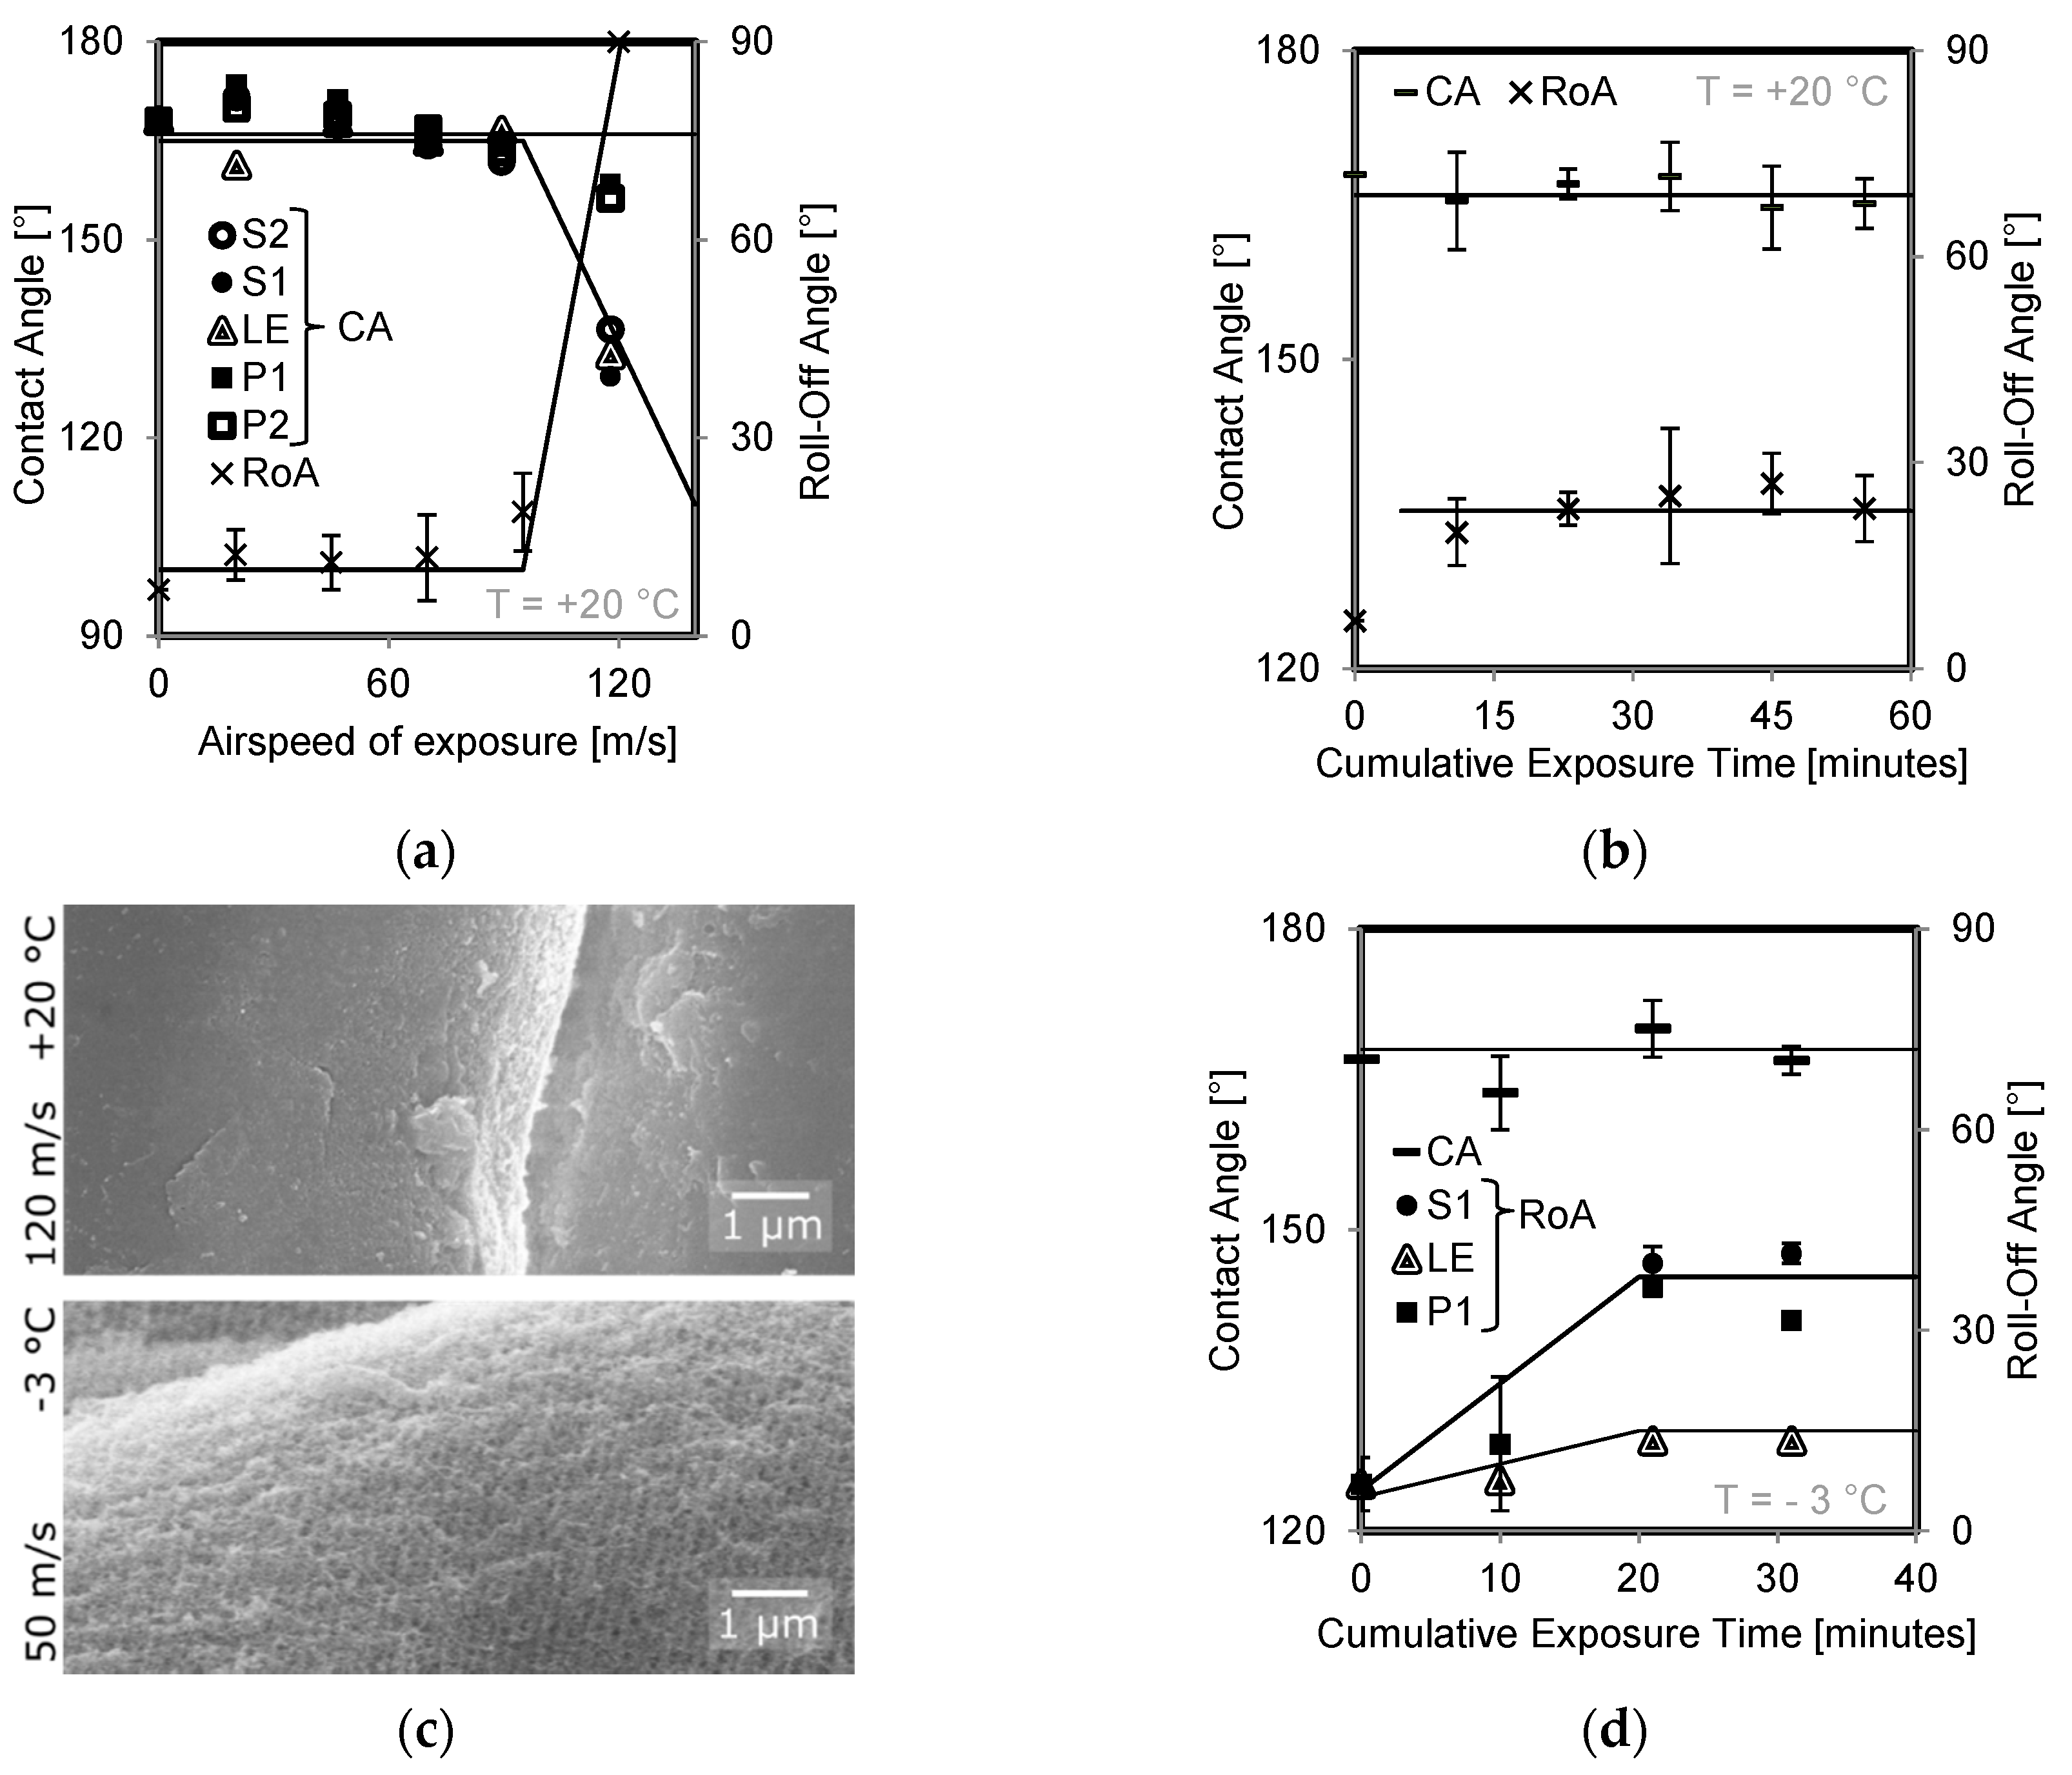
A NACA 0012 shape was used for exploring three pressure zones, namely, stagnation, suction, and pressure. The stagnation line, referred to as the leading edge (LE) in Figure 3, gets its name because that is where air hits the object and coms to a halt; it is a theoretical singularity point but in practice is the region of highest pressure. If the airfoil were tiled upward or if the centerline were curved (non-zero camber), then the stagnation line would be slightly below the centerline (also referred to as chord). The consequence would be that air passing over the top side would need to go faster than air passing under the bottom side because it would have to cover a slightly longer distance on the top in the same amount of time. As air velocity increases, static pressure decreases (in an adiabatic system), meaning that the air on the top side has a lower static pressure than on the bottom side, giving it the name, suction side. The airfoil configuration was tested in a 0°-angle of attack, so the absence of any camber meant the pressure and suction sides were not effective as such; they were just for designation and labeling. Fabrics were placed mid-span of the airfoil and covered up to the 45-mm chord-wise position. Three identical superamphiphobic fabrics were tested in this configuration, illustrated in Figure 3.
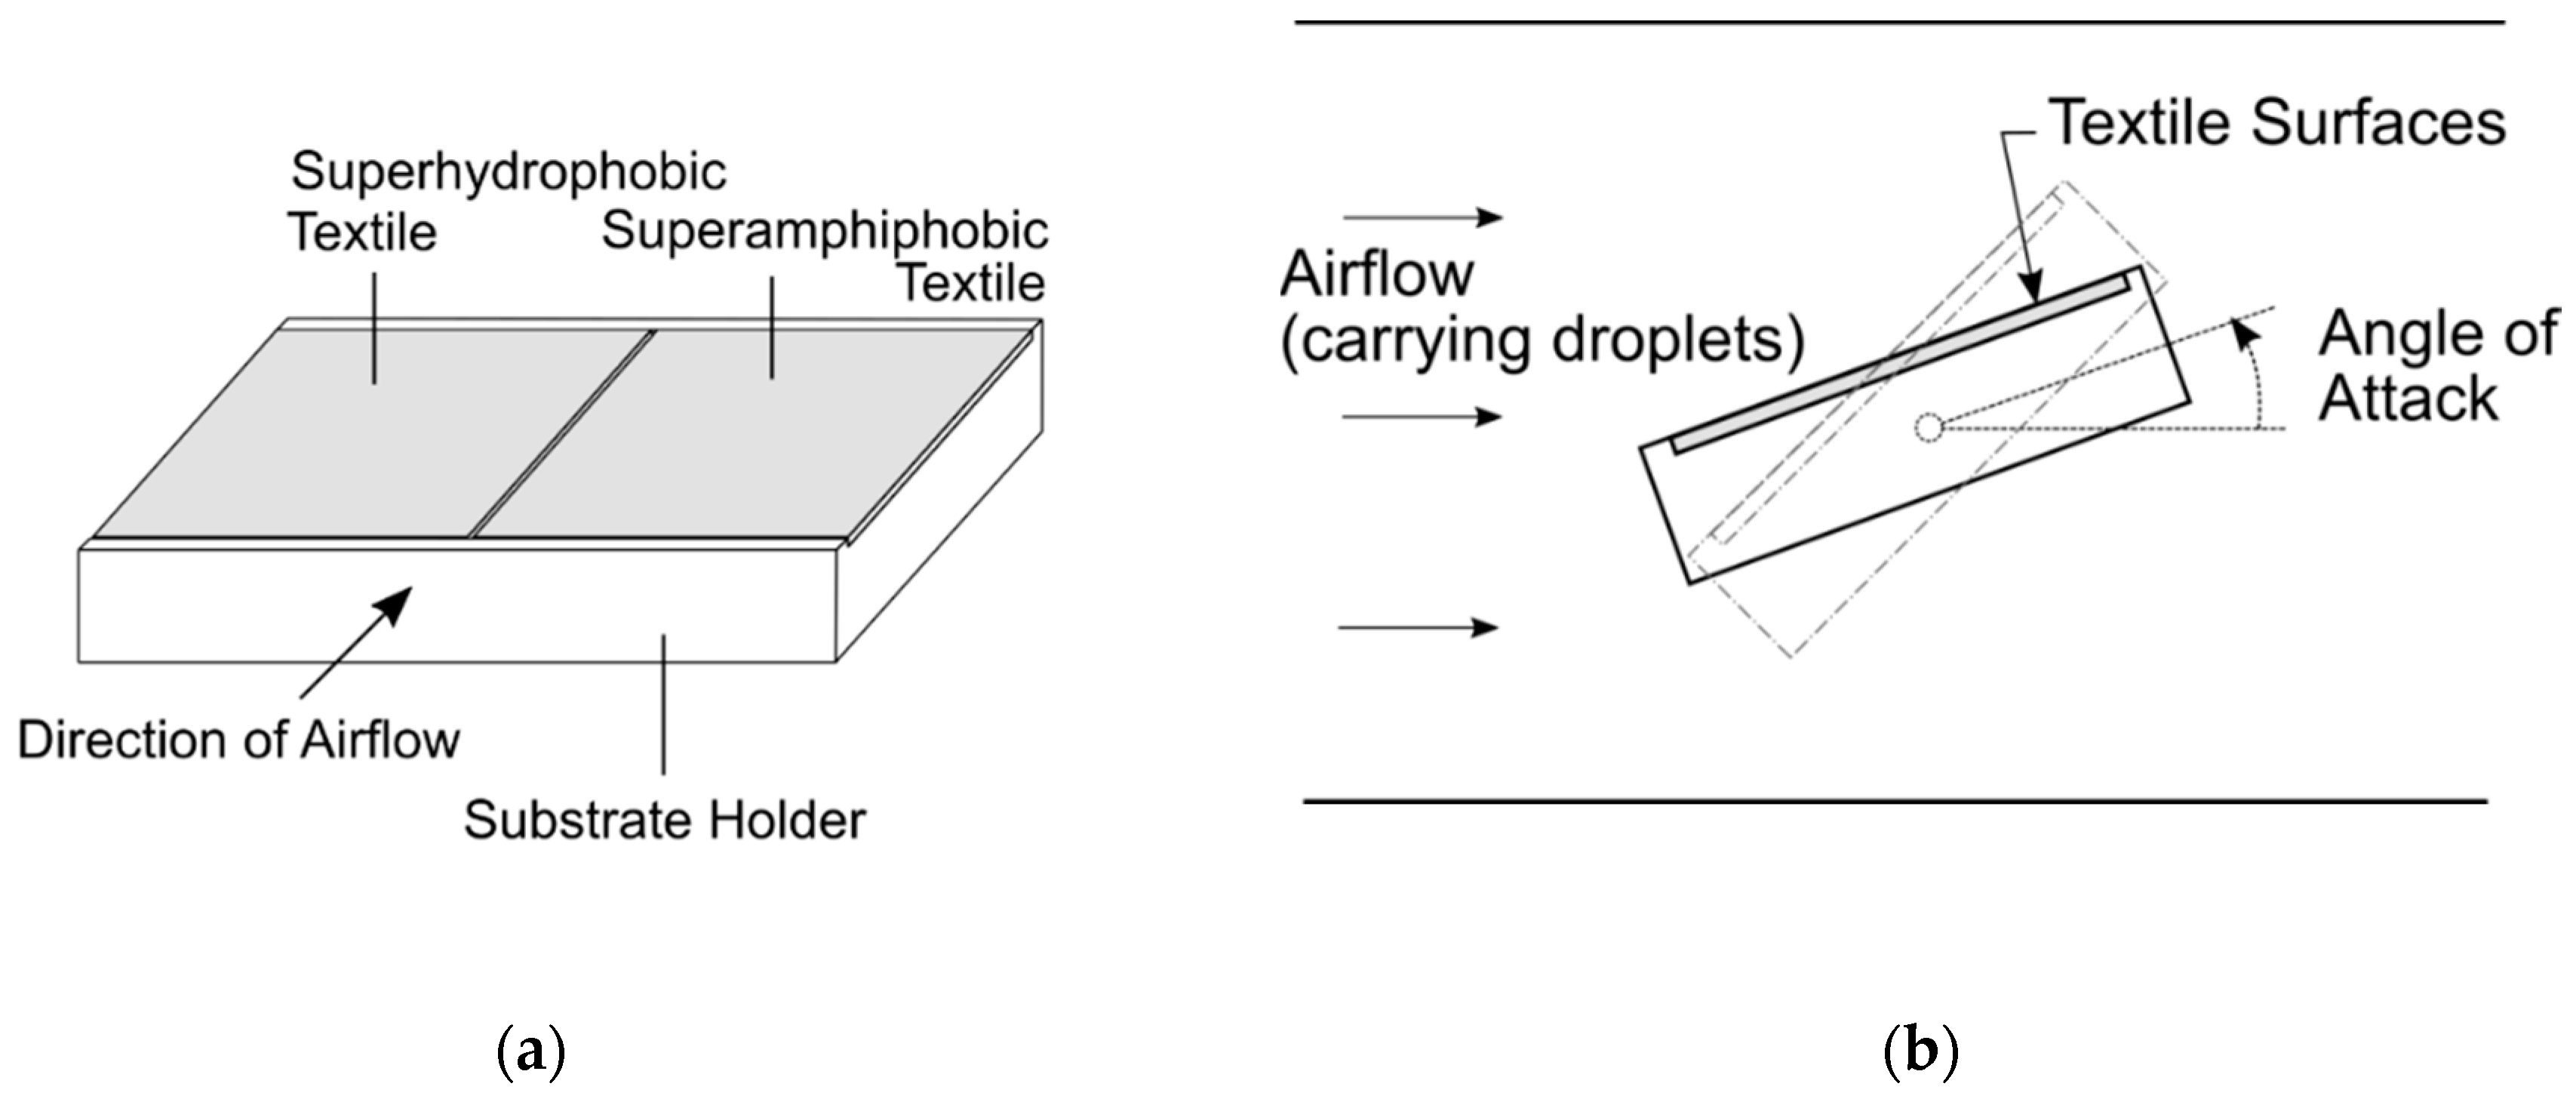
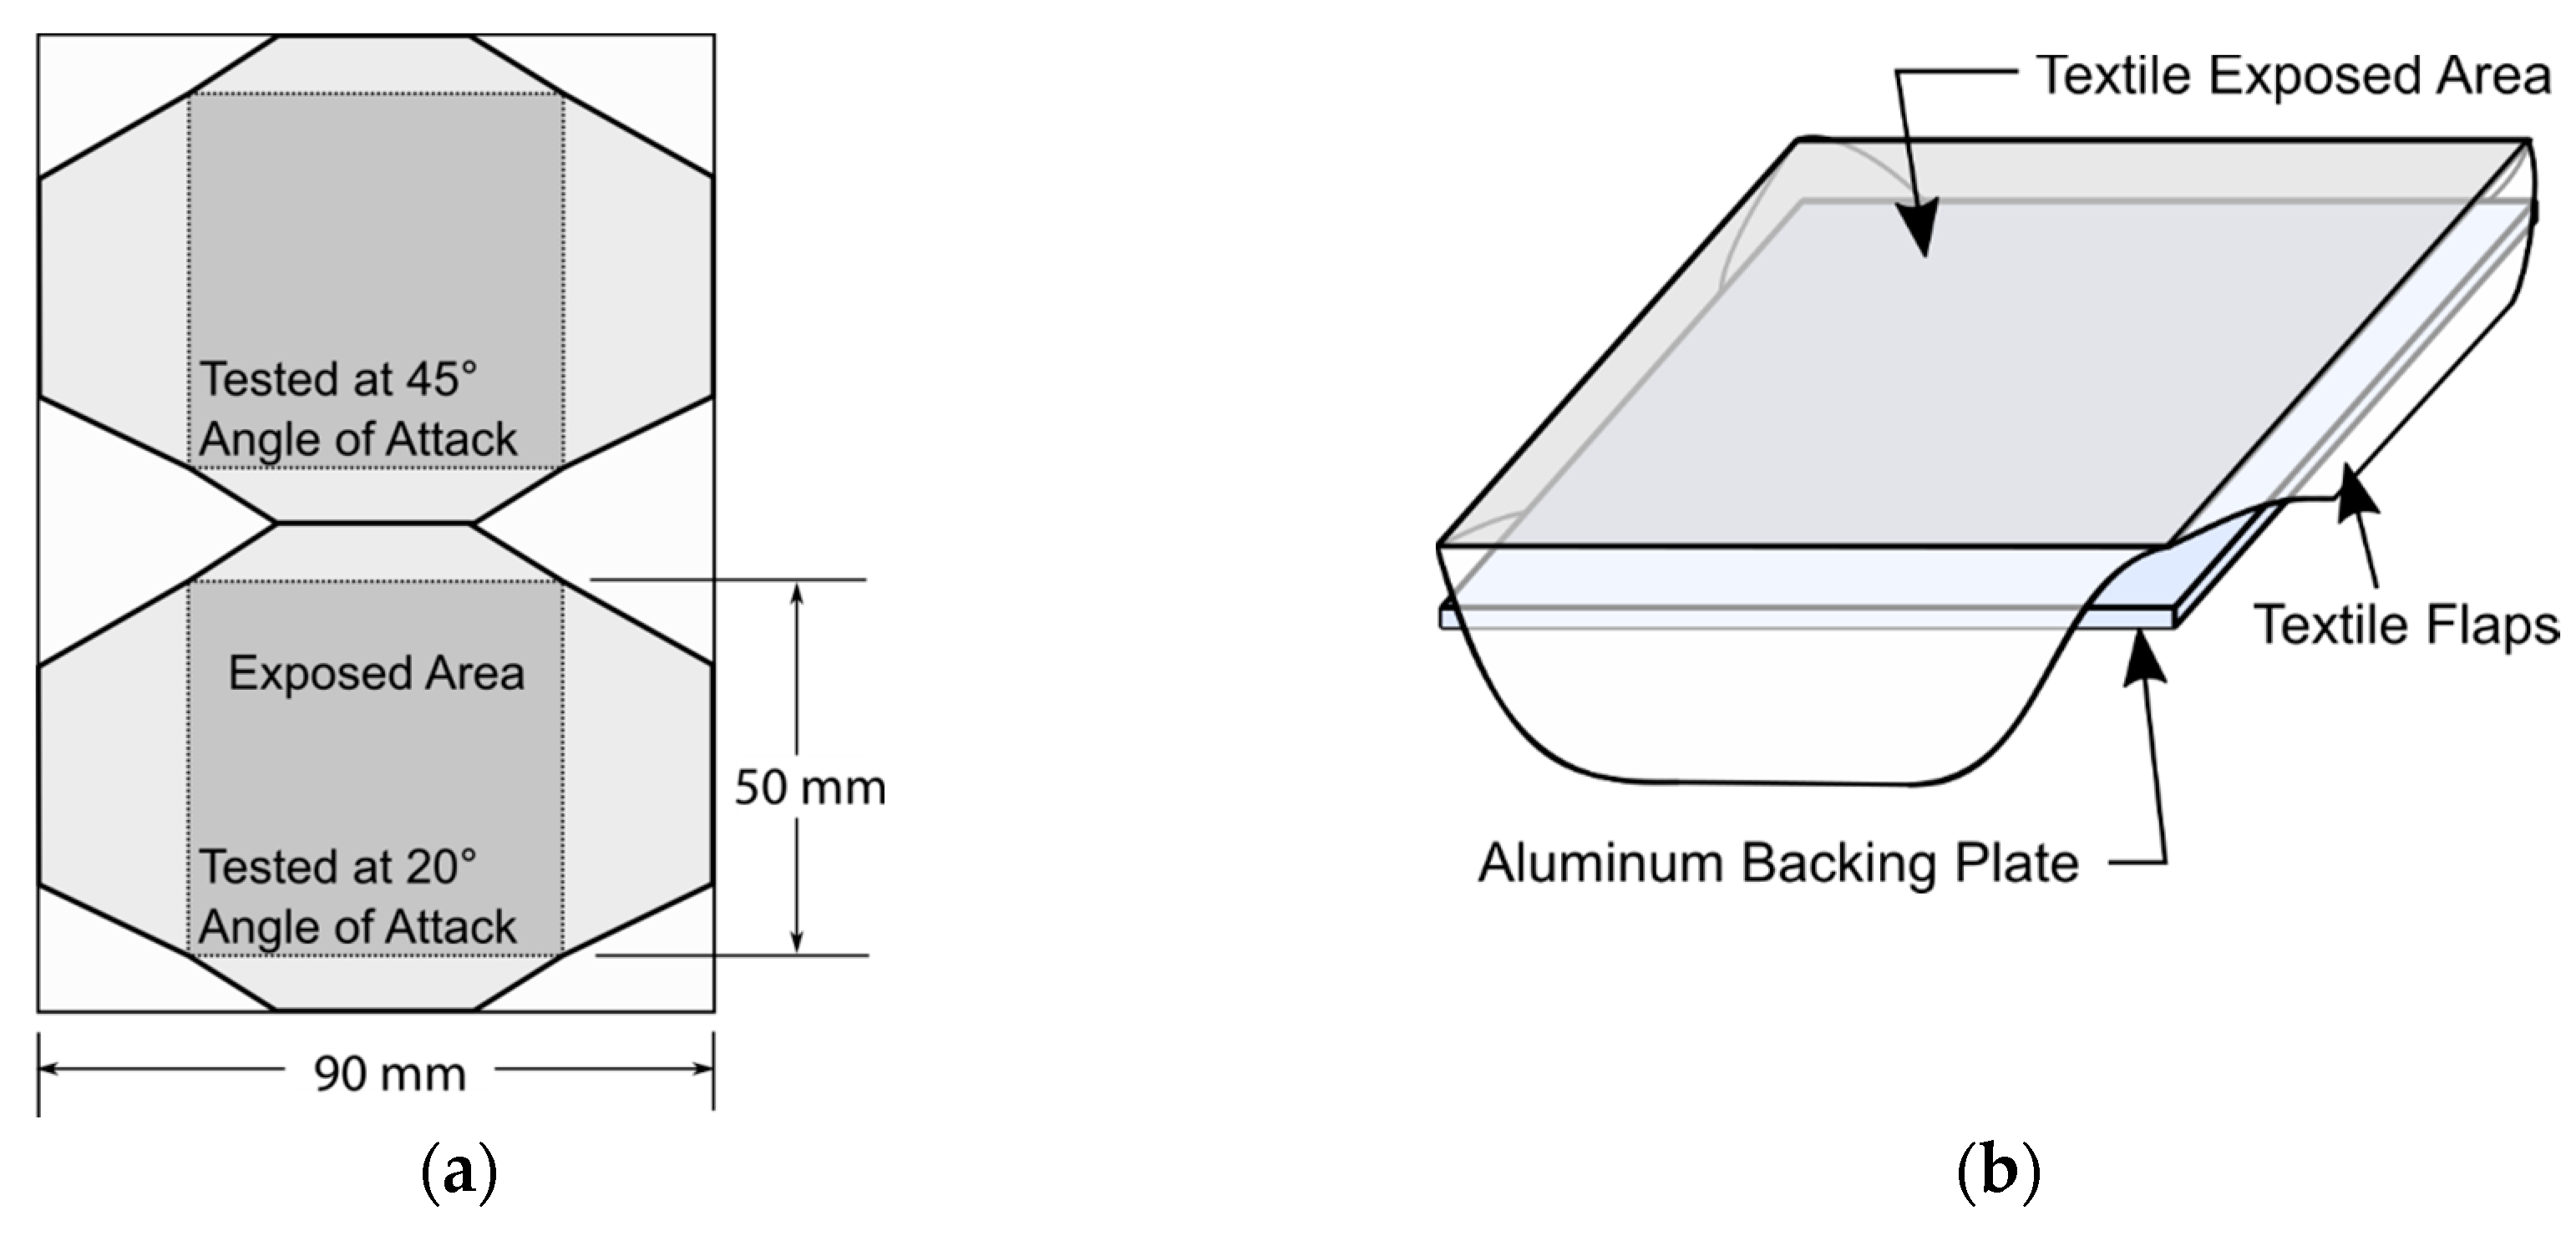
Polyester fabrics were coated as square sheets with a side length of 100 mm. To fit the flat plate substrate holder, the corners of the sheets were cut as shown in Figure A1a. An aluminum plate (50 mm × 50 mm × 2 mm) was used as the core support for the fabric. The effective area of the fabric was placed on one face of the aluminum plates and the side flaps were folded over to the back (Figure A1b), where they were held in place using adhesive tape. One superamphiphobic and one superhydrophobic fabric were tested simultaneously side-by-side in the icing wind tunnel as illustrated in Figure 4. 
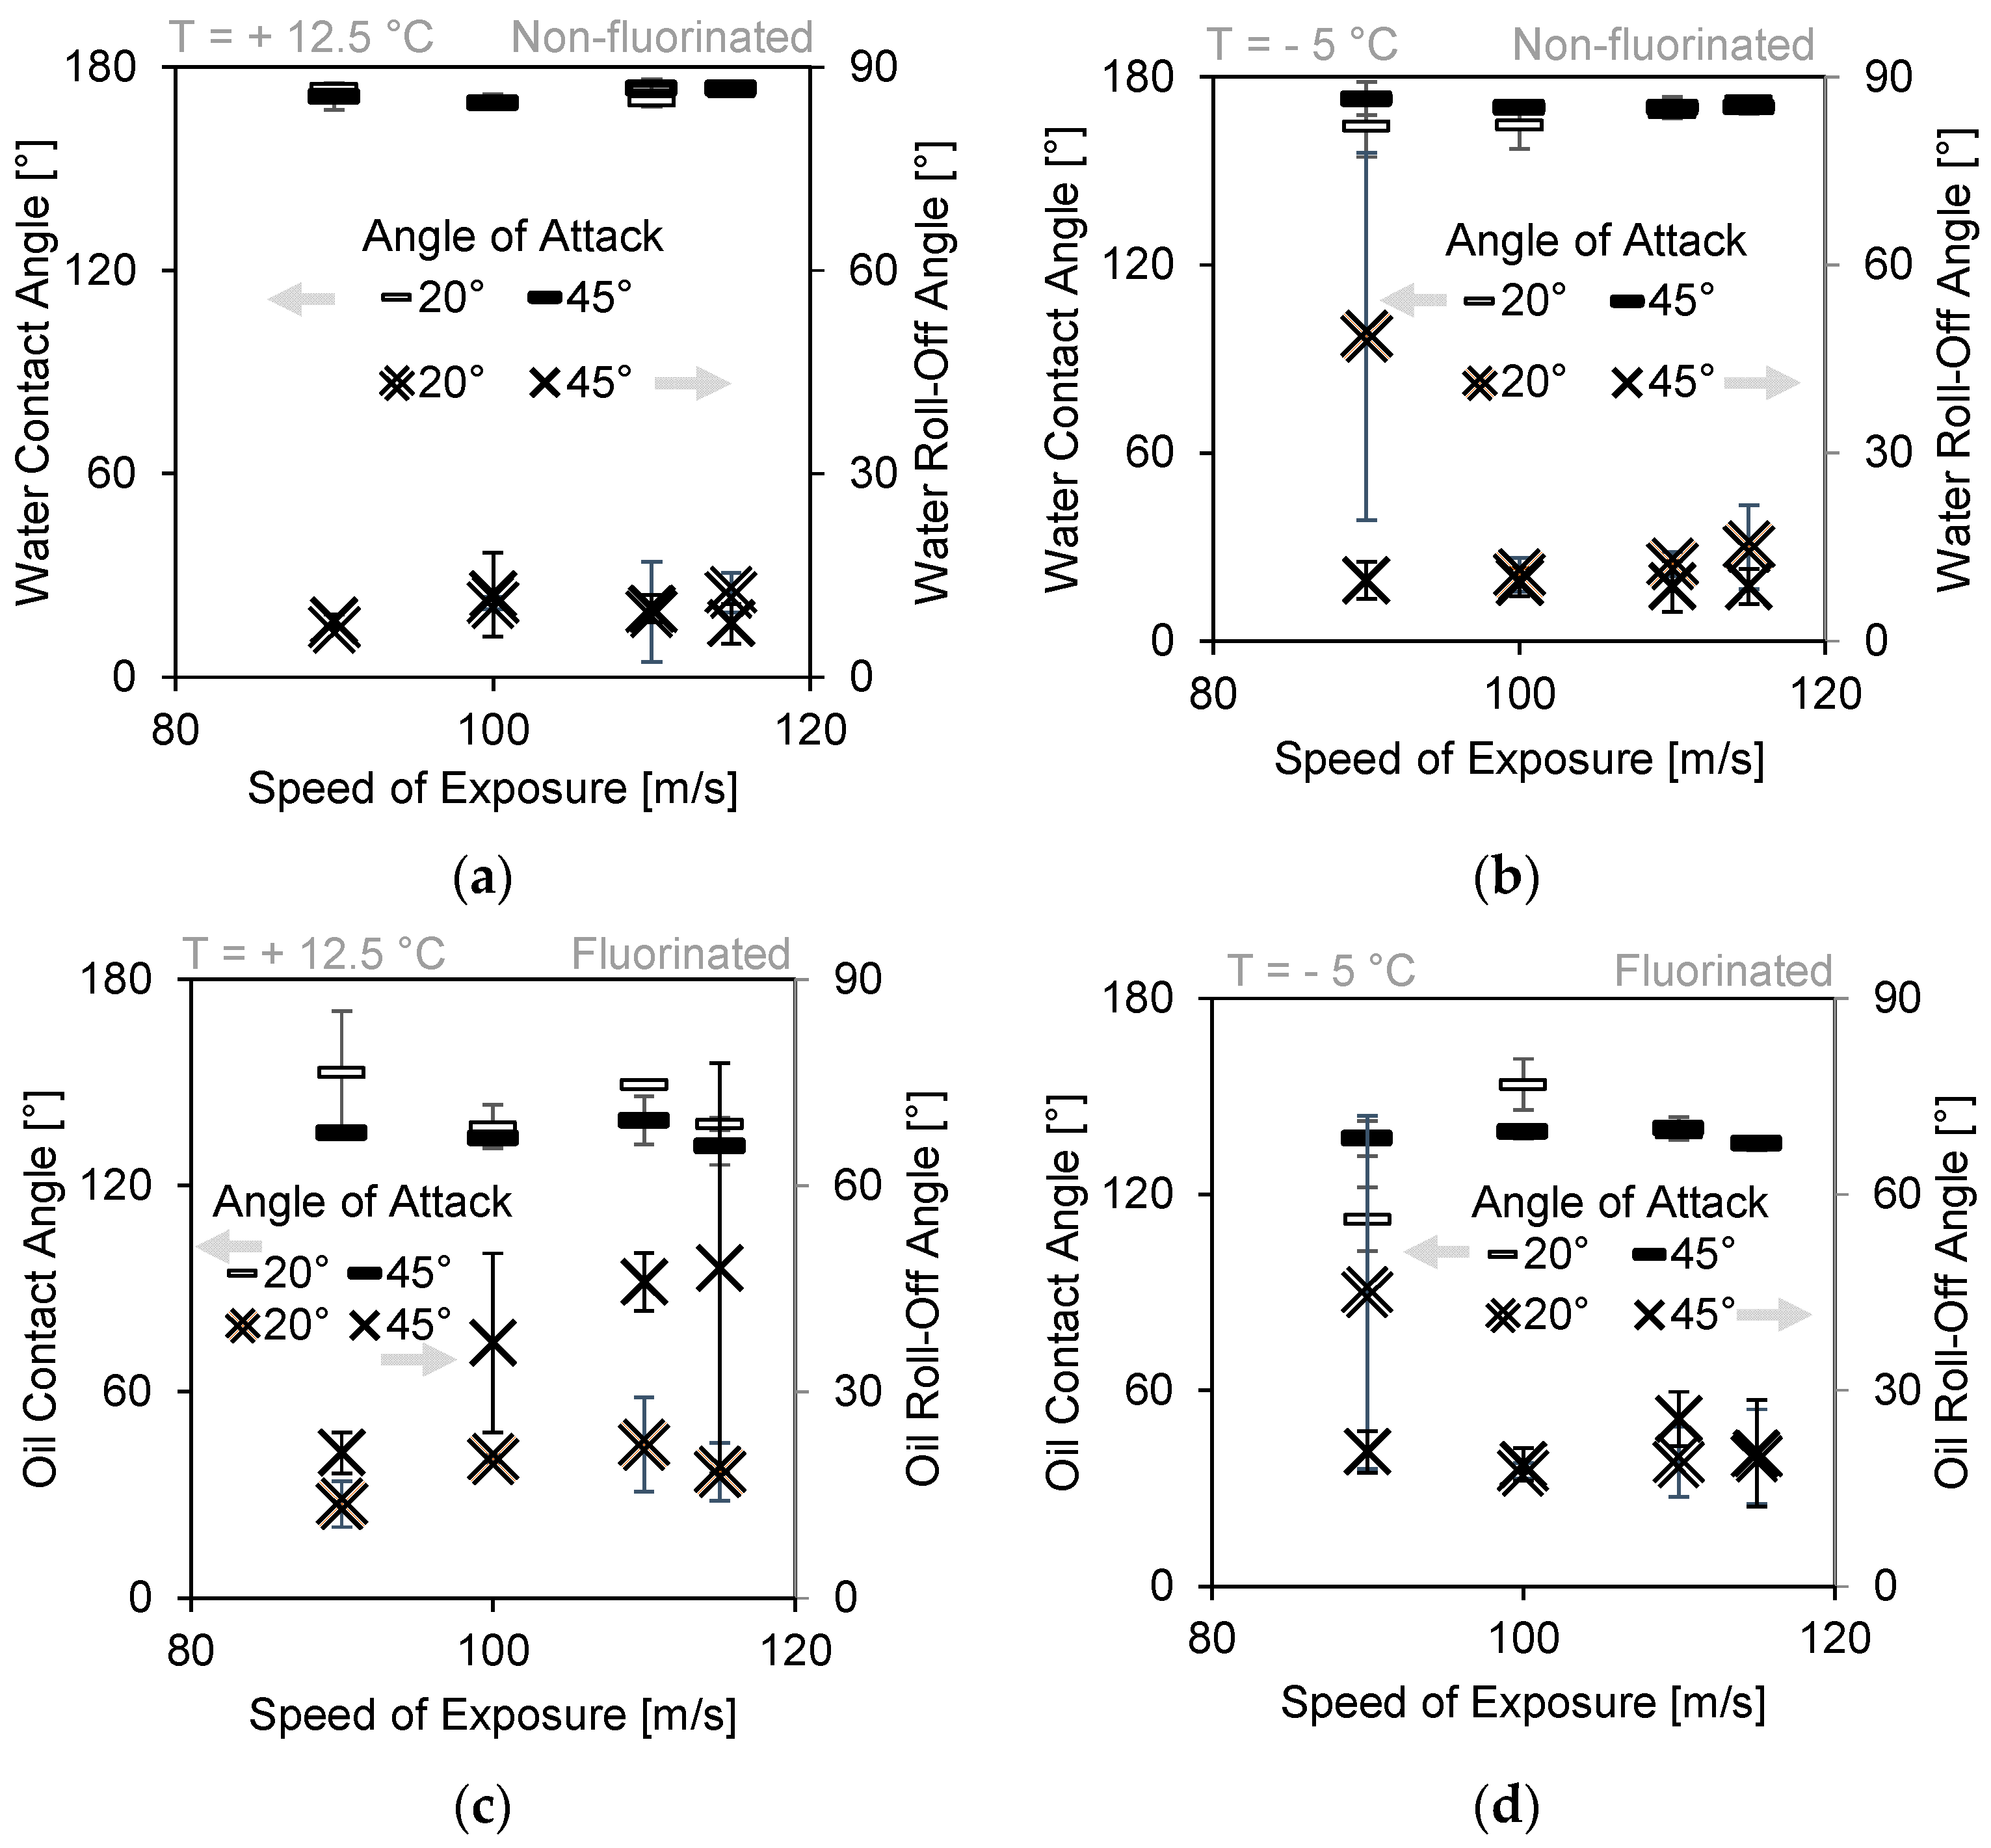
Figure 4b is a side-view diagram of the flat-plate configuration showing direction of airflow and the angle of attack (AoA). A total of 14 superhydrophobic and 14 superamphiphobic fabrics were tested in this configuration, each one exposed to a single combination of airspeed, temperature, and angle of attack.
The environmental conditions that the fabrics were exposed to are listed in Table 1. For the two used configurations, above freezing and below freezing air temperatures were tested. Airspeeds ranged from 20 to 120 m/s for the airfoil, and from 90 to 115 m/s for the flat plate. The airfoil was tested at a single 0°-angle of attack. The airfoil shape was such that the fabric’s effective incident angle with air ranged from 0° at the maximum airfoil thickness (S2 and P2 in Figure 3), to 90° at the stagnation line (LE in 
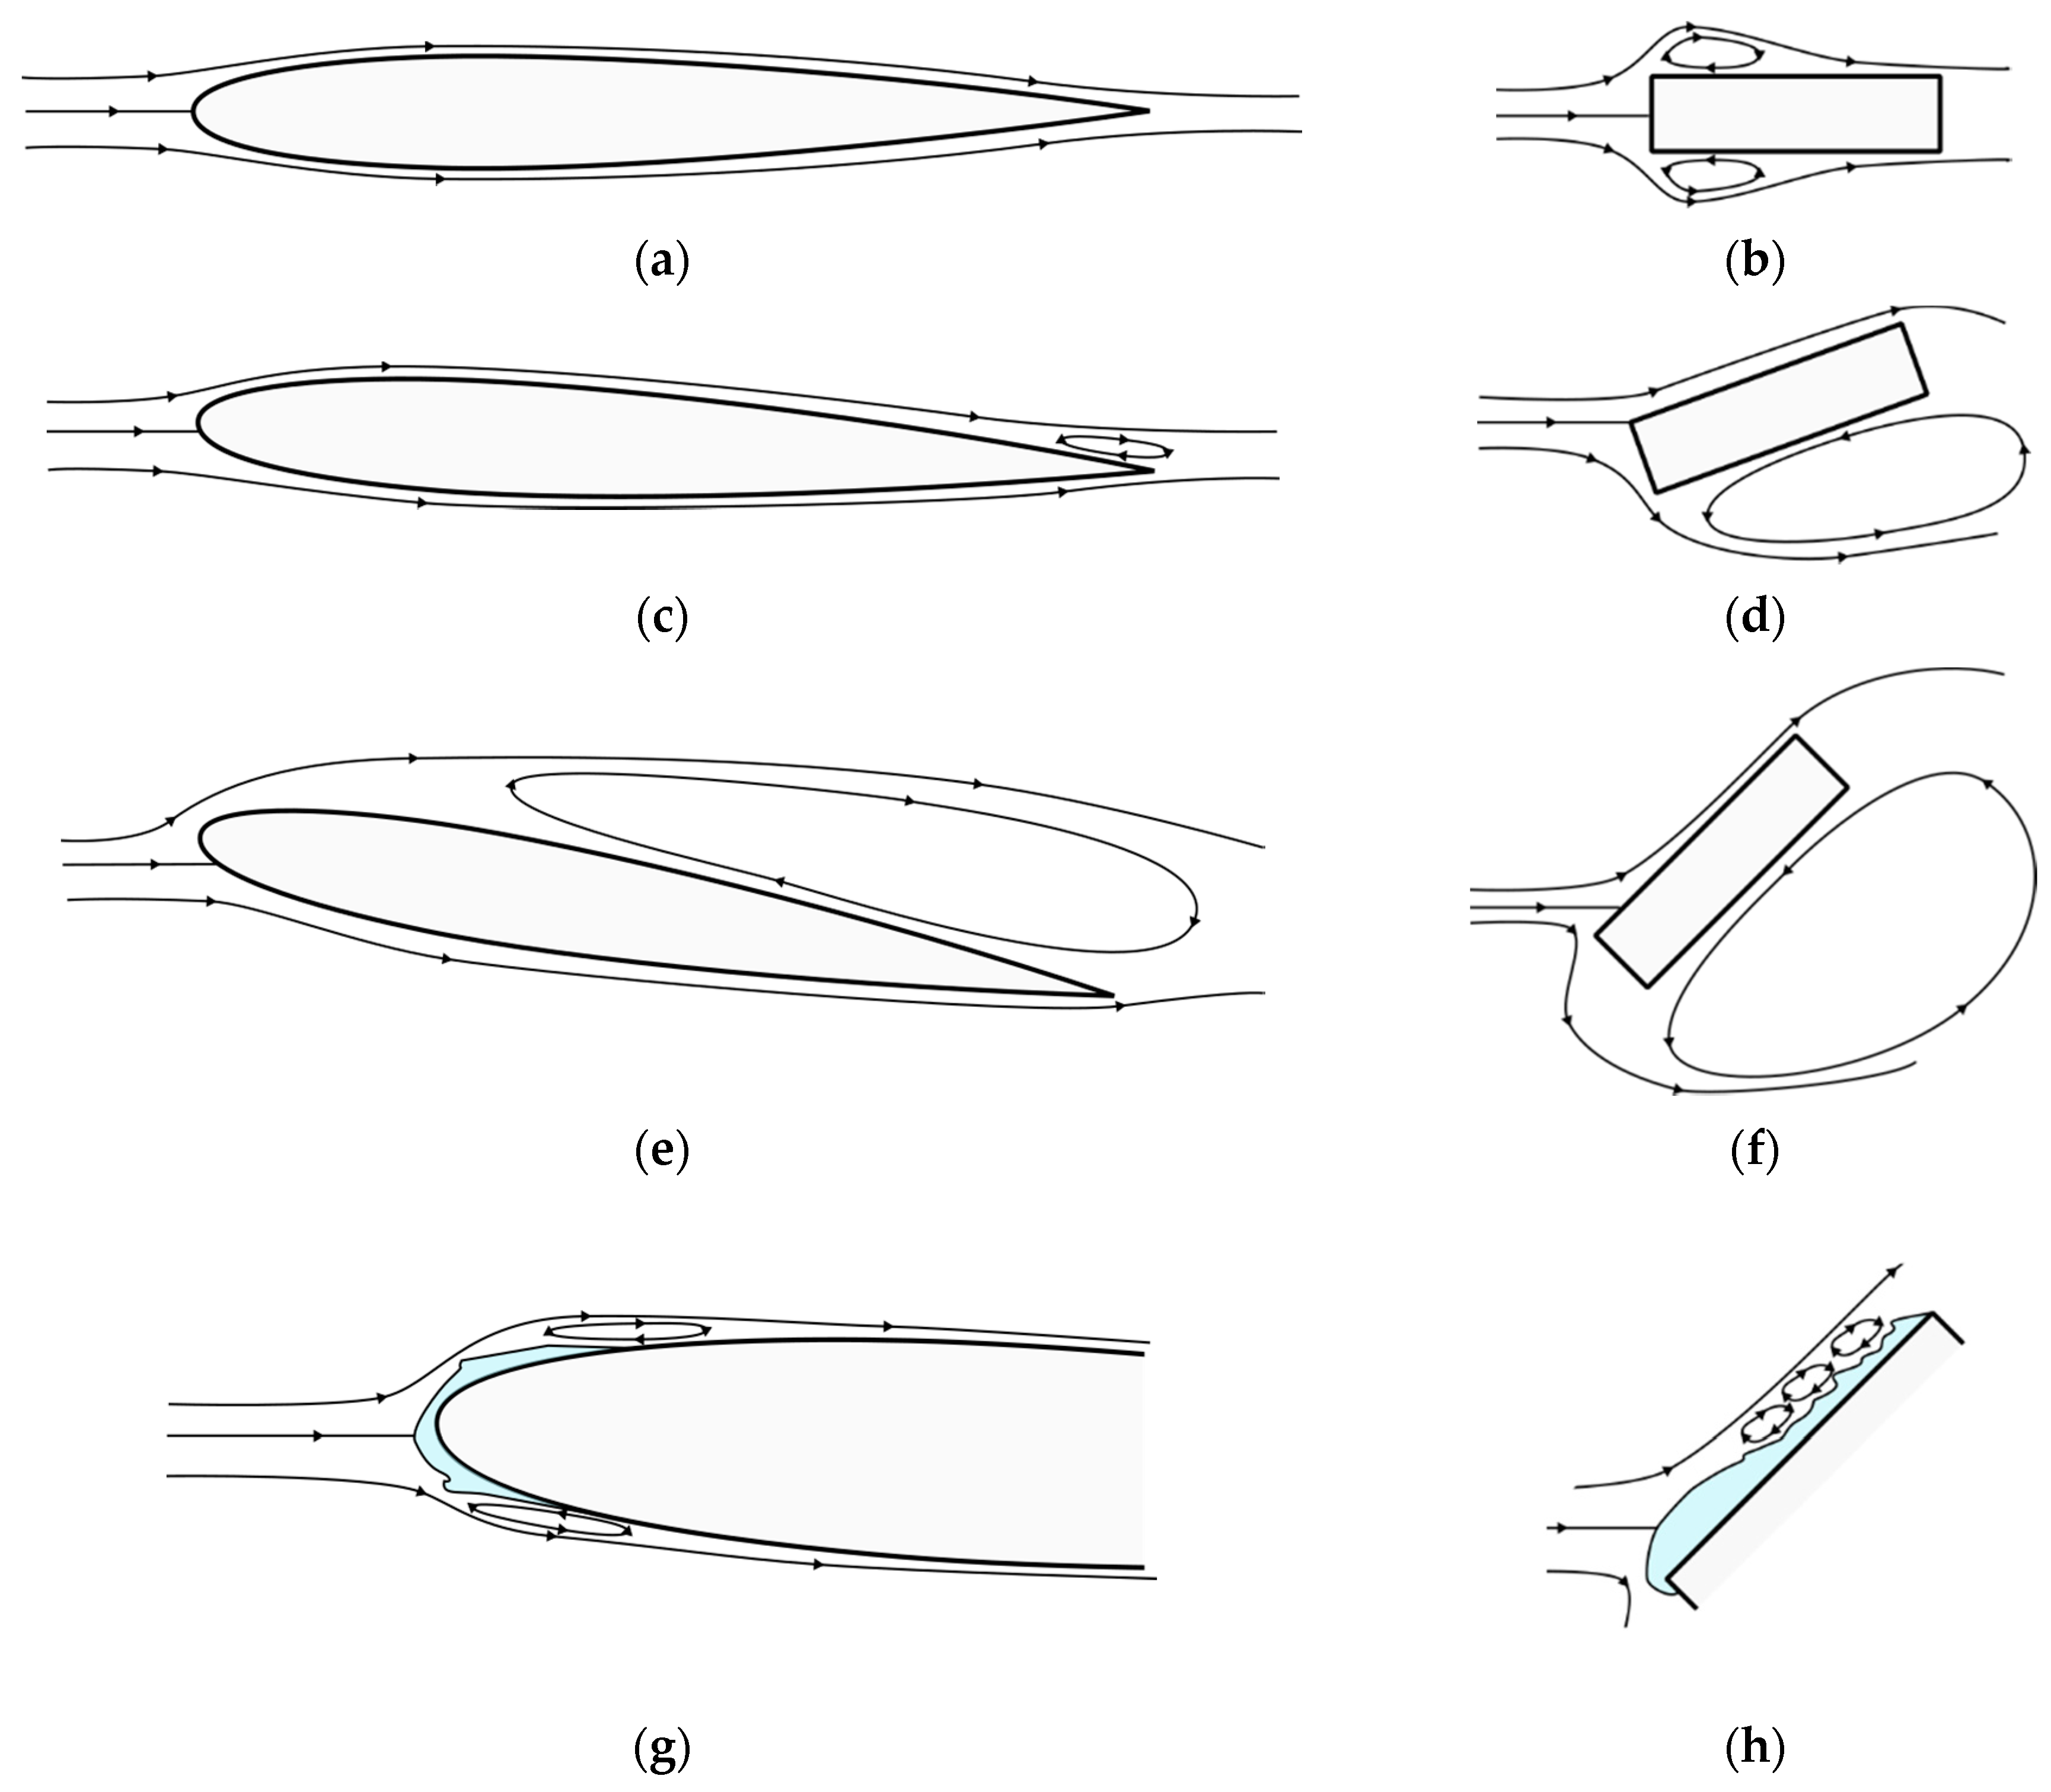
Figure 3). The flat plate was placed in either one of two angles of attack: 20° or 45°. The sample holder was in-fact a rectangular prism rather than a thin plate (leading edge flat face was 15 mm thick) so a minimum angle of attack of 20° was needed to prevent flow separation on the top surface [26] and to ensure interaction of the fabric with impacting water droplets. A 45°-angle of attack provided more direct exposure to the droplets and raised the stagnation line above the bottom edge of the fabric. The total duration of exposure was kept constant at 10 consecutive minutes for the flat plate configuration to allow for a higher number of test conditions, whereas on the airfoil configuration, cumulative exposure time ranged until 50 min. Instead of using fixed liquid water content (conventional metric for the concentration of water droplets in a cloud), a fixed water volume flow rate of 10 cm3/min was introduced into the air through the air atomizing nozzles. The difference in droplet impact rate between a constant liquid water content and constant feed rate is subtle for the range of conditions tested (liquid water content was between 0.25 and 0.36 g/m3). The leading edge portion of the airfoil was subjected to an impact rate of 4 and 10 droplet impacts/s for airspeeds of 50 and 120 m/s respectively. For an exposure of 10 min that accumulated to 2500 and 6200 impacts, respectively. For the total of 50 min of exposure at progressively increasing airspeeds, the number of droplet impacts over the leading edge of the airfoil is estimated at 18,000.

2.3. Characterization

A Krüss DSA 30 (Hamburg, Germany) contact angle measuring device with an automatic tilting axis was used for the measurements of the equilibrium contact angle and roll-off-angle. Milli-Q water droplets were 6 µL in volume and oil droplets (sunflower oil, THOMY, Frankfurt, Germany) were 10 µL. The stage was tilted at a rate of 1.5°/s and recorded at 1 frame per second, resulting in a minimum measurement uncertainty of 1.5°. The Young Laplace fitting method in the Krüss ADVANCE software was used to calculate the water contact angle, and the ellipse fitting was used for that of oil. The accuracy of the measurement was decreased by the optical nature of the fabrics, which made it difficult to measure the three-phase contact line for angles above 160°. Visible bumps and a lack of reflectivity made it difficult to accurately define a baseline. On superhydrophobic and superamphiphobic surfaces the advancing contact angle is expected to be close to 180° [27]. The water contact angle of pristinely coated fabrics has been measured previously using confocal microscopy [15].
Following icing wind tunnel and wetting properties tests, a circular punch was used to cut 5 mm-diameter circular samples near the center of each fabric for SEM measurements.

3. Results and Discussion

Wetting properties were the main evaluation criteria for the durability of the superamphiphobic and superhydrophobic fabrics exposed to high aerodynamic shear and multiphase flow. The water contact angle and water roll-off angle are presented for both the airfoil configuration and for the hydrophobic fabrics in the flat plate configuration. The oil contact angle and roll-off angle are presented for the superamphiphobic fabrics in the flat plate configuration. Error bars represent one standard deviation in the population of measurements taken for each point. The values shown are an average of at least three measurements at different positions. Roll-off angle values plotted as 90° represent the case of complete pinning where gravitational force was insufficient to overcome adhesion of the liquid droplet to the fabric surface. As a general note, the fabrics themselves were not noticeably damaged after exposure to high aerodynamic shear, or icing conditions. That observation was confirmed by SEM images featured in this section.

3.1. Airfoil Configuration

The wetting properties of superamphiphobic fabrics measured following exposure to a warm cloud of droplets at airspeeds up to 120 m/s on a NACA 0012 profile are plotted in Figure 5a. The water contact angle remained constant within an experimental accuracy range of 20–100 m/s. At the highest airspeed, 120 m/s, the contact angle on the suction side and leading edge decreased sharply to 130° whereas the pressure side continued on the flat trend to 160°. Within experimental accuracy, the water roll-off angle was almost constant until 100 m/s, after which complete pinning (represented by 90°) was observed. The roll-off angle slightly increased near 100 m/s. The sudden decrease in contact angle and increase in roll-of angle indicate damage to the coating on the fabric, mainly on the suction side and the stagnation line of the airfoil. Further evidence of this damage is given by the SEM image of Figure 5c. The coating was finally damaged after exposure to 120 m/s but for a cumulative duration of 50 min, since a single piece of fabric was used for testing the progressive airspeed exposure.
The angle of attack of the airfoil was meant to be at 0° (Figure A2a), however, contact angle measurements presented in Figure 5a suggest that tests were done at a non-zero angle of attack. The pressure-side boundary layer and suction-side boundary layer create different wall friction stresses. Direct numerical flow simulations (DNSs) of a NACA 0012 profile at an angle of attack of 5° and Reynolds number, Re = 5 × 10⁴, showed that the coefficient of pressure along the airfoil suction side is higher in magnitude near the leading edge than that on the pressure side [28] (Reynolds number (Re) is the ratio between inertial forces and viscous forces of a fluid in motion). Wall friction shear forces are dependent on the flow velocity, and since the flow was faster over the suction side, the wall shear stresses were higher. The more intense of the stresses was evidently on the suction side, where flow separation is likely to occur (Figure A2c,e). We expect that the pressure difference between the bottom and the top of the airfoil was due to a small angle of attack tolerance during installation of the profile in the test section, and due to manufacturing tolerances, which led to a slightly shorter bottom side. These small geometric deviations were amplified by the high Reynolds number at 120 m/s (Re = 1.6 × 10⁶), which forced the airfoil to pitch upwards slightly. The only resistance to this pitching was contact friction with the test section walls, governed by the hand-tightness of the screws used to fasten the airfoil along a single axis. A small angle of attack at such high Reynolds numbers can lead to wall shear stress differences over the top and bottom surfaces (8 Pa difference, calculations shown in Appendix B), and flow instabilities [24], especially in a straight, fixed-size test section. According to [28], the skin friction coefficient along the airfoil peaks near the leading edge and decreases rapidly toward the trailing edge.
To isolate the duration of exposure from airspeed, separate tests were done at a constant speed but increasing exposure time (Figure 5b). An airspeed of 95 m/s was used since it was suspected that the same damage seen at 120 m/s could be done at a slightly lower speed, but with longer exposure time. Contact angle measurements exceeded 160° (165° ± 3°) for the full 50 min showing no measurable change with increasing exposure time. Roll-off angle measurements slightly increased after the first 10 min of exposure, and then remained constant at 22° ± 5°. This indicates that the full damage occurred within the first 10 min of testing, and did not increase with increasing exposure time. This result suggests that SNF were removed or broken when wall shear stresses (roughly 6 kPa for an airflow at 120 m/s) exceeded their tensile strength. The absence of time-dependent damage suggests that they did not show signs of creep for the durations tested. Cloud exposures were in 10-min intervals, and the SNF had time to resettle between exposure sessions. The main knowledge gained here is that maximum damage at a certain airspeed occurred within the first 10 min of exposure and that the coating was removed only beyond a critical shear stress threshold—independently of exposure time.
The state of the superamphiphobic coating following exposure to harsh aerodynamic conditions while on a NACA 0012 profile is shown by SEM images in Figure 5c. The fabric whose wetting properties measurement showed full pinning in Figure 5a is shown in Figure 5c. The image shows two smooth PET fiber surfaces with well-defined boundaries. An image of a fiber on the fabric tested in icing conditions was captured in Figure 5c. It appears to have a porous surface with filamentous features sizing an order of magnitude less than the scale bar of 1 µm. The SEM image of the fabric after exposure to 120 m/s in Figure 5c is validation that the coating was removed from the top and side faces of the polyester fibers, creating pinning sites during contact angle and roll-off angle measurements.
Wetting properties of a superamphiphobic fabric on an airfoil exposed to icing conditions at −3 °C and an airspeed of 50 m/s are plotted in Figure 5d. The water contact angle exceeded 160° for the full 40 min of exposure. The water roll-off angle of the pressure and suction side increased steadily to 40° after 20 min of exposure after which it remained constant, whereas the leading edge roll-off angle increased steadily to 15° after which it remained constant. Therefore, ice accretion caused damage to areas subjected to aerodynamic shear, but not on the stagnation line. The ice grains that formed on the stagnation line were densely packed, forming a solid block of ice that protected a small area of the fabric from airflow and direct impact of droplets (pathline illustration in Figure A2g and experiment image in Figure A3). and A few millimeters downstream along the chord-length, ice grains were more dispersed. Boundary layer air could flow between ice grains, pulling them away from their anchor-point on the fabric. This pulling was most probably the main wear mechanism causing damage to the SNF coating (explained in greater detail below). Since the angle of attack of the airfoil was null, the wear on the suction and pressure side were observably equal in icing. For the icing conditions tested, the peak skin friction stress would be on the order of 10 Pa and located at 0.027 mm from the leading edge (example calculation in Appendix B, and based on data from [29]).

3.2. Flat Plate Configuration

Given that the wetting properties measurement showed droplets were completely pinned to the fabric exposed to 120 m/s airflow on an airfoil, but not at 95 m/s, we wanted to study the transition between these speeds. The flat plate fabrics were therefore exposed to airspeeds between 90 and 115 m/s. The durability of the fabrics tested on a flat-plate are presented with respect to the airspeed of exposure. They were divided primarily by treatment (non-fluorinated or fluorinated), secondarily by temperature of exposure (+12.5 °C for warm cloud or −5 °C for icing), and tertiary in each chart by the angle of attack (20° or 45°).

3.2.1. Superhydrophobic Fabrics

The water wetting properties of superhydrophobic fabrics exposed to a water droplet cloud at airspeeds of 90–115 m/s, at freezing and non-freezing temperatures, and on a flat plate at two constant angles of attack are plotted in Figure 6a,b. Figure 6a represents fabrics tested in a warm cloud at 12.5 °C. Warm droplets had a negligible effect on the fabric’s wetting properties. The water contact angle in Figure 6a exceeded 160° for both angles of attack across all speeds presented. The same holds for the roll-off angle, although the standard deviation increased with increasing airspeed. Their water contact angle above 150° and water roll-off-angle below 15° means the coated fabric retained its superhydrophobic properties. Figure 6b represents fabrics tested in a supercooled droplet cloud at −5 °C. The contact angle in Figure 6b shows stagnant behavior for the 45° angle of attack, but that of the 20° angle of attack increased with increasing airspeed after 100 m/s. The roll-off angle was constant for the 45° angle of attack, but was steadily decreasing for the 20° angle of attack, along with the standard deviation.
The maximum speed tested in the flat plate configuration did not fully remove the top part of the coating as in the airfoil configuration. Figure 5a shows that the suction side portion of the fabric saw a greater reduction in the water contact angle than the pressure side did. The stall behavior of a rectangular block is the opposite of an airfoil. An airfoil approaches stall (flow separation) as the AoA increases, whereas the rectangular block sees flow separation starting from 0° (Figure A2b) and transitions to a fully connected boundary layer between 10° and 20° (Figure A2d,f) [26]. In the flat plate test, the fabric was placed on the pressure side. Since flow separation on an inclined rectangular block (occurrs at angles of attack lower than 10°, the suction side would not be exposed to high flow velocities or droplet impacts. To ensure that the fabrics would be exposed to high speed airflow and droplet impacts, it was placed only on the pressure side. Superhydrophobic fabrics saw the most damage at lower speeds and shallower angles of attack while in icing conditions. Figure 6b revealed that increasing airspeed in icing conditions did not proportionately affect the wetting properties of the superhydrophobic fabrics.

3.2.2. Superamphiphobic Fabrics

The oil wetting properties of superamphiphobic fabrics exposed to a water droplet cloud at airspeeds of 90–115 m/s, at freezing and non-freezing temperatures, and on a flat plate at two constant angles of attack are plotted in Figure 6c,d. Figure 6c represents fabrics tested in a warm cloud at 12.5 °C. It shows that the oil contact angle remained between 140° and 160° and an oil roll-off angle below 50°. The higher wear at an angle of attack of 45° can be rationalized by a higher direct exposure to droplets and air than at 20°. It was expected that the superhydrophobic fabrics would show the same trend, however that was not the case. Oil has a lower surface tension than water and the differences between the two wettabilities could lie in the sensitivity of the testing liquid to different degrees of damage. In general, the optical nature of the fabric (macroscopically visible roughness and lack of reflectivity), made it difficult to obtain an accurate mathematical fit with the oil droplets, resulting in a higher standard deviation than on the superhydrophobic fabrics.
Figure 6d represents fabrics tested in a supercooled droplet cloud at −5 °C. The oil contact angle was constant at 140° for both angles of attack across all speeds presented. Similar to superhydrophobic fabrics, the superamphiphobic fabrics only showed pinning after exposure to the lowest airspeed and angle of attack, and not at higher airspeeds or angle of attack. At the shallow angle of 20°, most supercooled droplets impacted the leading edge of the substrate holder rather than the fabric. That means that ice grew faster on the leading edge of the sample holder than on the fabric.
An ice accretion at the corner of the sample holder has a two-fold effect: protection of the upper surface of the sample holder (and therefore the fabric) from impacting supercooled water droplets, and separation of the aerodynamic boundary layer from the top surface of the sample holder. The contribution to wear of the fabric from the first effect is fairly straightforward. At an angle of attack of 45°, impacting supercooled droplets quickly formed a relatively flat ice layer covering the entire surface of the fabric (illustrated in Figure A2h). The dense ice layer protected the fabric from further impacts. The result of this type of icing encounter was negligible on the wetting properties of the fabrics. At an angle of attack of 20°, the duration of direct droplet impact was shortened by the sample holder-born ice accretion.
The micro- and nanostructure of the superamphiphobic fabrics tested at an angle of attack of 20° in icing conditions are shown by SEM images in Figure 7. Four rows of images corresponded to the four airspeeds tested in that configuration. The three columns were arranged in order of increasing magnification. The inset in each row shows the respective oil droplet at the highest tilt angle before shedding during roll-off angle measurements. The 90 m/s images show a PET fiber with filamentous nanostructures on its side, which decreased in size and length leading to a smooth area on the top of the fiber. The smooth area did not cover the entire length of the fiber. The inset for that speed shows an oil droplet with high contact angle hysteresis. The higher speeds show a similar gradient in length but they did not reduce to a completely smooth surface, only to a slightly less structured one. The insets for these speeds show oil droplets with low contact angle hysteresis.
In dry airflow, at a 20°-angle of attack, the upper surface of a rectangular block is near to flow separation [26]. With ice forming on the leading corner, it is fairly certain that the flow was separated over at least a portion of the fabric. Separated flow can reattach to the wall after a certain chord-length. The more ice accreted, the further the reattachment point would be (see Figure 8). The fabrics in icing conditions at 20°-angle of attack and in 90 m/s airflow were subjected to one continuous icing cycle for 10 min, and were therefore subjected to the most intense back-flow for the longest time. For fabrics in the same conditions at 100 and 110 m/s, the ice accretion was removed after 3 min of icing, and they went through 3 icing cycles. For 115 m/s, the ice accretion was removed after 5 min of icing and 2 cycles were completed. The short cycle duration, despite higher speeds, meant that the effect of flow separation was smaller than at 90 m/s, and resulted in less severe damage to the SNF.
The mechanism of SNF damage is debatable, but the authors believe it is due to two major contributors, as illustrated in Figure 9. The first is that the aerodynamic wall shear stress caused a detachment of isolated feathery ice grains by cantilever loading, which pulled on SNF (Figure 9a). The second was the impact of these detached ice grains on the fabric surface caused by aerodynamic backflow (Figure 9b).
Isolated feathery ice grains generally grew along the airflow freestream velocity directions. The average momentum of supercooled droplets is usually enough to penetrate the aerodynamic boundary layer [30]. A laminar aerodynamic boundary layer flows parallel to a wall, and the direction of a turbulent boundary layer, which is likely the case here, flows more chaotically but on average also in a direction parallel to the wall. Thus, the boundary layer airflow causes a drag force in the order of 25–150 µN, on isolated feathery ice grains with a component that is perpendicular to their direction of growth; assuming a small cylindrical feature at a small angle from parallel to the airflow (details of calculations included in Appendix B). With this force system in mind, the ice grains could be sheared or bent off the surface of the fabrics as observed during the experiments. The drag forces calculated would result in a pulling stress at the base of the ice grain between 3 and 18 kPa.
The separation of isolated feathery ice grains from the fabric could have caused more harm than good. The advantageous part is that an icephobic surface typically has low adhesion strength to ice, and if ice grains fly off, then large ice accretions are less likely to grow. The disadvantage is that the ice grains cause damage downstream, or remain suspended in recirculated flow. Ice grains act as solid particles and could cause erosive damage to exposed portions of SNF on superficial polyester fibers when they were recirculated in the separated backflow above the fabric.
SNF were clearly shortened after durability tests (Figure 7). However, a base layer of the coating remained on the fibers of the fabric. This base layer of silicone provided a hydrophobic surface chemistry on top of the microstructure given by the polyester fiber weave. The surface chemistry and microstructure were not changed by the cloud and ice exposure, resulting in only very subtle changes in contact angle measurements. The evidence suggests that low roll-off angles were mainly attributable to the nanoscopic form factor and aspect ratio of the network of long SNF.

4. Summary and Conclusions

The superamphiphobic fabrics maintained their favorable wetting properties after exposure to a range of aerodynamic multiphase flow conditions, including those conducive to atmospheric icing of aircraft. When they were slightly damaged, they retained a high contact angle and much of the changed, but their chemistry and microstructure remained intact. Exposure to an airflow up to 115 m/s, to clouds of water droplets, and to icing conditions in a laboratory icing wind tunnel appeared to damage the fabrics similarly to an extended exposure on a car side-view mirror, but not significantly more [18]. When exposed to external environments like on a car, the conditions are much less controlled than in a laboratory test: mechanical degradation can occur from different types of impacting particles (rocks, sand, hail, and insects) and chemical degradation of of organic fluorine groups can occur after prolonged exposure to UV radiation. The results of this study show that exposure to small water droplets, even supercooled ones, at speeds up to 430 km/h, only slightly degraded the performance of a superamphiphobic fabric on a flat plate.
Complete failure occurred at Reynolds numbers >1.4 × 10⁶ (speed of 120 m/s on a NACA 0012 airfoil) and mostly on the suction side of the airfoil. Thus, the fabrics may not be durable enough for forward facing surfaces of single-engine propeller aircraft that operate at that or at higher speeds. For low speed aircraft such as for urban air mobility, experimental aircraft, agricultural aircraft, drones, or gliders, aerodynamic shear on its own does not appear to be aggressive enough to remove the SNF coating. For cases where icing occurs over long periods of time and at relatively low speeds, such as for telecommunication antennae or oil rigs at sea, the first layer of ice build-up would protect the fabric from damage, meaning the icing conditions there would not cause significant damage to the superamphiphobic coating if the ice is not removed by hand, but allowed to detach when the ambient conditions become more favorable.

Author Contributions

Conceptualization, D.V. and E.B.; methodology, A.S.A., D.V., M.D., J.A.M.G., V.V., L.R., A.L., and E.B.; formal analysis, A.L., J.A.M.G., V.V., and L.R.; investigation, A.L.; resources, D.V. and E.B.; data curation, A.L.; writing—Original draft preparation, A.L.; writing—Review and editing, A.L. and E.B.; visualization, A.L., A.S.A., J.A.M.G., and V.V.; supervision, J.H. and E.B.; project administration, E.B.; funding acquisition, D.V. and E.B. All authors have read and agreed to the published version of the manuscript.

Funding

This research was supported by the European Union’s Horizon 2020 research and innovation program under the Marie Skłodowska-Curie grant agreement No. 722497—LubISS.

Acknowledgments

The authors would like to express gratitude to Christian Herrles for designing the manufacturing process for the NACA 0012 airfoil used in this study.

Conflicts of Interest

The authors declare no conflict of interest. The funders had no role in the design of the study; in the collection, analyses, or interpretation of data; in the writing of the manuscript, or in the decision to publish the results.

Appendix A

Figure A1. Preparation of fabrics for the flat plate configuration. (a) The exposed portion of fabric tested with respect to its original size; (b) Placement of the fabric on a rigid backing plate indicating the folding style of the flaps.
Coatings 10 01058 g0a1
Figure A2. Pathlines over NACA 0012 and flat-plate sample holders at various angles of attack and with an arbitrarily low Reynolds Number. (a) Airfoil at 0° angle of attack (AoA) showing symmetric pathlines without flow separation; (b) Block holder at 0° AoA showing symmetric pathlines with flow separation and reattachment; (c) Airfoil at 3° AoA showing slightly asymmetric pathlines and flow separation at the trailing edge on the suction side; (d) Block holder at 20° AoA showing stagnation at the leading corner, and attached flow along the top side; (e) Airfoil at 10° AoA showing asymmetric pathlines and flow separation along the entire suction side; (f) Block holder at 45° AoA showing an elevated stagnation point and attached flow on the top side; (g) Iced airfoil at 3° AoA showing slightly asymmetric pathlines with small flow separations immediately downstream of the ice; (h) Iced block holder at 45° AoA showing uneven ice with complete coverage of the top side and a series of small flow detachments due to the ice shape; (a, c, e, and g) are based on [31]. (b, d, and f) are reproduced from [26].
Coatings 10 01058 g0a2
Figure A3. Ice formation on the fabric mounted on a NACA 0012 airfoil showing isolated feathery ice grains near the top side (circled) that become more dense and homogenous approaching the stagnation line.
Coatings 10 01058 g0a3

Appendix B. Aerodynamic Definitions, and Calculations

Appendix B.1. Terminology Related to Aerodynamics

Leading Edge: The first point of contact of a fluid in motion with a solid body.
Trailing Edge: The furthest point on a body in a moving fluid from the leading edge.
Chord: The distance between the leading edge and the trailing edge.
Span: The out-of-plane size of an object in a 2-dimensional airflow.
Camber: Asymmetry between the top and bottom surfaces of an airfoil.
NACA 0012: An airfoil shape described by the National Advisory Committee for Aeronautics (NACA, now NASA) with a 4-digit system. The digits, “00” signify a symmetric airfoil, without camber. The digits, “12” signify that the maximum airfoil thickness is 12% of the chord length.
Stagnation Line/Point: In a 2-dimensional airflow, the stagnation point is the location where a streamline theoretically stops. The stagnation line in the out-of-plane extension of the stagnation point, and runs along the span of an object.
Suction/Pressure Side: Air along a symmetric airfoil (without camber), travels the same distance over the top side and the bottom side of the airfoil, and therefore with the same static and dynamic pressure. If the symmetric airfoil is tilted, the position of the stagnation point is no longer exactly at the leading edge of the airfoil. In this orientation, air must travel a longer distance over one side than the other side. To maintain continuity, air on the longer side travels faster than on the shorter side. The result is higher dynamic pressure on the longer side and lower static pressure; hence the term, suction side. The pressure side intuitively is so-called due to the higher static pressure. Note that the pressure difference between two sides of an airfoil generates a force called lift, and it is that which makes flight possible.
Reynolds’ Number: A dimensionless number that represents the ratio of inertial to viscous forces in the motion of a fluid or gas. It is the most common ratio used to describe flow regimes.
Boundary Layer: A common assumption in fluid dynamics is the “no-slip condition” where the velocity of a fluid in motion is null at the interface with a solid body. The flow approaches its freestream velocity with increasing distance from the interface. The distance between the interface and the freestream velocity is the thickness of the boundary layer.
Flow Separation: When a boundary layer flow becomes reversed with respect to the freestream flow direction or when it can no longer remain attached to a body. In aerodynamics, flow separation causes a loss of lift.

Appendix B.2. Difference between Pressure and Suction Side Wall Shear Stress

The local wall shear stress along a plane can be calculated using a form of the Blasius equation [28]:
τ   =   0 . 332   μ U x R e
where τ is the wall shear stress, μ is the viscosity of air, U is the velocity of air outside the boundary layer, x is the distance along the plane, and R e is the Reynolds number based on the freestream airflow. The velocity outside the boundary layer is given by the coefficient of pressure along the airfoil, the chordwise position, and the freestream velocity, U :
C P   =   1     ( U U ) 2
For a small angle of attack of 5° and Reynolds number of 5 × 10⁴, the C P along a NACA 0012 profile has been simulated [28]. At 20% of the chord length, the C P was −0.8 on the upper surface and close to 0 on the lower surface. Typically, the coefficient of lift does not vary significantly for high Reynolds numbers in comparison to the angle of attack [29], therefore, we used the same values of C P for our calculation, despite a Reynolds number of 1.4 × 10⁶. The resulting local velocities were U = 161 m/s and U = 120 m/s on the suction and pressure side respectively. Entering these values into the previous equation yields wall shear stresses of 32 Pa and 24 Pa respectively.

Appendix B.3. Drag Force on an Isolated Feathery Ice Grain

Assume that the feathery ice grain takes the shape of a cylindrical feature grown in the direction of the freestream airflow with a small relative angle. The drag force on the ice grain can be estimated by:
D   =   C D   ×   A   ×   1 2 ρ U 2
where D is the drag force, C D is the coefficient of drag of a cylinder, A is the cross-sectional area facing the flow, and the last component is the kinetic energy of the airflow including air density, ρ , and free stream velocity,   U . For a circular cylinder and a Re of 106, C D     0 . 3 [32]. If the cylinder is 3 mm long, 0.5 mm in diameter, with an angle of 5° with respect to the airflow, then the drag force is between 25 and 150 µN for airspeeds between 50 and 120 m/s respectively.

References

  1. Federal Aviation Administration. Aviation Maintenance Technician Handbook; United States Department of Transportation, Federal Aviation Administration, Testing Standards Branch: Oklahoma City, OK, USA, 2012; Volume 1, pp. 143–147. ISBN 9781792693564.
  2. European Aviation Safety Agency. Type-Certificate Data Sheet EASA.IM.A.018 Maule M-4; European Aviation Safety Agency: Cologne, Germany, 2011.
  3. Maule Aerospace Technology, Inc. Maintenance Manual for Maule MX-7-235 Star Rocket; Rev., B., Ed.; Maule Aerospace Technology, Inc.: Moultrie, GA, USA, 2016; pp. 21–23. [Google Scholar]
  4. Heinrich, A.; Ross, R.; Zumwalt, G.; Provorse, J.; Padmanabhan, V.; Thompson, J.; Riley, J. Aircraft Icing Handbook; Gates Learjet Corp.: Wichita, KS, USA, 1991; Volume 2. [Google Scholar]
  5. Ryerson, C.C. Assessment of Superstructure Ice Protection as Applied to Offshore Oil Operations: Safety Problems, Hazards, Needs, and Potential Transfer Technologies; US Army Engineer Research and Development Center: Hanover, NH, USA, 2008. [Google Scholar]
  6. Hanamoto, B.; Gagnon, J.J.; Pratt, B. Deicing a Satellite Communication Antenna; Cold Regions Research and Engineering Lab: Hanover, Germany, 1980. [Google Scholar]
  7. Ryerson, C.C. Ice protection of offshore platforms. Cold Reg. Sci. Technol. 2011, 65, 97–110. [Google Scholar] [CrossRef]
  8. Cohen, N.; Dotan, A.; Dodiuk, H.; Kenig, S. Superhydrophobic coatings and their durability. Mater. Manuf. Process. 2016, 31, 1143–1155. [Google Scholar] [CrossRef]
  9. Liu, Q.; Zhu, S.; Zhou, T.; Chang, Q.; He, B.; Zhou, Q. Design of robust superhydrophobic surfaces. Nature 2020, 582, 55–59. [Google Scholar] [CrossRef]
  10. Kreder, M.J.; Alvarenga, J.; Kim, P.; Aizenberg, J. Design of anti-icing surfaces: Smooth, textured or slippery? Nat. Rev. Mater. 2016, 1, 15003. [Google Scholar] [CrossRef]
  11. Lafuma, A.; Quéré, D. Superhydrophobic states. Nat. Mater. 2003, 2, 457–460. [Google Scholar] [CrossRef] [PubMed]
  12. Milionis, A.; Loth, E.; Bayer, I.S. Recent advances in the mechanical durability of superhydrophobic materials. Adv. Colloid Interface Sci. 2016, 229, 57–79. [Google Scholar] [CrossRef] [PubMed]
  13. Crick, C.R.; Parkin, I.P. Preparation and characterisation of super-hydrophobic surfaces. Chem.-Eur. J. 2010, 16, 3568–3588. [Google Scholar] [CrossRef]
  14. Zhang, J.; Seeger, S. Superoleophobic coatings with ultralow sliding angles based on silicone nanofilaments. Angew. Chem. Int. Ed. 2011, 50, 6652–6656. [Google Scholar] [CrossRef]
  15. Geyer, F.; Schönecker, C.; Butt, H.J.; Vollmer, D. Enhancing CO2 capture using robust superomniphobic membranes. Adv. Mater. 2017, 29, 1–6. [Google Scholar] [CrossRef]
  16. Hammond, D. Weathering effects on selected aircraft fabric covering processes. J. Aviat. Educ. Res. 2001, 10, 31–39. [Google Scholar] [CrossRef] [Green Version]
  17. Zimmermann, J.; Artus, G.R.J.; Seeger, S. Superhydrophobic silicone nanofilament coatings. J. Adhes. Sci. Technol. 2008, 22, 251–263. [Google Scholar] [CrossRef] [Green Version]
  18. Geyer, F.; D’Acunzi, M.; Sharifi-Aghili, A.; Saal, A.; Gao, N.; Kaltbeitzel, A.; Sloot, T.F.; Berger, R.; Butt, H.J.; Vollmer, D. When and how self-cleaning of superhydrophobic surfaces works. Sci. Adv. 2020, 6, 1–12. [Google Scholar] [CrossRef] [Green Version]
  19. Zimmermann, J.; Reifler, F.A.; Schrade, U.; Artus, G.R.J.; Seeger, S. Long term environmental durability of a superhydrophobic silicone nanofilament coating. Colloids Surf. A Physicochem. Eng. Asp. 2007, 302, 234–240. [Google Scholar] [CrossRef]
  20. Zimmermann, B.J.; Reifler, F.A.; Fortunato, G.; Gerhardt, L.; Seeger, S. A simple, one-step approach to durable and robust superhydrophobic textiles. Adv. Funct. Mater. 2008, 18, 3662–3669. [Google Scholar] [CrossRef] [Green Version]
  21. Zhang, J.; Wang, A.; Seeger, S. Nepenthes pitcher inspired anti-wetting silicone nanofilaments coatings: Preparation, unique anti-wetting and self-cleaning behaviors. Adv. Funct. Mater. 2014, 24, 1074–1080. [Google Scholar] [CrossRef]
  22. Hauk, T.; Strobl, T.; Raps, D. Implementation and calibration of the icing and contamination research facility (iCORE). In Proceedings of the 25th European Conference on Liquid Atomization and Spray Systems, Chania, Greece, 1–4 September 2013; pp. 921–928. [Google Scholar]
  23. Fortin, G.; Laforte, J.-L.; Beisswenger, A. Prediction of ice shapes on NACA 0012 2D airfoil. SAE Tech. Pap. 2003. [Google Scholar] [CrossRef]
  24. McDevitt, J.B.; Okuno, A.F. Static and Dynamic Pressure Measurements on a NACA 0012 Airfoil in the Ames High Reynolds Number Facility. NASA TP-2485; June 1985. Available online: https://ntrs.nasa.gov/citations/19850019511 (accessed on 31 October 2020).
  25. Cao, Y.; Zhang, Q.; Sheridan, J. Numerical simulation of rime ice accretions on an aerofoil using an Eulerian method. Aeronaut. J. 2008, 112, 243–249. [Google Scholar] [CrossRef]
  26. Sam, R.G.; Lessmann, R.C.; Test, F.L. An experimental study of flow over a rectangular body. J. Fluids Eng. 1979, 101, 443–448. [Google Scholar] [CrossRef]
  27. Schellenberger, F.; Encinas, N.; Vollmer, D.; Butt, H.J. How water advances on superhydrophobic surfaces. Phys. Rev. Lett. 2016, 116, 2–7. [Google Scholar] [CrossRef]
  28. Balakumar, P. Direct numerical simulation of flows over an NACA-0012 airfoil at low and moderate reynolds numbers. In Proceedings of the 47th AIAA Fluid Dynamics Conference, Denver, CO, USA, 5–9 June 2017; p. AIAA 2017-3978. [Google Scholar] [CrossRef] [Green Version]
  29. Abbott, I.H.; Von Doenhoff, A.E. Theory of Wing Sections; Dover Publications, Inc.: New York, NY, USA, 1959; ISBN 978-0-486-60586-9. [Google Scholar]
  30. Finstad, K.J.; Lozowski, E.P.; Gates, E.M. A Computational investigation of water droplet trajectories. J. Atmos. Ocean. Technol. 1988, 5, 160–170. [Google Scholar] [CrossRef]
  31. Jin, J.Y.; Virk, M.S. Study of ice accretion along symmetric and asymmetric airfoils. J. Wind Eng. Ind. Aerodyn. 2018, 179, 240–249. [Google Scholar] [CrossRef]
  32. Heddleson, C.F.; Brown, D.L.; Cliffe, R.T. Summary of Drag Coefficients of Various Shaped Cylinders; General Electric Co.: Cincinnati, OH, USA, 1957. [Google Scholar]
Figure 1. SEM images of polyester fibers before coating, after a single coating process (1-step), and after a double coating process (2-step), each shown at two magnifications.
Coatings 10 01058 g001
Figure 2. Icing wind tunnel.
Coatings 10 01058 g002
Figure 3. Diagram of the NACA 0012 support with 180 mm-chord length and labels for positions on the fabrics. LE: leading edge, or stagnation line; S1, S2: suction side; P1, P2: pressure side.
Coatings 10 01058 g003
Figure 4. Configuration of fabric mounted to a flat plate sample holder in the icing wind tunnel test section. (a) Side-by-side arrangement of fabrics in the flat plate substrate holder; (b) Side view of the configuration in the test section showing the direction of airflow, top and bottom test section walls, and the two tested angles of the sample holder.
Coatings 10 01058 g004
Figure 5. Wetting properties of the superamphiphobic fabric exposed to aerodynamic wear conditions. Pressure side “P2” (hollow square), pressure side “P1” (filled square), stagnation line “LE” (concentric triangles), suction side “S1” (filled circle), suction side “S2” (hollow circle) positions, equilibrium contact angle averaged over all positions (flat bar), and roll-off angle averaged over all positions (cross). (a) After exposure to a warm droplet cloud at speeds from 20 to 120 m/s, for a cumulative duration of 50 min. (b) After exposure to a warm droplet cloud at 90 m/s for up to 50 min. (c) SEM images of polyester fibers on fabrics exposed to 120 m/s (top) and 50 m/s for 3 icing cycles (bottom). (d) After exposure to 3 icing cycles at 50 m/s. Lines are shown as a guide for the eye.
Coatings 10 01058 g005
Figure 6. Wetting properties of fabrics exposed to cloud conditions for 10 min at increasing speeds while on a flat plate at an angle of attack of 20° (horizontal dash) and 45° (cross). (a) Water droplets on a superhydrophobic fabric after exposure at +12.5 °C. (b) Water droplets on a superhydrophobic fabric after exposure at −5 °C. (c) Oil droplets on a superamphiphobic fabric after exposure at +12.5 °C. (d) Oil droplets on a superamphiphobic fabric after exposure at −5 °C.
Coatings 10 01058 g006
Figure 7. SEM images of superamphiphobic fabrics tested in a flat plate configuration at an angle of attack of 20° and in icing conditions. Each row consists of increasing magnification of a single fabric tested at the airspeed indicated on the left. The inset images are 10 µL oil droplets on the respective fabric sample following durability testing and tilted at the angle specified beside the image.
Coatings 10 01058 g007
Figure 8. Sketch of air pathlines over a rectangular body after 3 and 10 min of icing. Bluish area: Sketch of accreted ice.
Coatings 10 01058 g008
Figure 9. Sketch of two envisioned damage mechanisms of the flat plate configuration. (a) One being the tearing of an isolated feather ice grain from the fabric surface due to aerodynamic drag. (b) The second being after breakage of the feathery ice grain, it being carried, by a separated backflow of air, away from the surface and then back towards it, causing erosive or scratching damage to surface nanofilaments. The insets are SEM images of either pulling or erosive damage that was observed from experiments.
Coatings 10 01058 g009
Table 1. List of conditions used for icing wind tunnel durability testing.
ConfigurationTotal Air Temperature (°C)Velocity (m/s)Angle of Attack (°)Duration of Cycle (min)Total Duration of Exposure (min)Volume Flow Rate Water
(cm3/min.)
Airfoil+20
+20
−3
20–120
95
50
0 ± 21050
50
40
10
Flat Plate+12.5
−5
90–11520 ± 1
45 ± 1
3–101010
Publisher’s Note: MDPI stays neutral with regard to jurisdictional claims in published maps and institutional affiliations.

