1. Introduction
Engineered wood products are becoming an essential material in the construction of both residential and commercial buildings. Wood is a complex biopolymer [
1,
2,
3,
4,
5] that needs to be protected by an effective coating when exposed to solar radiation, water, varying temperatures, and oxygen [
5]. Making durable wood coatings is essential in extending the service life of coated products and reducing maintenance [
5]. The performance of a coating in exterior applications depends on many factors such as wood species and their physical properties, coating types and properties, application procedures, and exposure conditions [
6]. In addition to accentuating the aesthetics of a natural substrate, an exterior coating is designed to protect the wood from moisture, ultraviolet (UV) radiation, and mildew discoloration [
7,
8].
Among these factors, UV degradation and moisture effects are the most influential factors on the performance of coated wood [
6]. Photo-oxidation occurs rapidly when exposed wood in the presence of oxygen interacts with ultraviolet and visible light [
9]. Photo-oxidation primarily affects the lignin component of wood and induces surface property modification such as discoloration, increased water sensitivity followed by hydrolysis, checking, and cracking [
10,
11]. These processes detrimentally deteriorate the wood’s appearance and structural properties. Changes in the moisture content of wood result in the swelling and shrinking of the material, leading to stresses and the checking of the wood. If the water stays in the wood, it will create suitable conditions for the growth of decay fungi inside the wood [
6]. The repeated freezing and thawing of liquid water in wood cells results in additional stresses; small cracks will develop, and these later expand to checks if the wood remains exposed to outdoor conditions [
12,
13]. Wind and wind-driven particles erode the exposed surface, contributing to uneven wear in the earlywood and latewood. Unlike weathering, decay fungi and insects can ultimately deteriorate the wood and cause severe structural damage. Wood should be coated in a protective finish to inhibit the effect of weathering in outdoor exposure [
14].
The application of surface coatings on wood is an excellent method of protecting and maintaining the appearance and performance of wooden structures [
7]. Coatings can reduce the water uptake, UV-degradation, and checking of wood, which prolongs the service life of wooden products [
6]. Coatings generally consist of four main components: (1) resins or binders, (2) pigments, (3) solvents, and (4) other additives. Different coating formulations may not have all these four main components [
6]. High-performance coatings formulated for wood should be able to provide excellent water repellency but also have good water vapor permeability to allow moisture to escape from the surface of the wood [
15,
16]. The degree of UV protection that any coating provides primarily depends on the pigment density of the formulation [
17,
18]. Transparent coatings on exterior wood require frequent reapplication (every one-to-two years) to ensure continued protection [
6]. This requirement makes wood a high-maintenance product when compared to other building materials. Increasing the lifespan of coatings would reduce the required maintenance and encourage the more extensive use of wood as a building material.
Coatings have very complex formulations, and their interactions with a natural material like wood makes predictions of their service life and performance challenging [
19]. Coating performance and lifecycle are dependent on factors such as grain characteristics, surface texture, heartwood/sapwood ratio, knots, extractives, moisture content, and density [
20,
21,
22]. One of the most critical factors in determining coating performance is the wetting characteristics of the coating and wood constituents. The durability of any coating is strongly dependent on the adhesion of the protective coating layer to the substrate [
23]. The characterization of the wetting behavior of a coating is essential in defining coating adhesion strength. The magnitude of the contact angle of a coating droplet on a substrate is widely used as a measure of the wettability of a coating-surface combination [
6,
24].
A lower contact angle indicates better wetting and subsequent greater bond strength between a coating and substrate. In general, to have excellent wetting, a coating should have a significantly lower surface tension compared to the surface energy of its substrate [
25]. The contact angle of early and latewood should be considered, as the contact angle is typically much higher on latewood than earlywood [
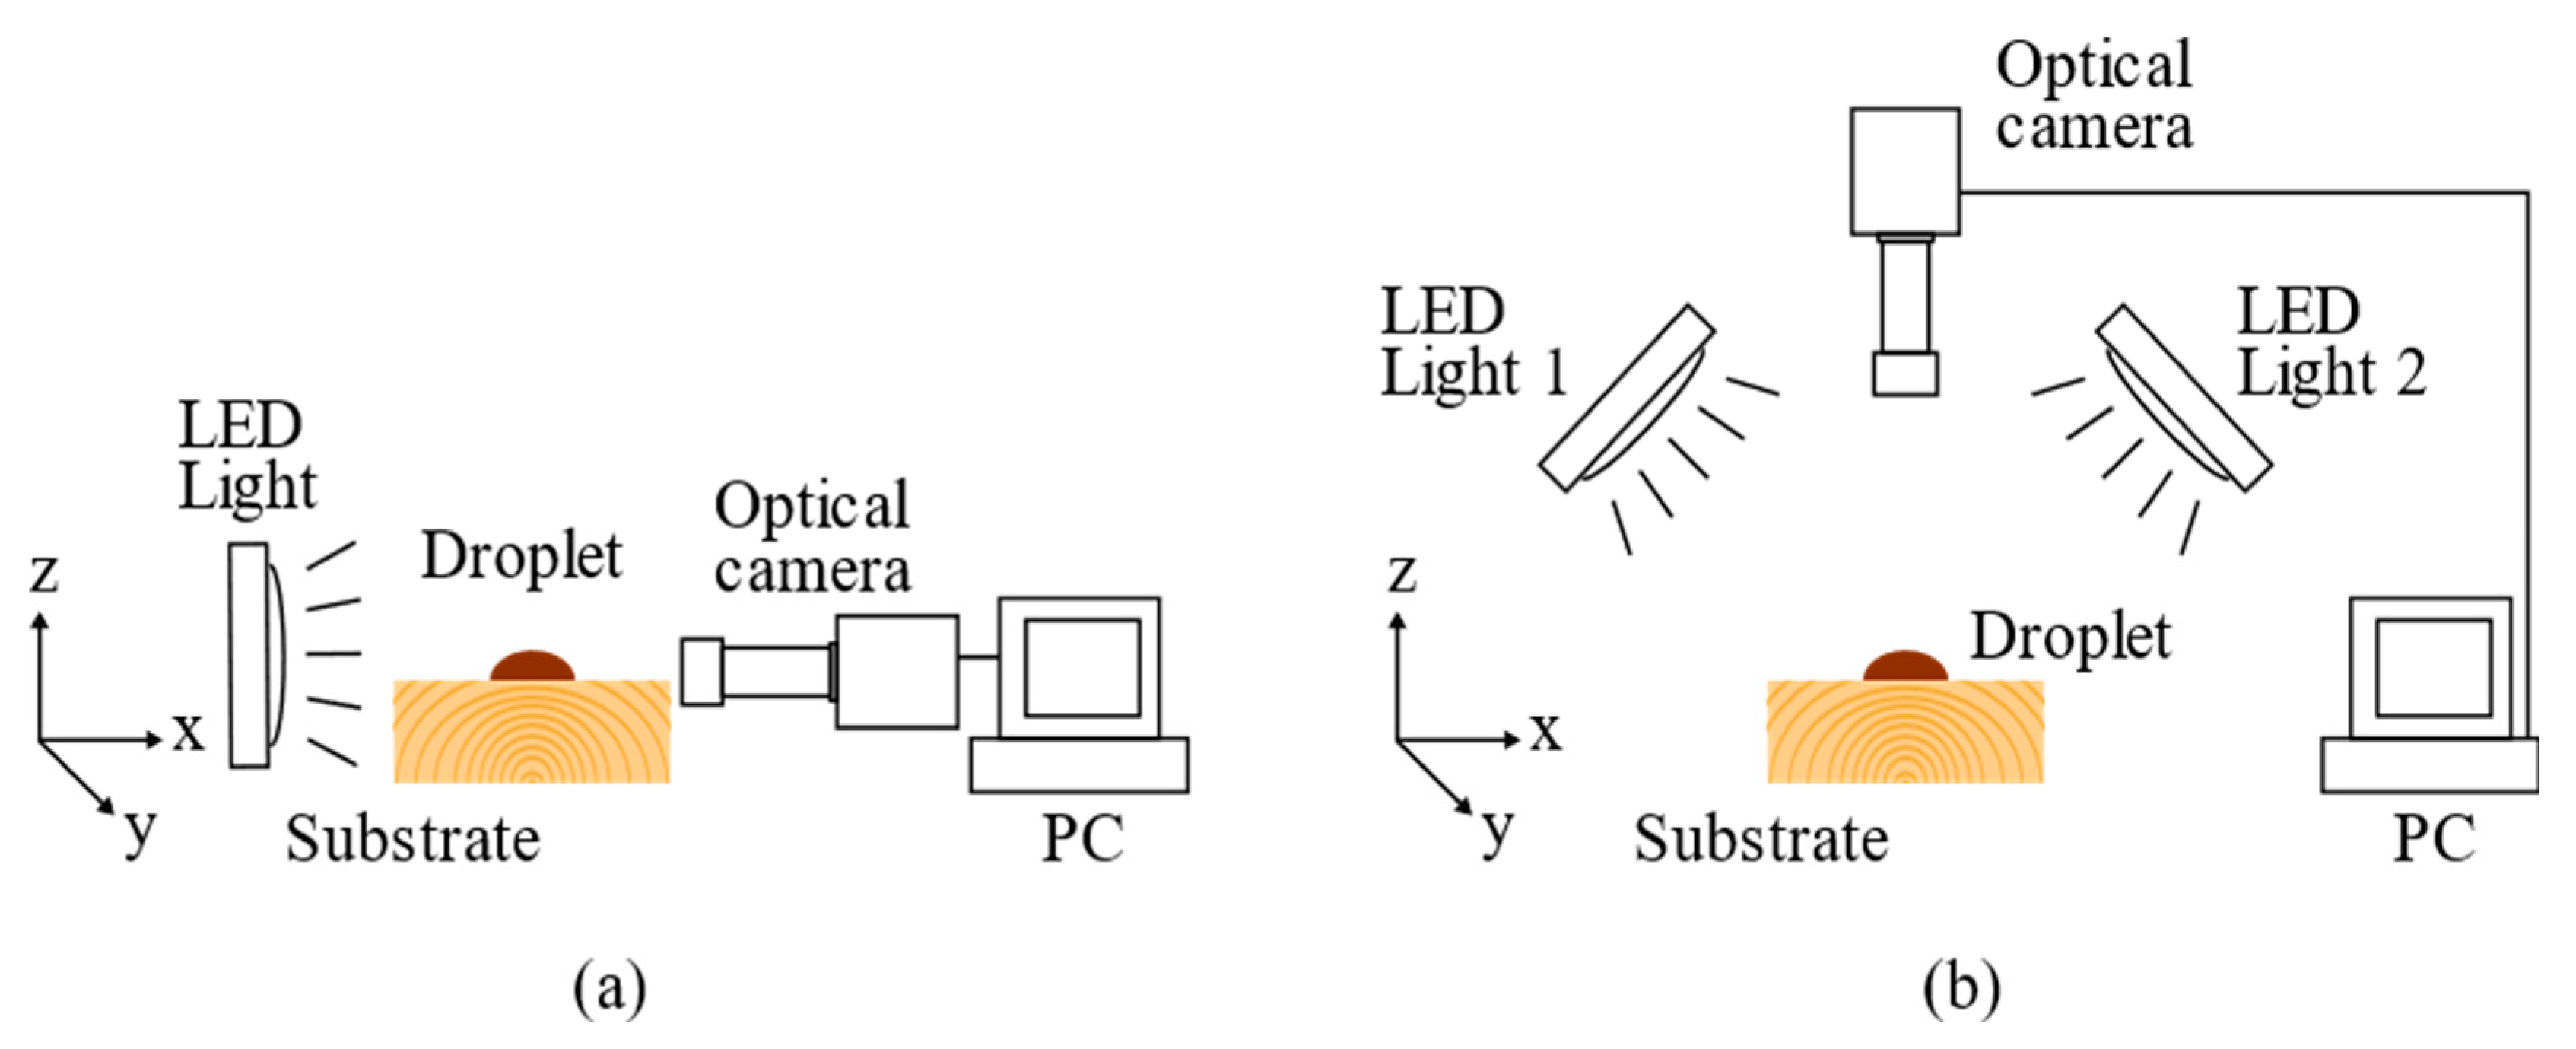
26]. A traditional method of characterizing the contact angle of a solid–liquid interface is conducted using a side-view method, which is shown in
Figure 1. In this configuration, an optical camera is placed parallel to the substrate being investigated [
27,
28,
29,
30].
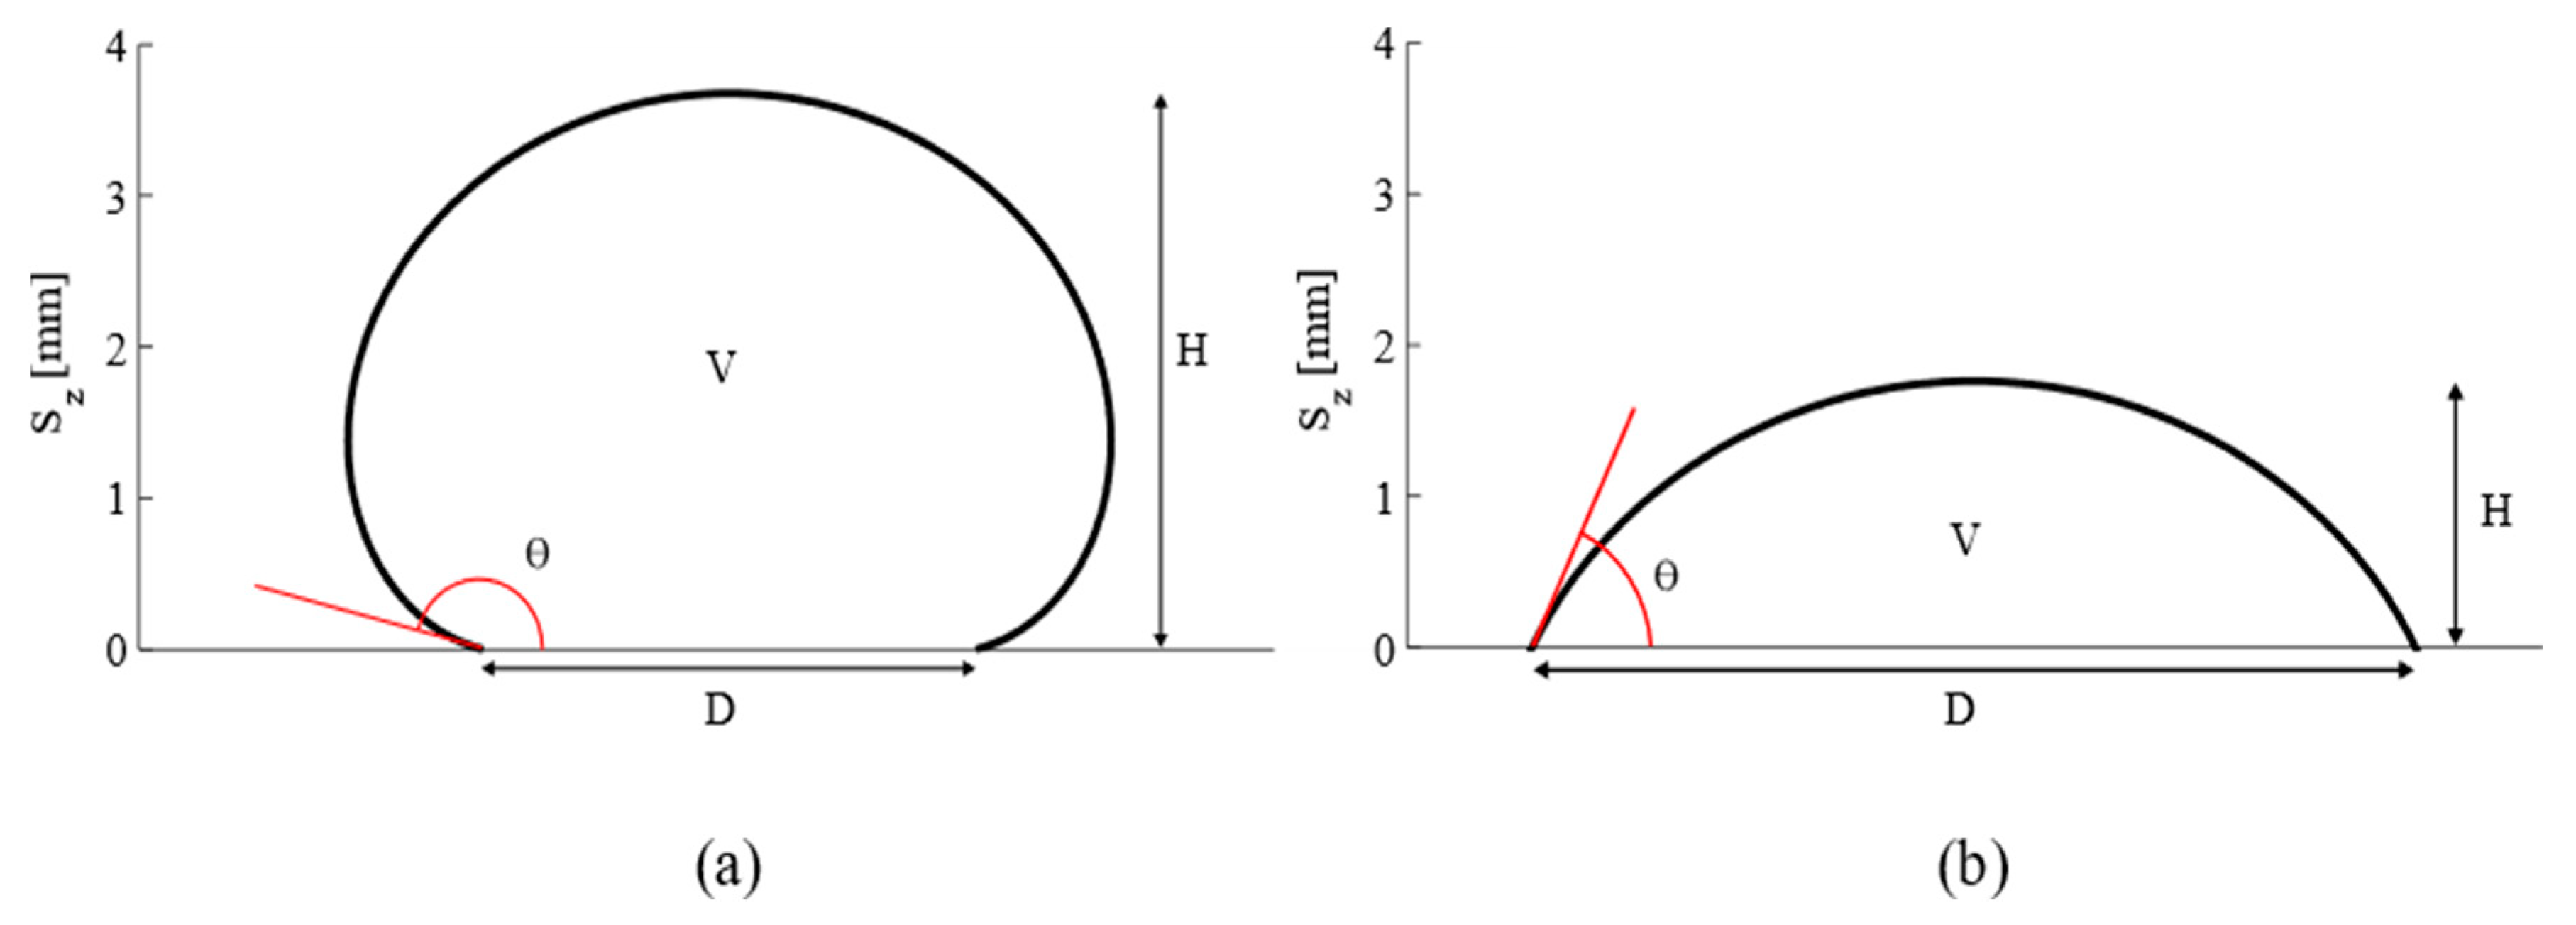
The contact angle, in this approach, is determined by drawing a line from the contact line (solid-liquid-gas interface) tangential to the liquid-gas interface. An example of this is illustrated by the red lines drawn in
Figure 2a,b. The angle of these lines relative to the substrate is the contact angle. This method is not suitable for use with natural substrates, as it relies on the assumption of an axisymmetric droplet. This is not correct for a coating droplet on wood due to the substrate’s anisotropic non-smooth nature, and it can be inaccurate for low contact angles.
Coating wetting through contact angle characterization on wood [
24,
31,
32,
33] and other surfaces [
34,
35] has been previously studied. Kazayawoko et al. [
24] outlined a top-down approach to determine a coating droplet contact angle on wood, as shown in
Figure 1b. In this approach, an optical camera is placed perpendicular to the substrate, and the average diameter of the droplet is determined. By knowing the droplet volume, surface tension, and density, it is possible to iteratively solve the Young–Laplace equation to converge on an average contact angle solution. Kazayawoko et al. [
24] detected the droplet base diameter on wood by manually placing 15–20 points on the perimeter of each droplet. This technique is time-consuming, requires human input, which has an associated error, and is unable to analyze highly irregular shapes. Given current technology and image processing techniques that are now widely available, it is possible to automate this process, thus making it possible to efficiently characterize an extensive range of coating-substrate combinations.
Meijer et al. [
32] calculated the Lifshitz-van der Waals, acid-base, and total surface free energies of various wood species from contact angle measurements. Three distinct methods of contact angle measurement were employed: capillary rise based on the Washburn equation, dynamic contact angle measurements according to the Wilhelmy-plate principle, and sessile drop measurements along and across the grain of the wood. The impact of substrate chemical heterogeneity, surface roughness, and the adsorption of the test solvent was discussed. Shi and Gardner [
31] explored adhesive wettability on wood. They developed a wetting model to describe the dynamic contact angle during the adhesive wetting process on southern pine and Douglas-fir. Baptista et al. [
33] investigated contact angle characterization utilizing three cameras that were positioned orthogonally on anisotropic substrates such as wood. They assumed that the droplet shape could be approximated by a spherical or ellipsoidal cap and required no fluid properties. The authors noted that their approach was not able to accurately characterize droplets with non-elliptical shapes.
Erbil et al. [
34] used images captured from a dual camera orientation (top-down and side-view) to study the evaporation rate of water droplets on poly(methyl methacrylate). The ellipsoidal cap droplet profile was mathematically derived from the base radius, droplet height, and contact angle. Mchale et al. [
35] examined the impact of drop flattening and substrate surface heterogeneity on the cross-sectional and planar shapes of droplets on solid surfaces. They employed a dual-camera system to capture views from two orthogonal points of view.
This paper measured the properties of thirteen water-based and ten solvent-based coatings (some of which are shown in
Figure 3) on southern yellow pine wood samples. An innovative image processing technique for coating droplets on wood is presented and discussed regarding the determination of the average droplet diameter and the iterative method of calculating the average contact angle using the top-down approach and the Young–Laplace solution. Additionally, the ability of each coating on reducing water uptake and their water permeability was measured when applied on small cross-laminated timber (CLT) wood samples. The coated wood samples were submerged into water, and their moisture contents were measured at different intervals for up to one-week of submersion in water and then one week of airdrying.
2. Materials and Methods
2.1. Wood Properties
Flat-grained southern yellow pine wood samples were cut from 6 different boards measuring 2 cm × 12 cm × 30 cm with 8–10 average annual rings. The wood samples were conditioned in the lab at about 65% R.H. and 21 °C for three months before use. A small piece from the middle section of each board was cut to measure its moisture content. The remaining boards were maintained in sealed enclosures to ensure that their moisture contents would not change before being used for contact angle measurements. The wood samples were sanded with 120 grit sandpaper and wiped clean before measuring the contact angle of the coating. The moisture content of a subset of wood samples was analyzed by weighing the wood samples before and after placing them in a digital oven at 105 °C for one hour or until the weight was constant. The moisture content percentage was calculated by subtracting the mass of the oven-dry weight of wood from the initial weight, divided by oven-dry mass times 100.
2.2. Coating Properties
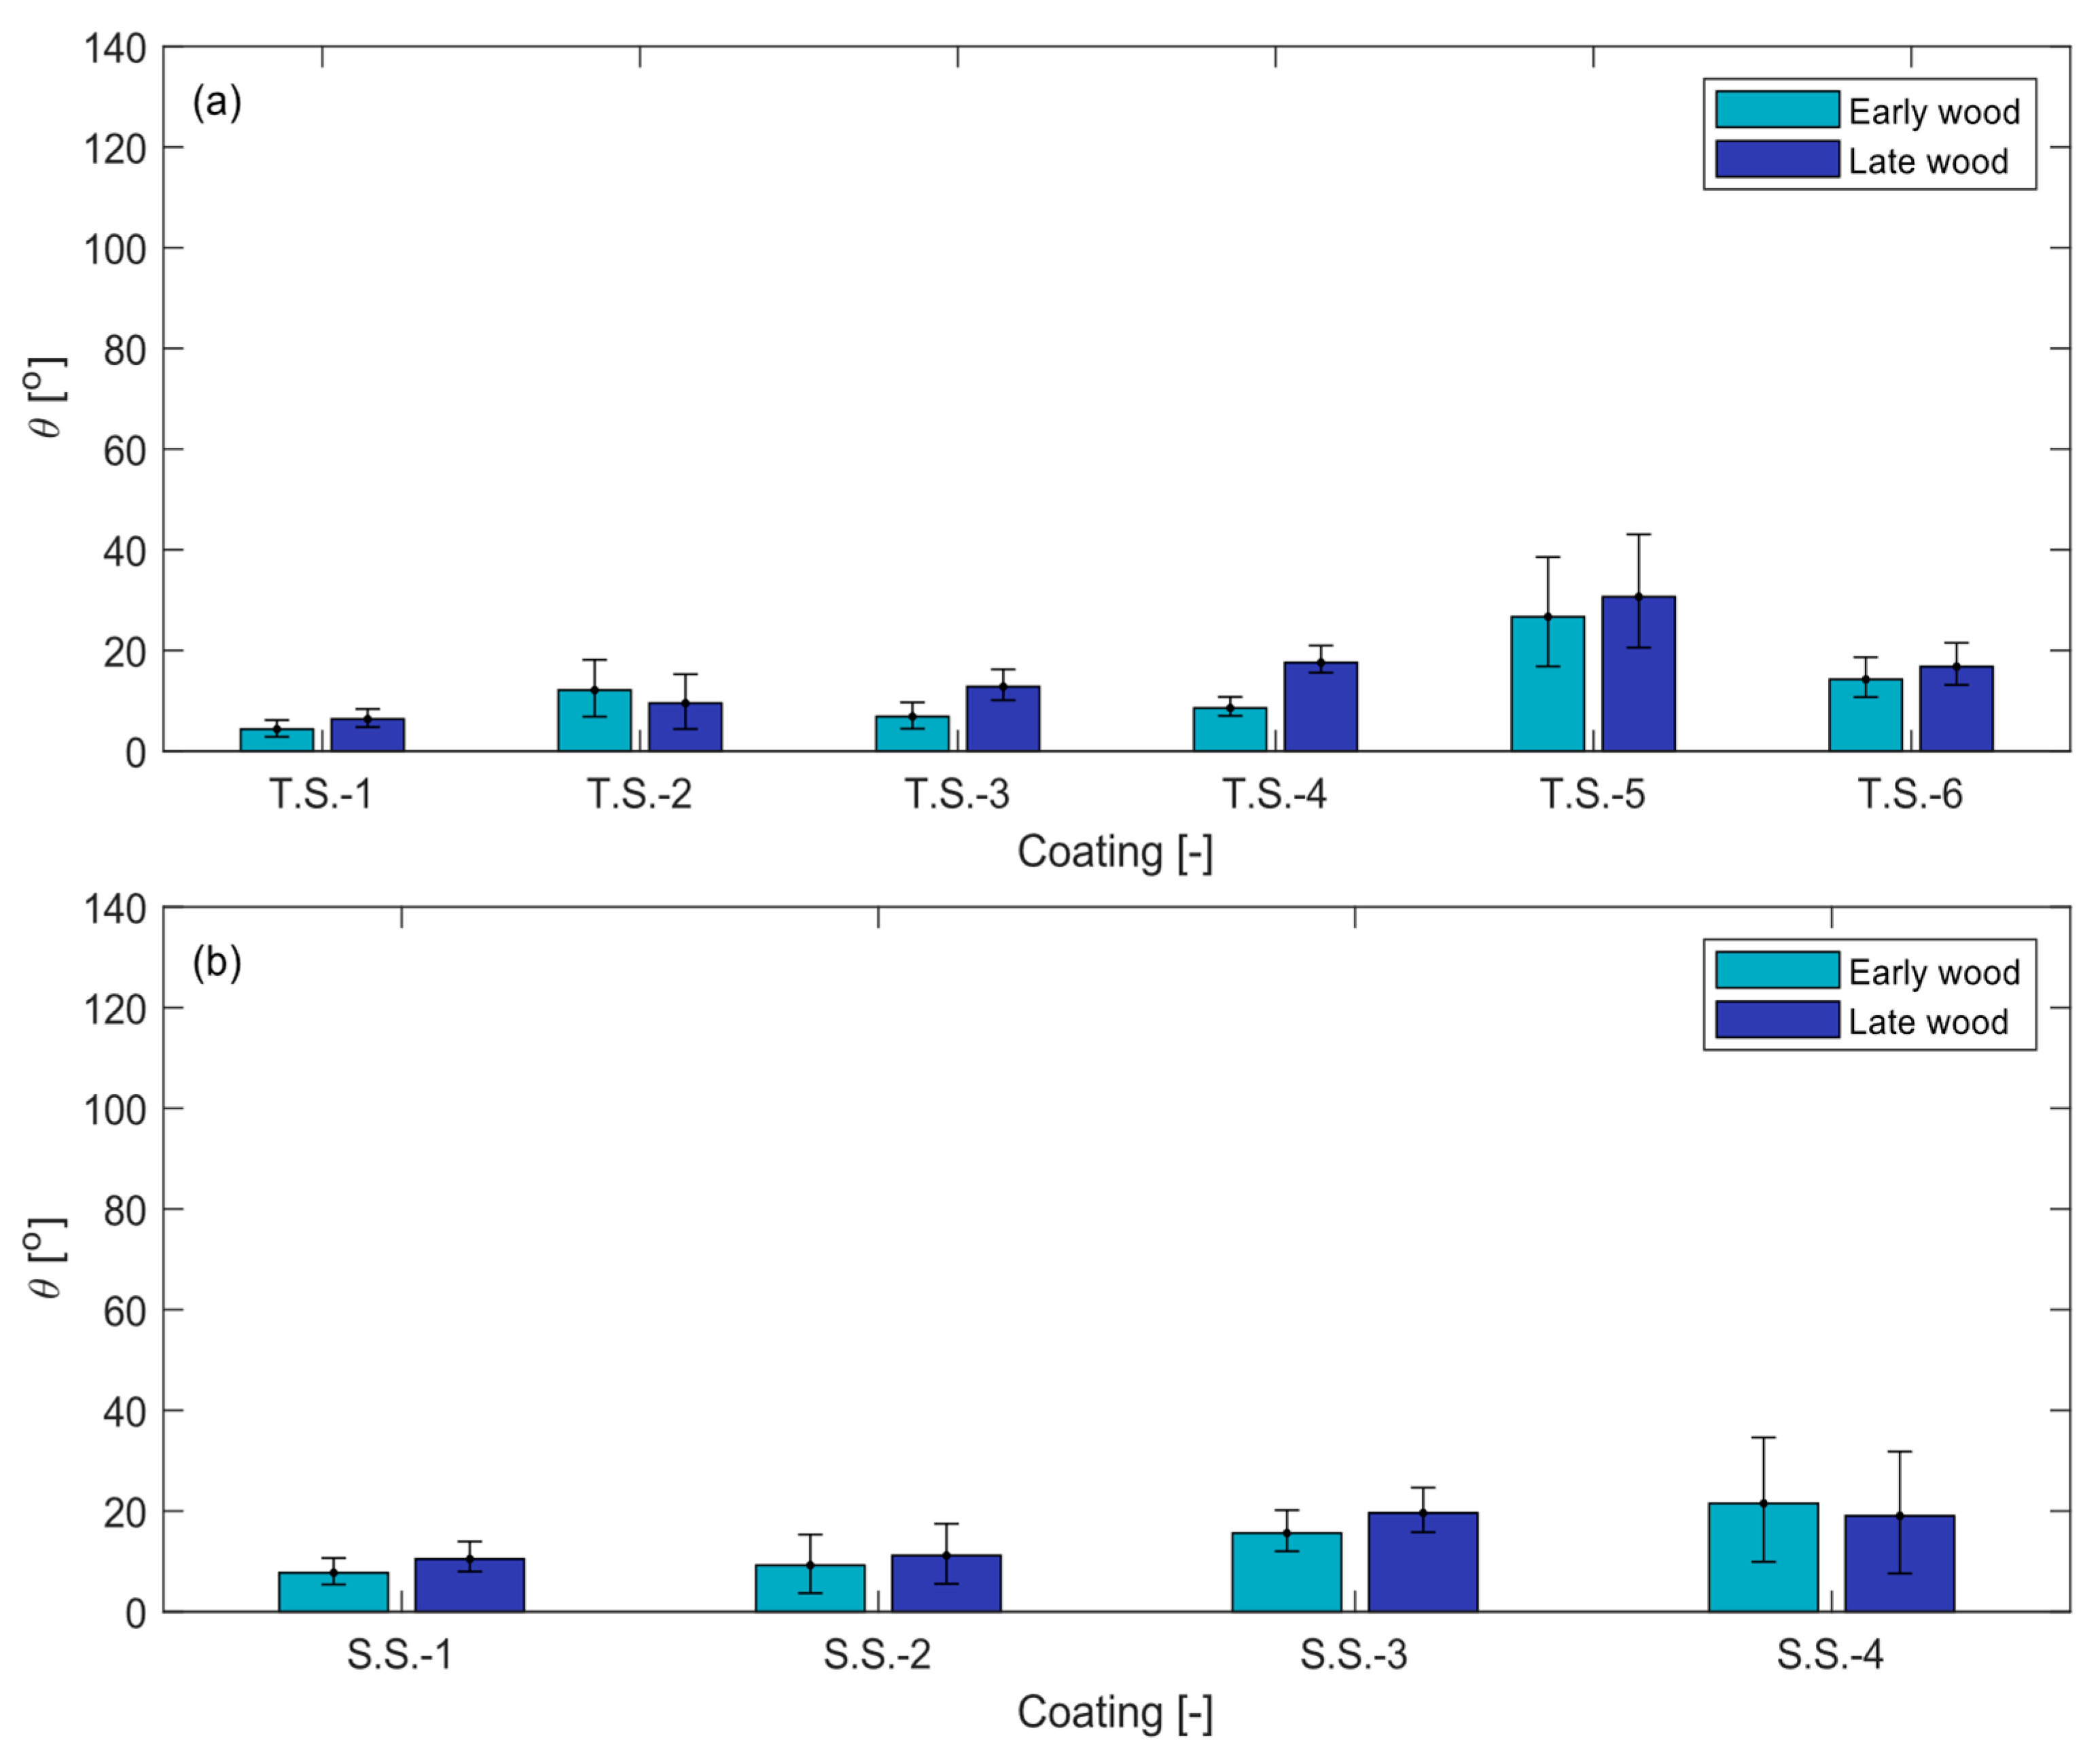
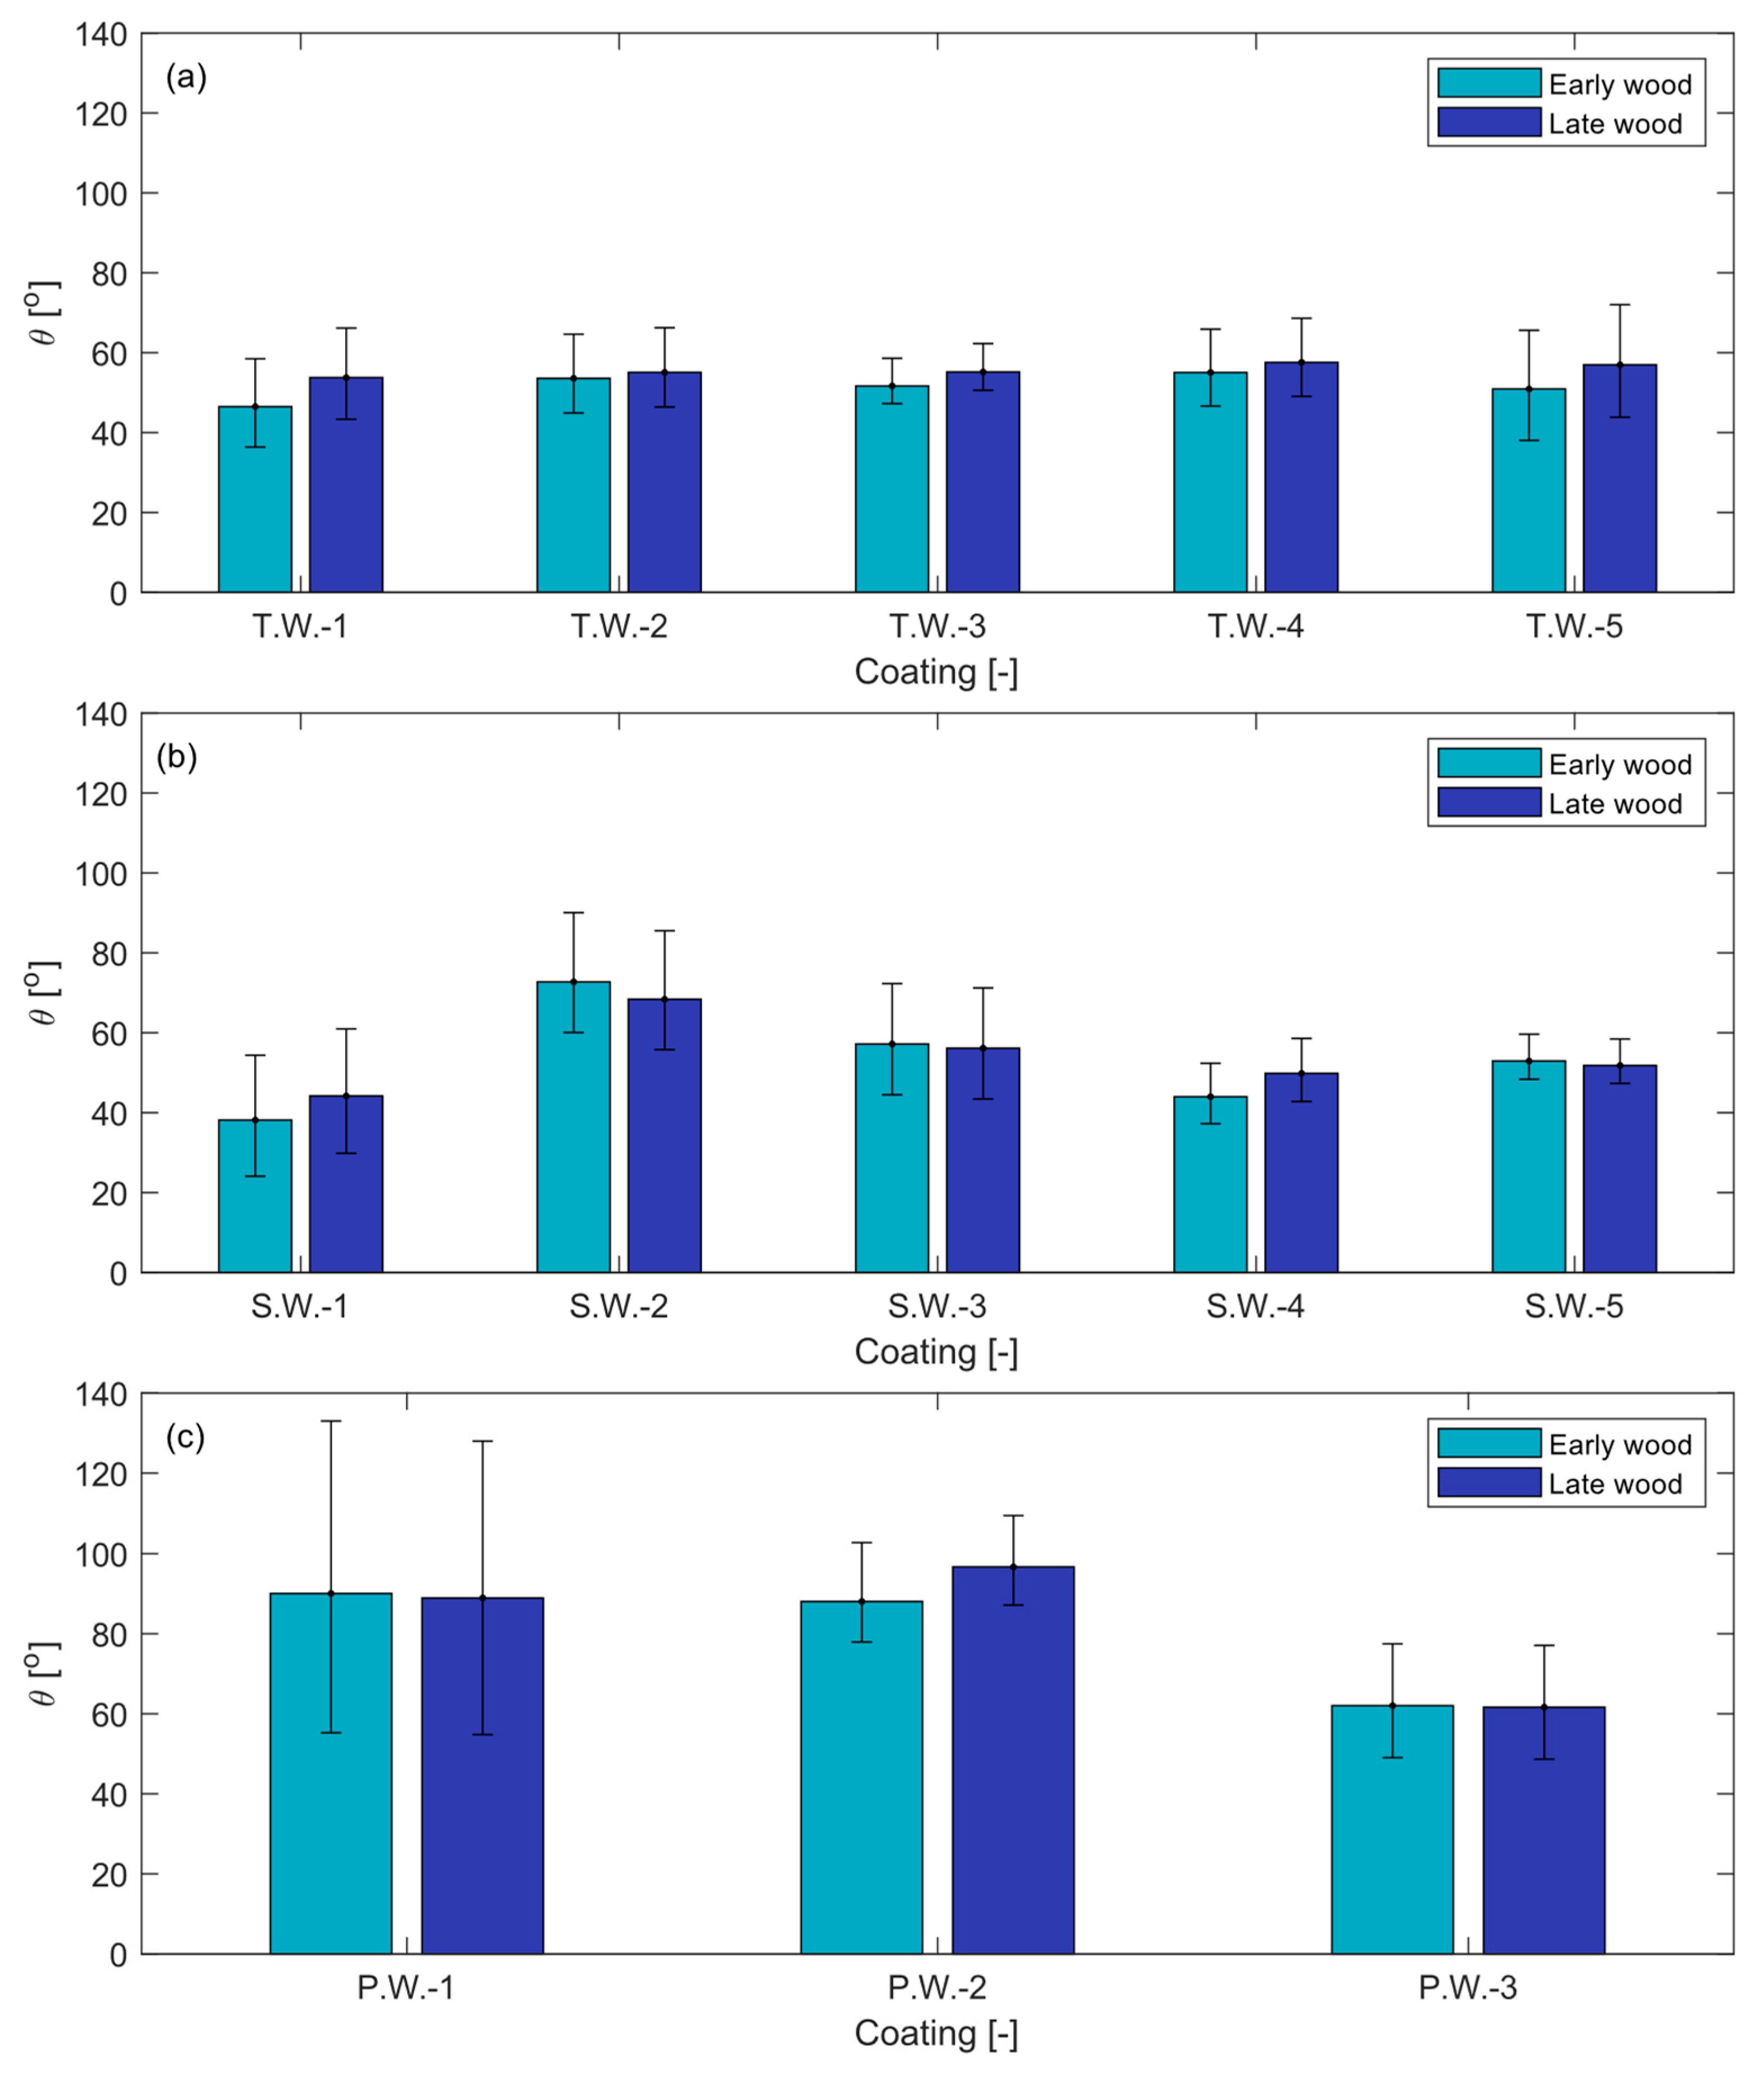
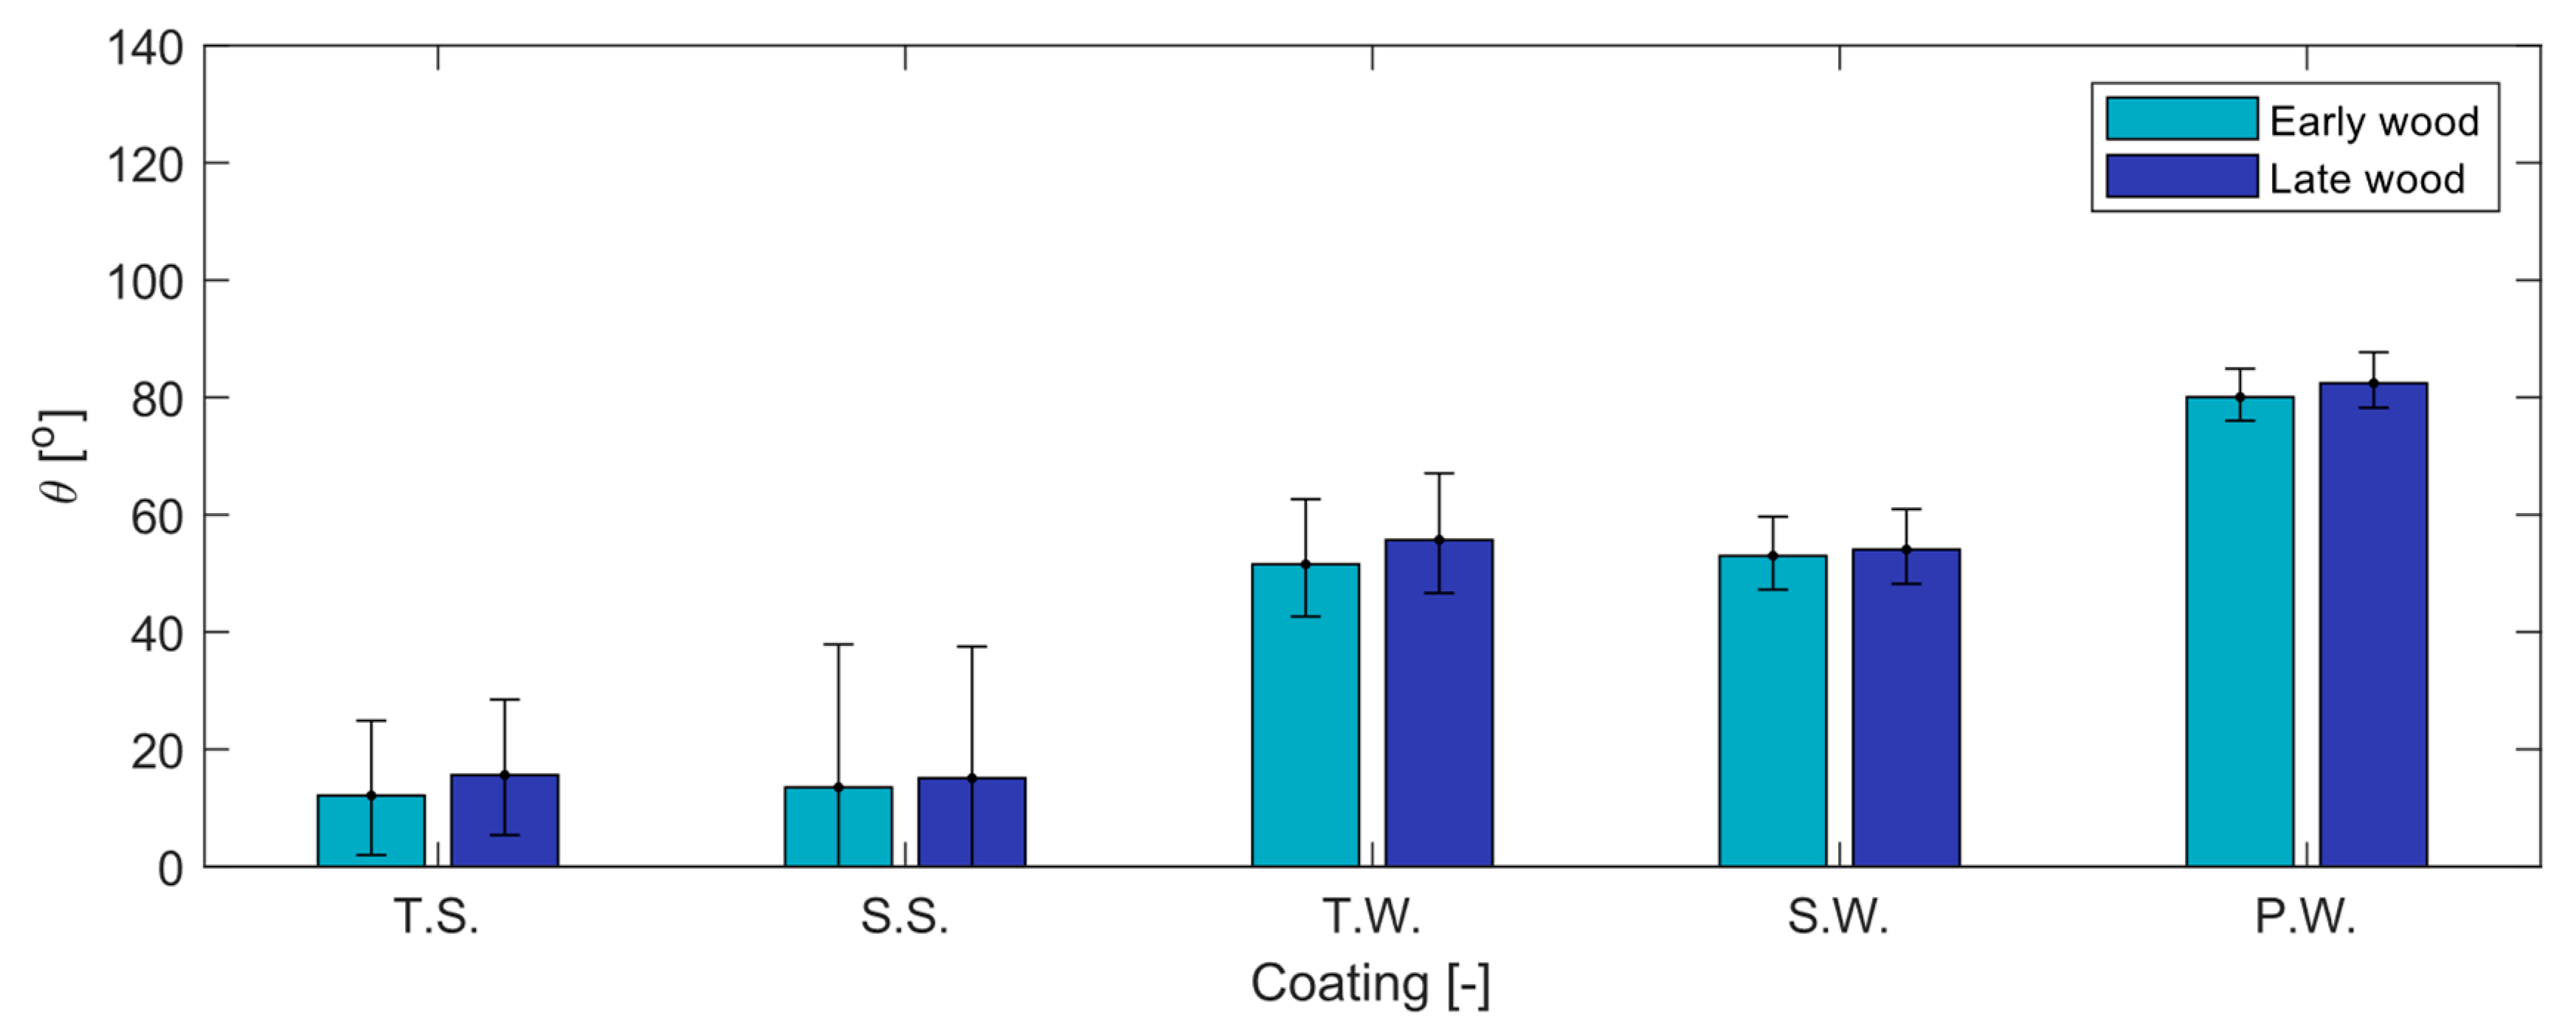
Twenty-three commercially available coatings, thirteen of which were water-based and ten of which solvent-based, were purchased and characterized during this study. The contact angle of all coatings was investigated on flat-grained southern yellow pine wood. Each coating was tested on a minimum of three different boards on both early and latewood cases. The coatings were separated into five categories depending on their base (water or solvent) and their opacity (transparent, semi-transparent, and paint): T.S. (transparent stain, solvent-based), S.S. (semi-transparent stain, solvent-based), T.W. (transparent stain, water-based), S.W. (semi-transparent stain, water-based), and P.W. (paint, water-based). All tests were conducted at room temperature, and average liquid densities of 1100 kg/m3 and 850 kg/m3 were used for the water and solvent-based coatings, respectively, in all calculations.
To rigorously investigate the experimental wetting data, several fundamental coating properties were characterized. These coating properties are listed in
Table 1. The solid content of coatings was determined according to ASTM D2369 [
36]. Briefly, about 3 mL of each coating (5 replicates) were placed in an aluminum pan and heated in an oven at 110 °C for one hour. The volatile organic compounds of each coating were calculated based on the difference in the mass of the coatings. A Brookfield DV2T Viscometer (Middleboro, MA, USA) was used to measure the viscosity of different coatings at room temperature. The pH of each coating was determined using a Mettler Toledo SevenCompact pH/ion meter S220 (Columbus, OH, USA) based on US EPA Method 9045D. The surface tension of each sample was measured using a Sigma 70 Tensiometer (Phoenix, AZ, USA) using the Wilhelmy plate method (22 mm × 50 mm × 0.15 mm) at a speed of 10 mm/min and a wetting depth of 6 mm, with an average of 10 readings for each sample. The glass transition temperatures of the coatings were measured using a Q2000 differential scanning calorimeter (DSC) (New Castle, DE, USA) and following ASTM D3418 procedure [
37]. Briefly, about 6–8 mg of each coating sample were placed in a Tzero aluminum pan with a custom heat/cool/heat cycle from −60 to 120 °C with a temperature ramp of 10 °C/min under nitrogen purge of 50 mL/min. A second heating curve was used to calculate the
Tg.
2.3. Experimental Apparatus and Data Acquisition
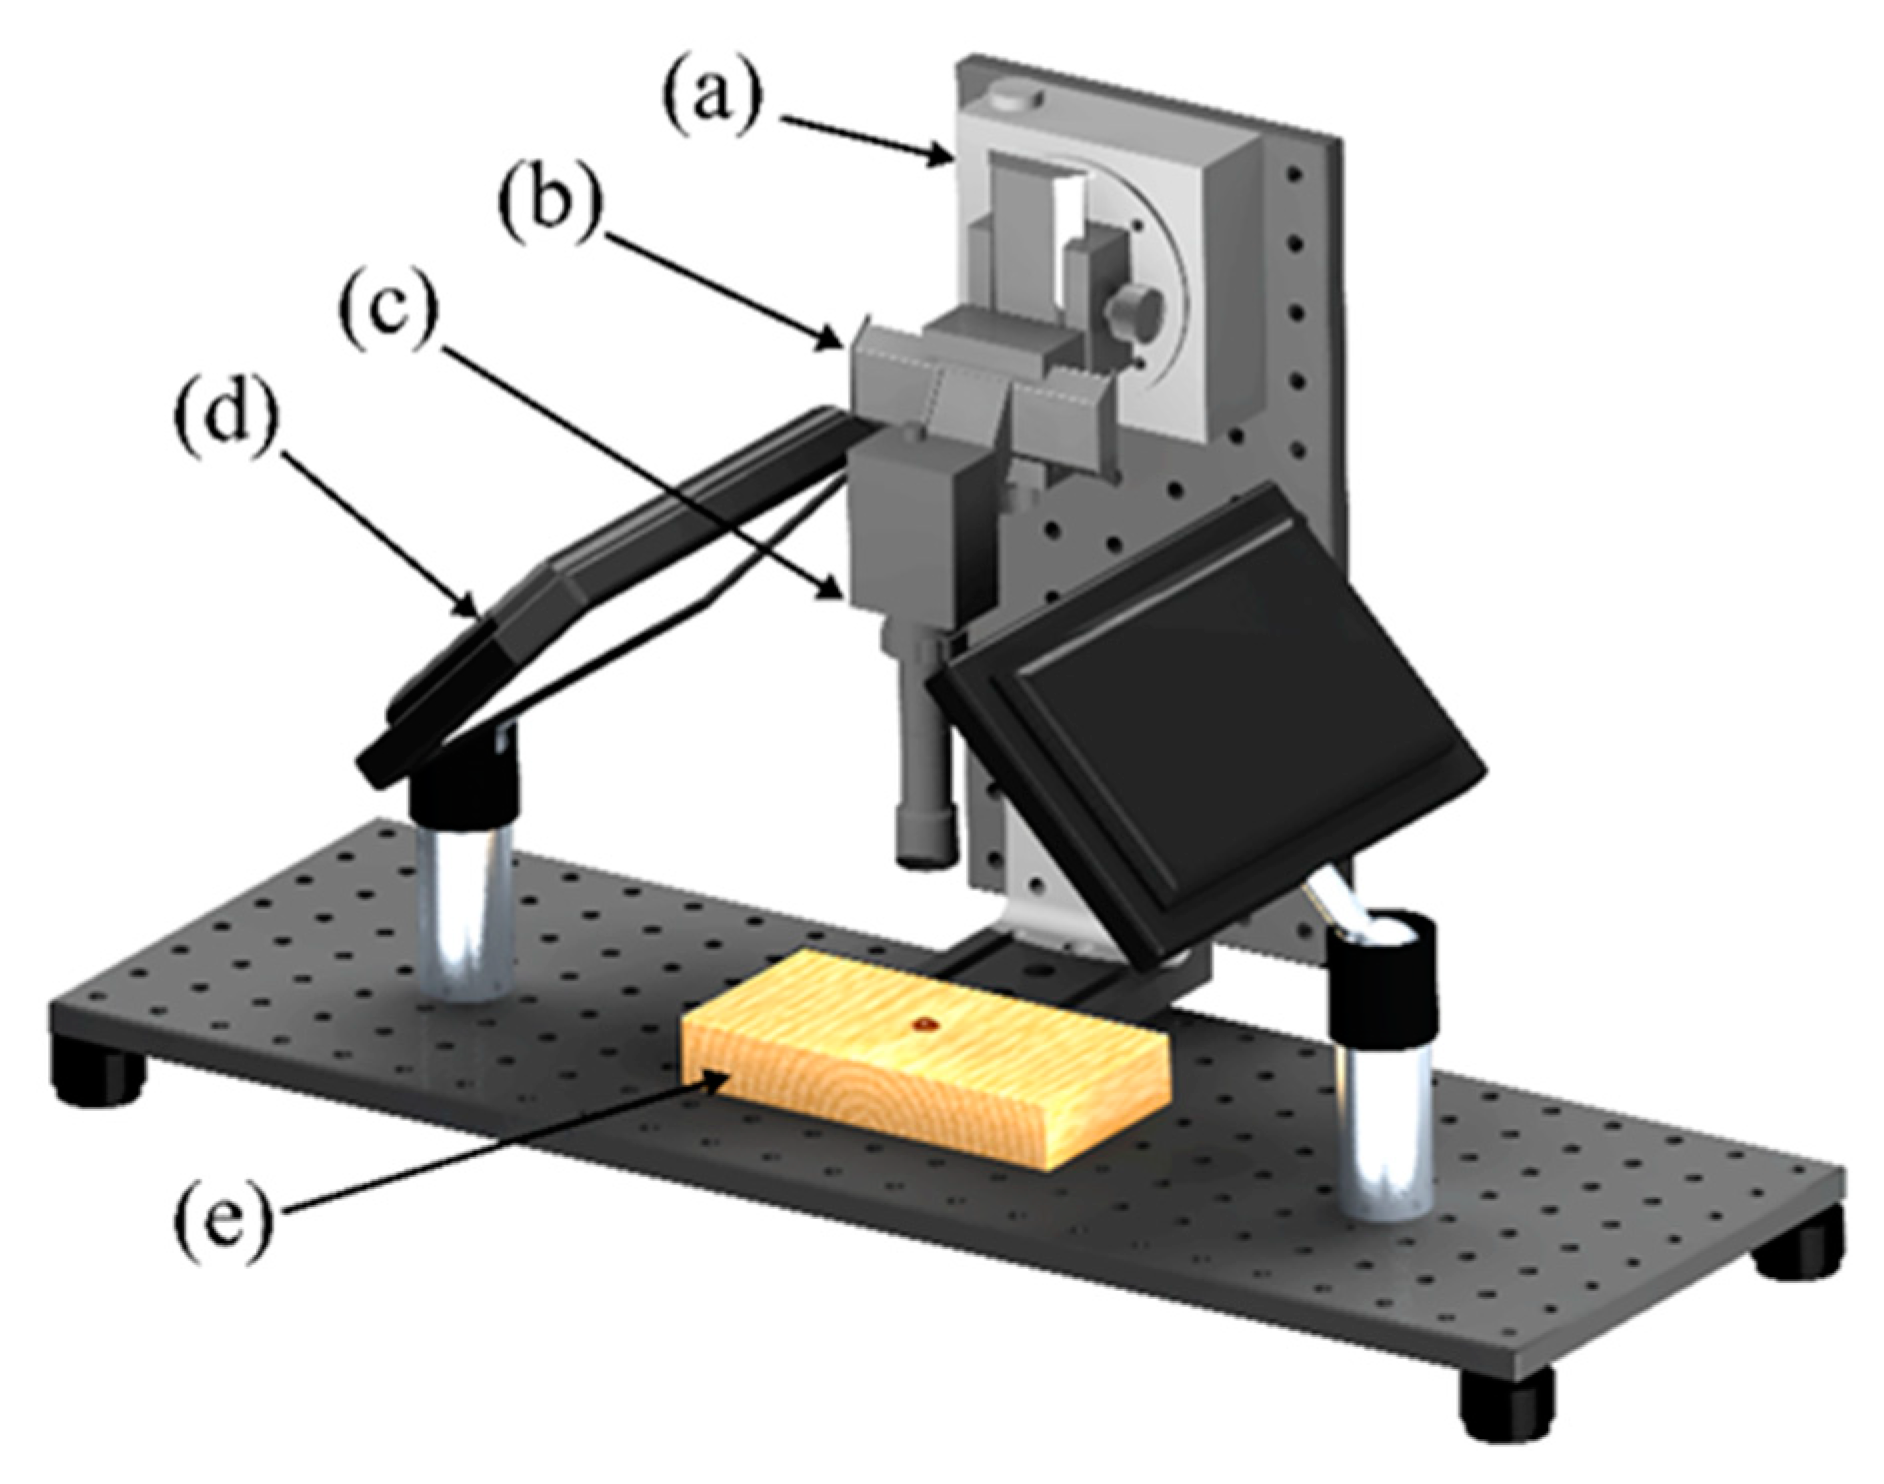
A schematic and a model of the experimental apparatus are shown in
Figure 1b and
Figure 4, respectively. In this study, the top–down configuration for determining the droplet contact angle was implemented.
2.4. Droplet Imaging System
The droplet imaging system consisted of a CCD camera (Point Grey, sensor: Sony IMX250, sensor size: 2/3”; pixels: 2448 × 2048; pixel depth: 12 bit; P/N: GS3-U3-51S5M-C) and a telecentric lens (Edmund Optics, magnification: 0.8×; working distance: 65 mm; depth of field: 1.2 mm; P/N: 63-742) (
Figure 4c). The optical camera was vertically mounted to a 2-axis (
x and
z) macro positioning system (Cameron, P/N: 4638) (
Figure 4b) that was connected to a rotation stage (Newport, P/N: 472) (
Figure 4a). The wood sample was placed directly below the optical camera, perpendicular to the wood surface during testing. The wood substrate was illuminated by two LED panel arrays (IKAN, 7” × 4”, P/N: PL74) (
Figure 4d) that were mounted to an aluminum baseplate (Edmund Optics, P/N: 03-639).
2.5. Contact Angle Measurement
Experiments were conducted in ambient surroundings at atmospheric pressure for a typical relative humidity of 31%. During testing, the wood samples were positioned directly below the optical camera (
Figure 4e). A syringe pump (NE-1000, New Era, Buffalo, NY, USA), a 100 µL gastight syringe (Hamilton 1710, 81022, Hamilton, Reno, NV, USA), and 100 µm inner diameter FEP tubing (1474-20, Wilmington, DE, USA) were used to dispense the droplet onto the wood surface. A coating droplet of varied volume (3–10 µL) was dispensed at 60 µL/min onto the natural substrate for each test point. The volume dispensed depended on the expected maximum spreading diameter of the drop. At the start of each test, the optical camera and syringe pump were triggered simultaneously. Images were acquired at 1 s intervals over a 10 min period.
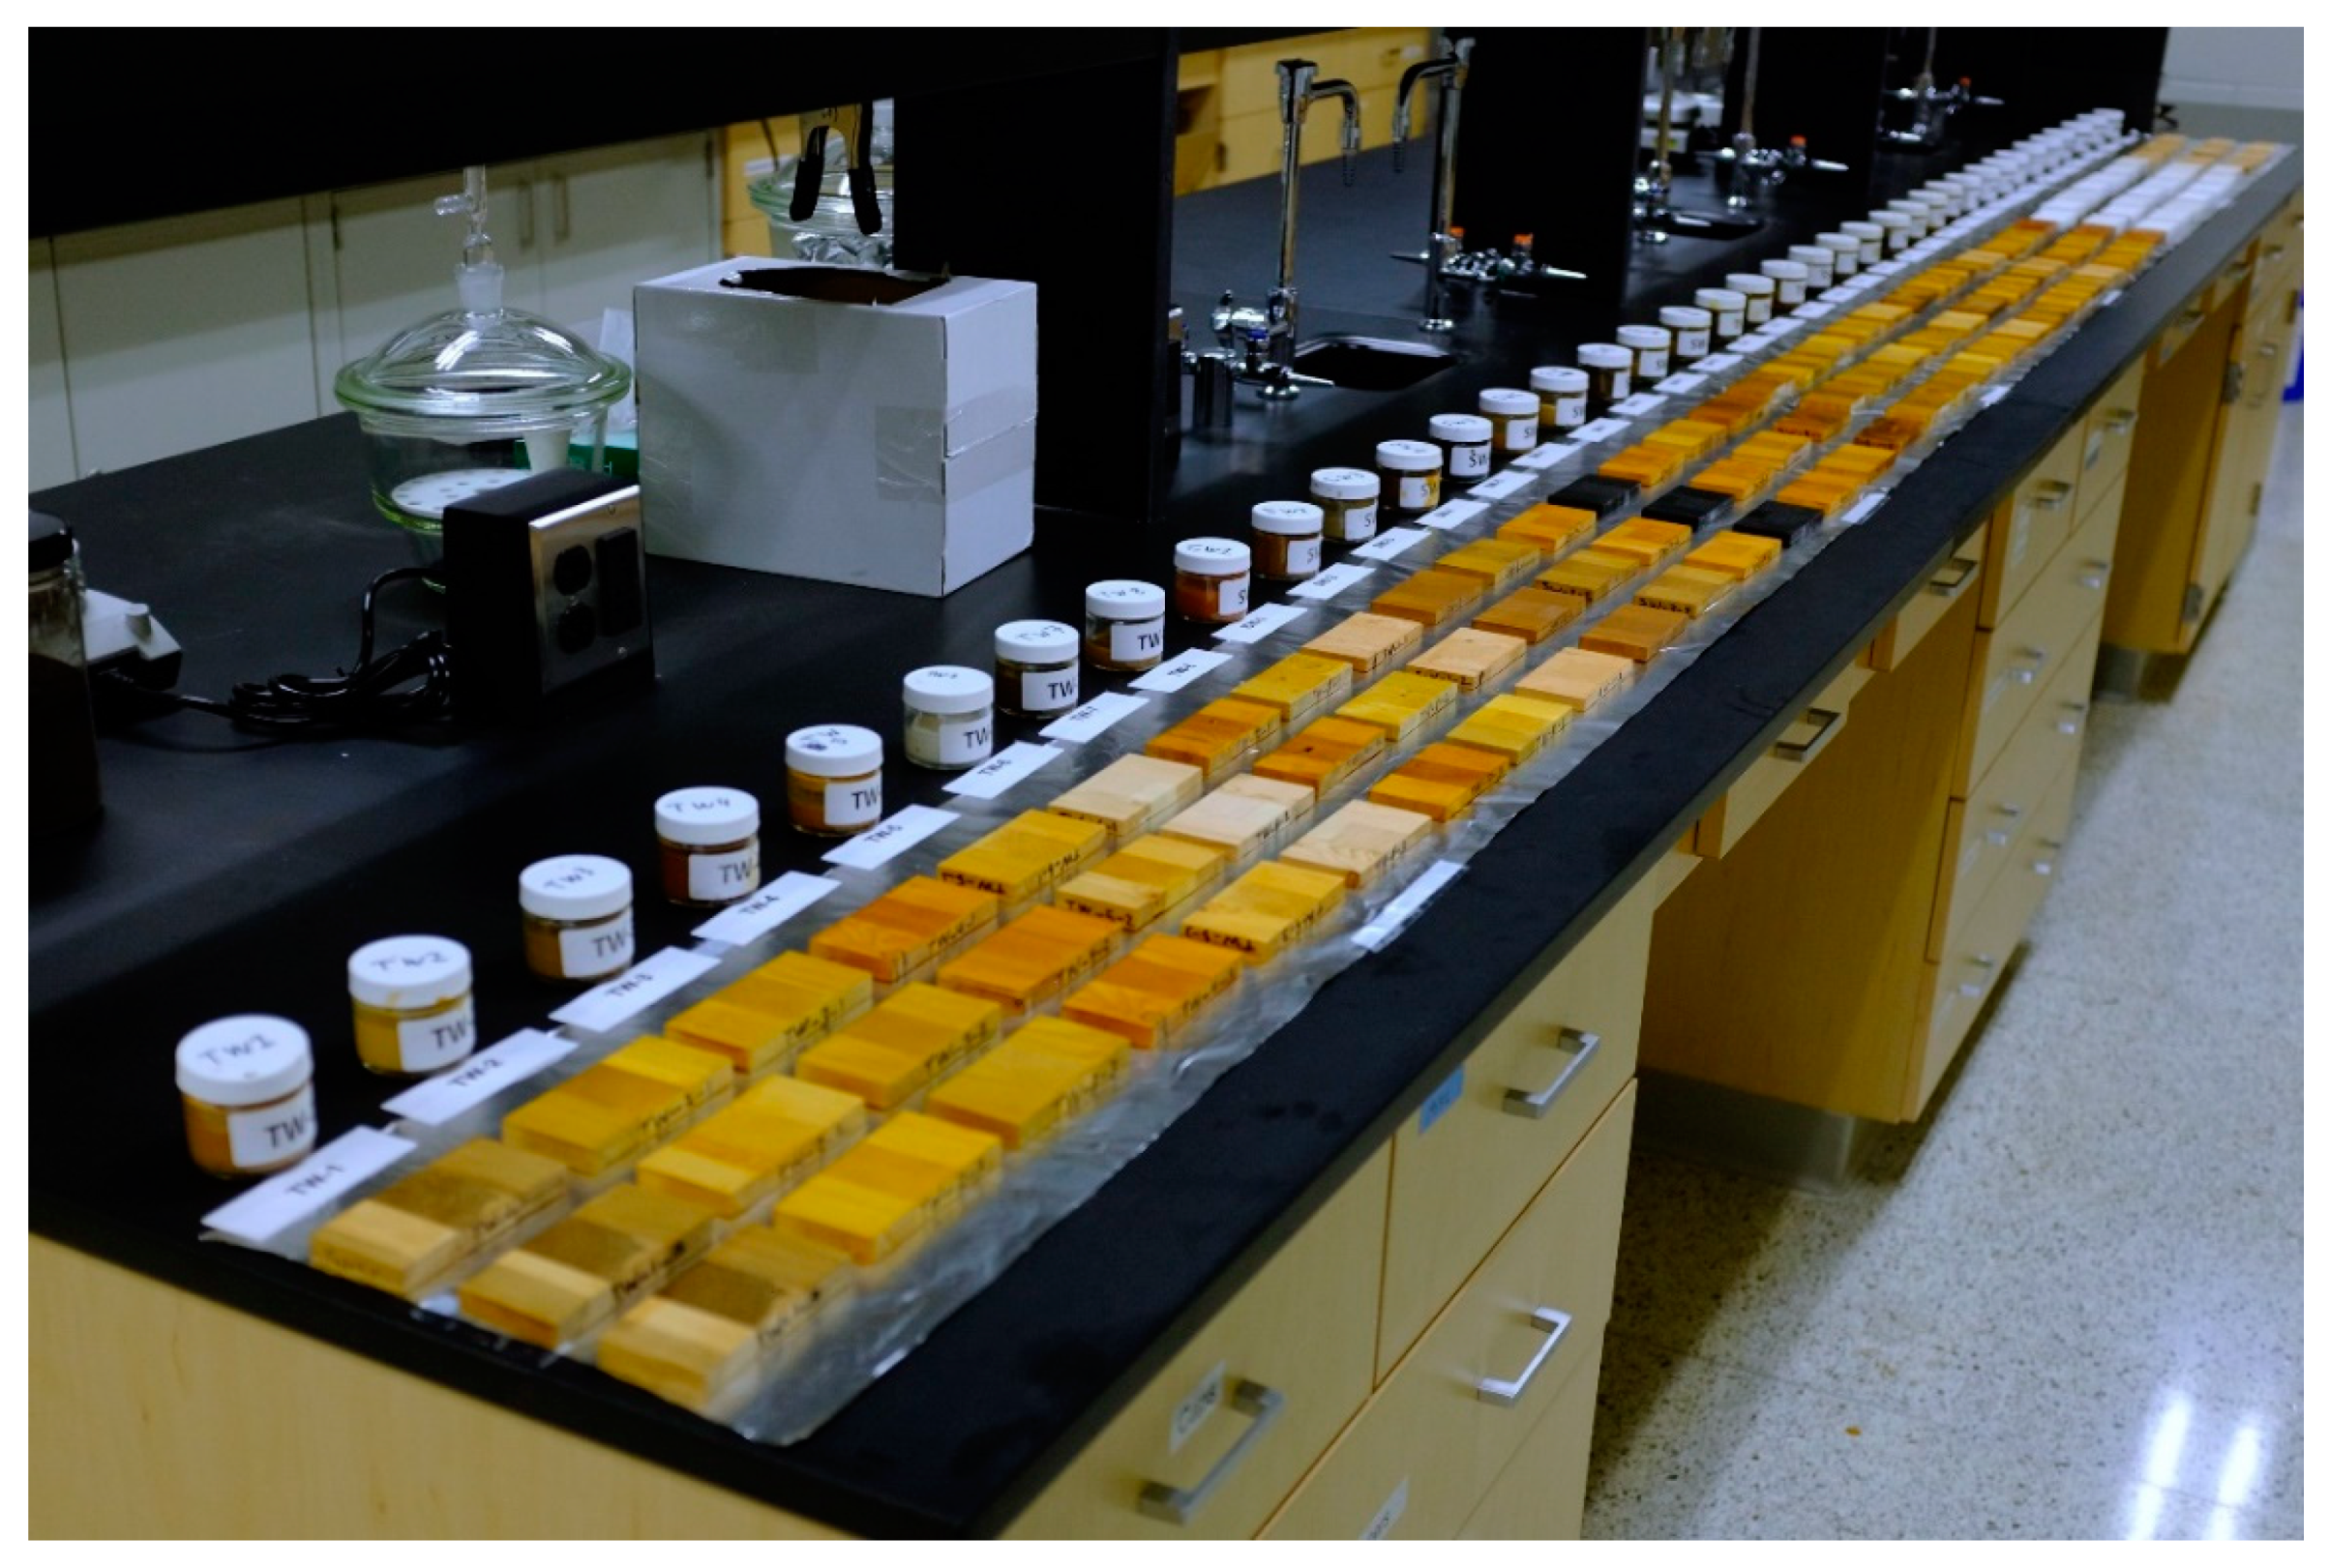
2.6. Water Immersion Test
For the water immersion test, small samples of commercially prepared cross-laminated timber (CLT) were used measuring 106 mm × 50 mm × 10.8 mm. The CLT, Douglas-fir wood samples were sanded with 120 grit sandpaper and cleaned before the application of coatings; 2.36 g of water-based coatings and 1.82 g of solvent-based coatings were applied to the CLT samples using a foam brush to achieve a consistent wet film thickness for all coating (152.4 µm/6 mils coating thickness). The amount of coatings needed was calculated based on the surface area of the wood sample and the average density of the water-based (1.1 g/m
3) and solvent-based (0.85 g/m
3) coatings. After one week of air drying (
Figure 5), samples were immersed in DI water (five replicates for each coating; the only three replicates that could fit on the surface are shown in
Figure 5.
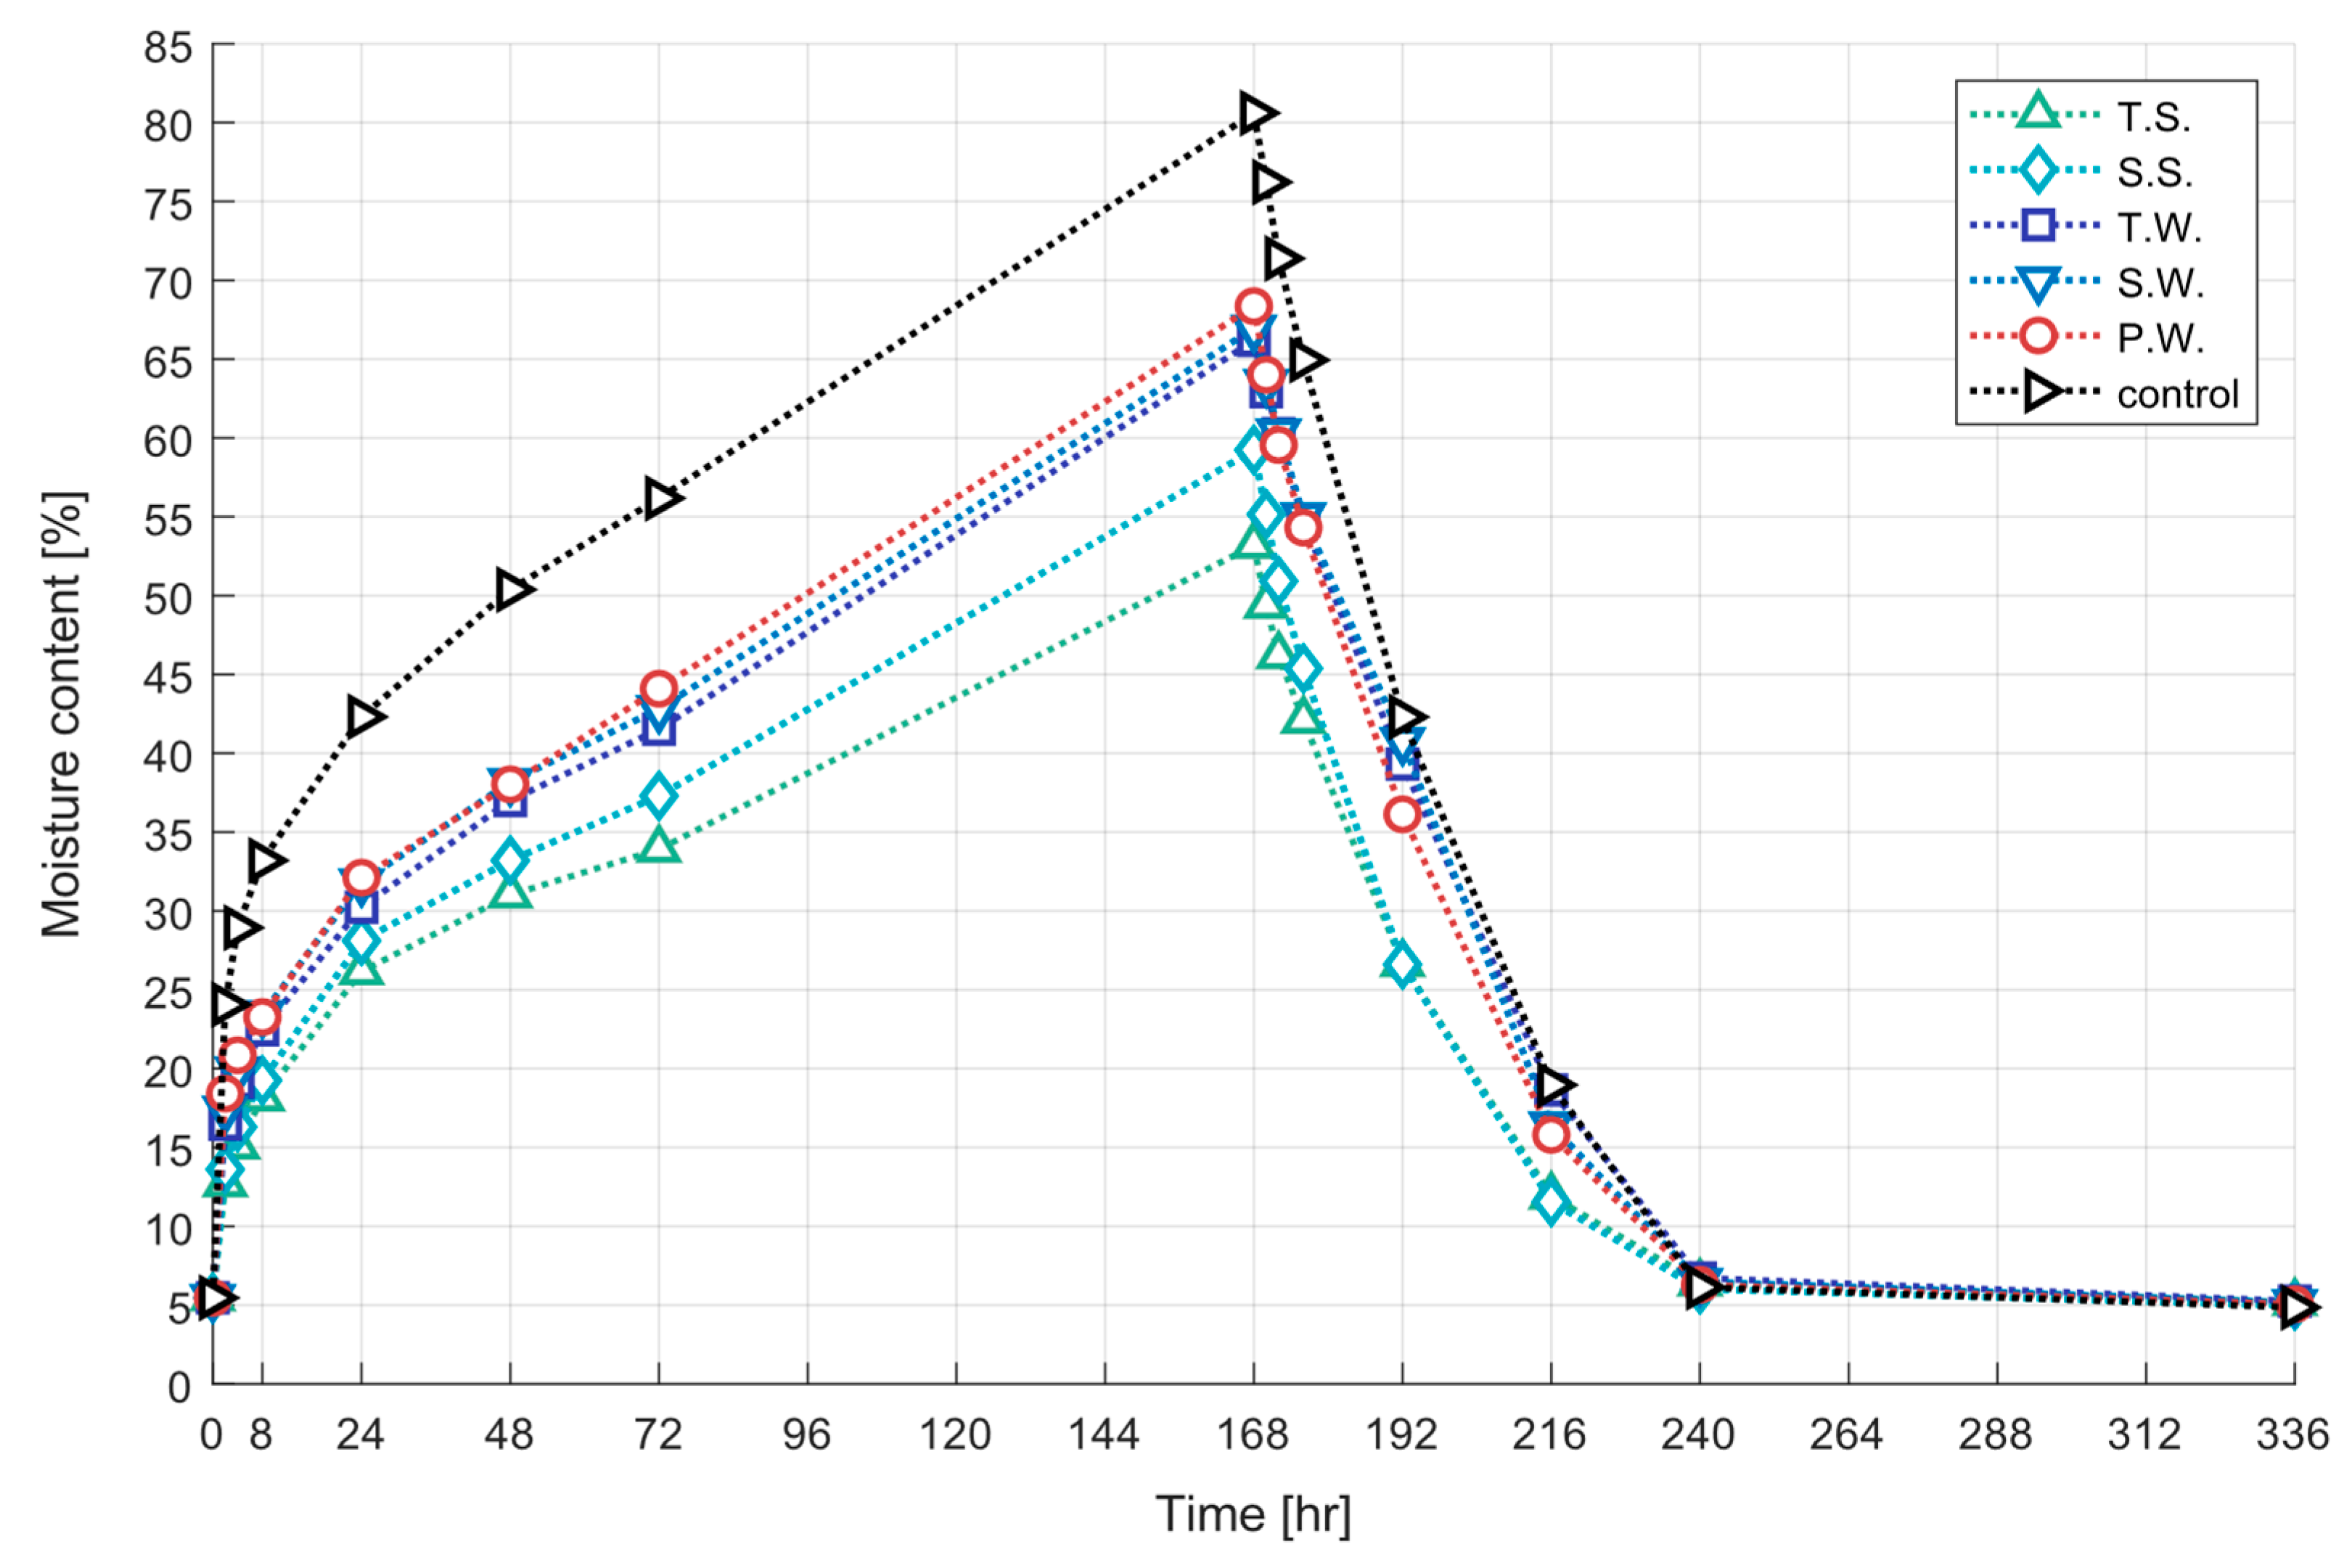
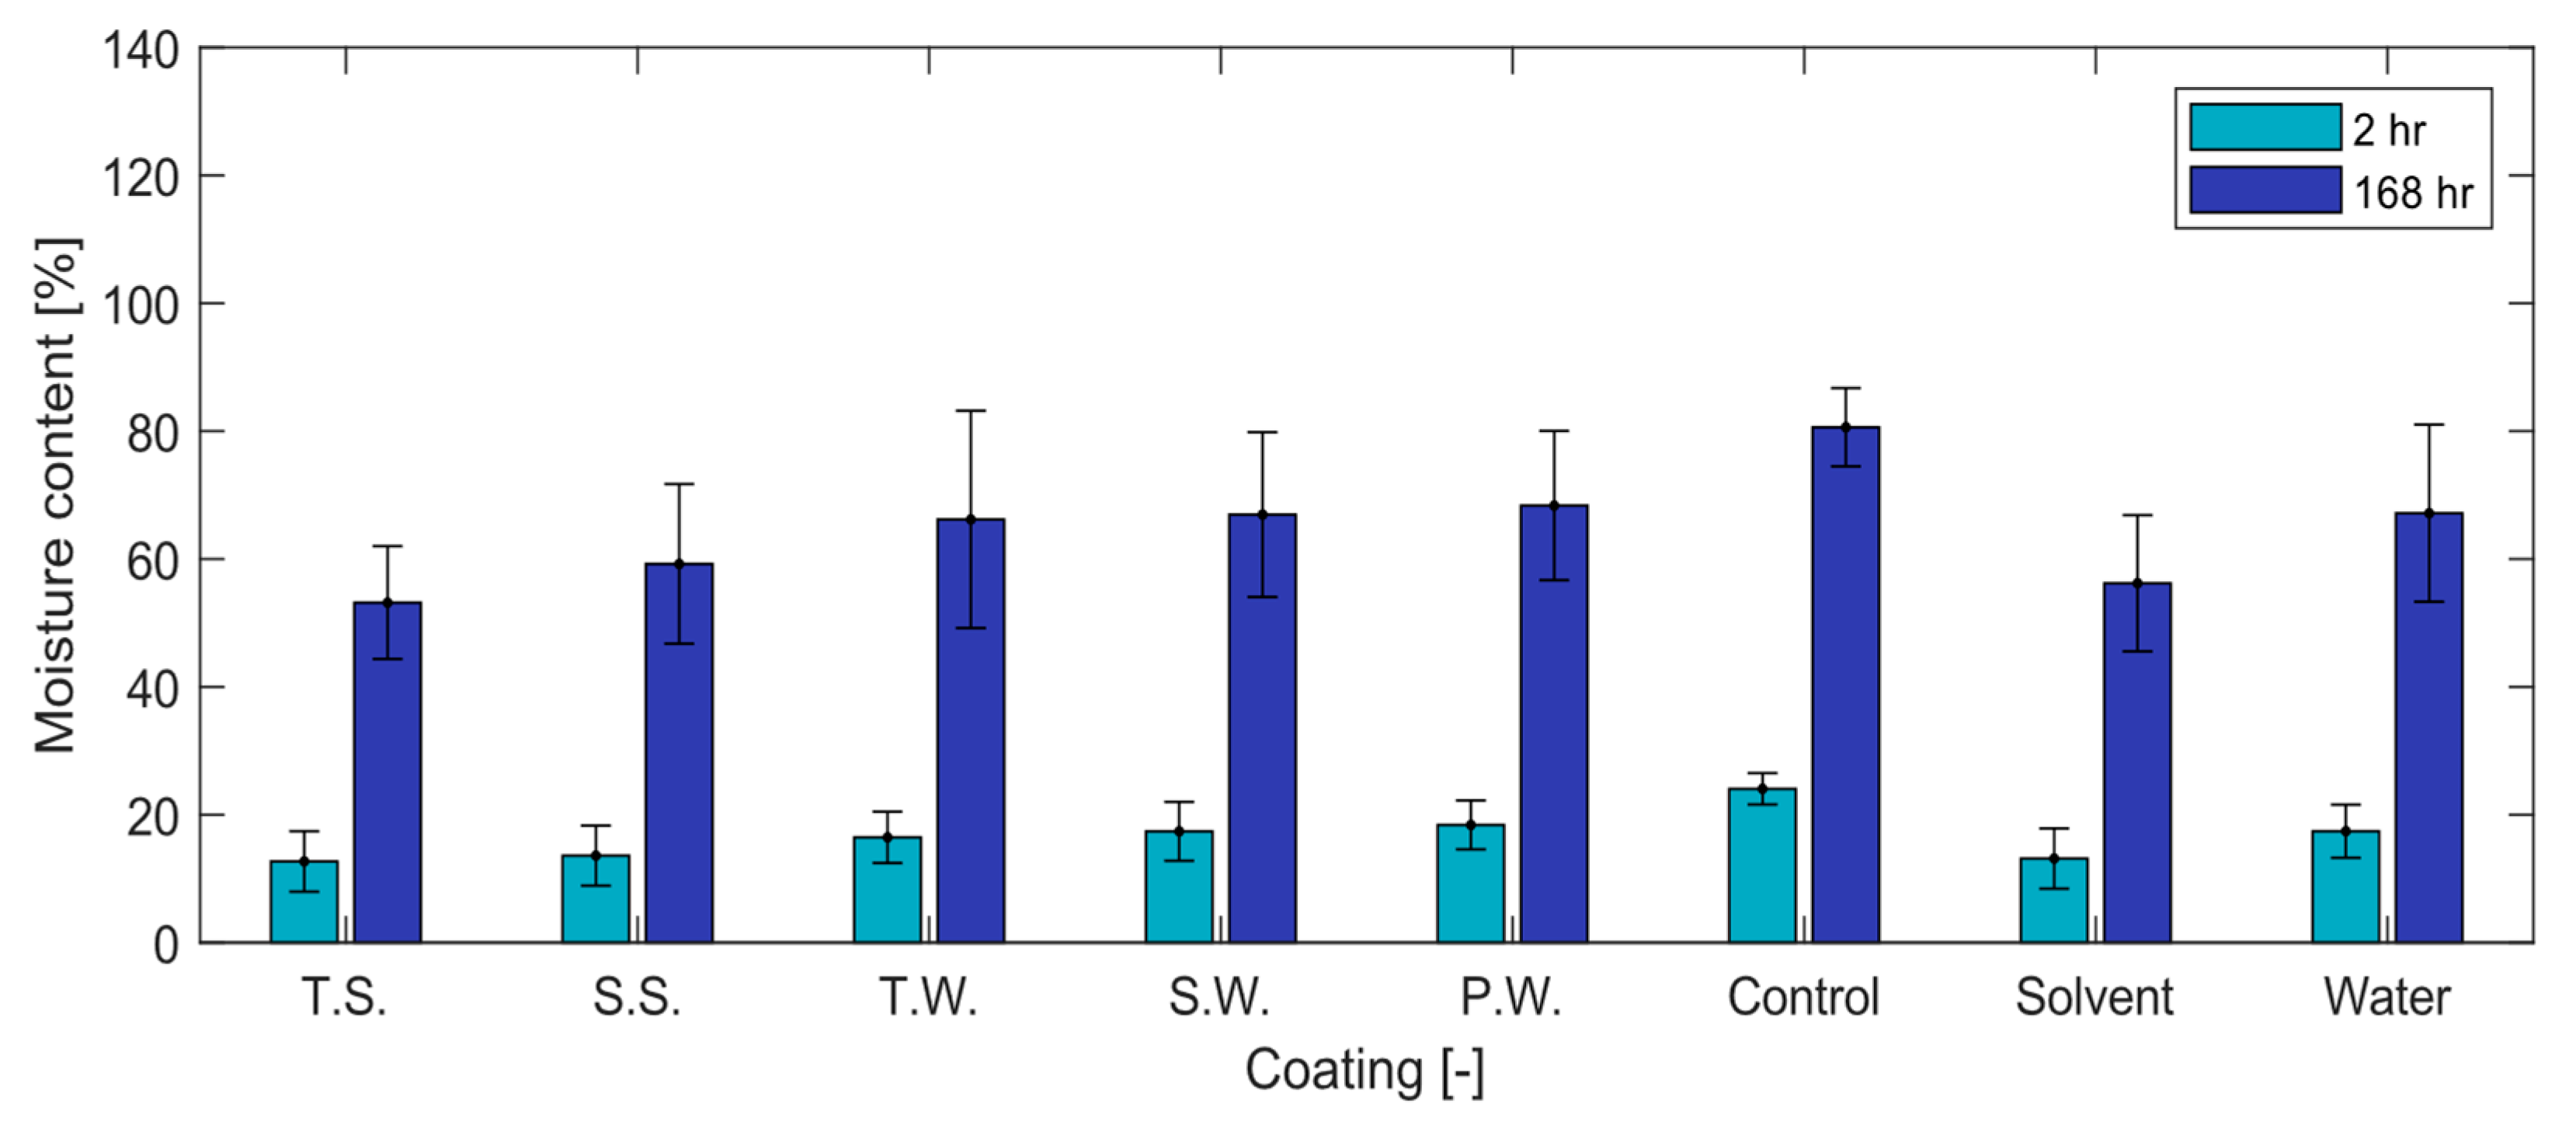
All coated and control (uncoated) wood samples were immersed in deionized water at room temperature (22 °C); their weights were measure before and after 2, 4, 8, 24, 48, 72, and 168 h. Each time, wood samples were taken out of the water (one set of 5 replicate samples at a time), and excess surface moisture was removed by a paper towel, the samples were weighed, and then they were immersed in the water again. After 168 h (7 days) of the water immersion test, all wood samples were removed from the water and placed on aluminum foil. Their weights were measured after the same time intervals of air drying to determine the efficacy of each coating on allowing the water vapor to escape from the coated-wood as a measure of water vapor permeability of each coating.
2.7. Data Analysis and Processing
The captured optical images were processed using custom-built code in MATLAB. Data processing was split into two sections: boundary detection and contact angle calculation.
2.7.1. Boundary Detection
To calculate a droplet contact angle, the average droplet diameter must be determined. To achieve this, the edge of the droplet must be distinguished from the wood substrate. Once the boundary is found, the droplet base area and subsequent average droplet diameter can be determined. In this work, two different boundary techniques were used: Canny detection (water-based coatings) and calibration subtraction (solvent-based coatings).
The traditional boundary detection of droplets and bubbles is achieved using a thresholding technique in a side-view orientation (see
Figure 1a) with backlighting [
27,
38]. Every pixel of a captured image has an associated magnitude. In a grayscale image, the magnitude varies between 0 and 1, with each denoting black and white, respectively. In the case of a side-view orientation (
Figure 1a), an LED light behind the bubble or droplet occupies the entirety of the image background, thus giving a uniform field for contrast and simplifying the boundary detection process.
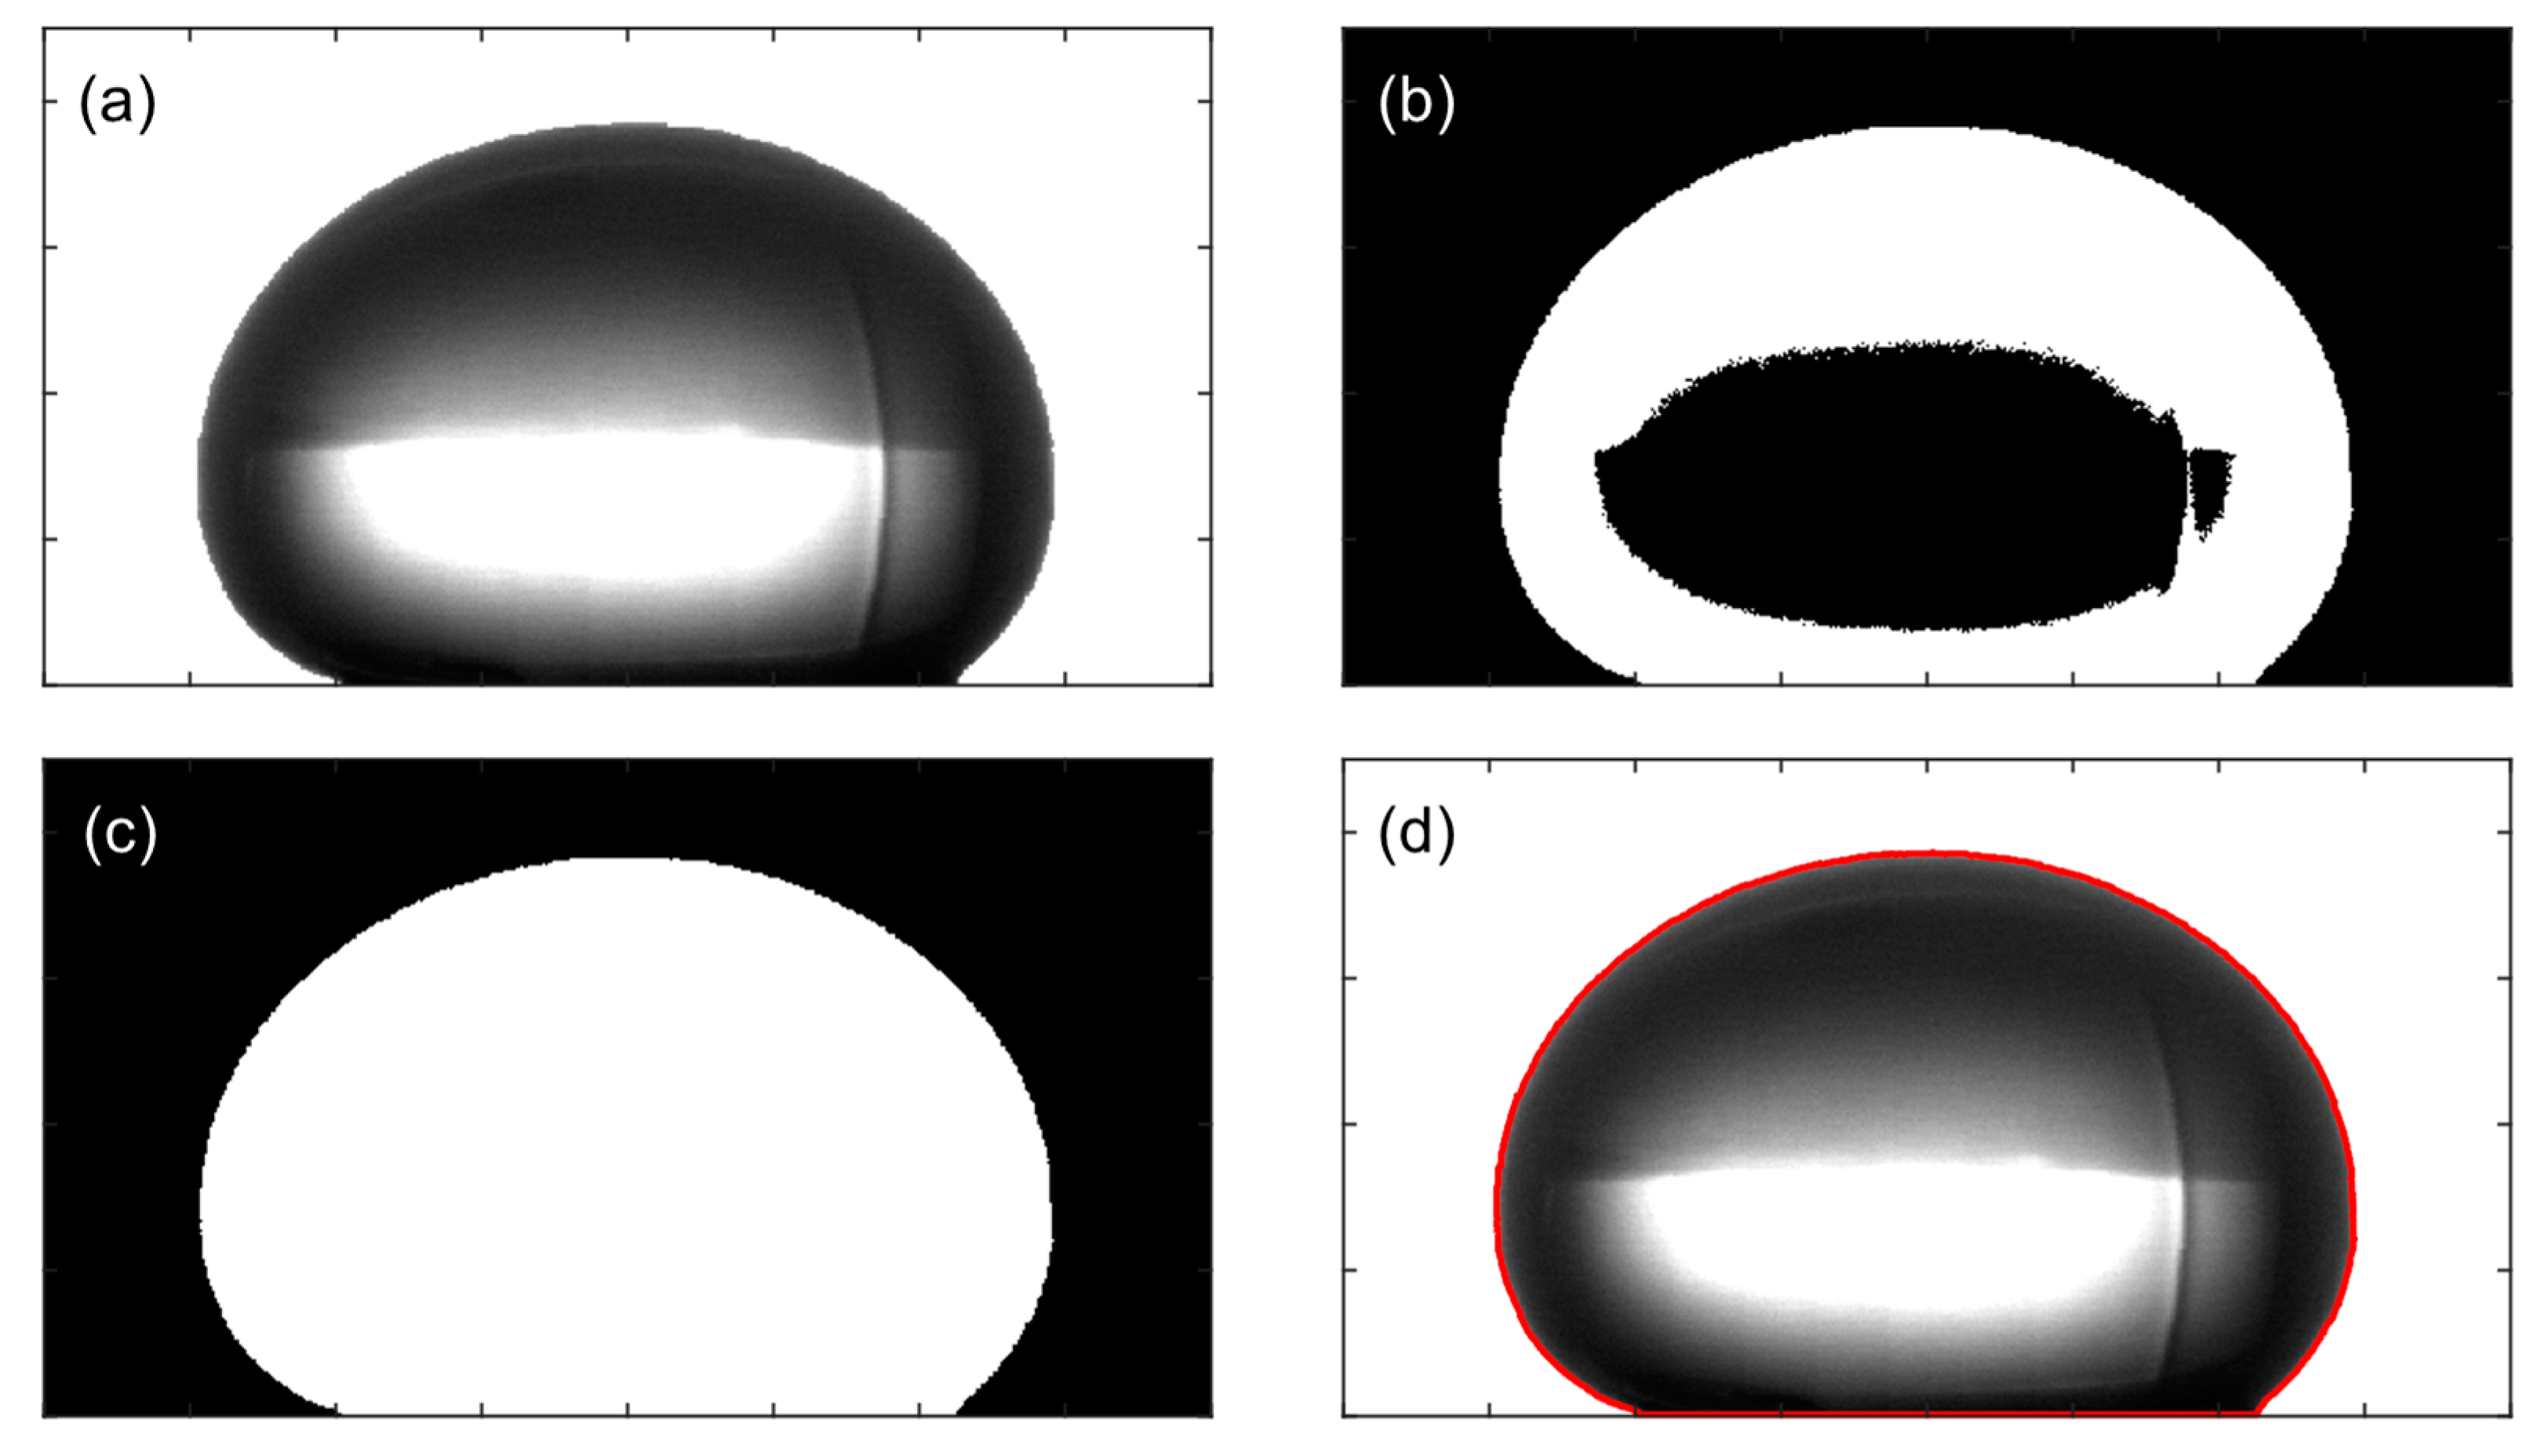
Figure 6 shows the optical image processing methodology for the outlined approach. First, the raw image is converted to grayscale (
Figure 6a). The image is then binarized using the Otsu method to threshold the image into two sections (
Figure 6b). Then the image is filled, and the droplet is isolated by finding the largest area (
Figure 6c). Once the droplet shape has been determined, the boundary is traced, and the pixel size is applied to scale the image correctly (
Figure 6d).
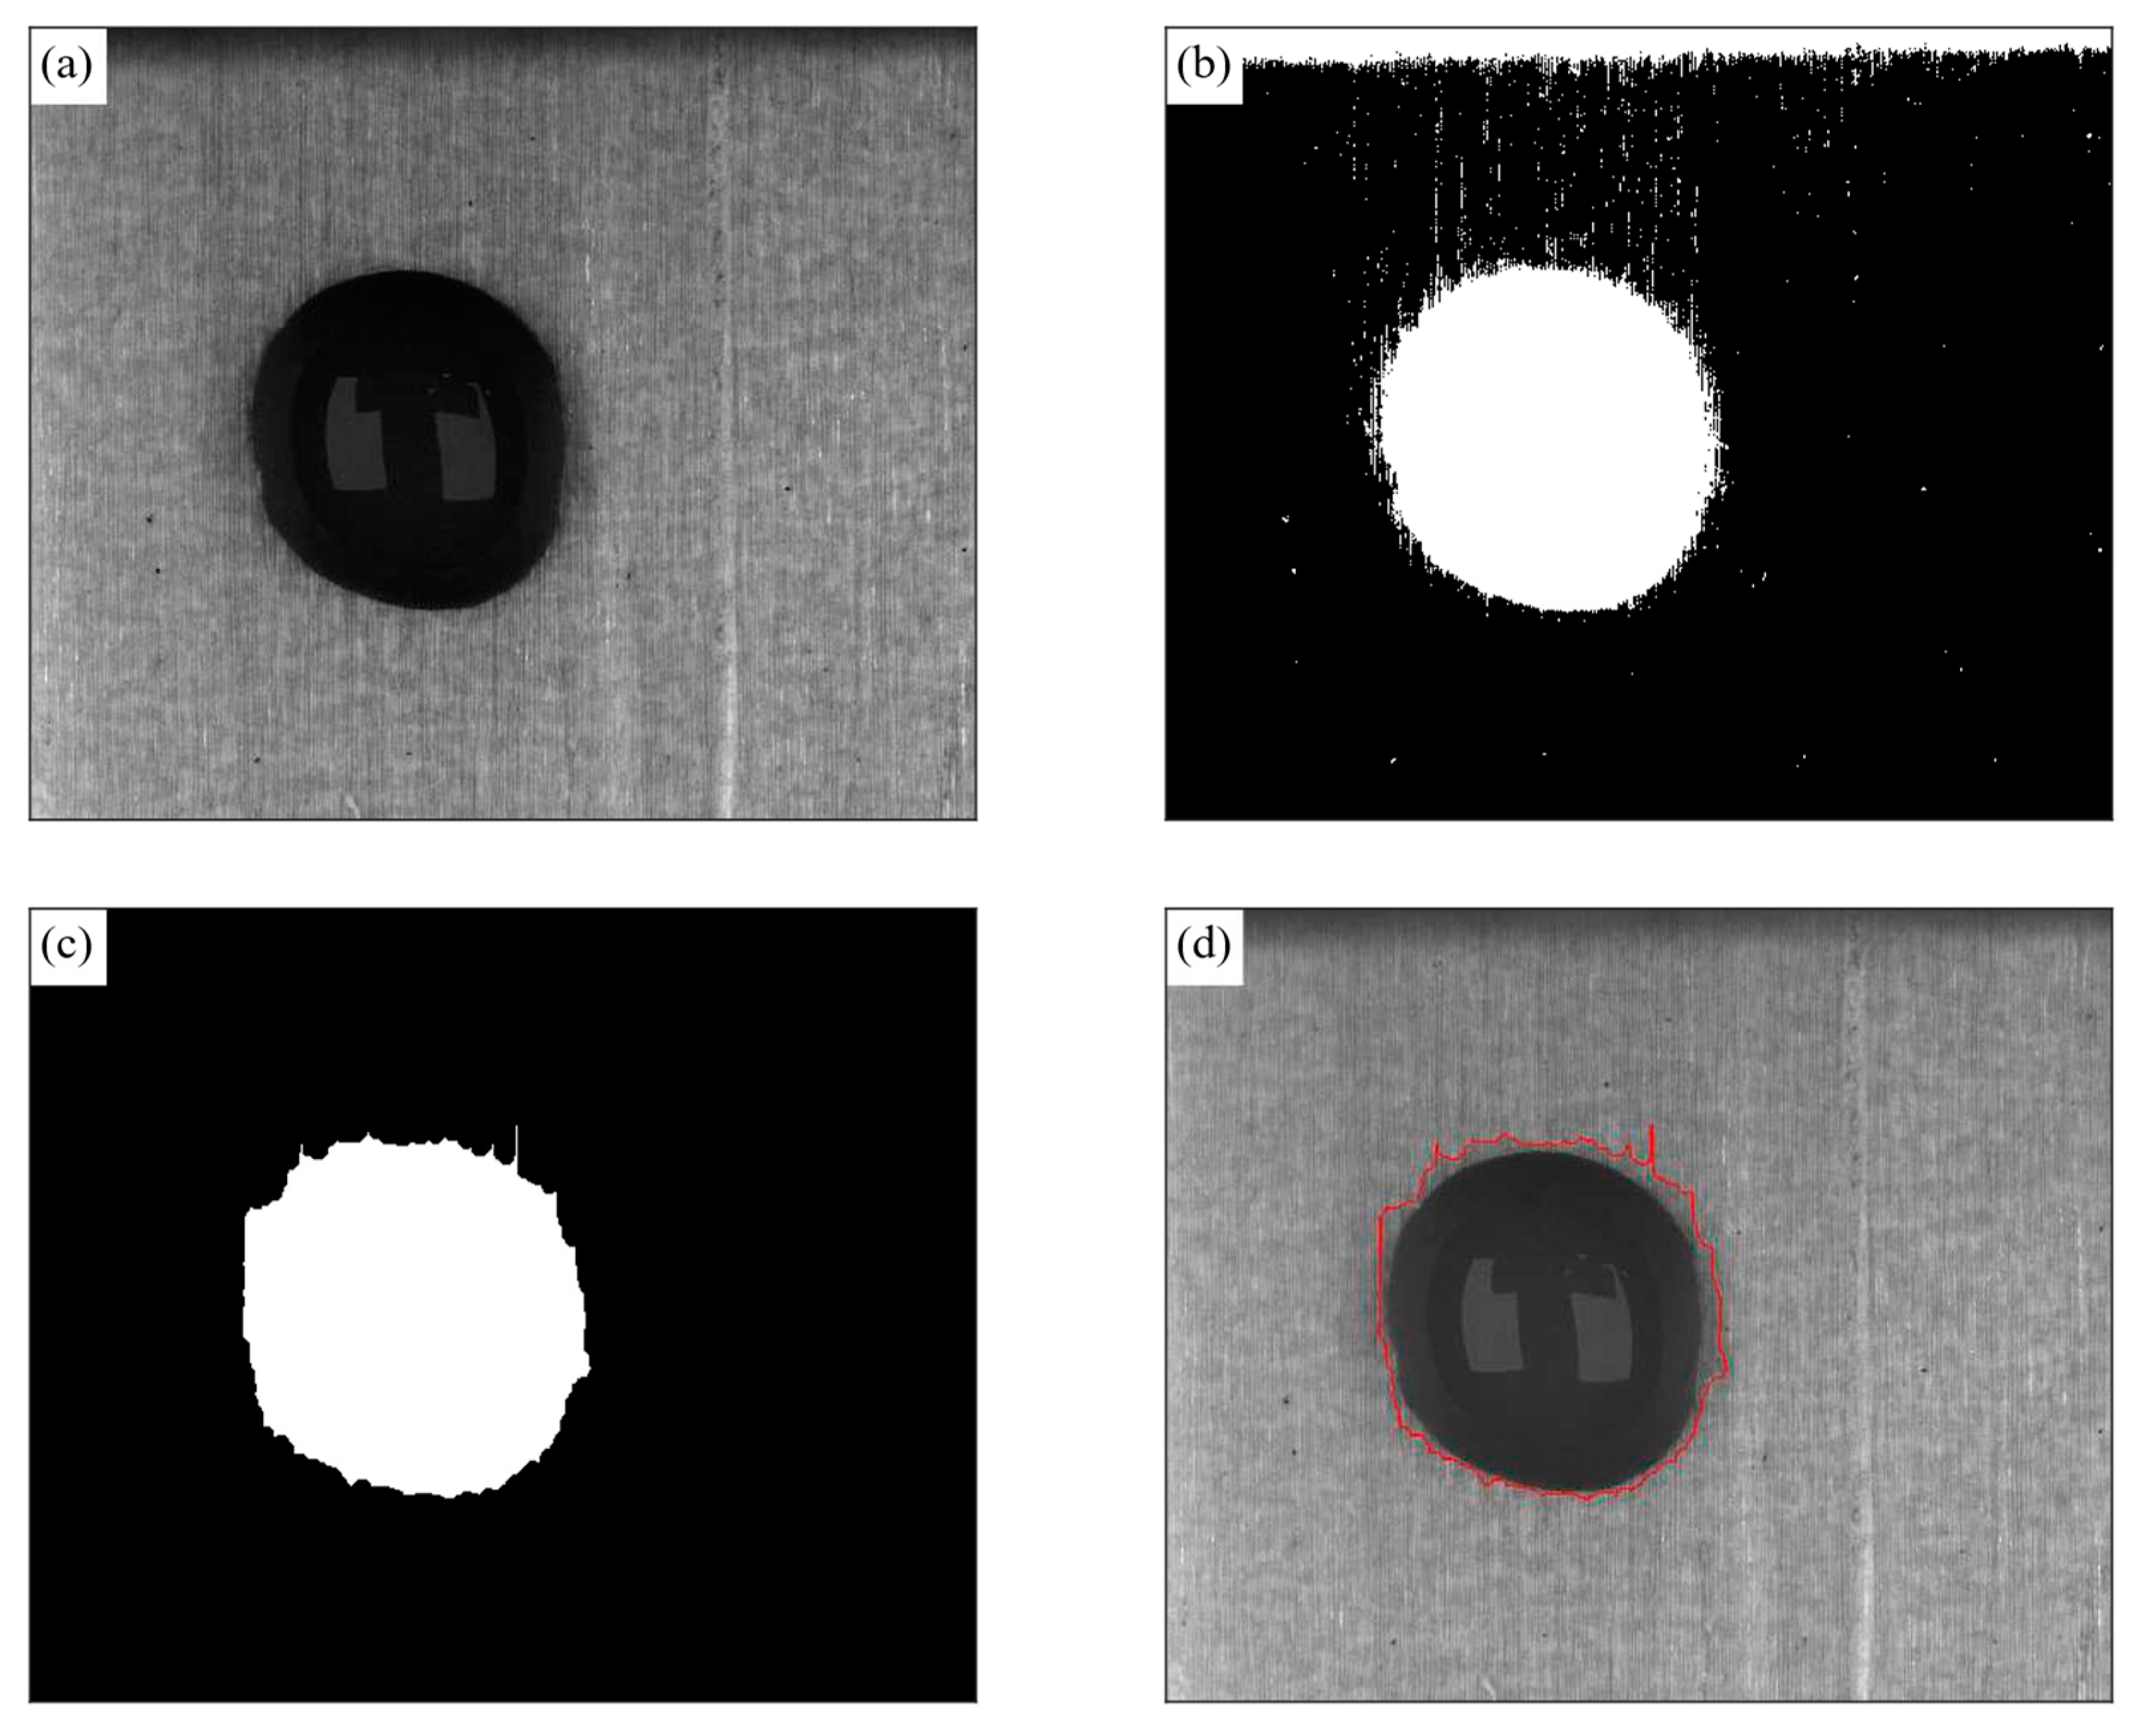
For a coating droplet on a wood surface, the side-view approach is not feasible for two main factors. First, a coating droplet on a wood surface is generally non-axisymmetric due to the anisotropic nature of the substrate, and it typically spreads more along the direction of wood grain than across the grain. Thus, the implementation of a top–down optical configuration is required (see
Figure 1b). In this orientation, the wood substrate is the background and the illumination of the imaging area is from above. The sufficient lighting of the droplet and substrate is required to reduce image noise. The combination of the top-down configuration and the natural appearance and texture of the wood substrate can distort the boundary detection between the coating and the wood when using the traditional thresholding technique. The incorrect detection of the droplet boundary can occur when the droplet and the adjacent surface are close in pixel intensity, as shown in
Figure 7.
Figure 7 shows a coating droplet on a wood substrate at various stages of image processing when using the thresholding approach. First, the raw image is converted to grayscale (
Figure 7a). The raw image is binarized using the Otsu method to threshold the image into two sections (
Figure 7b). Then, the image is filled, and the droplet is isolated by finding the largest area (
Figure 7c). Finally, the boundary is traced and applied over the original image (
Figure 7d).
Wood is a complex, non-homogeneous surface; the natural grain of the woods results in a non-uniform background with the potential to have lighter and darker components than the characterized droplet itself. Due to the similar intensity of the wood grain directly adjacent to the droplet–wood boundary, the initial detection with the Otsu method results in a distorted boundary, resulting in an inaccurate average droplet diameter and, subsequently, calculated contact angle. This case can frequently occur due to the extensive possible combinations of coatings and woods.
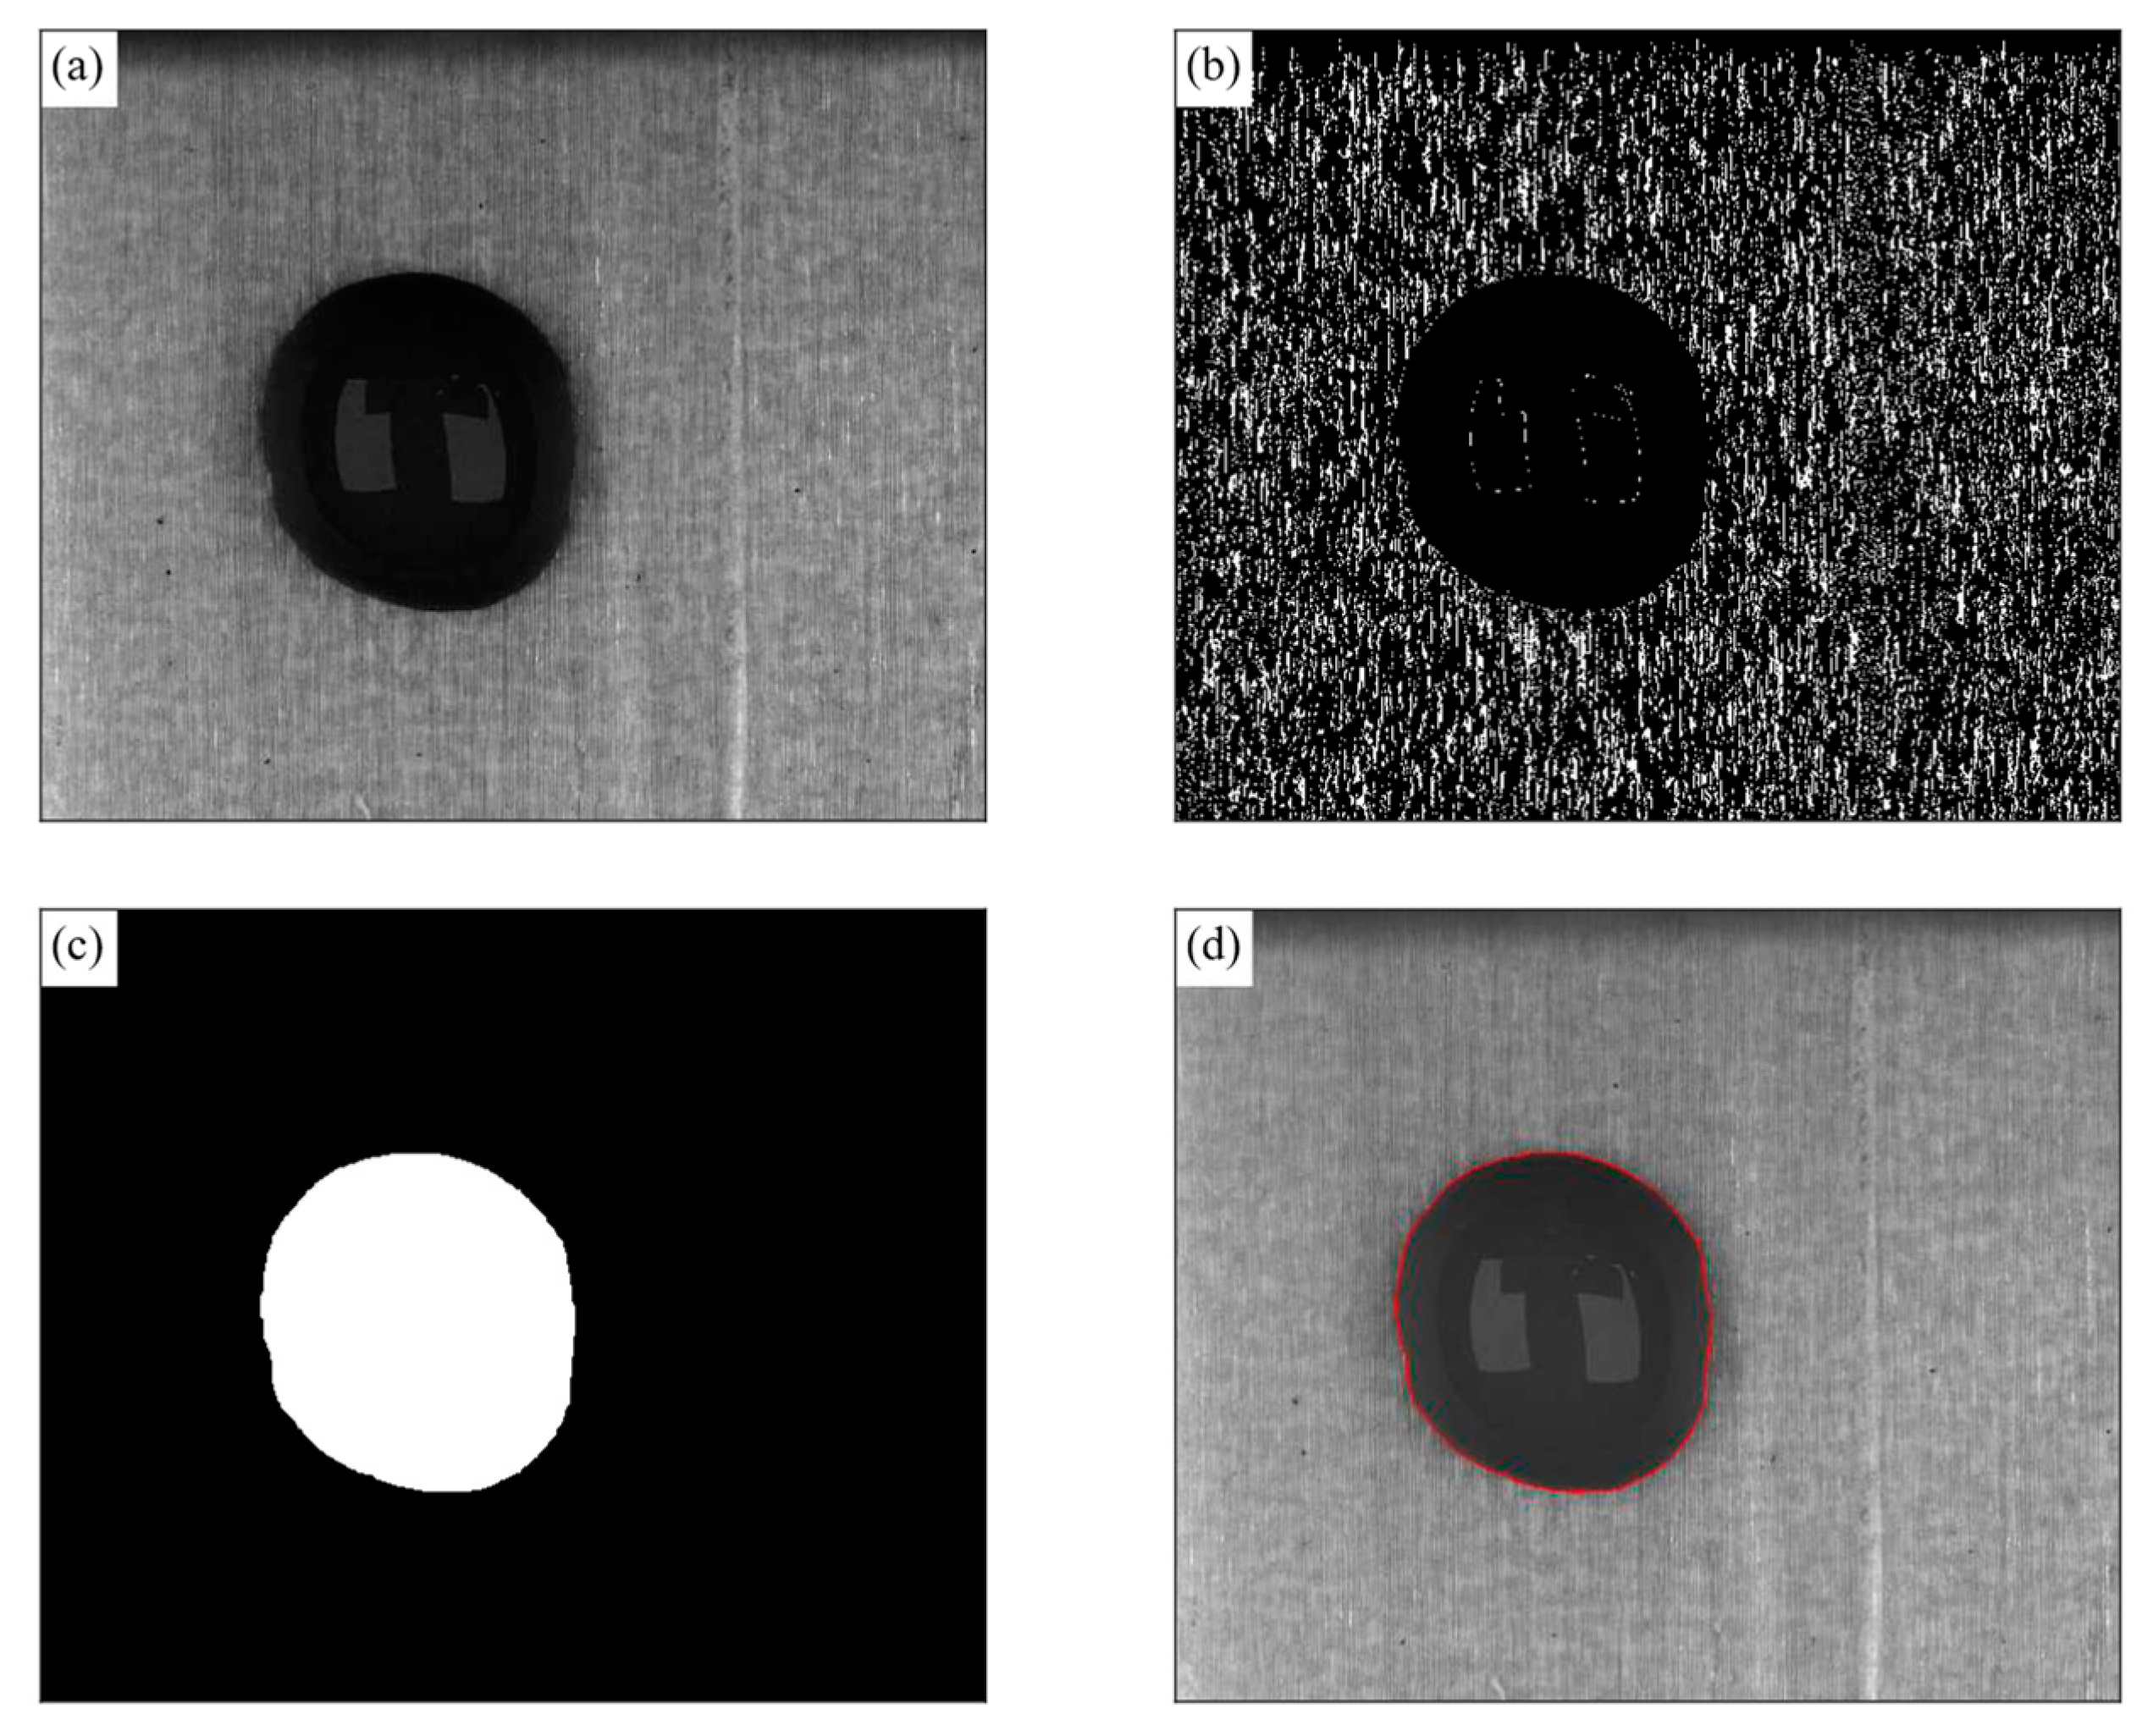
In the present work, the Otsu thresholding method was replaced with the Canny edge detection method. The Canny edge detection method characterizes the pixel intensity gradients across an image. For wood, due to its inherent non-homogeneous nature, there are rapidly changing gradients of pixel intensity across the surface, whereas for a droplet of sufficient opaqueness, the pixel field is comparatively uniform. This method utilizes the natural gradients of the wood surface to distinguish it from the droplet. The Canny technique of edge detection is shown in
Figure 8 and is the same droplet–wood combination as discussed in
Figure 7. Again, the raw image was converted to grayscale (
Figure 8a). The image was binarized using the Canny edge detection method to divide the image into two sections (
Figure 8b). The image was filtered using morphological closing, the image was then inverted, and then the droplet was isolated by finding the largest area (
Figure 8c). The boundary was then traced and applied over the original image (
Figure 8d). A droplet with sufficient opaqueness will have minimal gradients, allowing for a clear separation of the wood and droplet using this method. By comparing
Figure 7d and
Figure 8d, the improved tracking of the droplet boundary when using the proposed method can be seen.
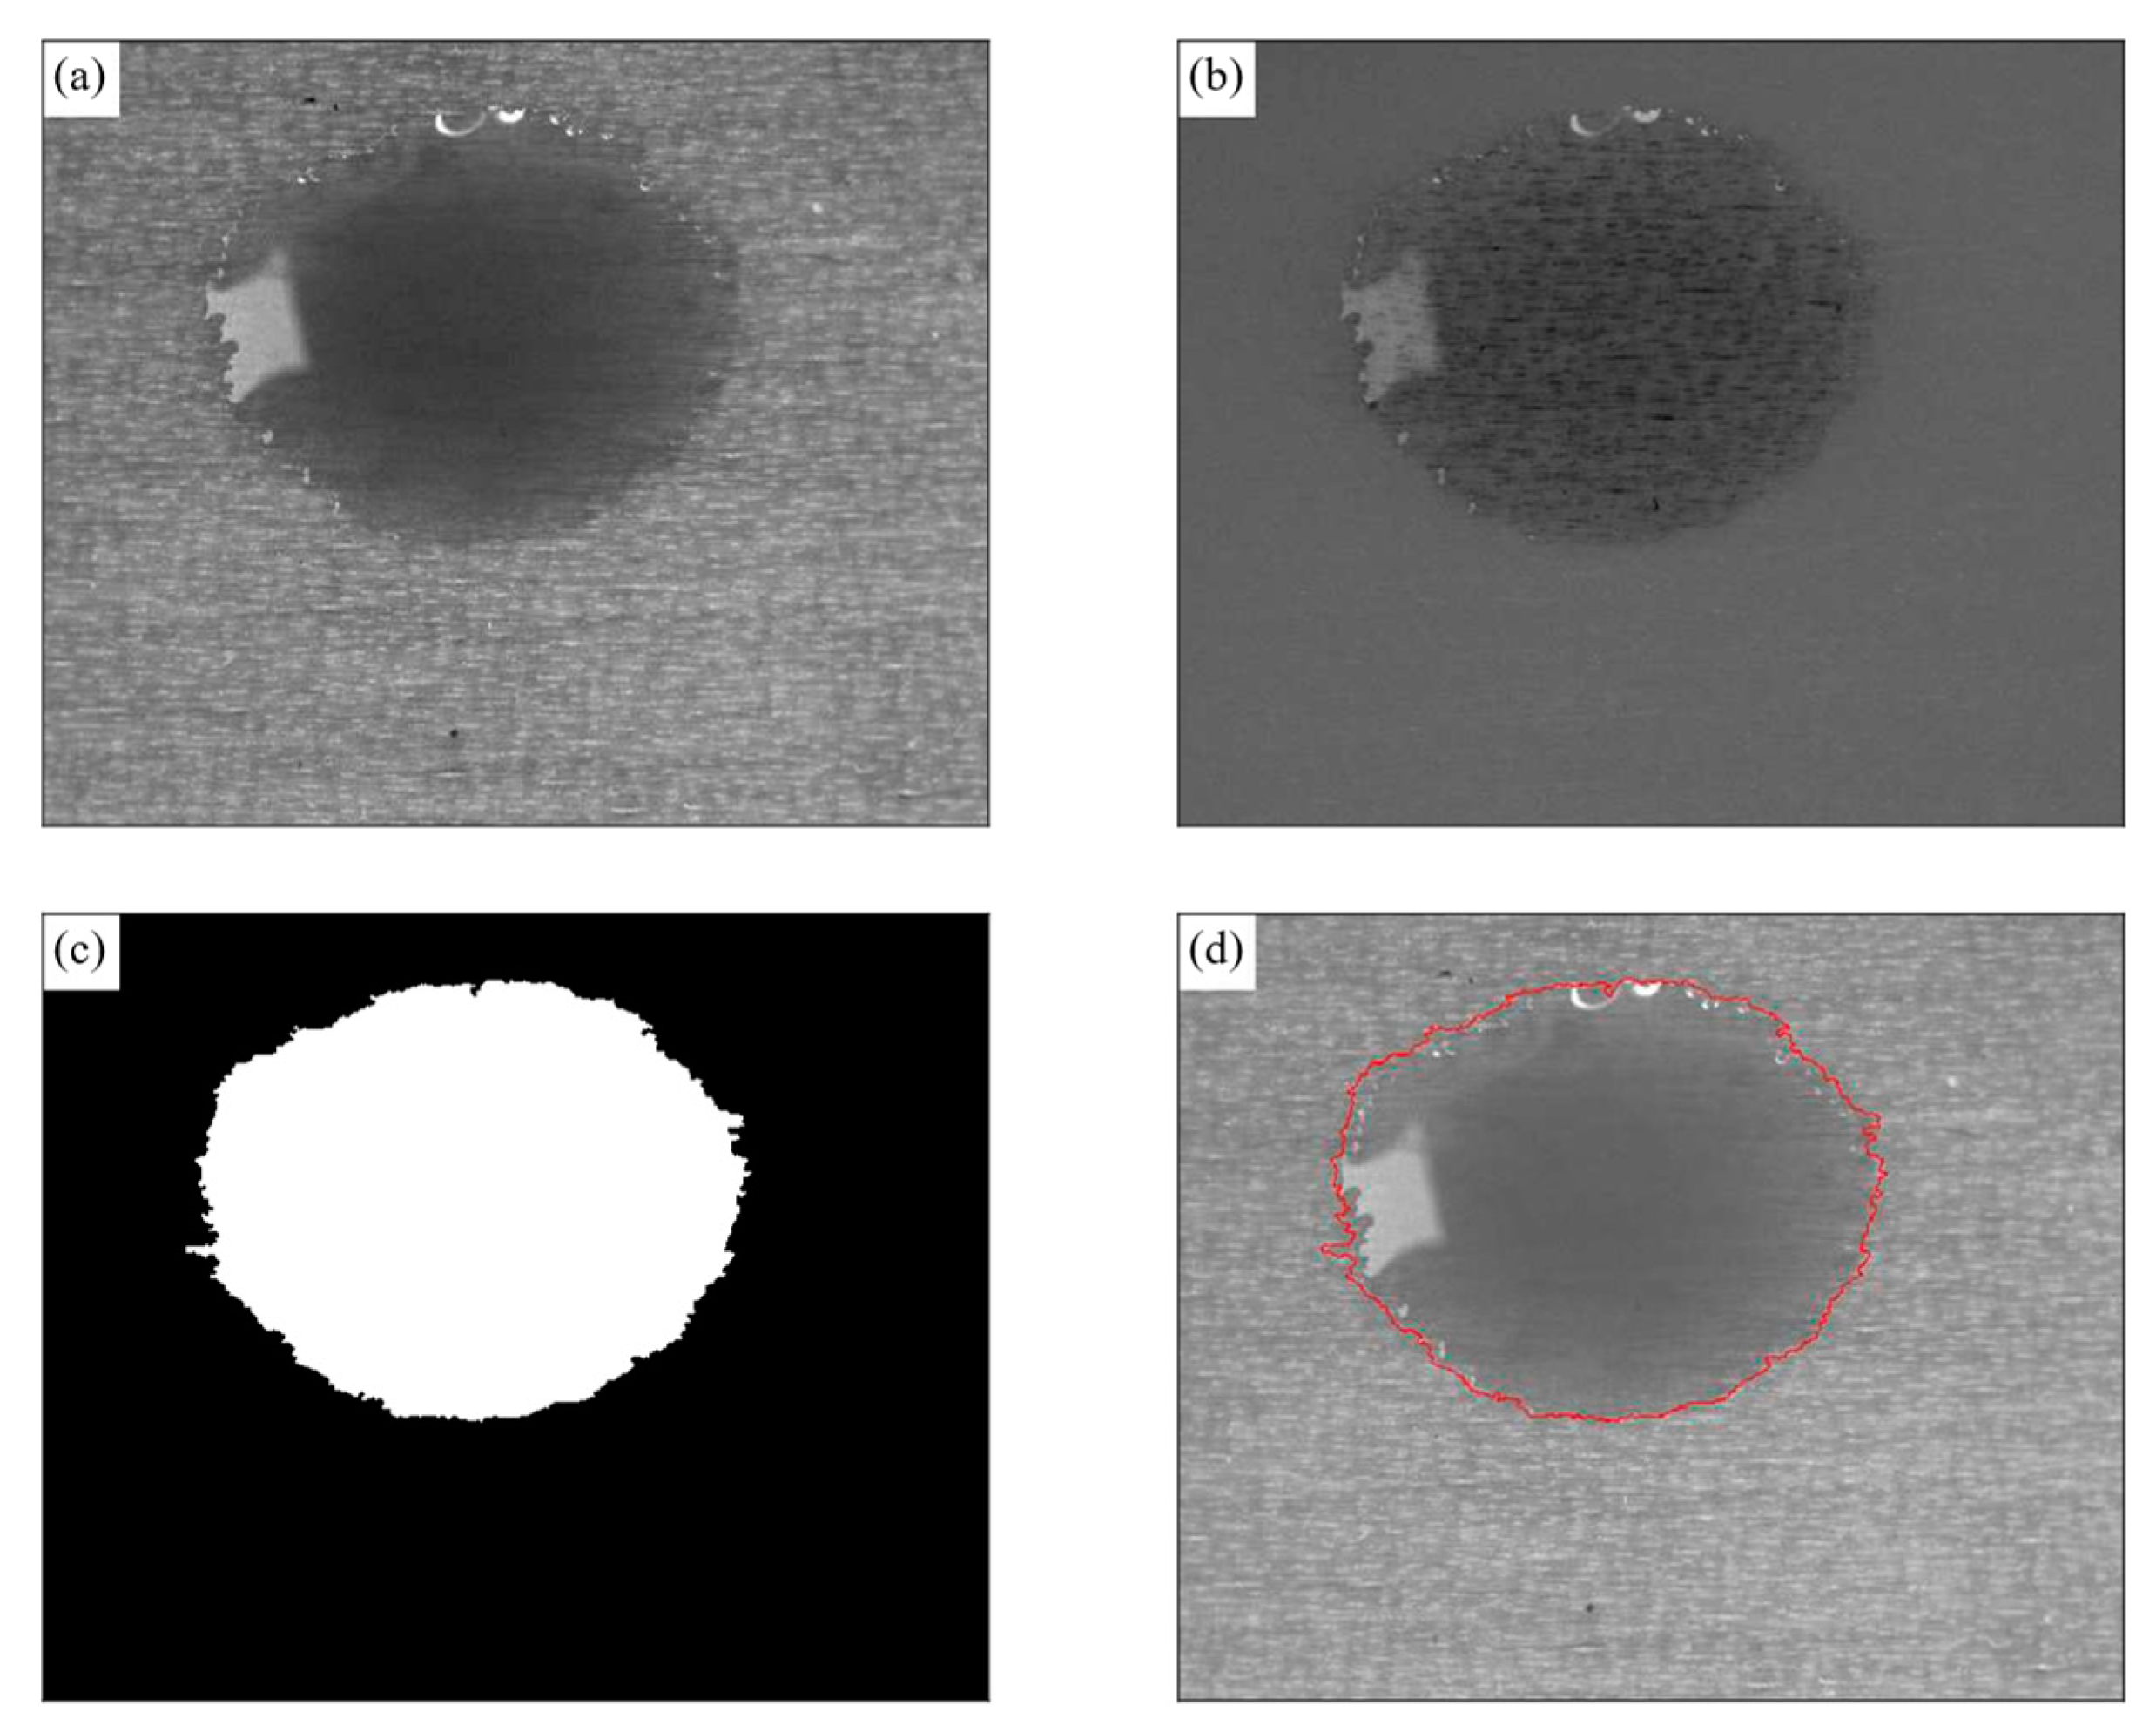
A second boundary detection method was required to process the solvent-based coatings characterized in this study. Solvent-based coatings typically spread to a thin transparent layer that disrupts the Canny detection method. An example of the droplet boundary detection using the calibration subtraction method is shown in
Figure 9. This approach utilizes an initial set of no drop calibration images that are averaged and then subtracted from the investigated image to distinguish the droplet from the wood background (
Figure 9b). A vital component of this technique is to ensure that the camera and the substrate do not change position during droplet placement and data acquisition. The Canny method has the advantage of requiring no set-up in distinguishing the droplet boundary.
2.7.2. Contact Angle Calculation
The local mechanical equilibrium between each point of the droplet liquid–gas interface can be expressed by the Young–Laplace equation. For a given volume (
), coating and base diameter
only one solution of the Young–Laplace equation exists. Accounting for only hydrostatic effects, this equation is given by [
39]:
where
is the measured surface tension of the coating;
is the apex radius of the droplet;
is gravity;
and
are the density of the coating and ambient air surroundings, respectively; z
0 is the reference height taken as the droplet height;
z is the height of the point on the interface being evaluated; and
is the local curvature of the droplet, given by
, where
and
are the principal radii of the droplet at any point on the liquid–gas interface. The initial droplet height and apex radius are estimated as a spherical cap of the same base diameter. Equation (1) evaluates the balance between the pressure difference across the interface and the stress in the interface expressed as the product of the surface tension and the curvature.
Knowing the base diameter and droplet volume, along with working fluid properties such as density and surface tension, one can calculate the droplet shape according to the Young–Laplace equation. Similar to Gibbons et al. [
27], an iterative method was employed to calculate the droplet interface profile. The resultant droplet volume of the calculated Young–Laplace curve was compared with that of the experimental data. The tip curvature and height were then adjusted based on this volume ratio, maintaining a fixed base diameter. This process continued until the Young–Laplace solution volume converged to that of the experimental data. A difference of < 0.01 µL was set as the threshold value. An example of the boundary calculated from the Young–Laplace equation is shown in
Figure 2a,b. From the calculated boundary, a number of essential parameters such as droplet height (
), contact angle (θ
, interfacial areas, and the radii of curvature could be determined. These parameters are shown in
Figure 2a,b.
Only one solution of the Young–Laplace equation exists for a given volume and calculated diameter. This method can also be used to solve droplets with θ > 90. In this case, instead of inputting the base diameter, the maximal diameter of the droplet was used, and the contact angle was calculated in a similar iterative manner as above.
This research was differentiated from previous work by Baptista et al. [
33], Erbil et al. [
34], and Mchale et al. [
35] in its more straightforward application in the real world case and the description of an intelligent boundary detection technique that utilized the natural grain of the wood that also accounted for cases where the coating and wood substrate were similar in color and appearance. The presented technique only requires one camera compared to the three of Baptista et al. and two of Erbil et al. and Mchale et al. The present approach can be employed in cases where comparable droplet geometric lengths and characteristic capillary lengths are observed where gravitational forces dominate over the surface tension effect, such as in solvents with low surface tension properties.
4. Conclusions
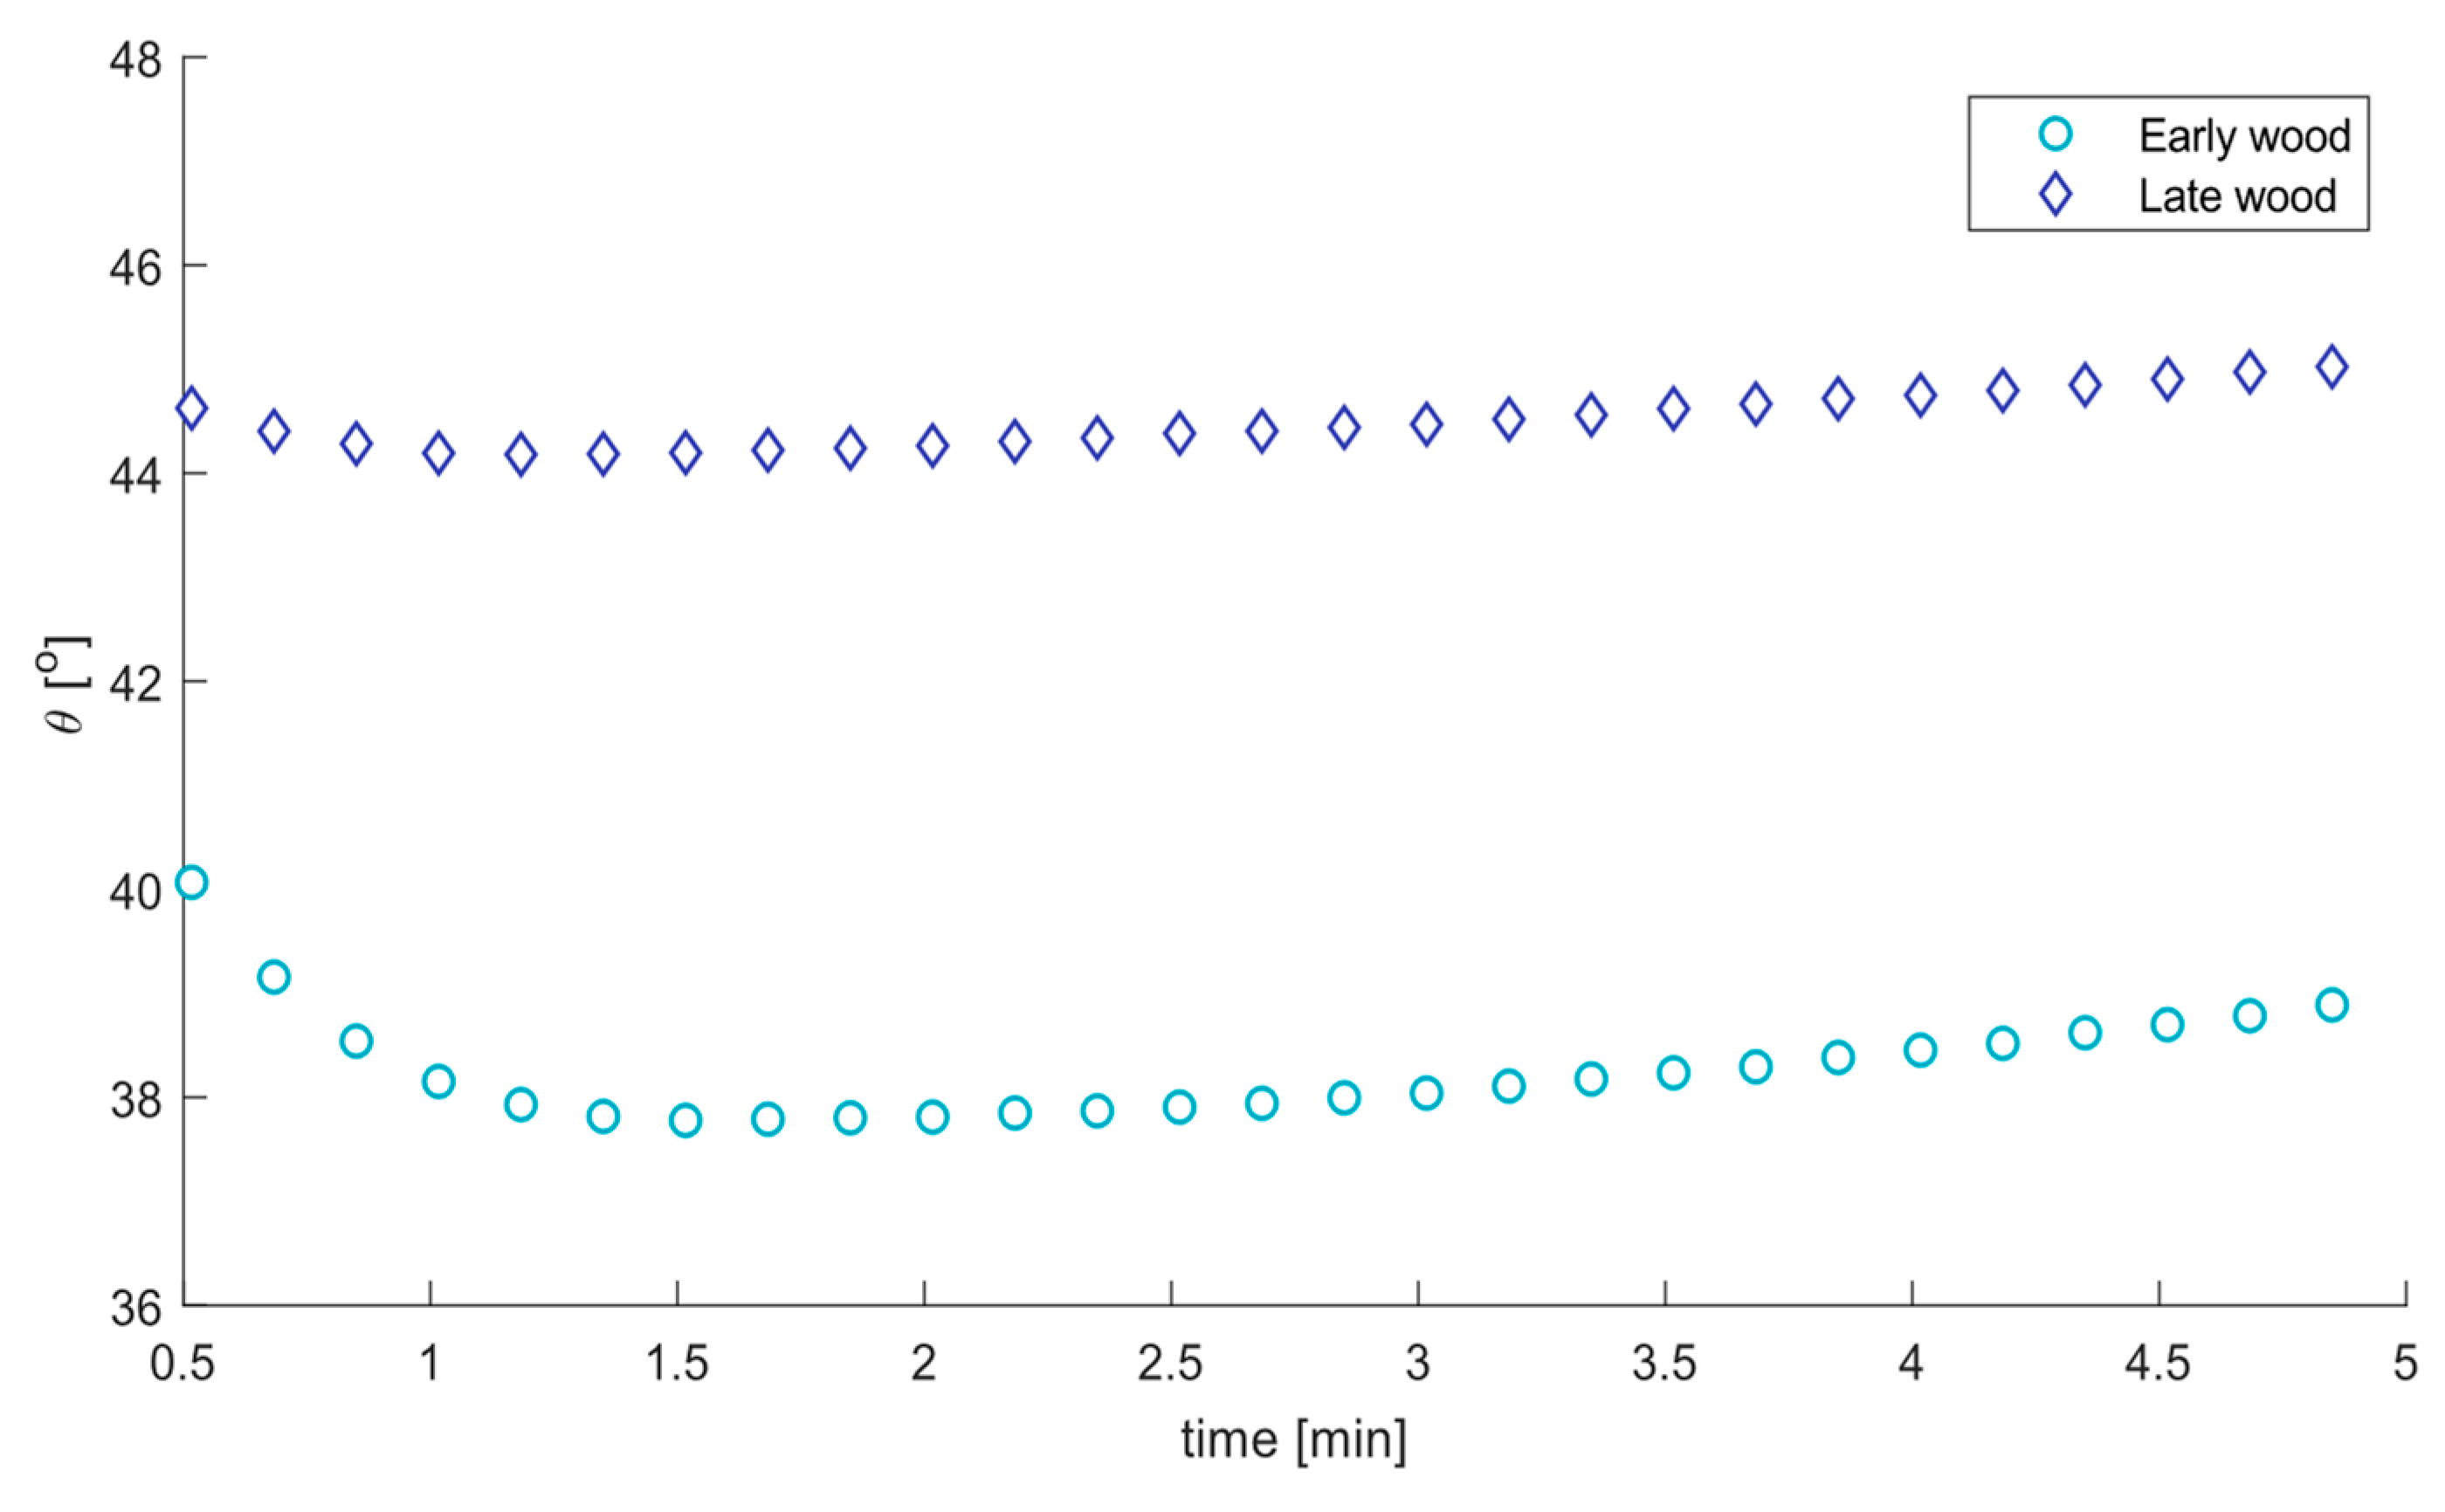
The properties of thirteen water-based and ten solvent-based coatings, including their temporal wetting, were investigated. Across all characterized coatings, an 11% larger average contact angle was noted for latewood compared to earlywood. This was due to the higher density of latewood compared with earlywood in general, but it is more pronounced in southern yellow pine.
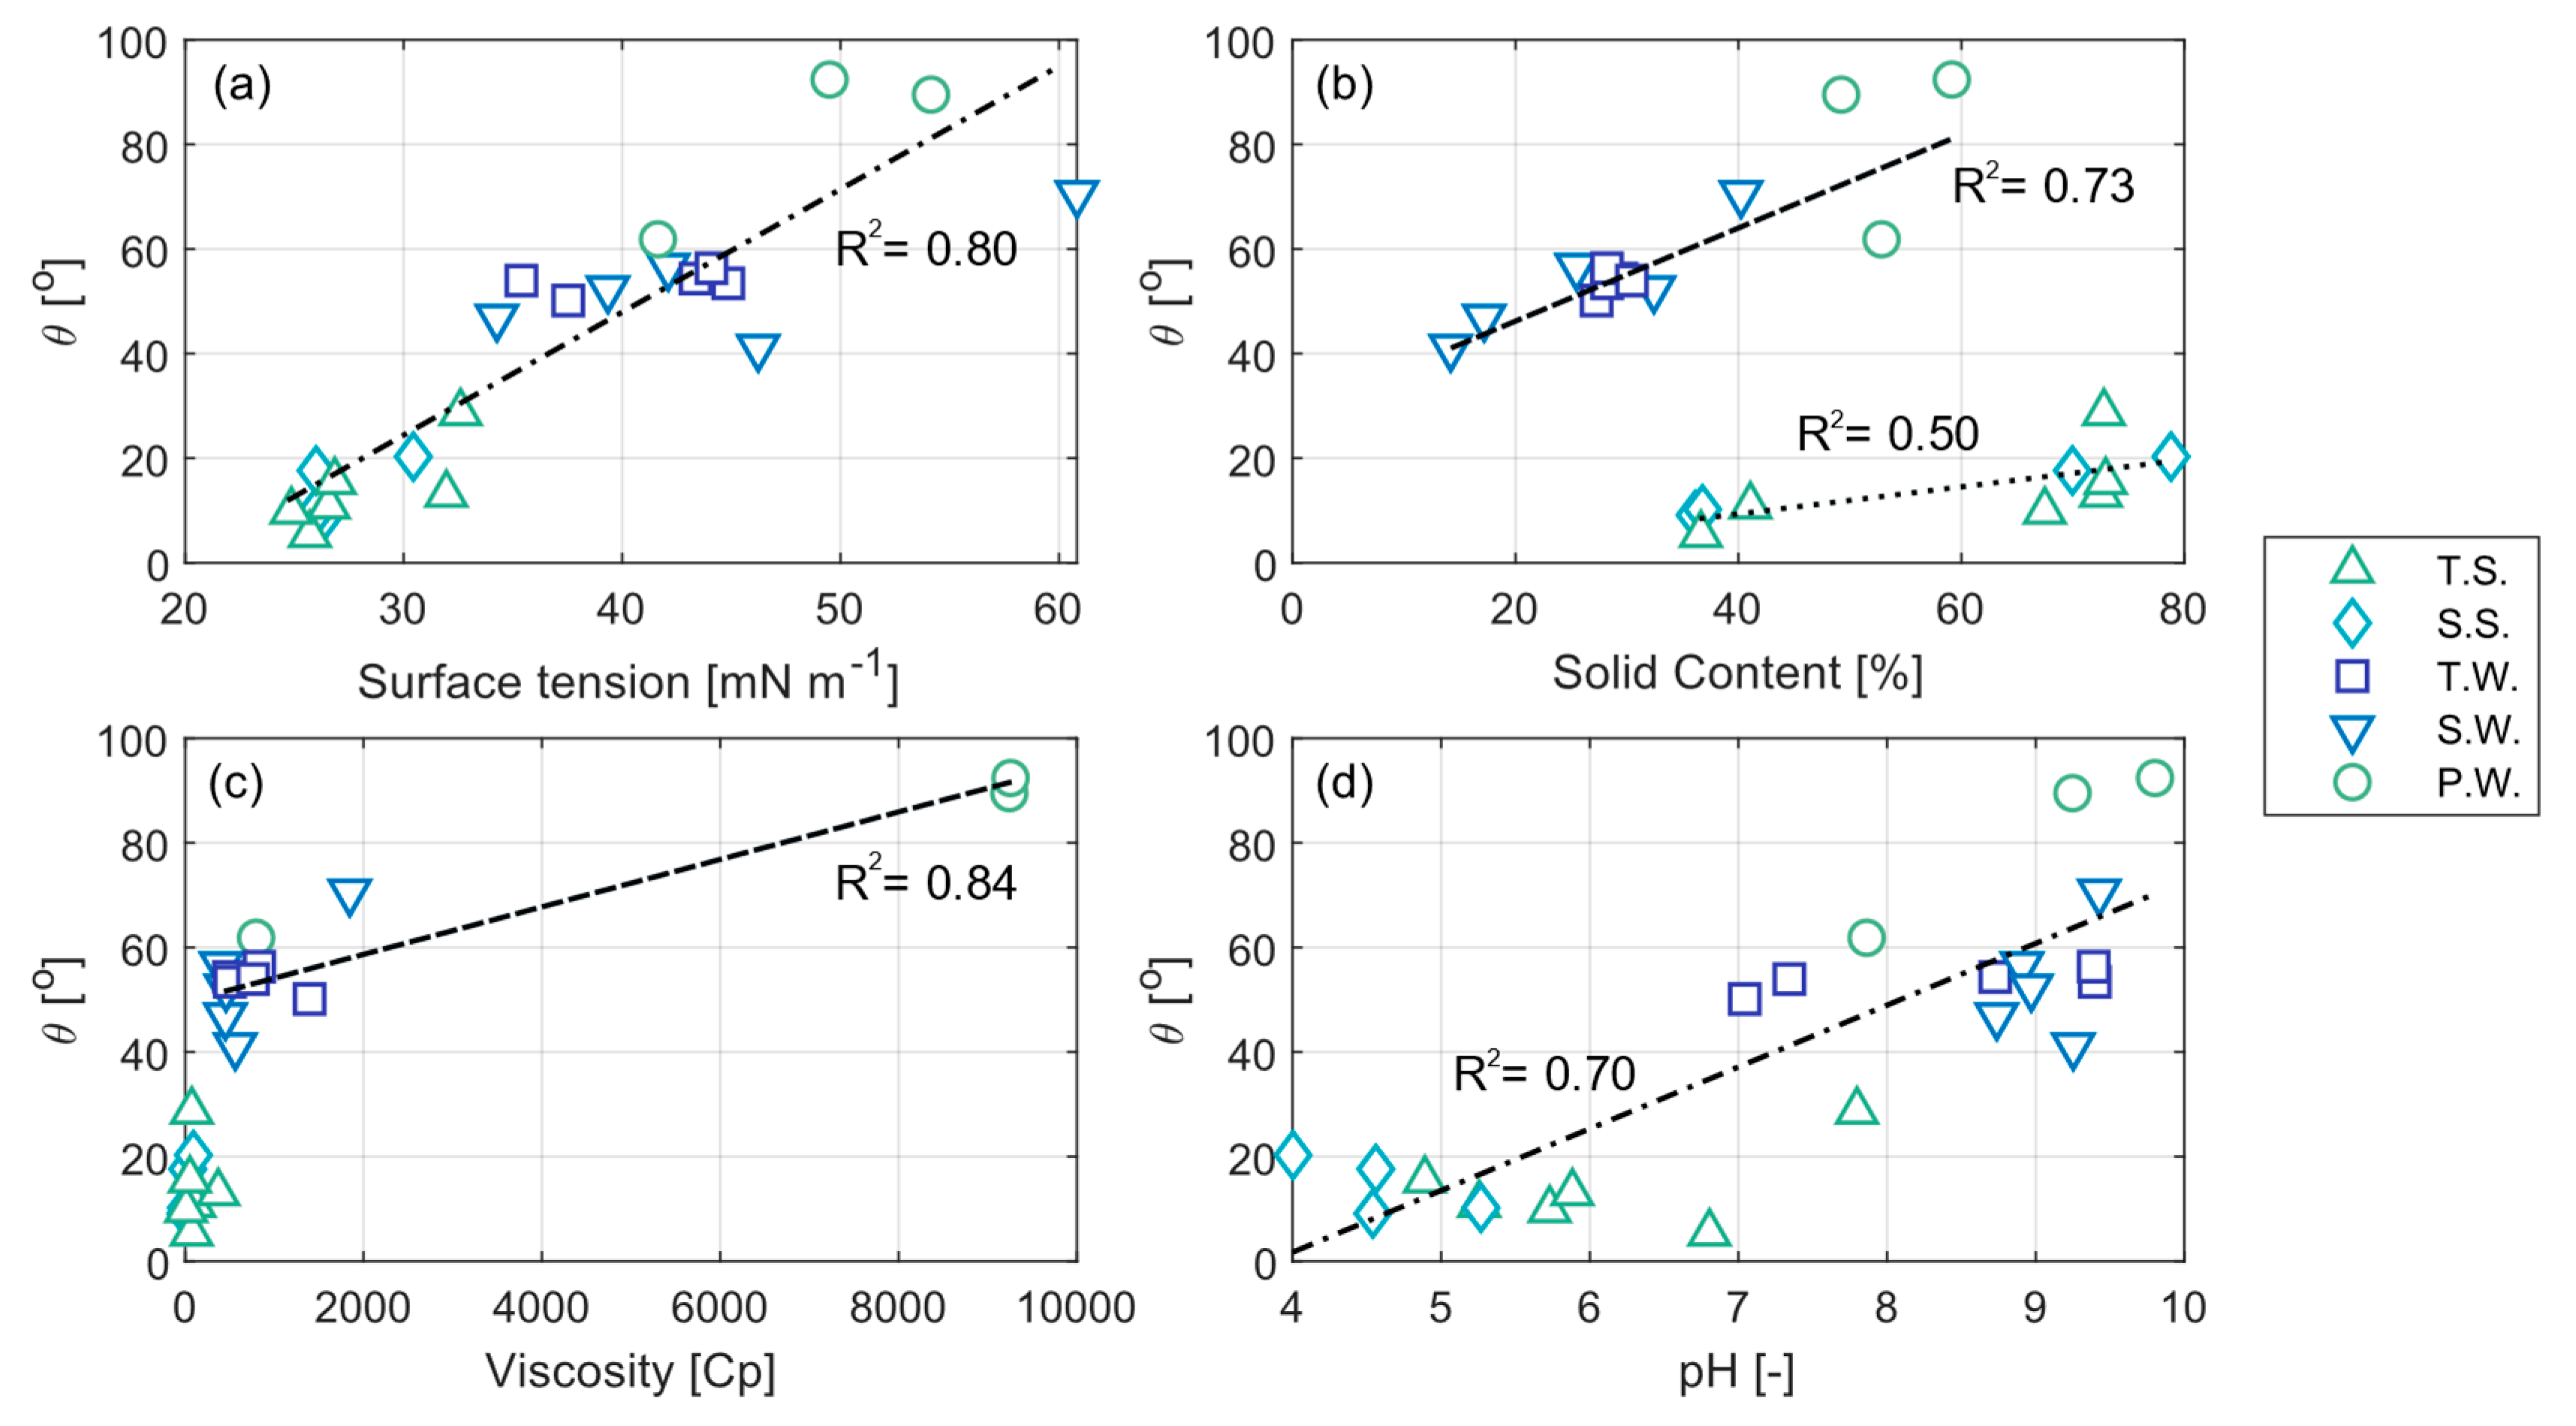
Investigating the relationship between the measured contact angle and a selection of coating properties revealed a strong correlation between the coating contact angle with surface tension and the pH of the coatings. When the coatings were split by their solvent and water bases, an increase in the solid content was also shown to increase the contact angle. In contrast, a 92% correlation was observed with the contact angle and viscosity of the water-based formulations.
The average contact angle (60) and surface tension (44 mN/m) of the water-based formulations were significantly higher than that of their solvent-based counterparts (14, 28 mN/m). The greater wetting of the solvent coatings in comparison to their water counterparts was due to the organic solvent, which inherently resulted in a reduced surface tension property. Additionally, 73% and 74% decreases in the measure contact angle were noted for the solvent-based coatings when comparing the semi-transparent stain and transparent stain with their water-based counterparts, respectively. These results suggested that surface tension could provide a good prediction for coating spreading.
To increase the application of water-based coatings and improve their performance, it is crucial to reduce their surface tension and thus their contact angle, which would enhance coating performance. A new innovative technique for characterizing the wetting properties of coating droplets on wood surfaces was also demonstrated. The automated calculation of the coating contact angle, which is a direct predictor of coating bond strength, was shown when utilizing the wood grain in determining the droplet–wood boundary. This methodology can be applied to an industrial setting to improve coating adhesion performance, reduce maintenance, and extend the service of coated wood products.
Water-based coatings demonstrated a higher average water uptake compared with their solvent-based counterparts. Conversely, they also showed a higher water-vapor permeability, enabling water-based coated-wood samples to let absorbed water evaporate at a faster rate than solvent-based coated wood samples. It should be noted that the water uptake testing was lab-based, and ongoing natural weathering testing will enable further insights into these results. To increase the widespread use of water-based coatings, it is crucial to improve their wettability by reducing their surface tension. This can be achieved by augmenting coating formulations using suitable additives.

 ,
, 


