3.1. Macro-Observation and Geometric Characteristics
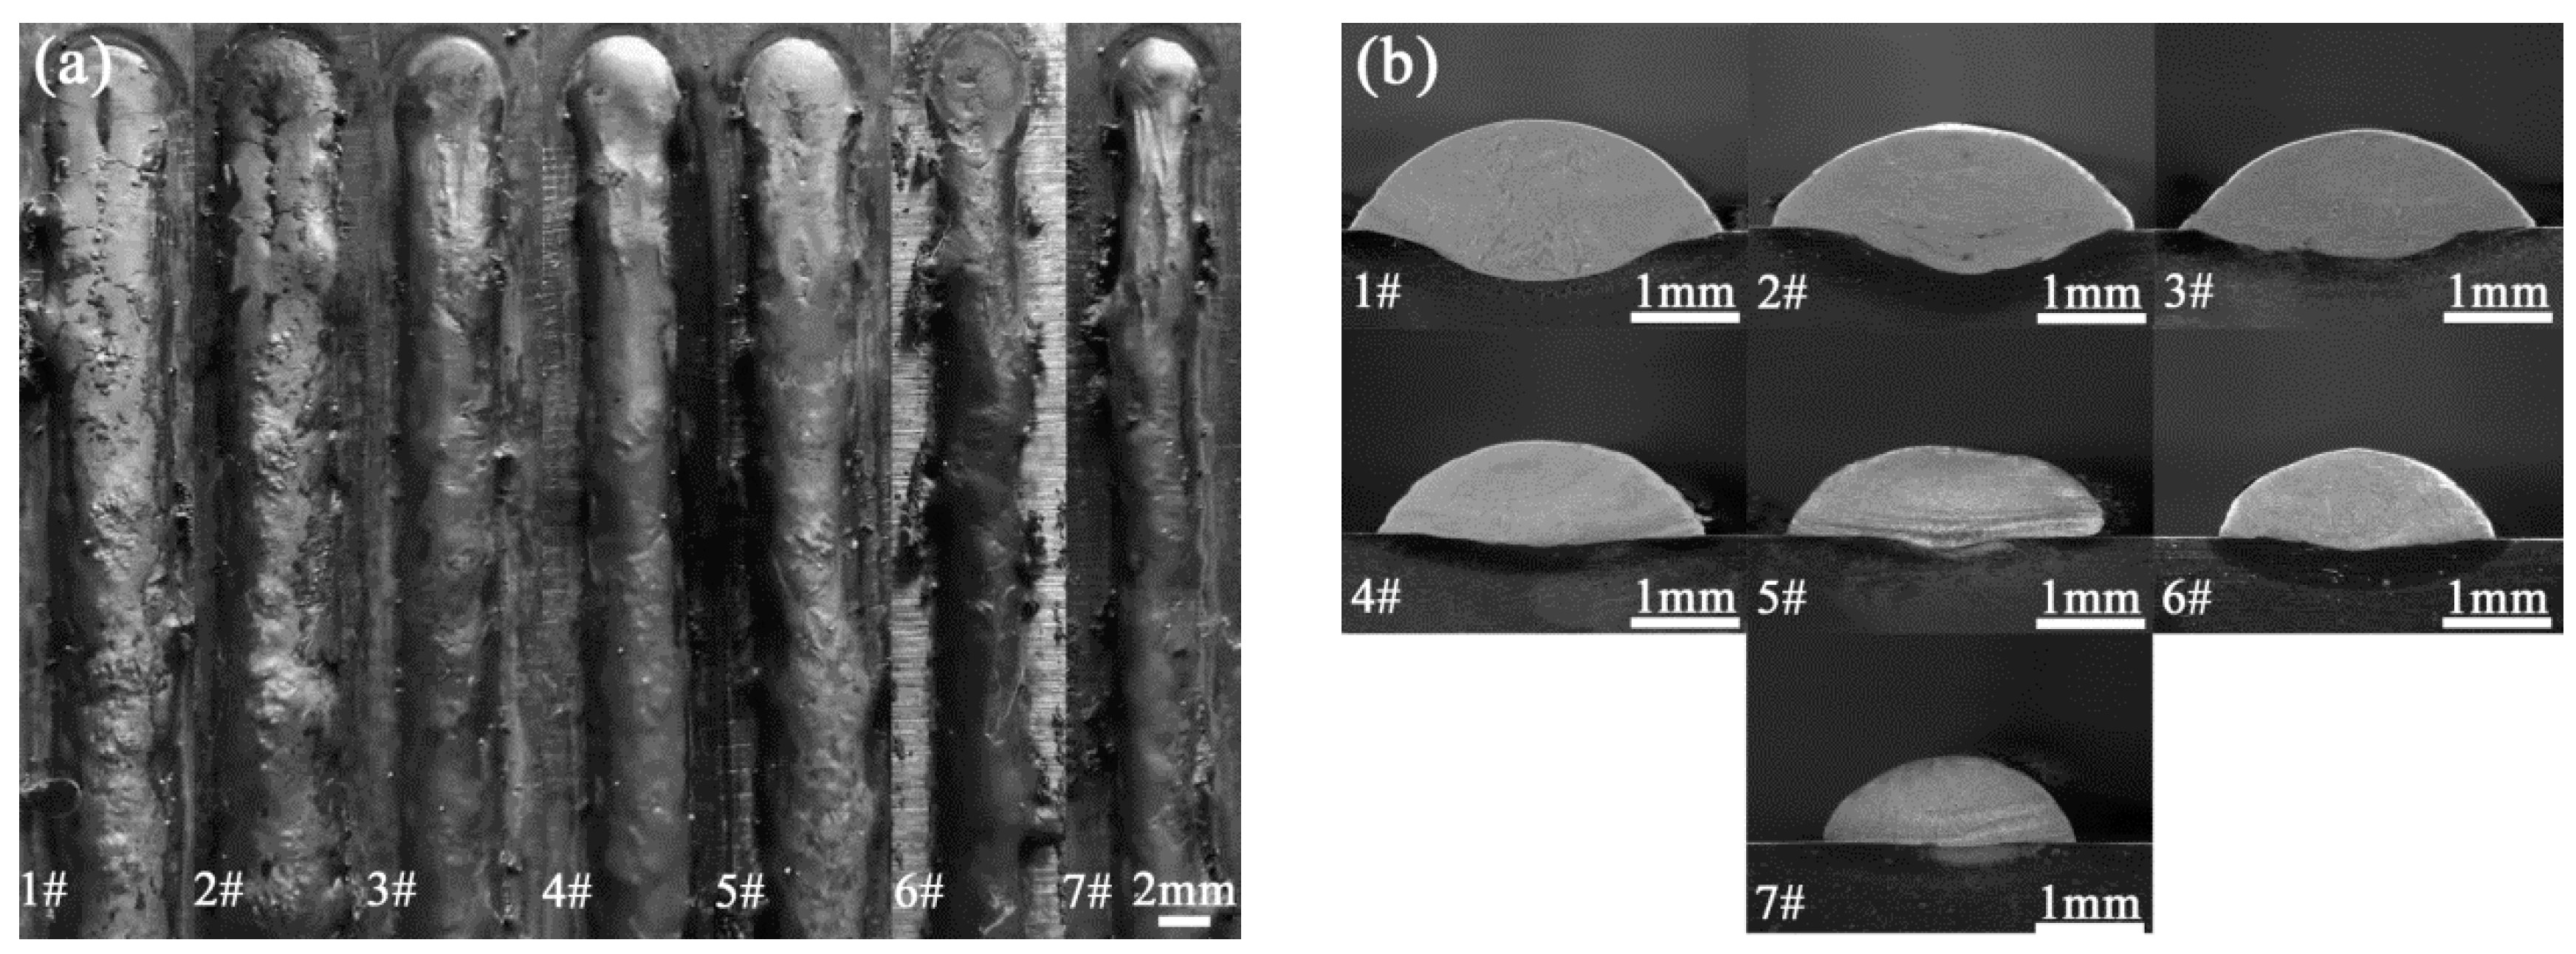
Figure 3a shows the surface morphologies of single-passes under different process parameters. When the energy input is relatively high (183.33 J/mm ~ 200.00 J/mm), much laser energy transferred into the molten pool, which increases the thermal stress and cracking tendency of the single-pass, leading to the severe burning loss and cracks occurred on single-pass, as shown in the tracks of 1# and 2#. With the decrease of energy input (108.33 J/mm ~ 183.33 J/mm), the surface of single-pass 3#, 4#, and 5# become smooth and continuous without burning loss, where only a few pits occurred on the surface of these single-passes. As the energy input further decreases (80.00 J/mm ~ 108.33 J/mm), the composite powder will not be melted completely for the reason that less laser energy transferred into the molten pool, which increases the surface tension of the molten pool and decreases the wettability between molten pool and substrate. Therefore, the surfaces of single-pass 6# and 7# become irregular and discontinuous, in which many small size spheres occurred.
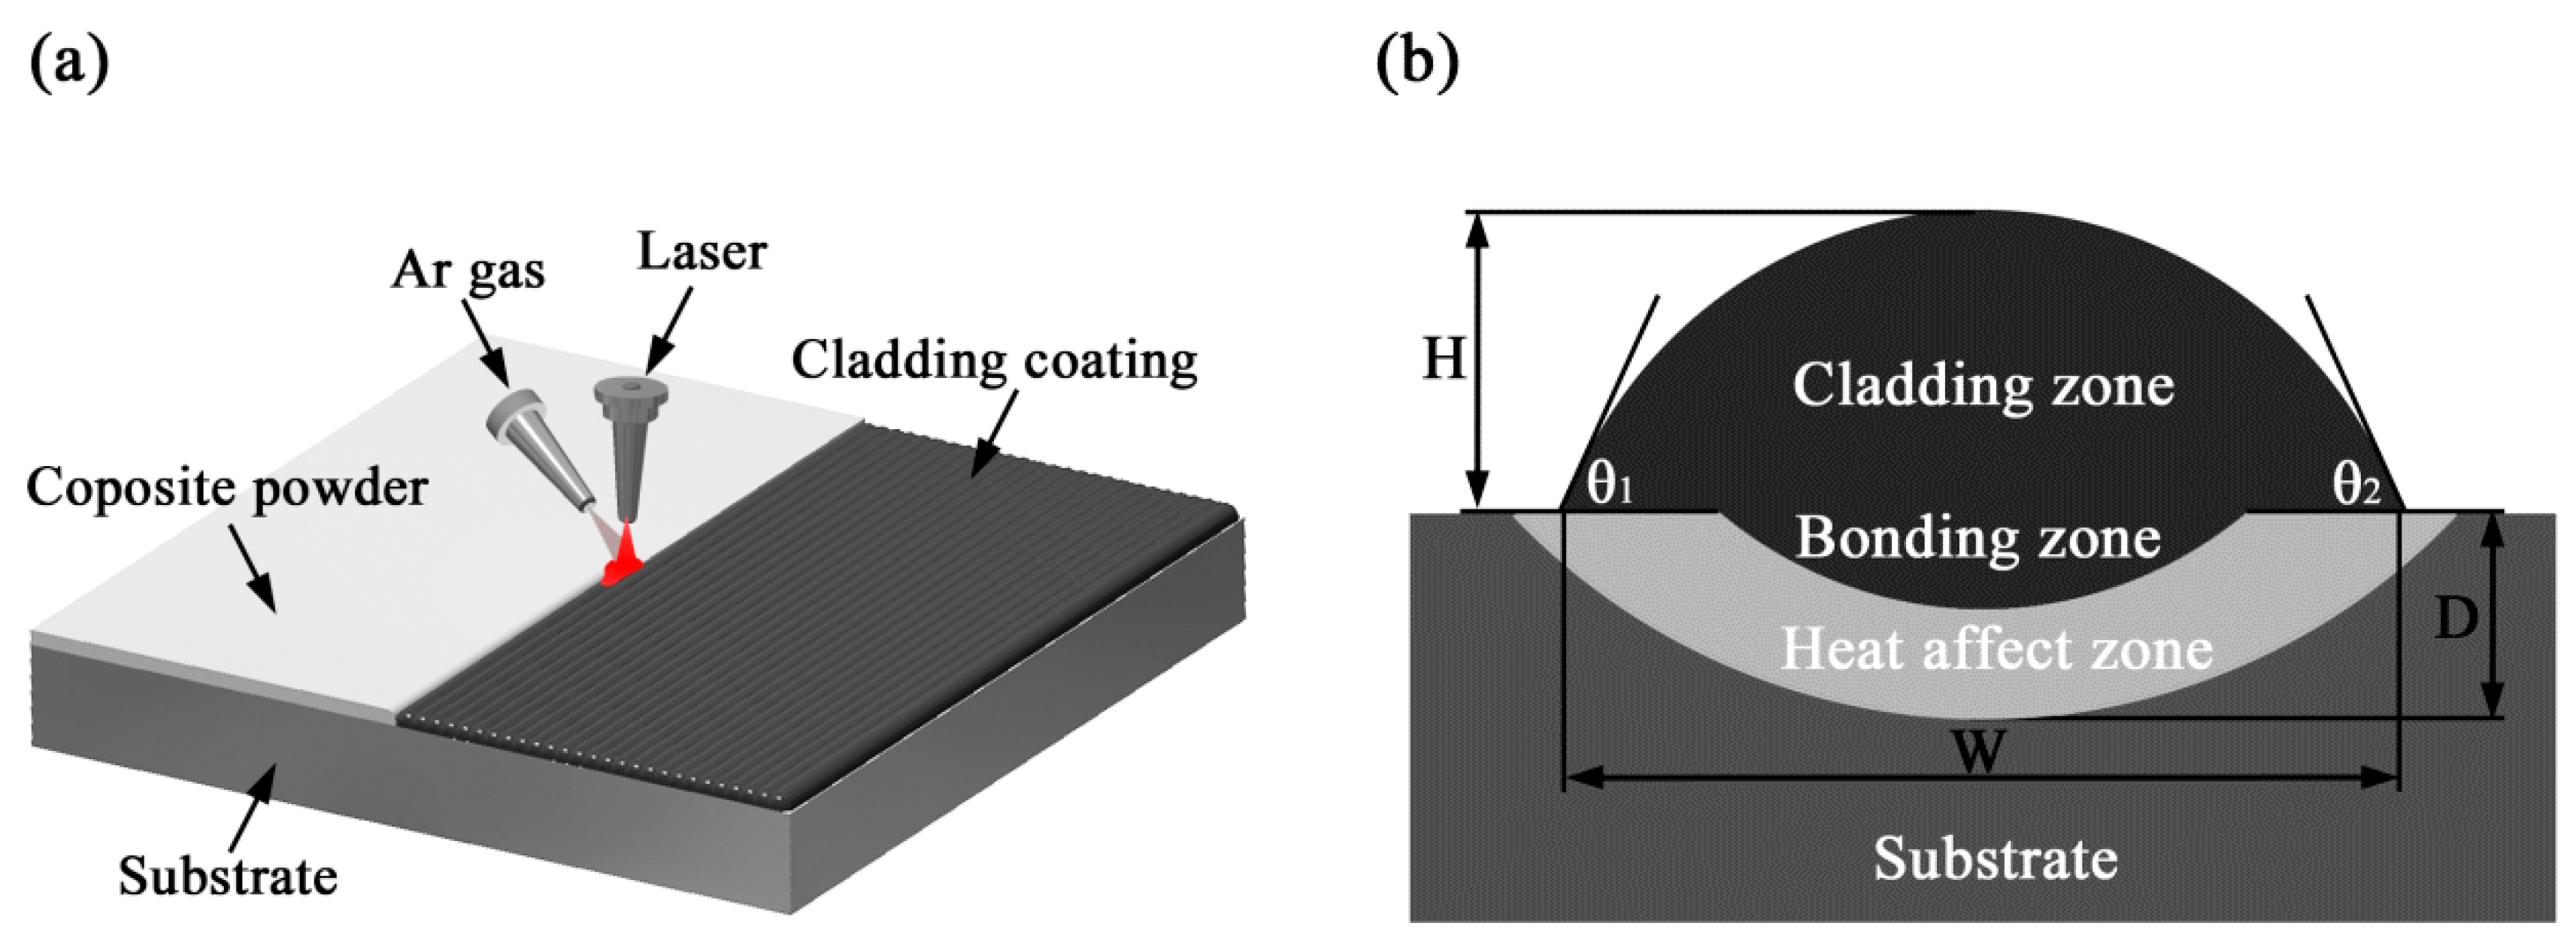
Figure 3b displays the cross section morphologies of single-passes. The geometric characteristics of the single-passes, such as the width (
W), the height (
H), the depth (
D), and the contact angle (
,
) between the single-pass and the substrate were measured, and the dilution rate
ζ and average contact angle
were calculated by
=
D/(
D +
H) and
= (
)/2 respectively, the results are, as shown in
Table 3.
In LC, the spot energy density of laser beam obeys the Gaussian distribution, this uneven distribution will result in the formation of temperature gradient, tension gradient and composition concentration gradient in the molten pool, which will promote the liquid to flow from the edge to the center of the molten pool, and the convection driving this phenomenon is Marangoni convection [
18]. The change of process parameters will influence the extent of Marangoni convection significantly, and further, affect the geometric characteristics of single-pass. The Marangoni number, which is a measure of the extent of Marangoni convection, is defined as Equation (3) [
19].
where
/
is the temperature coefficient of surface tension,
is the temperature difference between the center and edge of the molten pool surface,
is the radius of the pool surface,
is the dynamic viscosity and
is the thermal diffusivity.
As the energy input decreases from 200.00 J/mm (1#) to 80.00 J/mm (7#) to, Ma decreases for the decrease of
and
and the increase of
, which reduces the velocity of the liquid flow and energy transfer. The volume of the molten pool becomes smaller for the decrease of Ma, and the width (
W), the height (
H), the depth (
D) of single-pass decrease from 3.92 mm, 1.21 mm and 0.49 mm to 2.69 mm, 0.95 mm and 0.05 mm, respectively. Meanwhile, the intensity of Marangoni convection is positively correlated with the degree of dilution between single-pass and substrate, so the dilution rate of single-pass decreases from 29.92% to 5.53% when energy input decreases from 200.00 J/mm to 80.00 J/mm. In addition, the change of process parameters also affects the surface tension of the molten pool, which causes the change of the contact angle. The relationship between contact angle and surface tension of the molten pool can be expressed by Equation (4) [
20].
where
,
and
represent the gas-solid, liquid-solid, gas-liquid interfacial tension, respectively.
According to the empirical formula of the relationship between the liquid surface tension difference and temperature difference of Inconel 718 alloy molten pool [
21]:
= −0.417 ×
, the liquid-solid tension
will increase with the decrease of
, which means
has a positive relationship with the energy input. Therefore, the contact angle between single-pass and substrate increases from 64.55° to 86.70° as the energy input decreases from 200.00 J/mm to 80.00 J/mm.
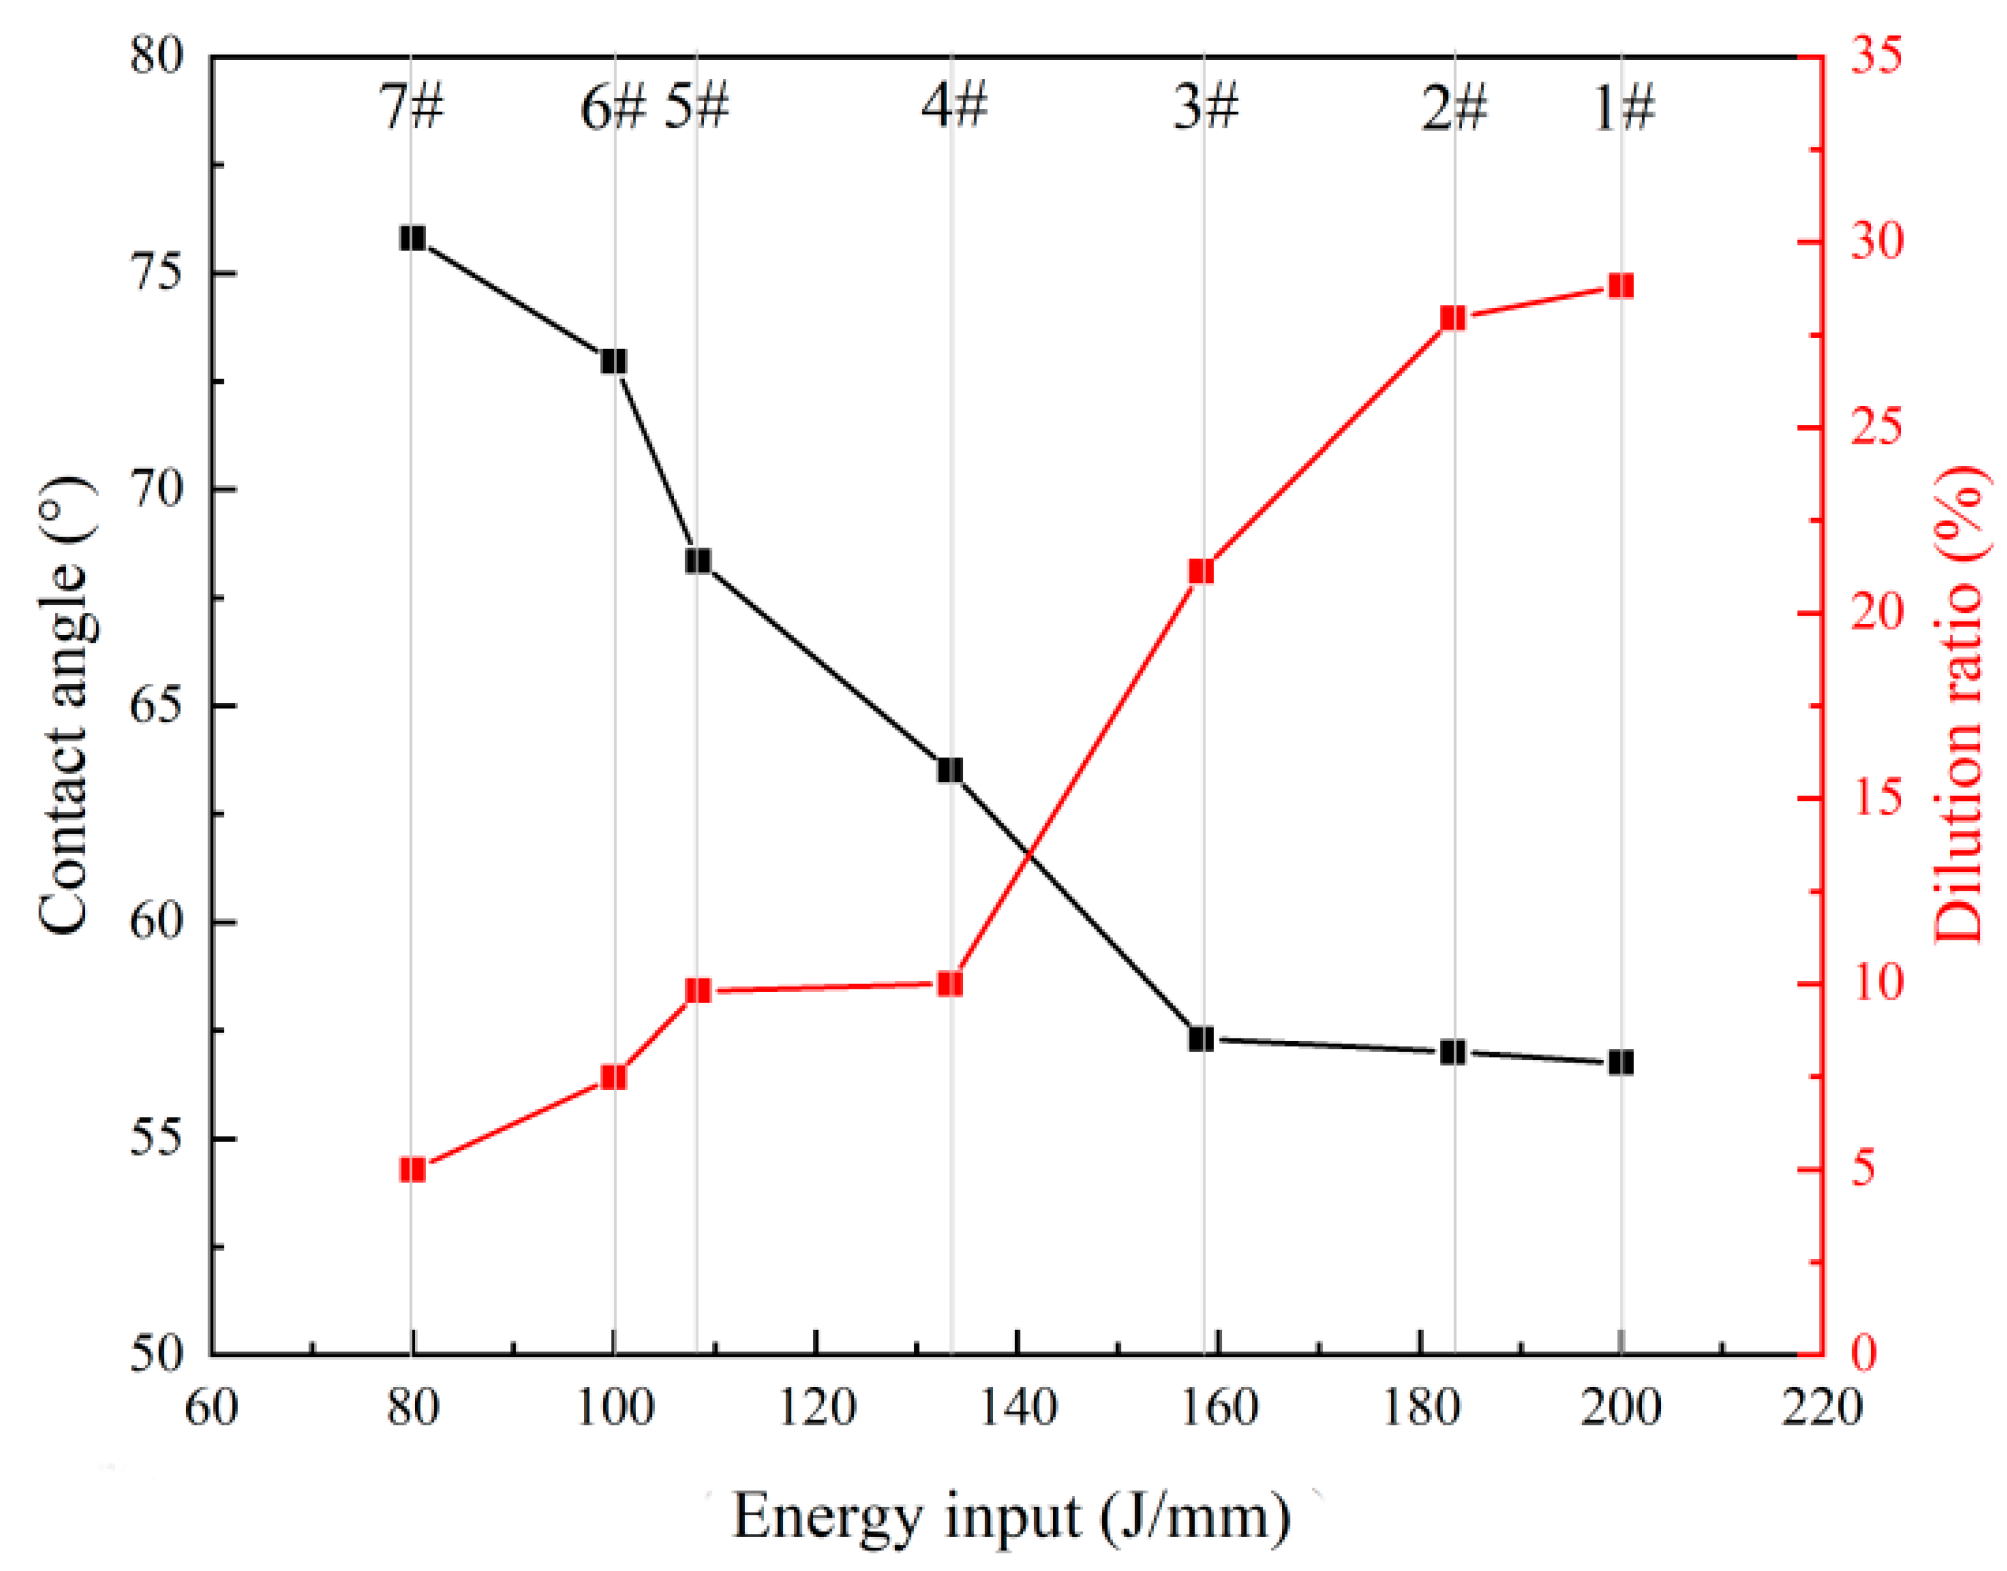
Figure 4 shows the relationship between geometric characteristics (dilution rate and contact angle) and energy input. When the energy input decreases from 200.00 J/mm (1#) to 133.33 J/mm (4#), the dilution rate decreases sharply, while the contact angle increases slowly. However, when the energy input further decreases from 133.33 J/mm (4#) to 80.00 J/mm (7#), the dilution rate and the contact angle showed opposite trend compared with the above discussion. Among all single-passes, the contact angle is less than 90°, indicating the good wettability between the single-pass and substrate, and the smaller the contact angle, the better the bonding between single-pass and substrate. In order to ensure the material of the single-pass is not diluted too much, it is generally believed that the dilution rate should not be higher than 15% [
22], so single-pass 4#, 5#, 6#, and 7# meet this requirement. However, the dilution rate with too small value is harmful to the bonding between the coating and the substrate, which will result to the coating fail prematurely under load, so single-pass 4# (133.33 J/mm) and 5# (108.33 J/mm) have better geometric characteristics compared with others.
3.2. Phase Constitution and Microstructure Characteristics
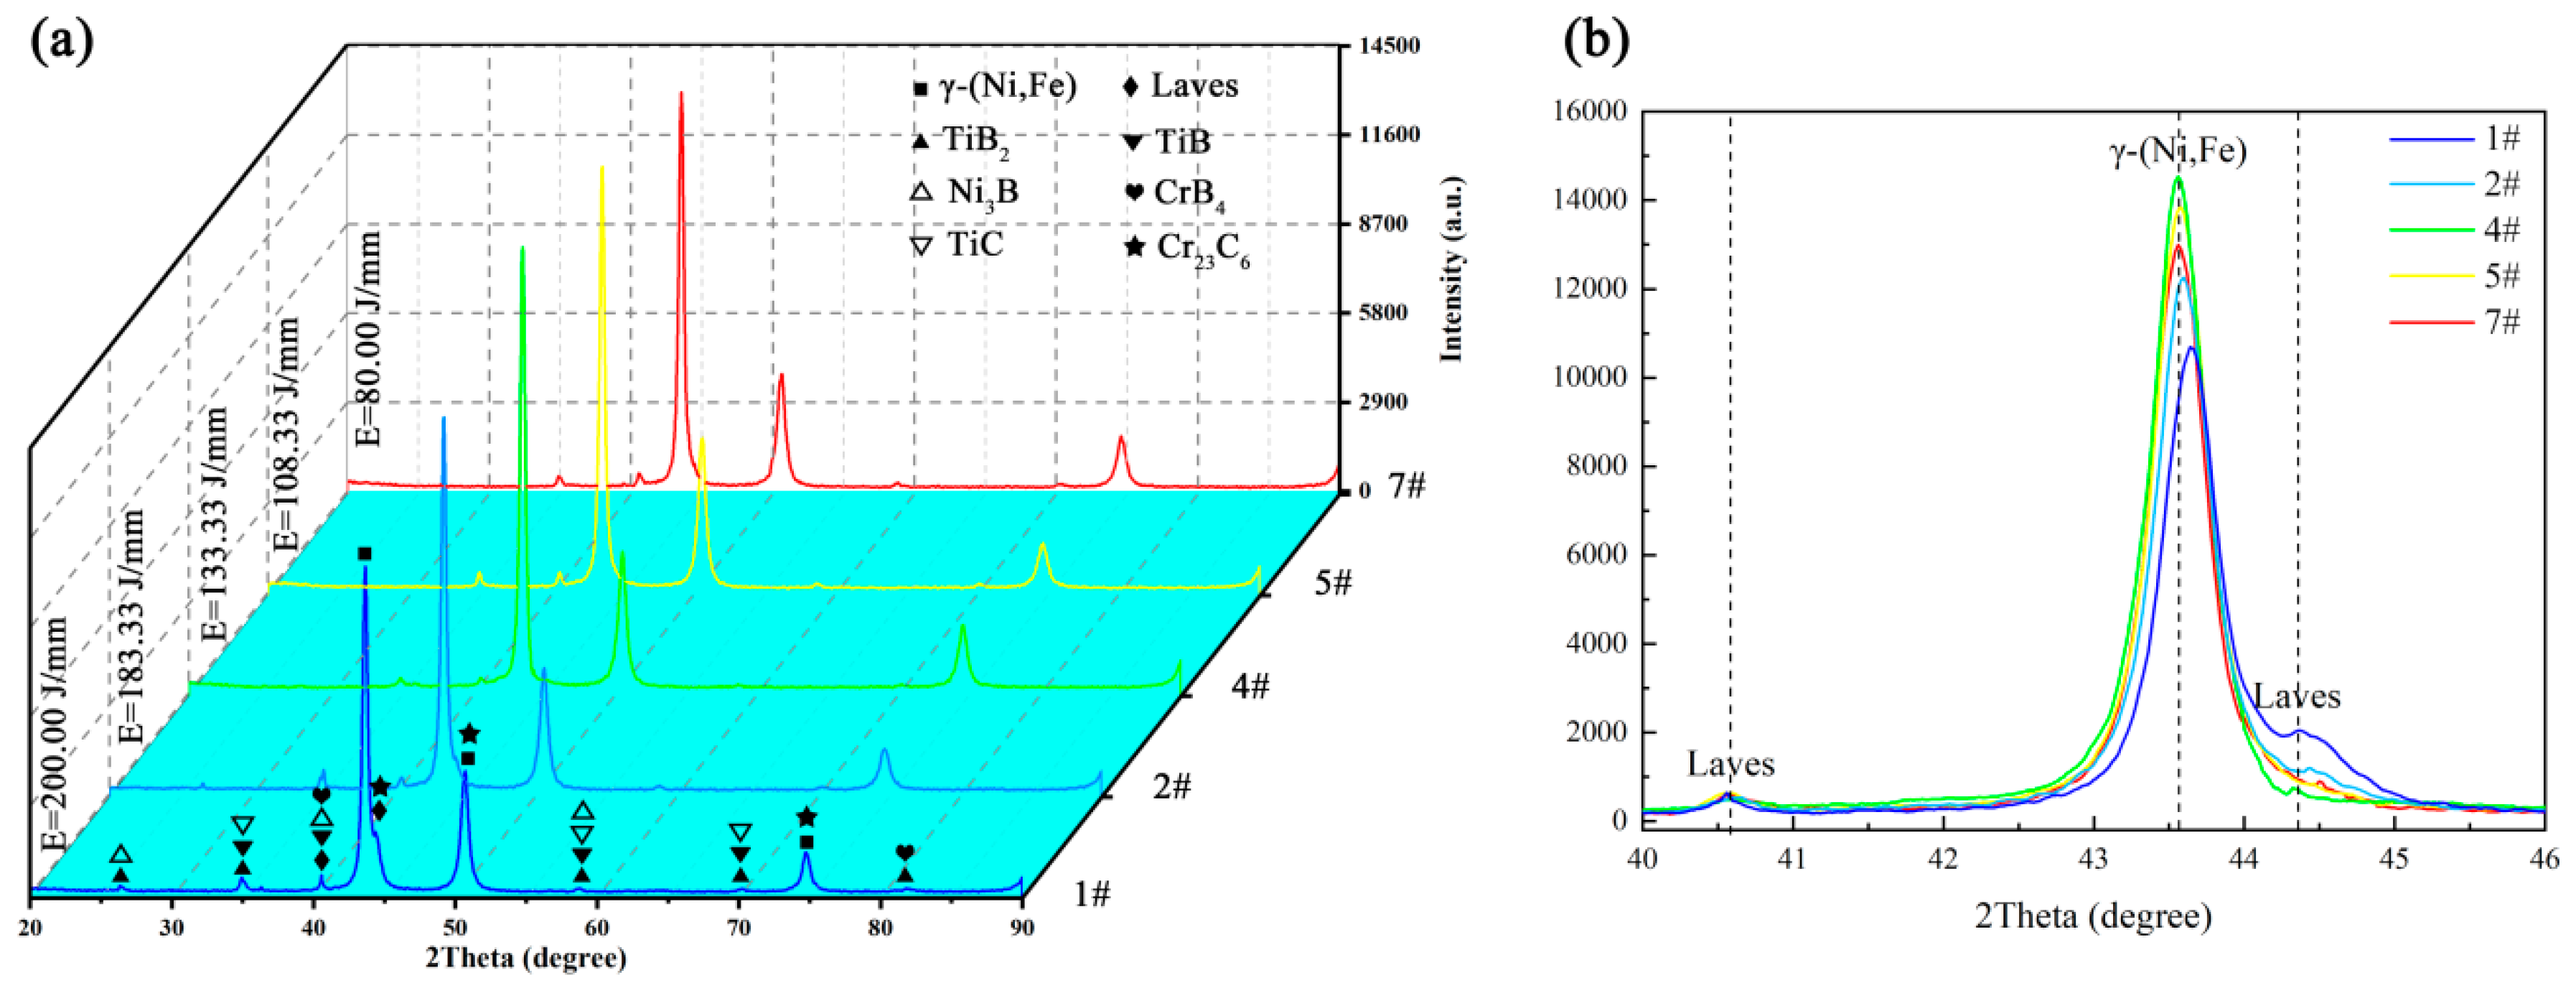
To analyze the phase constitution of composite coatings prepared by different process parameters, X-ray diffraction tests (XRD) were conducted, and the results are shown in
Figure 5. Among all composite coatings, the main diffraction peaks at 43.6°, 50.7° and 74.7° are confirmed as γ-(Ni, Fe) solid solution, which is the basic phase of the nickel matrix composite coatings. Besides, the TiB
2 particles will partially melt and decompose, which causes the formation of phases, such as TiB, TiC, Ni
3B, CrB
4 and Cr
23C
6. At the end of the solidification process, the non-equilibrium phase of Laves will precipitate in composite coatings, which consumes Nb, Mo and other alloy elements which are beneficial to γ-(Ni, Fe). As shown in
Figure 5a, it can be concluded that different energy input has slightly changed the kinds of phases, but shows the influences on the distribution and the content of phases. As shown in
Figure 5b, it could be noted the γ-(Ni, Fe) of coating 3# exhibits minimum angle of diffraction and maximum value of diffraction peak, indicating there are more alloy elements (e.g., Nb, Mo) existed in γ-(Ni, Fe) and higher content of γ-(Ni, Fe) than those of others. It also could be noted the diffraction peak of Laves of coating 3# shows minimum value, indicating coating 3# has the lowest content of Laves.
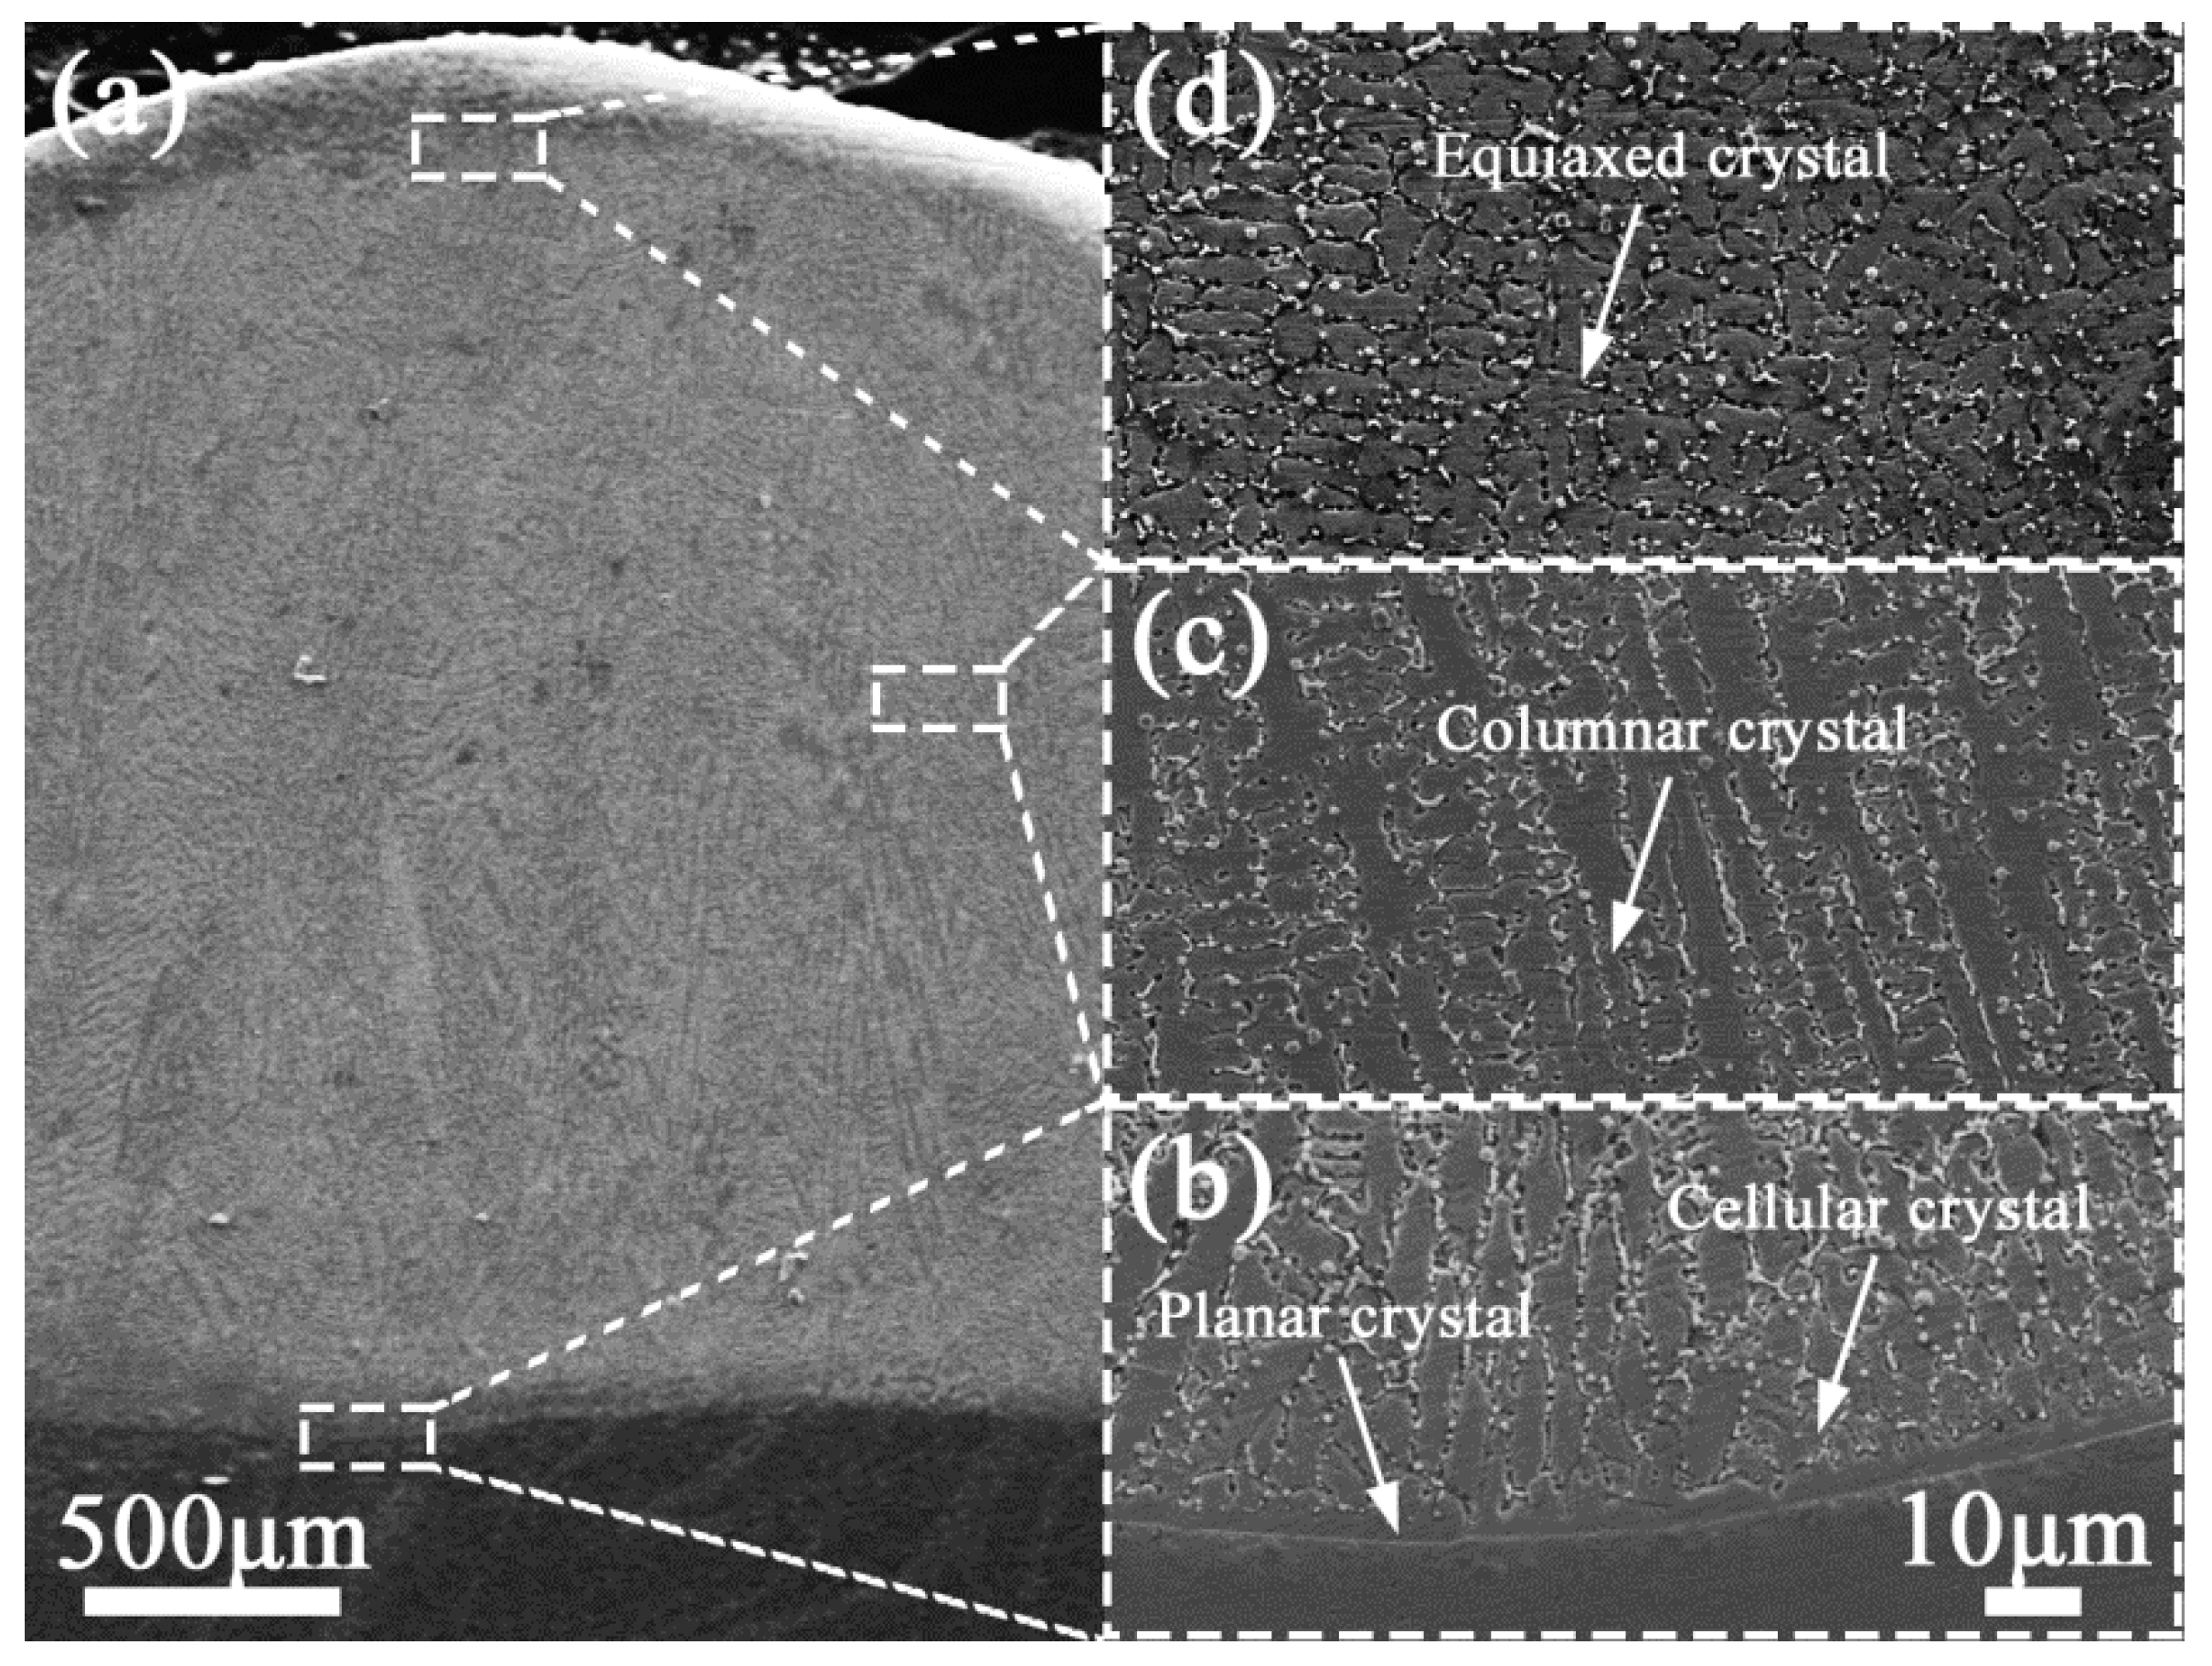
Figure 6 shows the SEM image of cross section microstructure of coating 4#. It shows that coating 4# has different microstructures from bottom to top areas: The bottom of the coating includes planar crystals and cellular crystals (
Figure 6b), the middle of the coating mainly composes with columnar crystals (
Figure 6c), and equiaxed crystals exist in the top of the coating (
Figure 6d). Besides, the grain size decreases from bottom to top areas.
According to the rapid solidification theory, the change of the microstructure is mainly influenced by the constitutional undercooling, which has a negative relationship with the ratio of temperature gradient
G and solidification velocity
R, and the grain refines as the cooling rate
G × R increases [
23,
24]. The relationship can be expressed as Equations (5) and (6) [
25,
26].
where
K is the thermal conductivity of single-pass,
T is the liquid temperature of the alloy,
T0 is the initial temperature of the substrate,
is the absorption coefficient of the laser,
is the angle between
V and
R.
From the above equations,
G/R and
G × R can be calculated by Equations (7) and (8).
In the LC process, the molten pool can be considered as a half sphere, then it will be concluded that
α decreases from 90° to 0° and
R increases from 0 to
V as the observation position moves from bottom to top of the molten pool. Due to the significant heat exchange between the molten pool and the substrate,
G has a maximum value at the bottom and gradually decreases as the observation position moves up [
27]. Hence,
G/R decreases and
G × R increases by taking distance from the bottom towards the top. At the bottom of the molten pool, maximum
G/R indicates there is almost no constitutional undercooling in this region, leading to the formation of the planar crystal. As the solidification process proceeds,
G/R decreases rapidly, which is beneficial to the formation of the narrow constitutional undercooling zone, which affects the stability of planar crystal and cellular crystal begins to grow. By getting closer to the surface, the columnar crystal shows up because
G/R decreases further. In the top region of the molten pool, the growth of microstructure is changed from columnar crystals to equiaxed crystals, which is attributed to the relatively high constitutional undercooling and heat transmission to the surrounding environment from multiple directions. The addition of TiB
2 particles in the composite coatings improves the constitutional undercooling at the front edge of the solid-liquid interface, which is conducive to the microstructure transformation. Due to the intense Marangoni convection in the molten pool, the displacement of the liquid and TiB
2 particles will lead to the breakage of dendrites and incomplete grains, which provides the nuclei needed to form the new grains, while the disperse TiB
2 particles play as the heterogeneous nuclei [
28]. In addition, the density of TiB
2 particles (4.52 g/cm
3) is smaller than that of Inconel 718 alloy (8.24 g/cm
3), so the TiB
2 particles tend to exist in the top region of the molten pool, which is beneficial to the heterogeneous nucleation in the top of the molten pool. So the microstructure of the top of the composite coating is more refined than that of other areas.
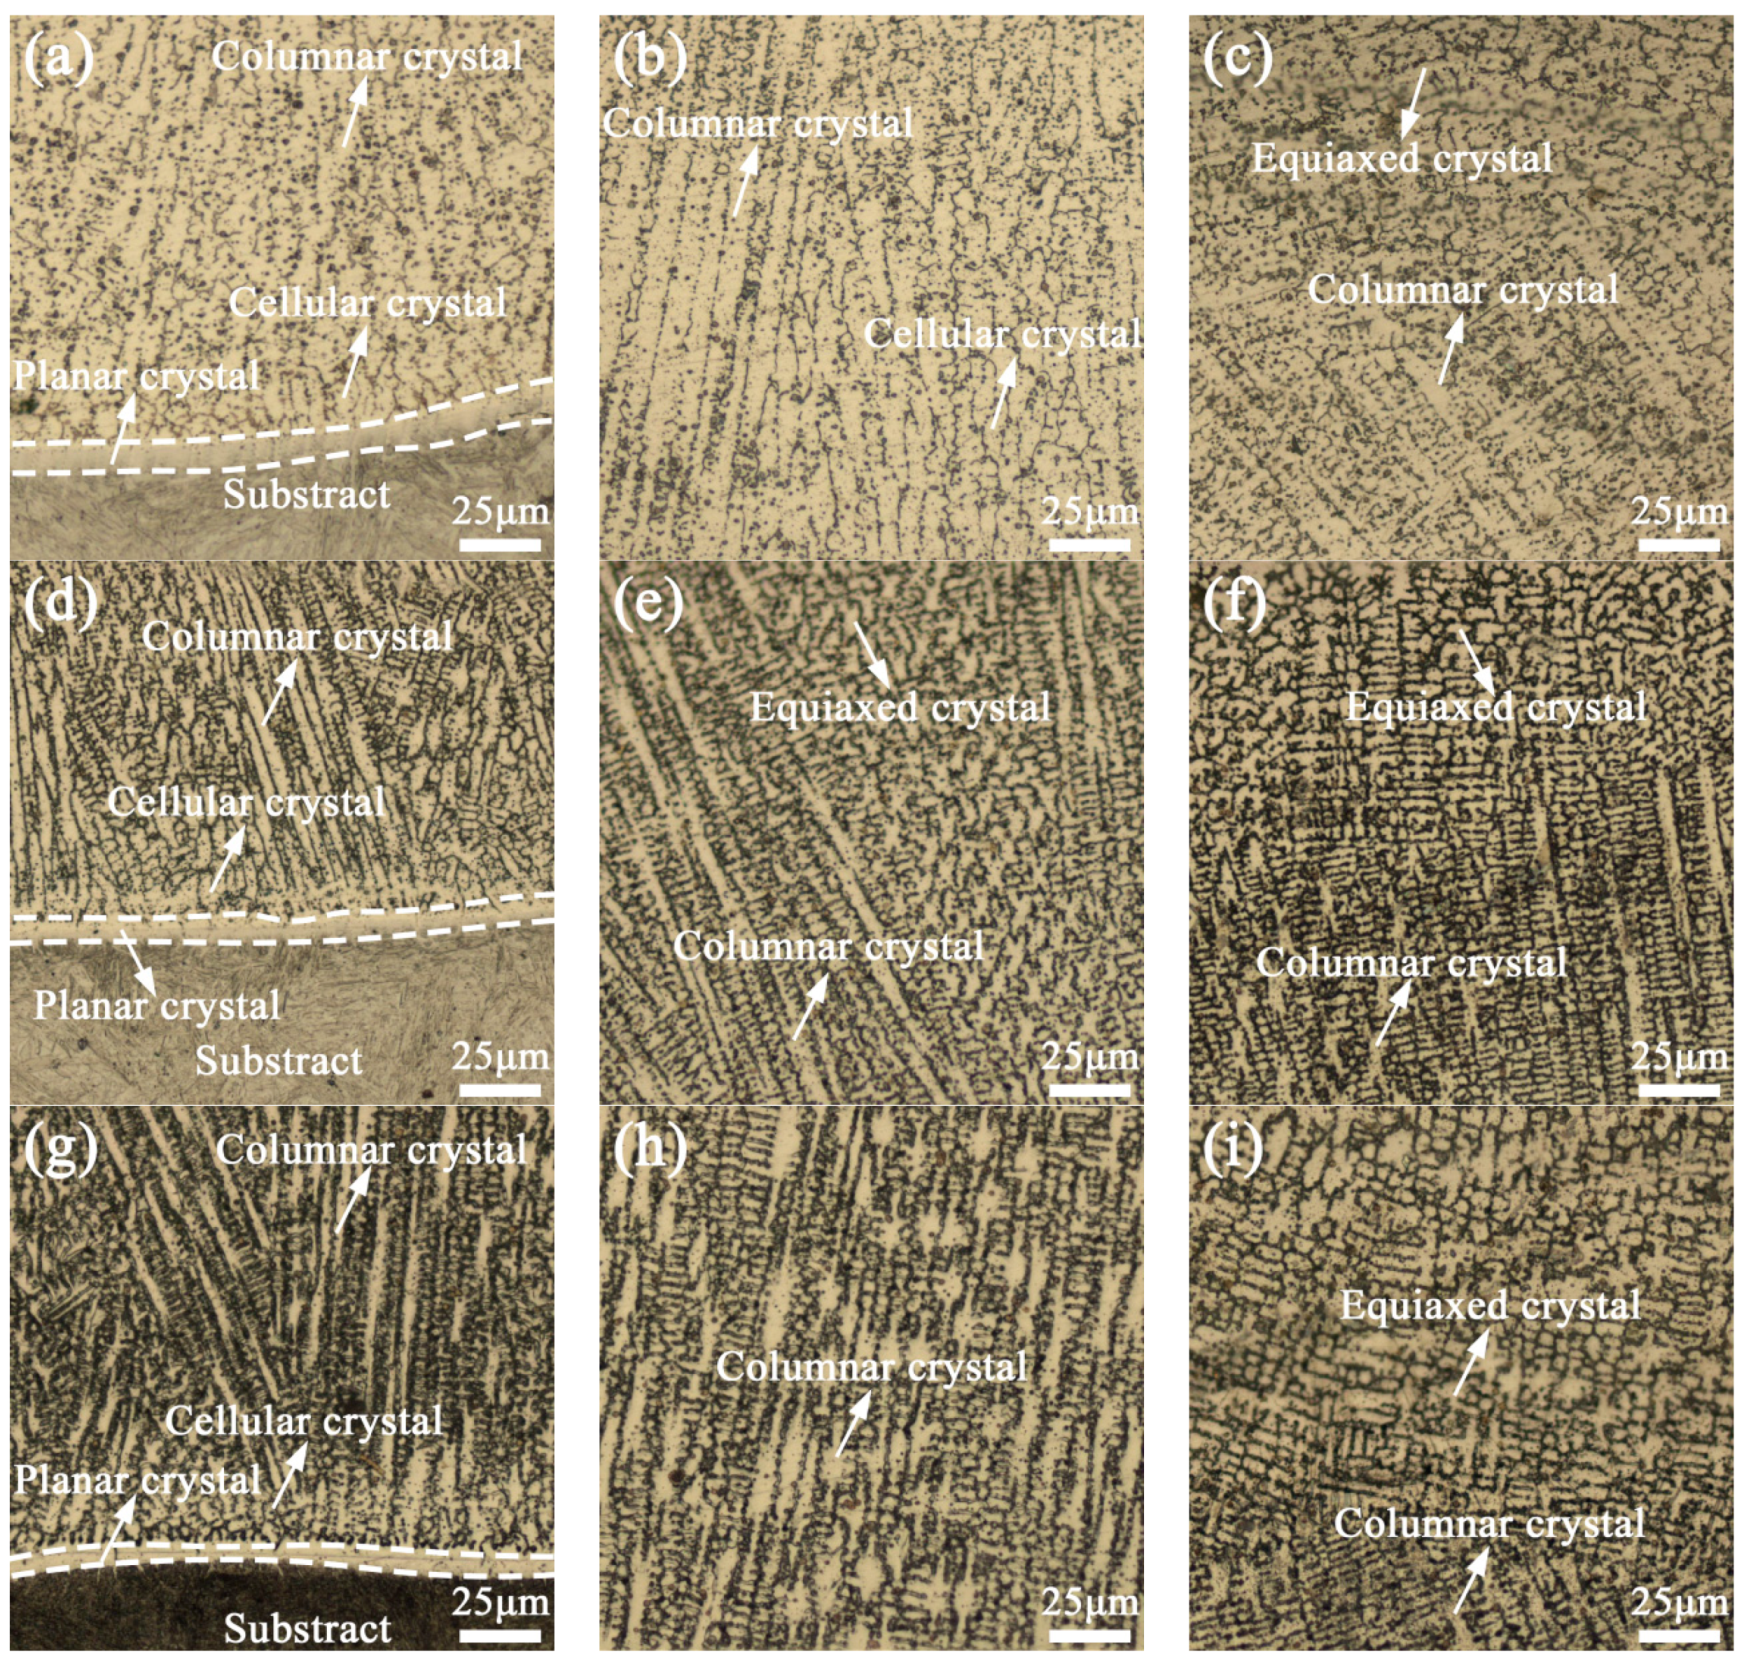
Figure 7 shows the OM images of cross section microstructure of the bottom, middle and top of composite coatings at different laser scanning speed when the laser power is 1.6 kW. According to Equation (7), the increase of laser scanning speed will lead to the decrease of
G/R and the increase of constitutional undercooling at the front edge of the solid-liquid interface, which is conducive to the transformation of the microstructure. Therefore, when the laser scanning speed is 8 mm/s, coating 1# shows thick planar crystal (10.48 μm), a large number of cellular crystals and a small amount of equiaxed crystals (
Figure 7a–c). With the laser scanning speed increases, for the decrease of
G/R and the increase of constitutional undercooling, the thickness of planar crystal of coating 4# (12 mm/s) and 7# (20 mm/s) decreases to 7.62 μm and 4.89 μm, respectively, the amount of cellular crystals decreases significantly (
Figure 7d,g), the amount of columnar crystals and equiaxed crystals increases obviously (
Figure 7e,f,h,i), and equiaxed crystals have even been observed in the middle of coating 3# (
Figure 7e).
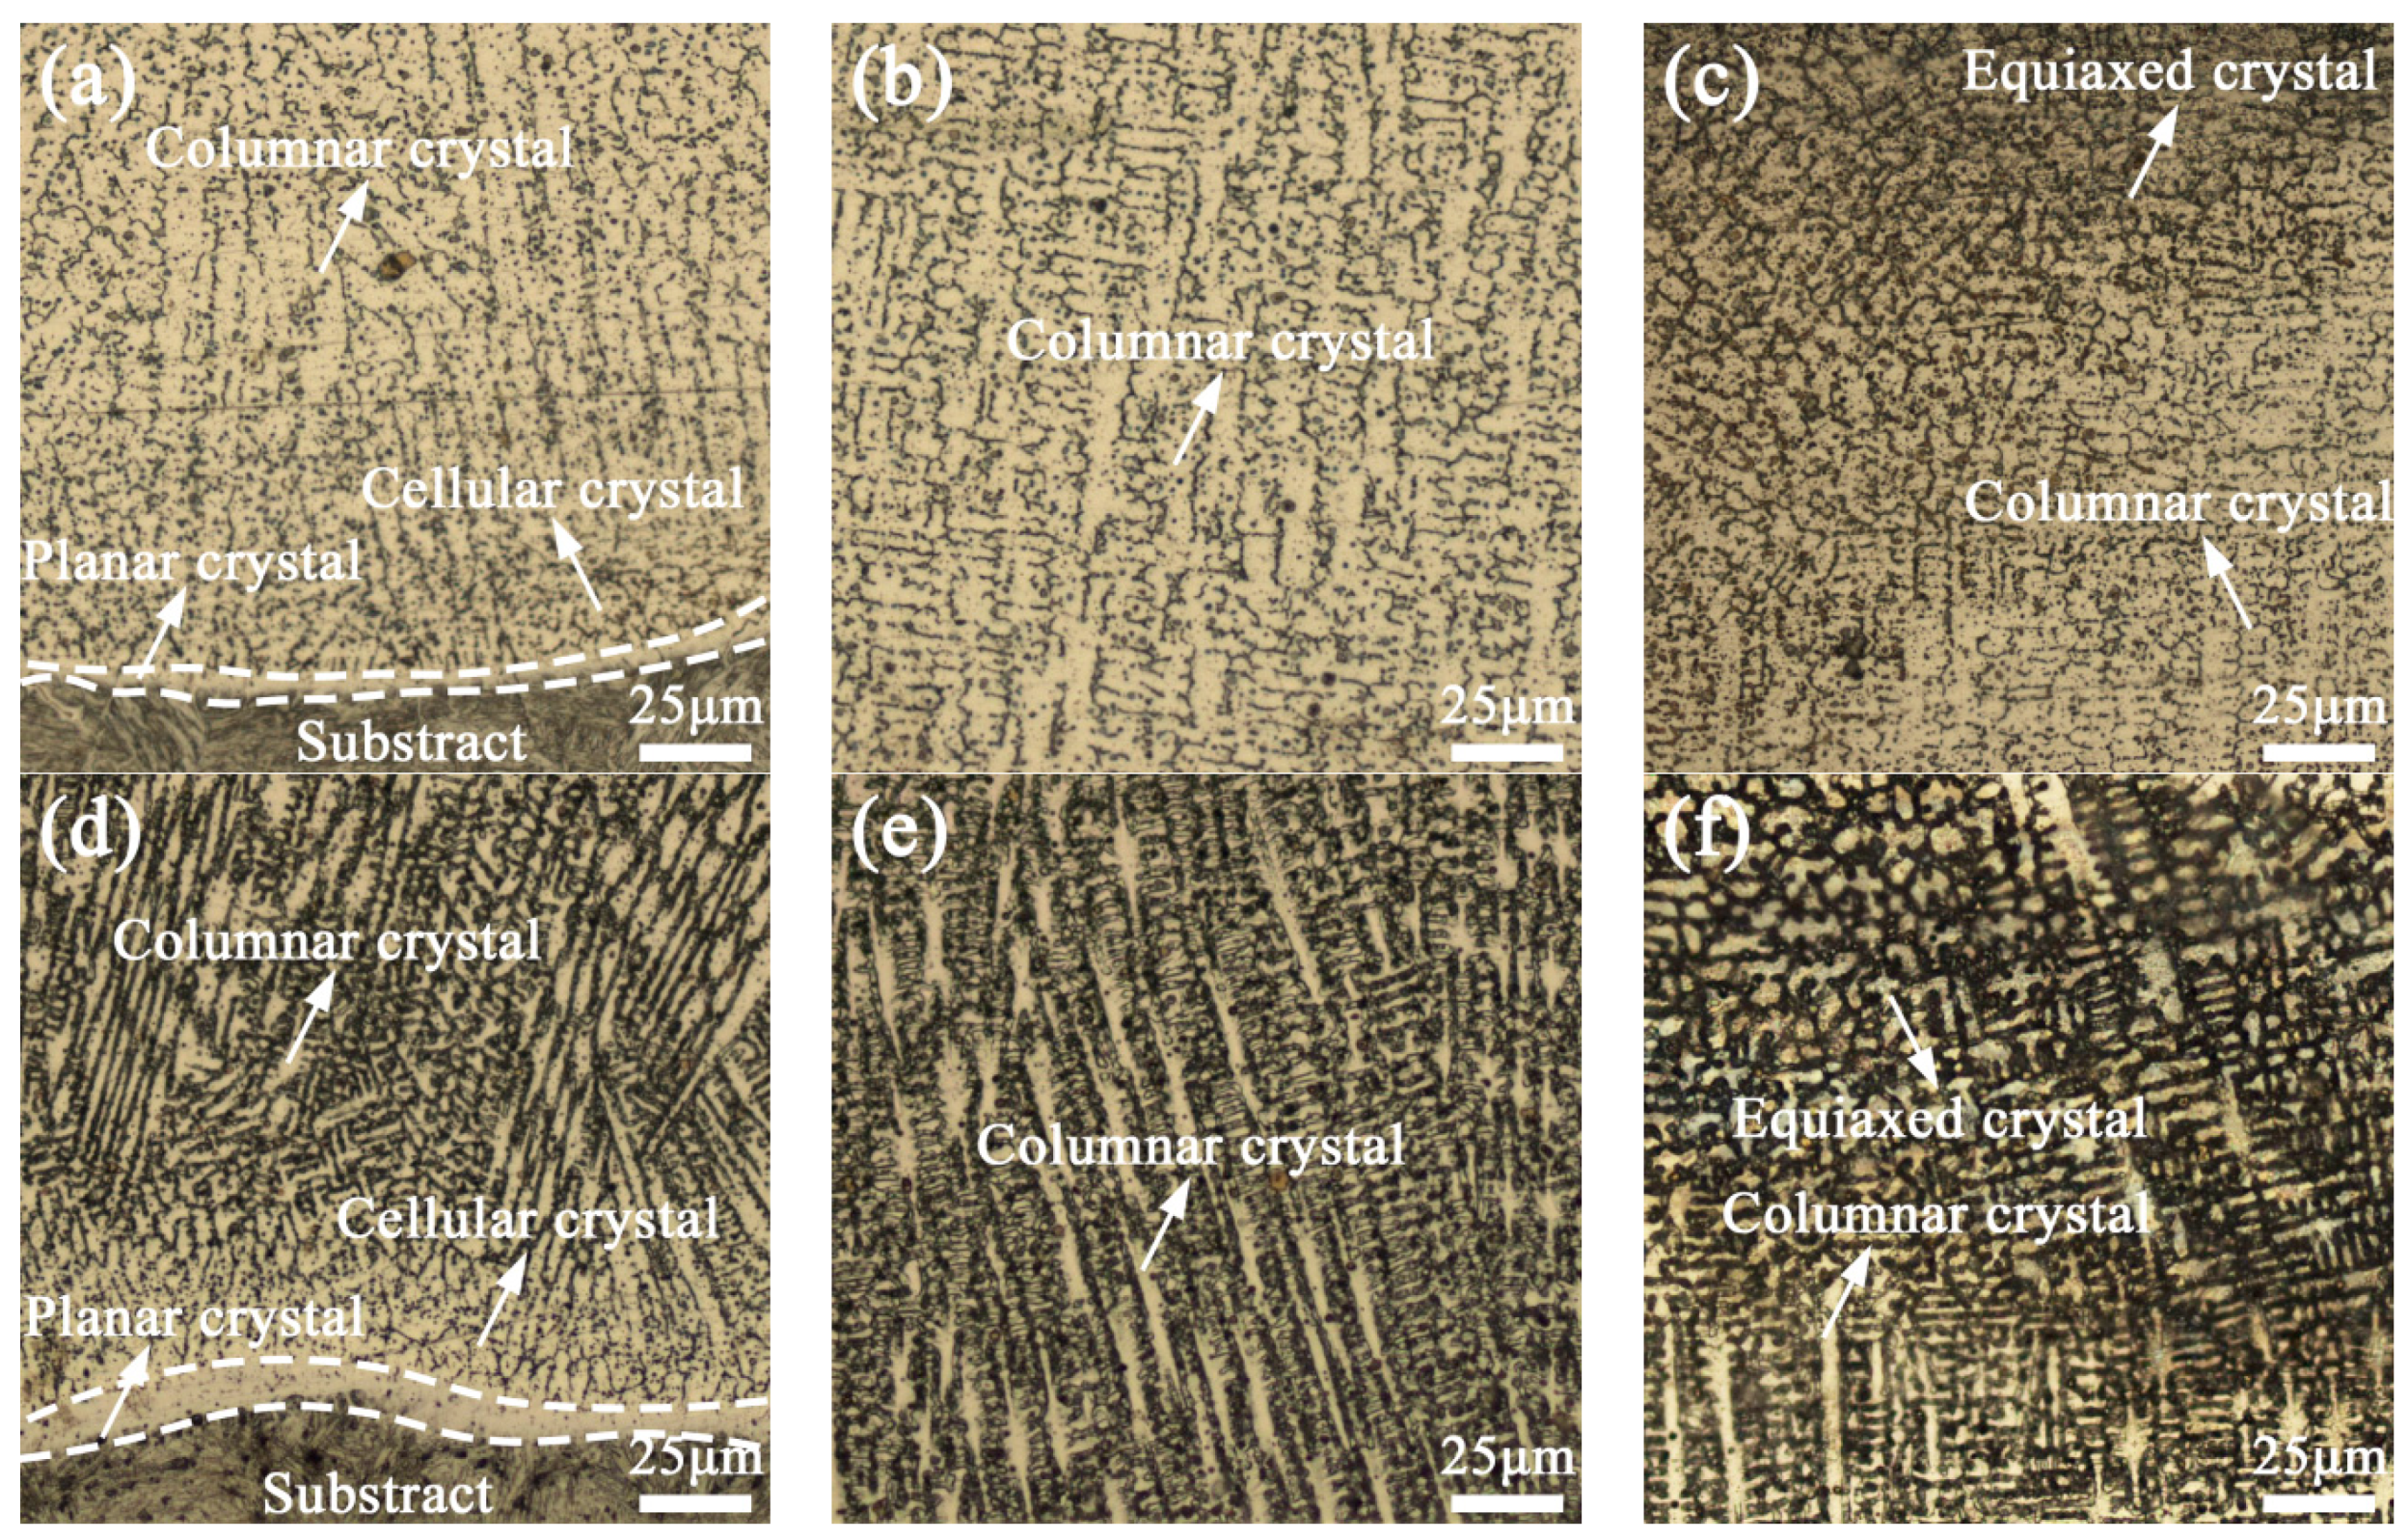
Figure 8 shows the OM images of cross section microstructure of the bottom, middle and top of composite coatings at different laser power when the laser scanning speed is 12 mm/s. According to Equations (7) and (8), the decrease of the laser power will lead to the increase of
G/R, and the decrease of
G × R. Coating 2# (2.2 kW) shows a thin planar crystal (
Figure 8a), which is only 4.68 μm, and the amount of cellular crystals is much lower than that of columnar crystals and equiaxed crystals (
Figure 8a–c). In addition, the primary and secondary dendrite arms of columnar dendrites are well developed as the relatively high cooling rate
G × R. As the laser power decreases to 1.3 kW, coating 5# shows a thicker planar crystal (8.52 μm) and more cellular crystals compared with coating 2# (
Figure 8d). However, compared with coating 4# (1.6 kW), the amount of equiaxed crystals of coating 5# does not decrease significantly. The reason of the above phenomenon may be related to the relatively weak Marangoni convection in coating 5# for the lower energy input compared with coating 4#, for which more TiB
2 particles in the top of the single-pass will be conducive to provide the sufficient nucleus for the formation of equiaxed crystals.
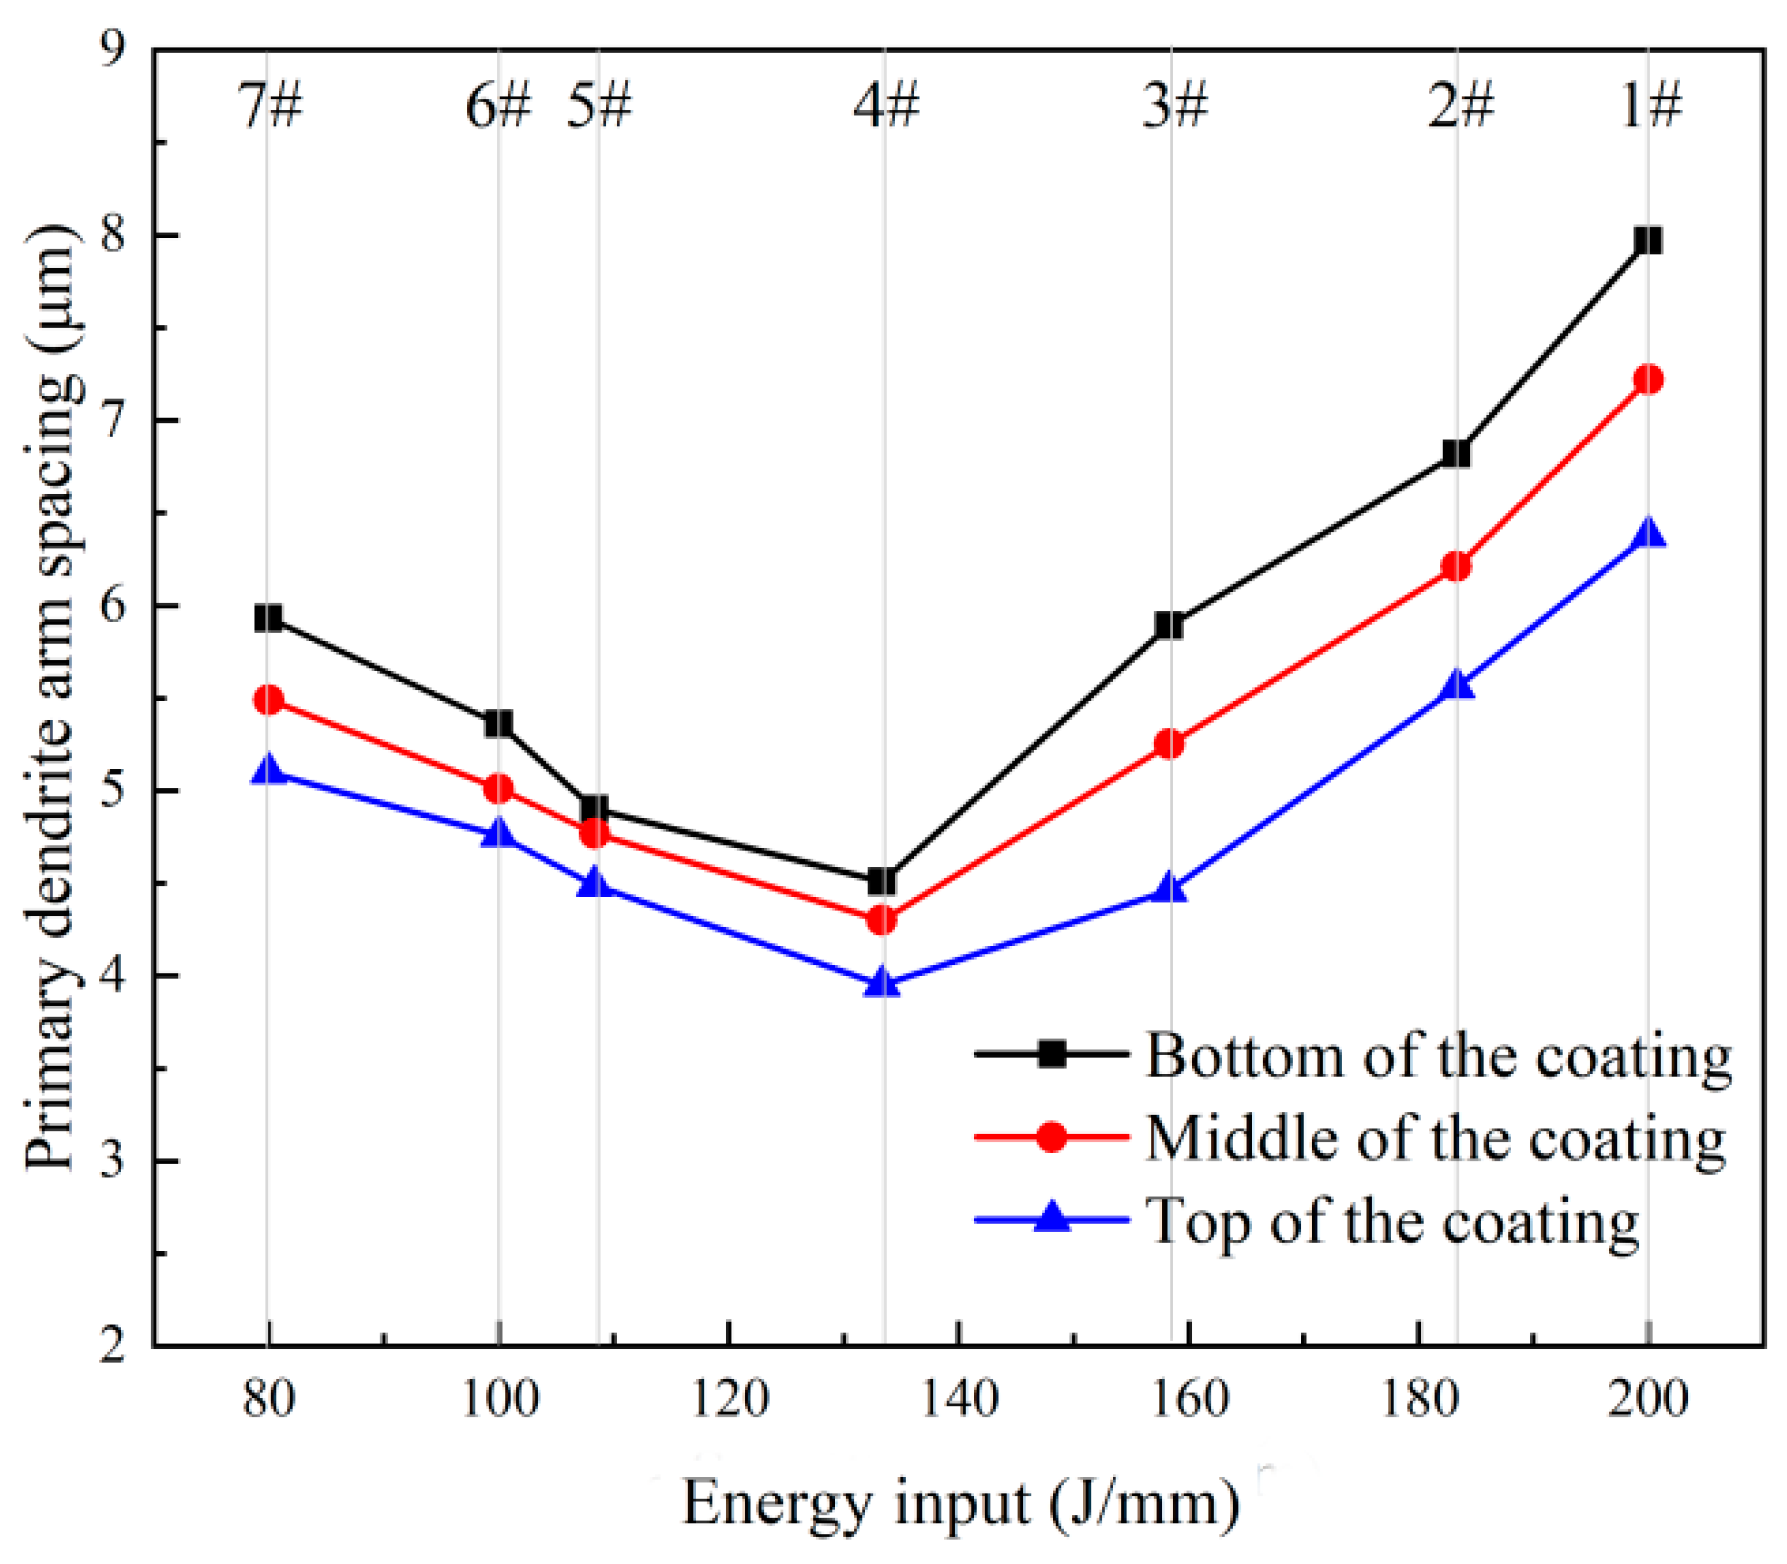
In order to illustrate the influence of process parameters on the grain size in the bottom, middle and top of composite coatings, at least 30 primary dendrite arm spacing (PDAS) of dendrites in each zone were measured, and the results are shown in
Figure 9. It can be noted that the PDAS of different zones in the composite coatings decreases from the bottom to top, which is associated with the increase of the cooling rate
G × R. According to Equation (8),
G × R increases with the decrease of energy input, which is beneficial to the decrease of the PDAS. As the energy input decreases from 200.00 J/mm to 133.33 J/mm, the average of the PDAS decreases from 7.19 μm to 4.25 μm, which is consistent with the above analysis. However, with the energy input decreases from 133.33 J/mm to 80.00 J/mm, the average value of PDAS increases from 4.25 μm to 5.50 μm instead. In LC, the dendrite growth in the composite single-pass is not only related to the process parameters, but also is influenced to the reinforcing phase particles [
29], so it infers that the reason for the above phenomenon may be related to the distribution and size of TiB
2 particles in composite single-passes.
3.3. Characteristics of TiB2 Particles and Laves Phase
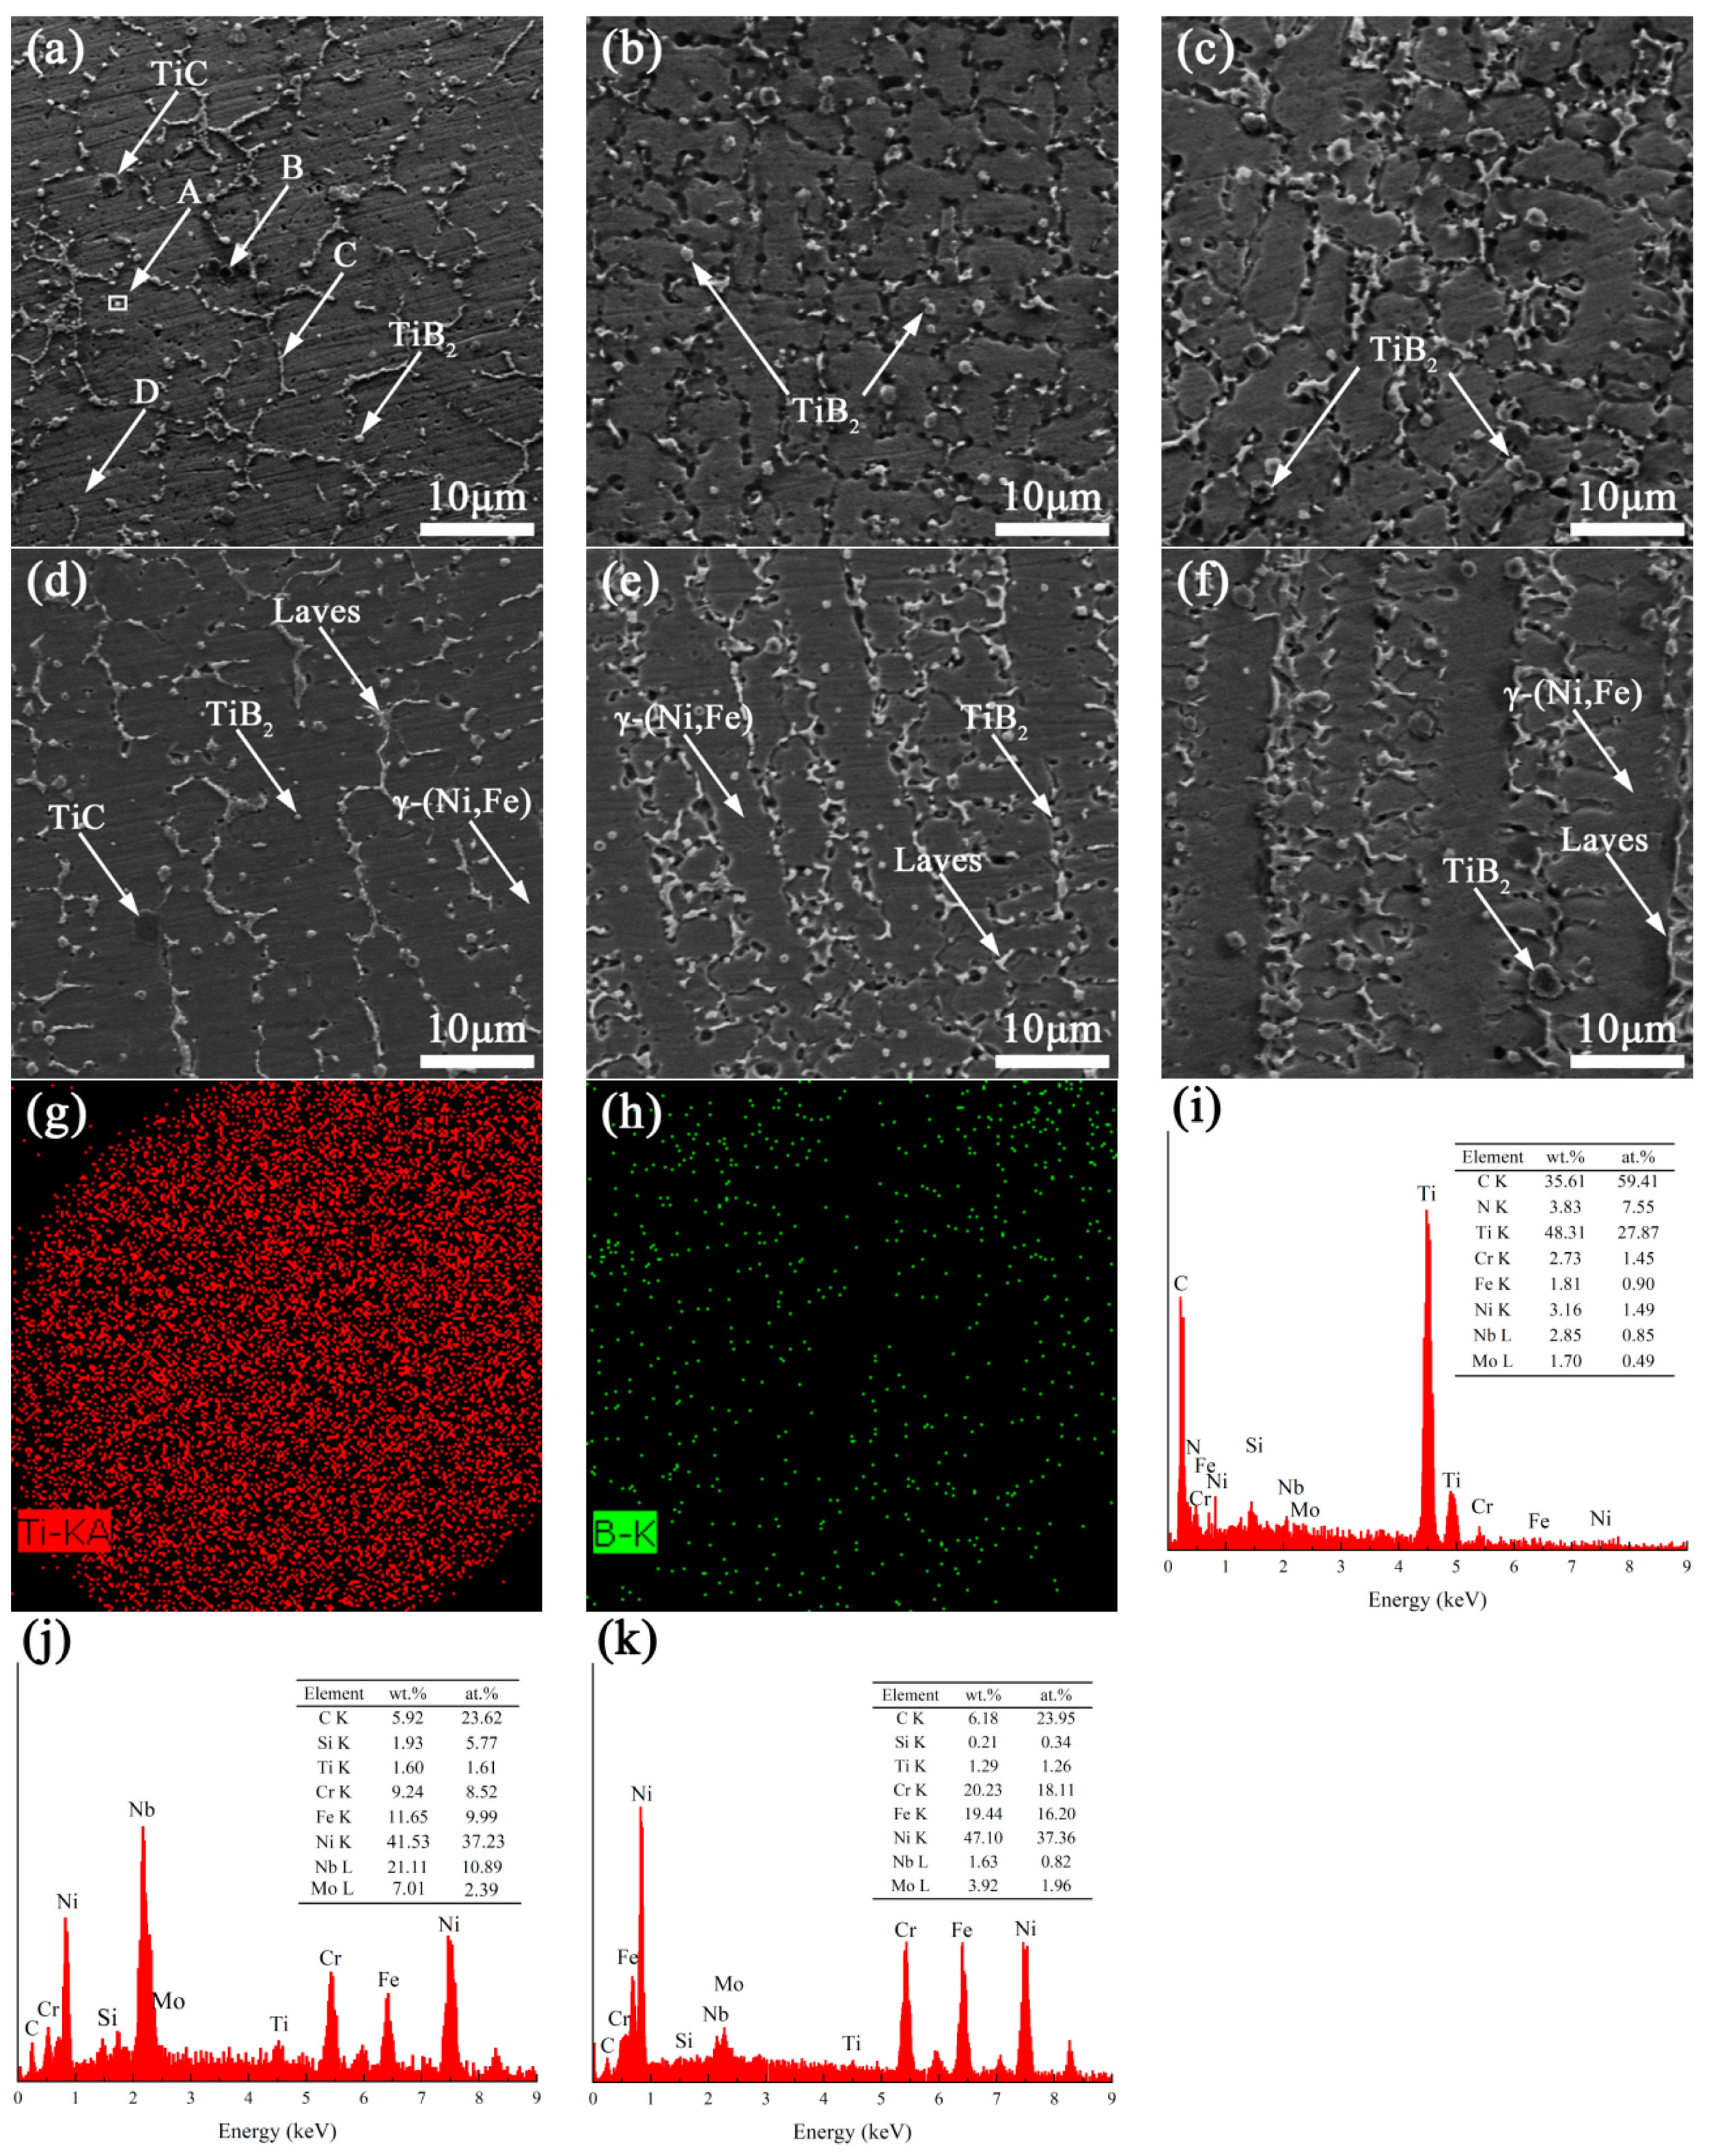
Figure 10a–d shows the SEM images of the cross section microstructure of the top and middle of coating 1#, 4#, and 7#. It can be noted that there are light grey particles distribute in dendrites mostly, which are considered as TiB
2 particles from the EDS analysis (
Figure 10g,h). It can also be concluded that the distribution and size of TiB
2 particles have changed as the change of the process parameters, which can be attributed to the Marangoni convection and the velocity of TiB
2 particles. According to the Stokes formula [
30]:
where
is the velocity of TiB
2 particle,
is the acceleration of gravity,
is the radius of TiB
2 particle,
and
are the density of the liquid and TiB
2 particle, and
is the viscosity of the liquid.
It is clear that the TiB
2 particles with small radius are inclined to move slowly. When the velocity of TiB
2 particles is lower than that of solid-liquid interface, they will be captured by the solid-liquid interface and remain inside the dendrites [
31]. Because of the large energy input and the intense Marangoni convection of coating 1# (200.00 J/mm), the sufficient liquid flow contributes to the effective wetting of the TiB
2 particles, and the degree of dissolution of TiB
2 becomes large, leading to the decrease of the radius of TiB
2 particles and homogeneous distribution of TiB
2 particles inside dendrites (
Figure 10a,c). In addition, there are few quadrangular particles (region B) in coating 1#, the EDS analysis of region B shows 48.31 wt.% Ti and 35.61 wt.% C (
Figure 10i), which indicates that those particles may be TiC for the released Ti from the dissolved TiB
2 particle is very inclined to combine with C. However, the formation of large TiC particles weakens the effect of heterogeneous nucleation of TiB
2 particles for the small specific surface area. When the energy input is 133.33 J/mm, compared with coating 1#, only the polygonal edges of TiB
2 particles dissolve and the radius of TiB
2 particles is larger in coating 4# (
Figure 10b,e). Because the increase of the radius of TiB
2 particles, more TiB
2 particles are inclined to be expelled by solid- liquid interface, leading to few TiB
2 particles are distributed along the grain boundaries. Due to Zener Pinning effect, the TiB
2 particles distributed along the grain boundaries increase the frictional resistance for the movement of grain boundaries, inhibit the grain growth and finally result in grain refinement [
32]. As the energy input decreases to 80.00 J/mm further, the content of Marangoni convection is much small which reduces the effect of wettability between the TiB
2 particles and the liquid significantly, so coating 7# shows large size TiB
2 particles which aggregate along the grain boundaries. The inhomogeneous distribution along grain boundaries of TiB
2 particles weakens the effect of grain refinement greatly, which is the reason why the PDAS increases with the decrease of energy input which is below 133.33 J/mm.
As shown in
Figure 10a–f, white precipitated phases can be observed along the dendrite boundaries. EDS analysis was conducted on the white precipitated phase and the dark grey area, and the results are shown in
Figure 10j,k, respectively. The white precipitated phase is rich in elements of Nb and Mo with the content of 21.11 wt.% and 7.01 wt.%, which are higher than those of the dark grey area with 1.63 wt.% Nb and 3.92 wt.% Mo, while the contents of Ni, Fe and Cr of white precipitated phase are 41.53 wt.%, 11.65 wt.% and 9.24 wt.%, which are relatively lower than those of the dark grey area (47.10 wt.% Nb, 19.44 wt.% Fe and 20.23 wt.% Cr). Therefore, it is considered that the white precipitated phase and the dark grey area are Laves and γ-(Ni, Fe) for the reason that the Laves consumes lots of Nb and Mo elements from the γ-(Ni, Fe). When the energy input is 200.00 J/mm (1#), due to the low cooling rate for the high energy input, the solid solubility of Nb and Mo in γ-(Ni, Fe) decreases, and more Nb and Mo elements are expelled by solid-liquid interface during the rapid solidification, which is beneficial to the formation of Laves along the dendrite boundary. Hence, the high content Laves phases are distributed along the dendrite boundaries in the form of continuous long chains in single-pass 5# (
Figure 10a,d). Due to coating 4# (133.33 J/mm) shows the minimum PDAS compared with others, which is negatively correlated with cooling rate, the solubility of Nb and Mo in γ-(Ni, Fe) increases, and the low content Laves phases are discretely distributed along the dendrites boundaries in the form of particles (
Figure 10b,e). Owing to the PDAS of coating 7# (80.00 J/mm) increases compared with that of coating 3# for the inhomogeneous distribution of TiB
2 particles with large radius, the solubility of Nb and Mo in γ-(Ni, Fe) decreases instead as the energy input decreases, which leads to the increase of the Laves content and the relatively continuous strip distribution.
3.4. Bonding Strength
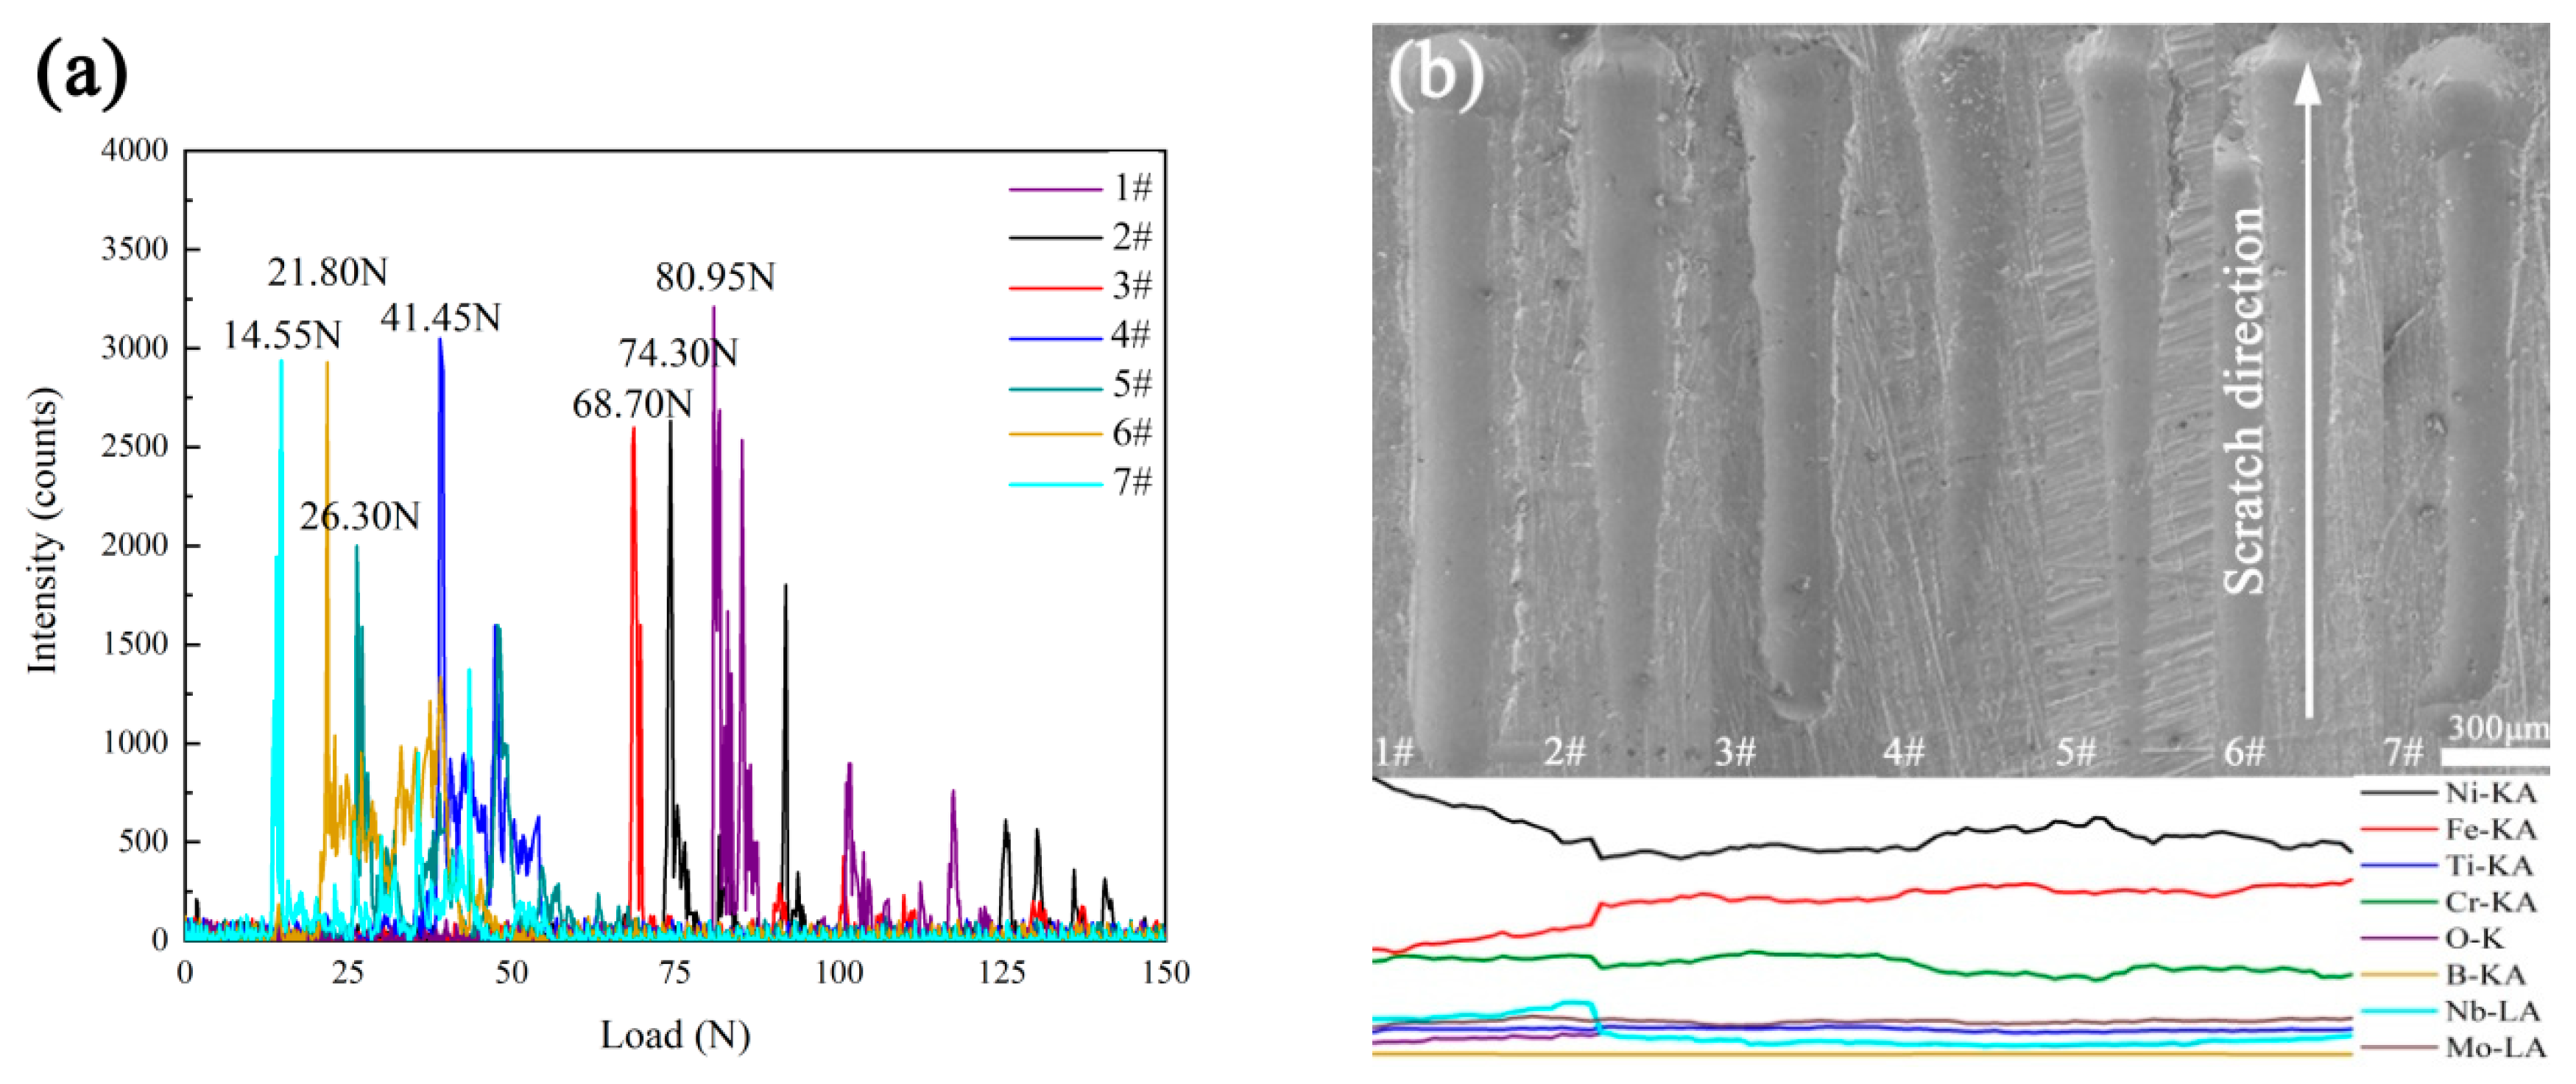
Figure 11a shows the acoustic emission of the scratch test of composite coatings. When the dynamic load of the scratch tester increases to a certain value, the scratch tester will capture the continuous and strong acoustic emission signals, which indicates that the single-pass failure has occurred in that area and the load at this time is termed as the critical bonding load
Lc. It can be noted that coating 7# is the first to fail under the
Lc of 14.55 N, coating 6#, 5#, and 4# fail when the
Lc is 21.80 N, 26.30 N and 41.45 N, respectively, and coating 3#, 2#, and 1# show great
Lc, which is 68.70 N, 74.30 N and 80.95 N, respectively.
Figure 11b shows the scratch morphology of composite coatings and the EDS line scan result of the scratch of coating 6# along the scratch direction. With the increase of dynamic load, the scratch becomes wider, and a notable decrease of Ni and Cr and an obvious increase of Fe could be observed, which means the failure of single-pass occurred at the position where the content of Ni, Cr and Fe changed. The corresponding scratch width
dS can be measured manually, and the bonding strength
HSL of composite coatings can be calculated by the following formula [
33]:
Table 4 shows the results of the scratch test of composite coatings. It can be noted that the bonding strength
HSL shows the positive relationship with energy input, and the bonding strength
HSL increases from 0.39 GPa to 1.91 Gpa as the energy input increases from 80.00 J/mm to 200.00 J/mm, which is consistent with the analysis above that the increase of energy input is beneficial to the metallurgical bonding between the coating and substrate.
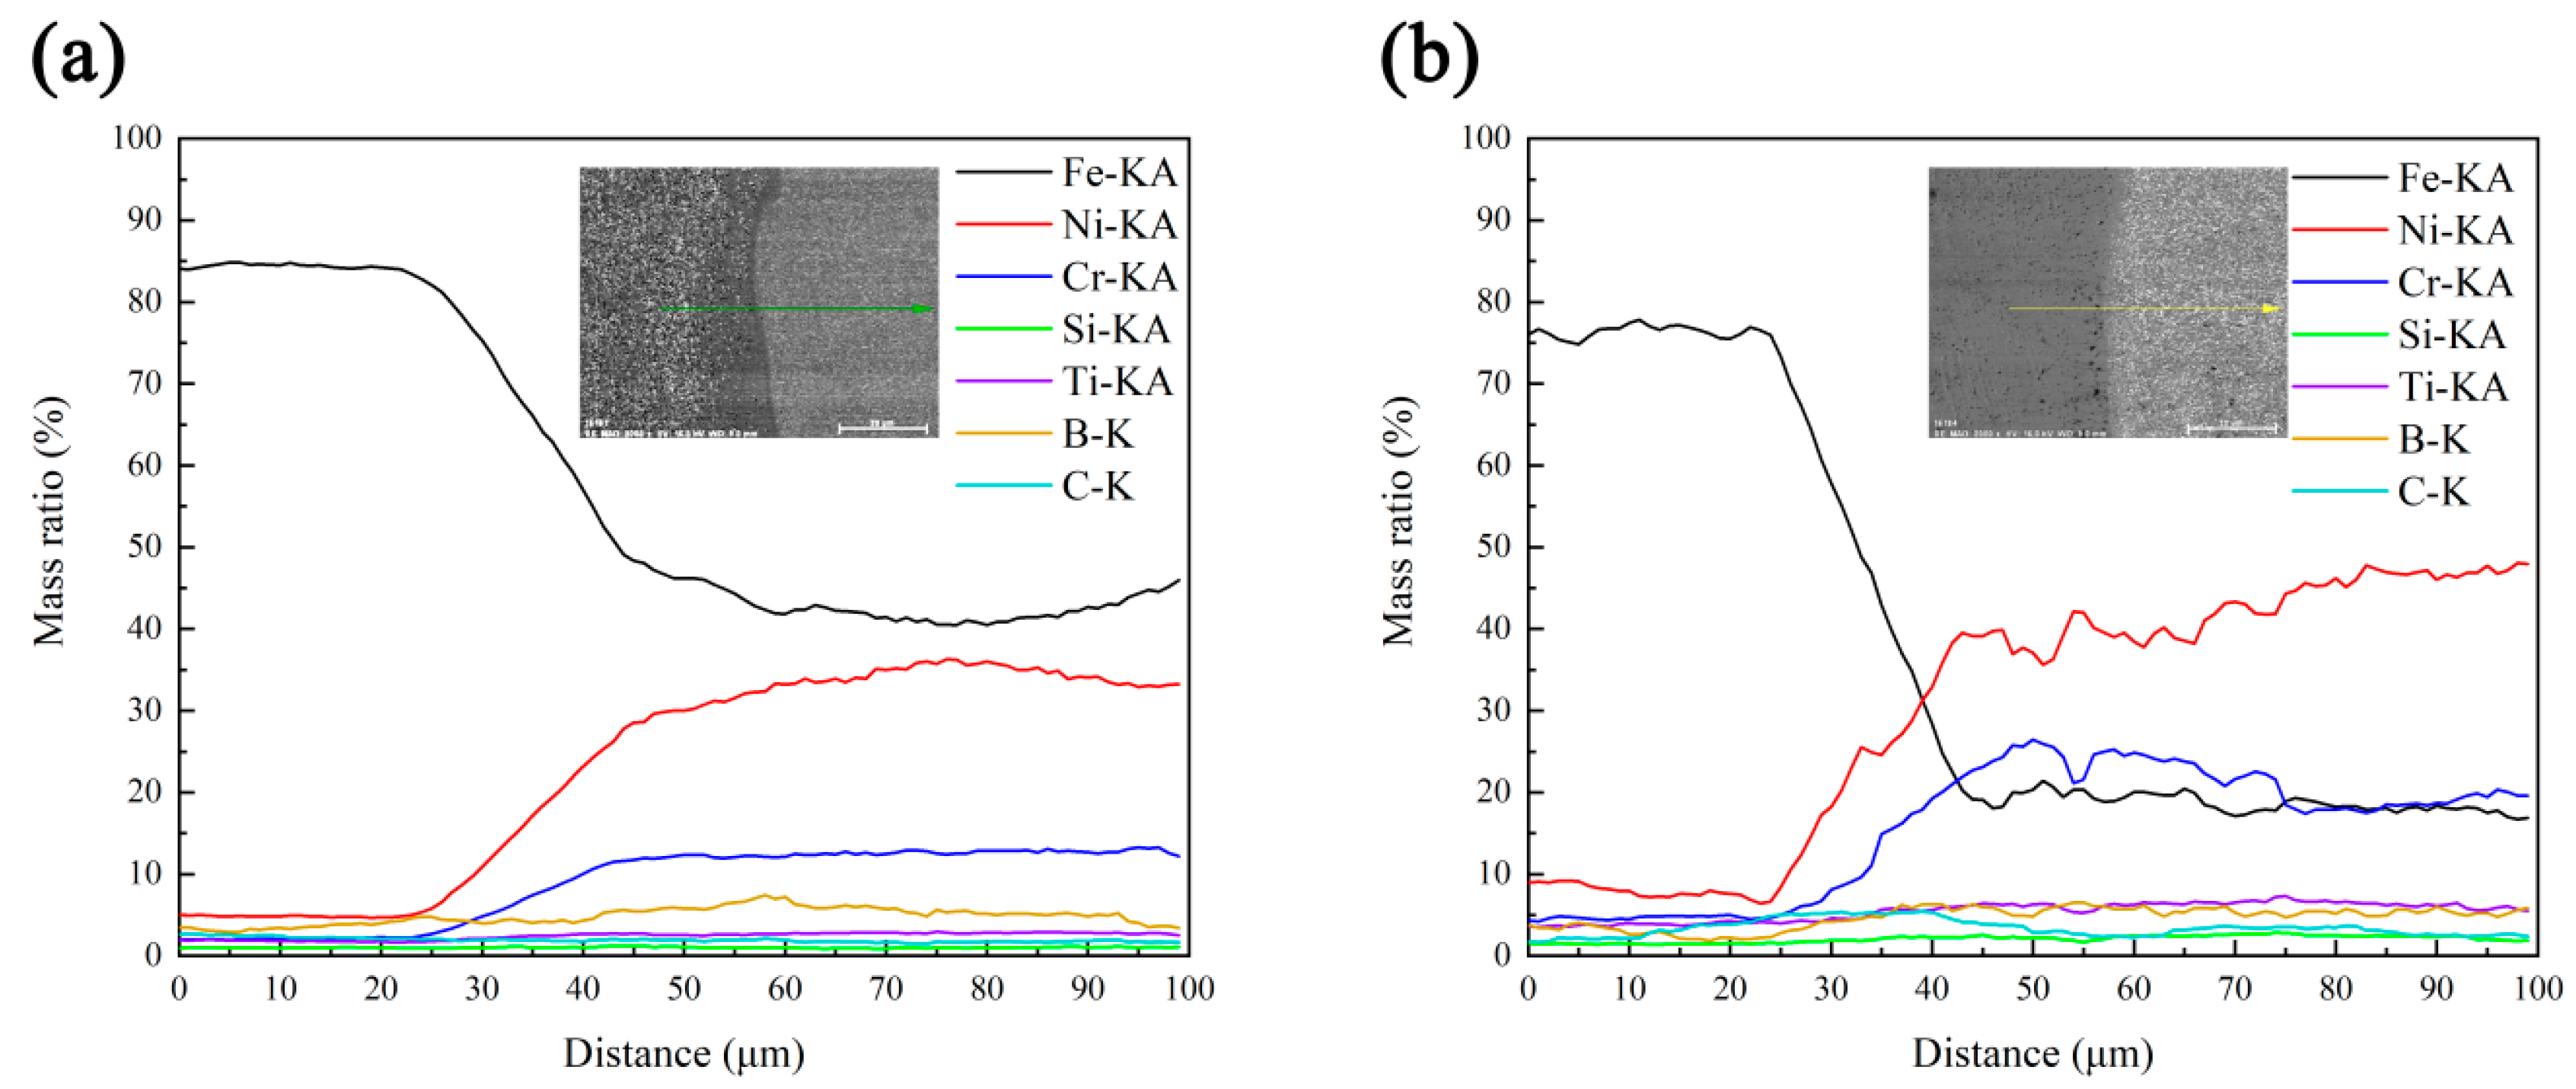
Figure 12 presents the element distributions of coating 1# (200.00 J/mm) and 7# (80.00 J/mm). From the EDS line scan results, it can be noted that Ni and Cr are the dominate elements at the bottom of composite coatings, and the content of Fe reaches the highest value in substrates. As scanning line crosses the interface, a notable decrease in Fe and an obvious increase of Ni and Cr could be observed. Due to the high dilution rate caused by intense Marangoni convection in coating 1#, the content of Fe in the bottom of coating 1# is 45 wt.% approximately (
Figure 12a), which is higher than that of the bottom of coating 7# with 20 wt.% Fe (
Figure 12b). Zhang et al. [
34] have proved that γ-Ni is the base phase in the interface between the coating and substrate, and the solubility of Fe in γ-Ni is infinite from the Ni-Fe binary diagram [
35]. Therefore, the increase of Fe around the interface as the increase of energy input is beneficial to the formation of γ-(Ni,Fe) solid solution, which leads to the enhanced solution strengthening and the increase of the bonding strength
HSL.
3.5. Microhardness
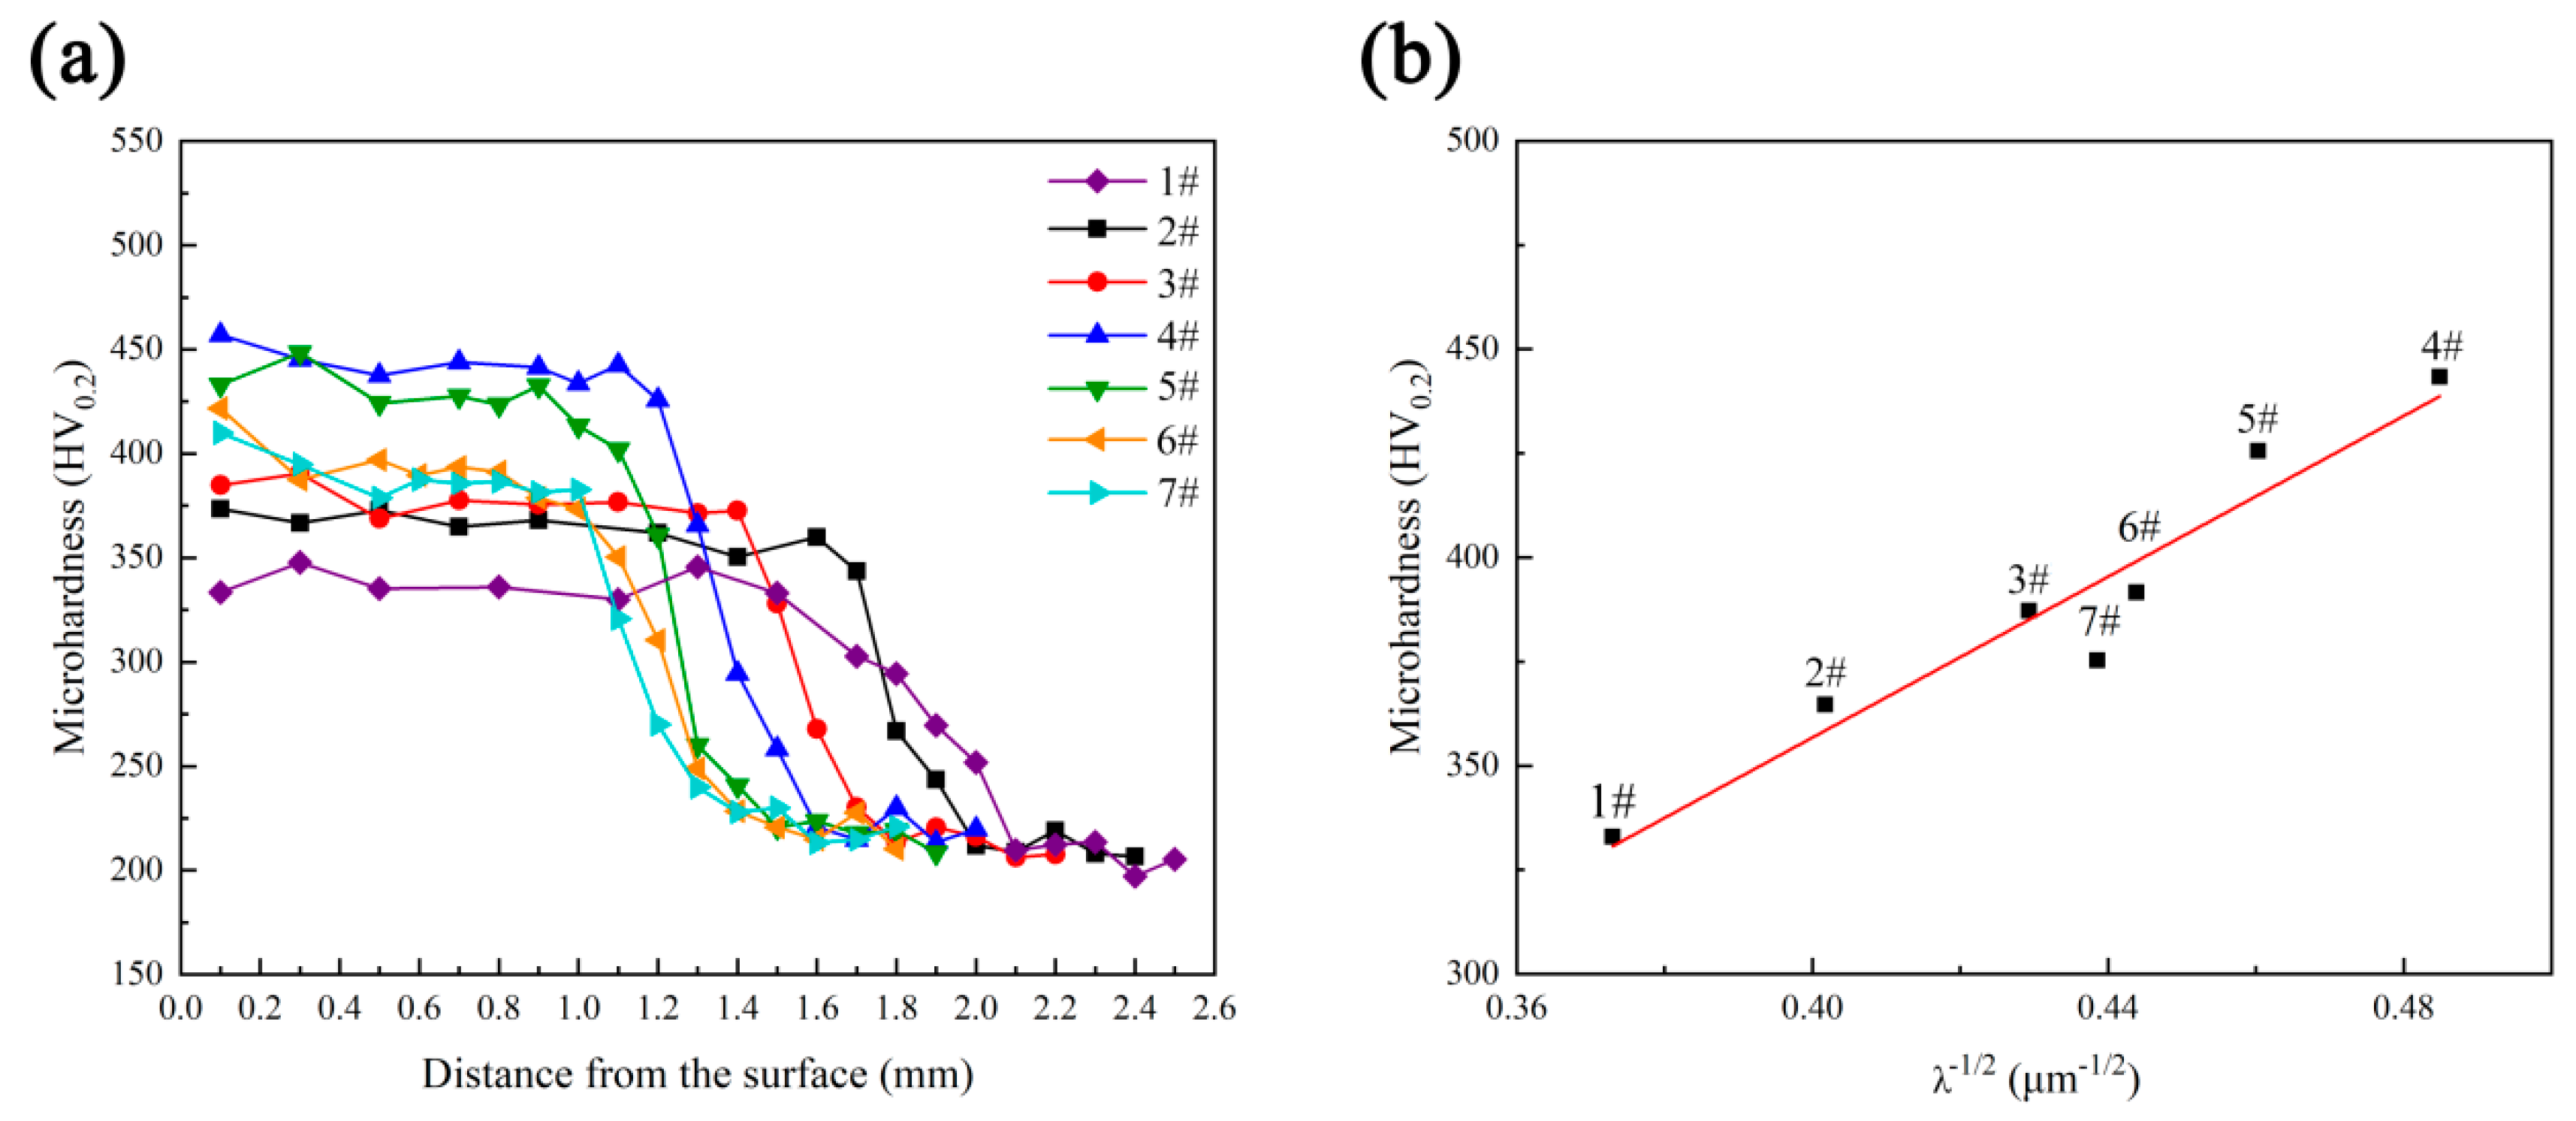
Figure 13a shows the microhardness distribution of composite coatings. It can be noted that the microhardness of composite coatings varies as the energy input changes, which is generally higher than that of 45# steel substrate (207.6 HV
0.2–221.4 HV
0.2). Another phenomenon that should be paid attention is that the microharness of the top coating is relatively higher than other regions for the high cooling rate and the residual TiB
2 particles which are prone to aggregate in the top of the coating, which is obvious in coating 7# and 6#. Due to the dilution between of the coating and the substrate, there is a certain content of γ-(Ni, Fe) solid solution in the heat affect zone, which also experienced rapid cooling during LC, and the microhardness of heat affect zone is between that of the coating and the substrate.
Because of the large difference between the radius of Nb and Mo and that of Ni, the element Nb and Mo can cause the lattice distortion in γ-(Ni,Fe), which is beneficial to the increase of the resistance to the dislocation motion and the plastic deformation [
36], and the coating with less Laves which is enriched in Nb and Mo shows higher microhardness. Therefore, as the energy input decreases from 200.00 J/mm (1#) to 133.33 J/mm (4#), the content of Laves decreases for the decrease of PDAS, which is positively related to the cooling rate, and the average microhardness increases from 333.1 HV
0.2 to 443.3 HV
0.2. Besides, the microharness of coating 4# not only is the highest among composite coatings, but also shows a uniform distribution, which can be attributed to the homogeneous distribution of TiB
2 particles. However, the Laves content increases as the energy input decrease further for the decrease of cooling rate, which lead to the microhardness values of coating 5#, 6#, and 7# are relatively lower than that of coating 4#. Besides, the microharness difference in these coating 6# and 7# is obvious for the inhomogeneous distribution of TiB
2 particles with large radius, which can also reduce the microharness for the increase of the dispersion reinforcement.
Figure 13b shows the relationship between grain size
and average microhardness of composite coatings under different process parameters, where the grain size
can be replaced by the PDAS. It can be noted that
has a linear relationship with microhardness, which suggests that the relationship between the microharness and grain size satisfies the classical Hall-Petch equation [
37]. Namely, the decrease of grain size improves the degree of grain reinforcement, which is beneficial to the formation of more grain boundaries. As a result, the external force that requires to produce the dislocation pile-up increases, which enhances the microhardness.
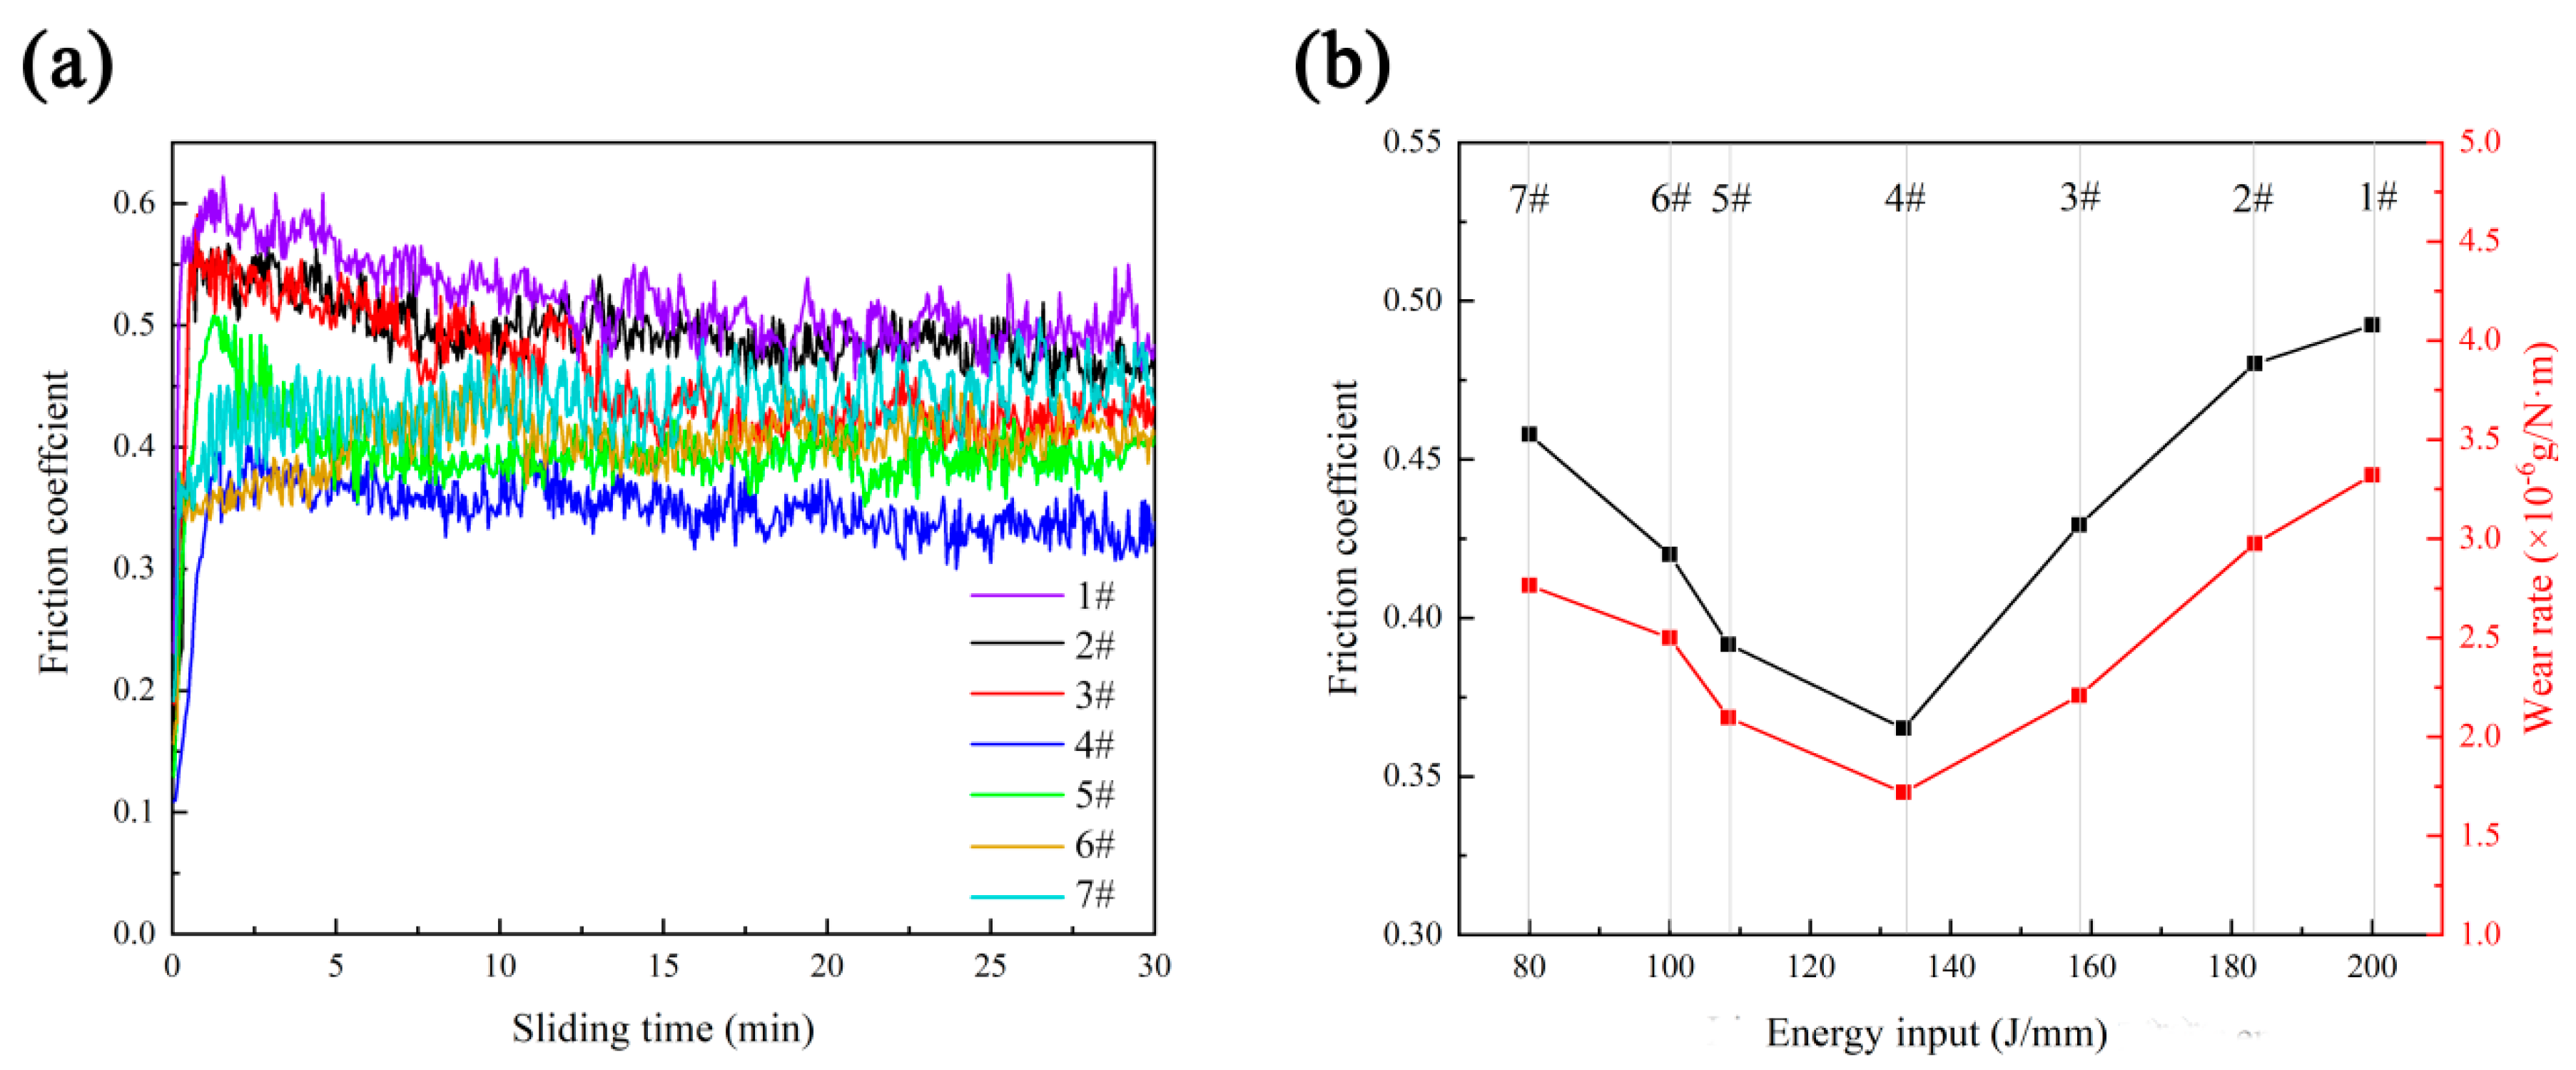
3.6. Tribological Properties
Figure 14a shows the friction coefficient curves of composite coatings. It can be seen that the friction coefficients tend to be stable after a brief running contact period and the friction coefficient curve of coating 7# fluctuates the most, which can be attributed to the inhomogeneous distribution of TiB
2 particles. The calculated friction coefficient and wear rate are presented in
Figure 14b. It shows the same trend of friction coefficient and wear rate as the energy input changes, which is consistent with the change of the microharness. As the energy input decreases from 200.00 J/mm (1#) to 133.33 J/mm (4#), the friction coefficient and the wear rate decrease from 0.49 and 3.3 × 10
−6 g/(N·m) to 0.37 and 1.72 × 10
−6 g/(N·m), respectively, but the friction coefficient and the wear rate gradually increase to 0.46 and 2.76 × 10
−6 g/(N·m) as the energy input continues to decrease to 80.00 J/mm (7#).
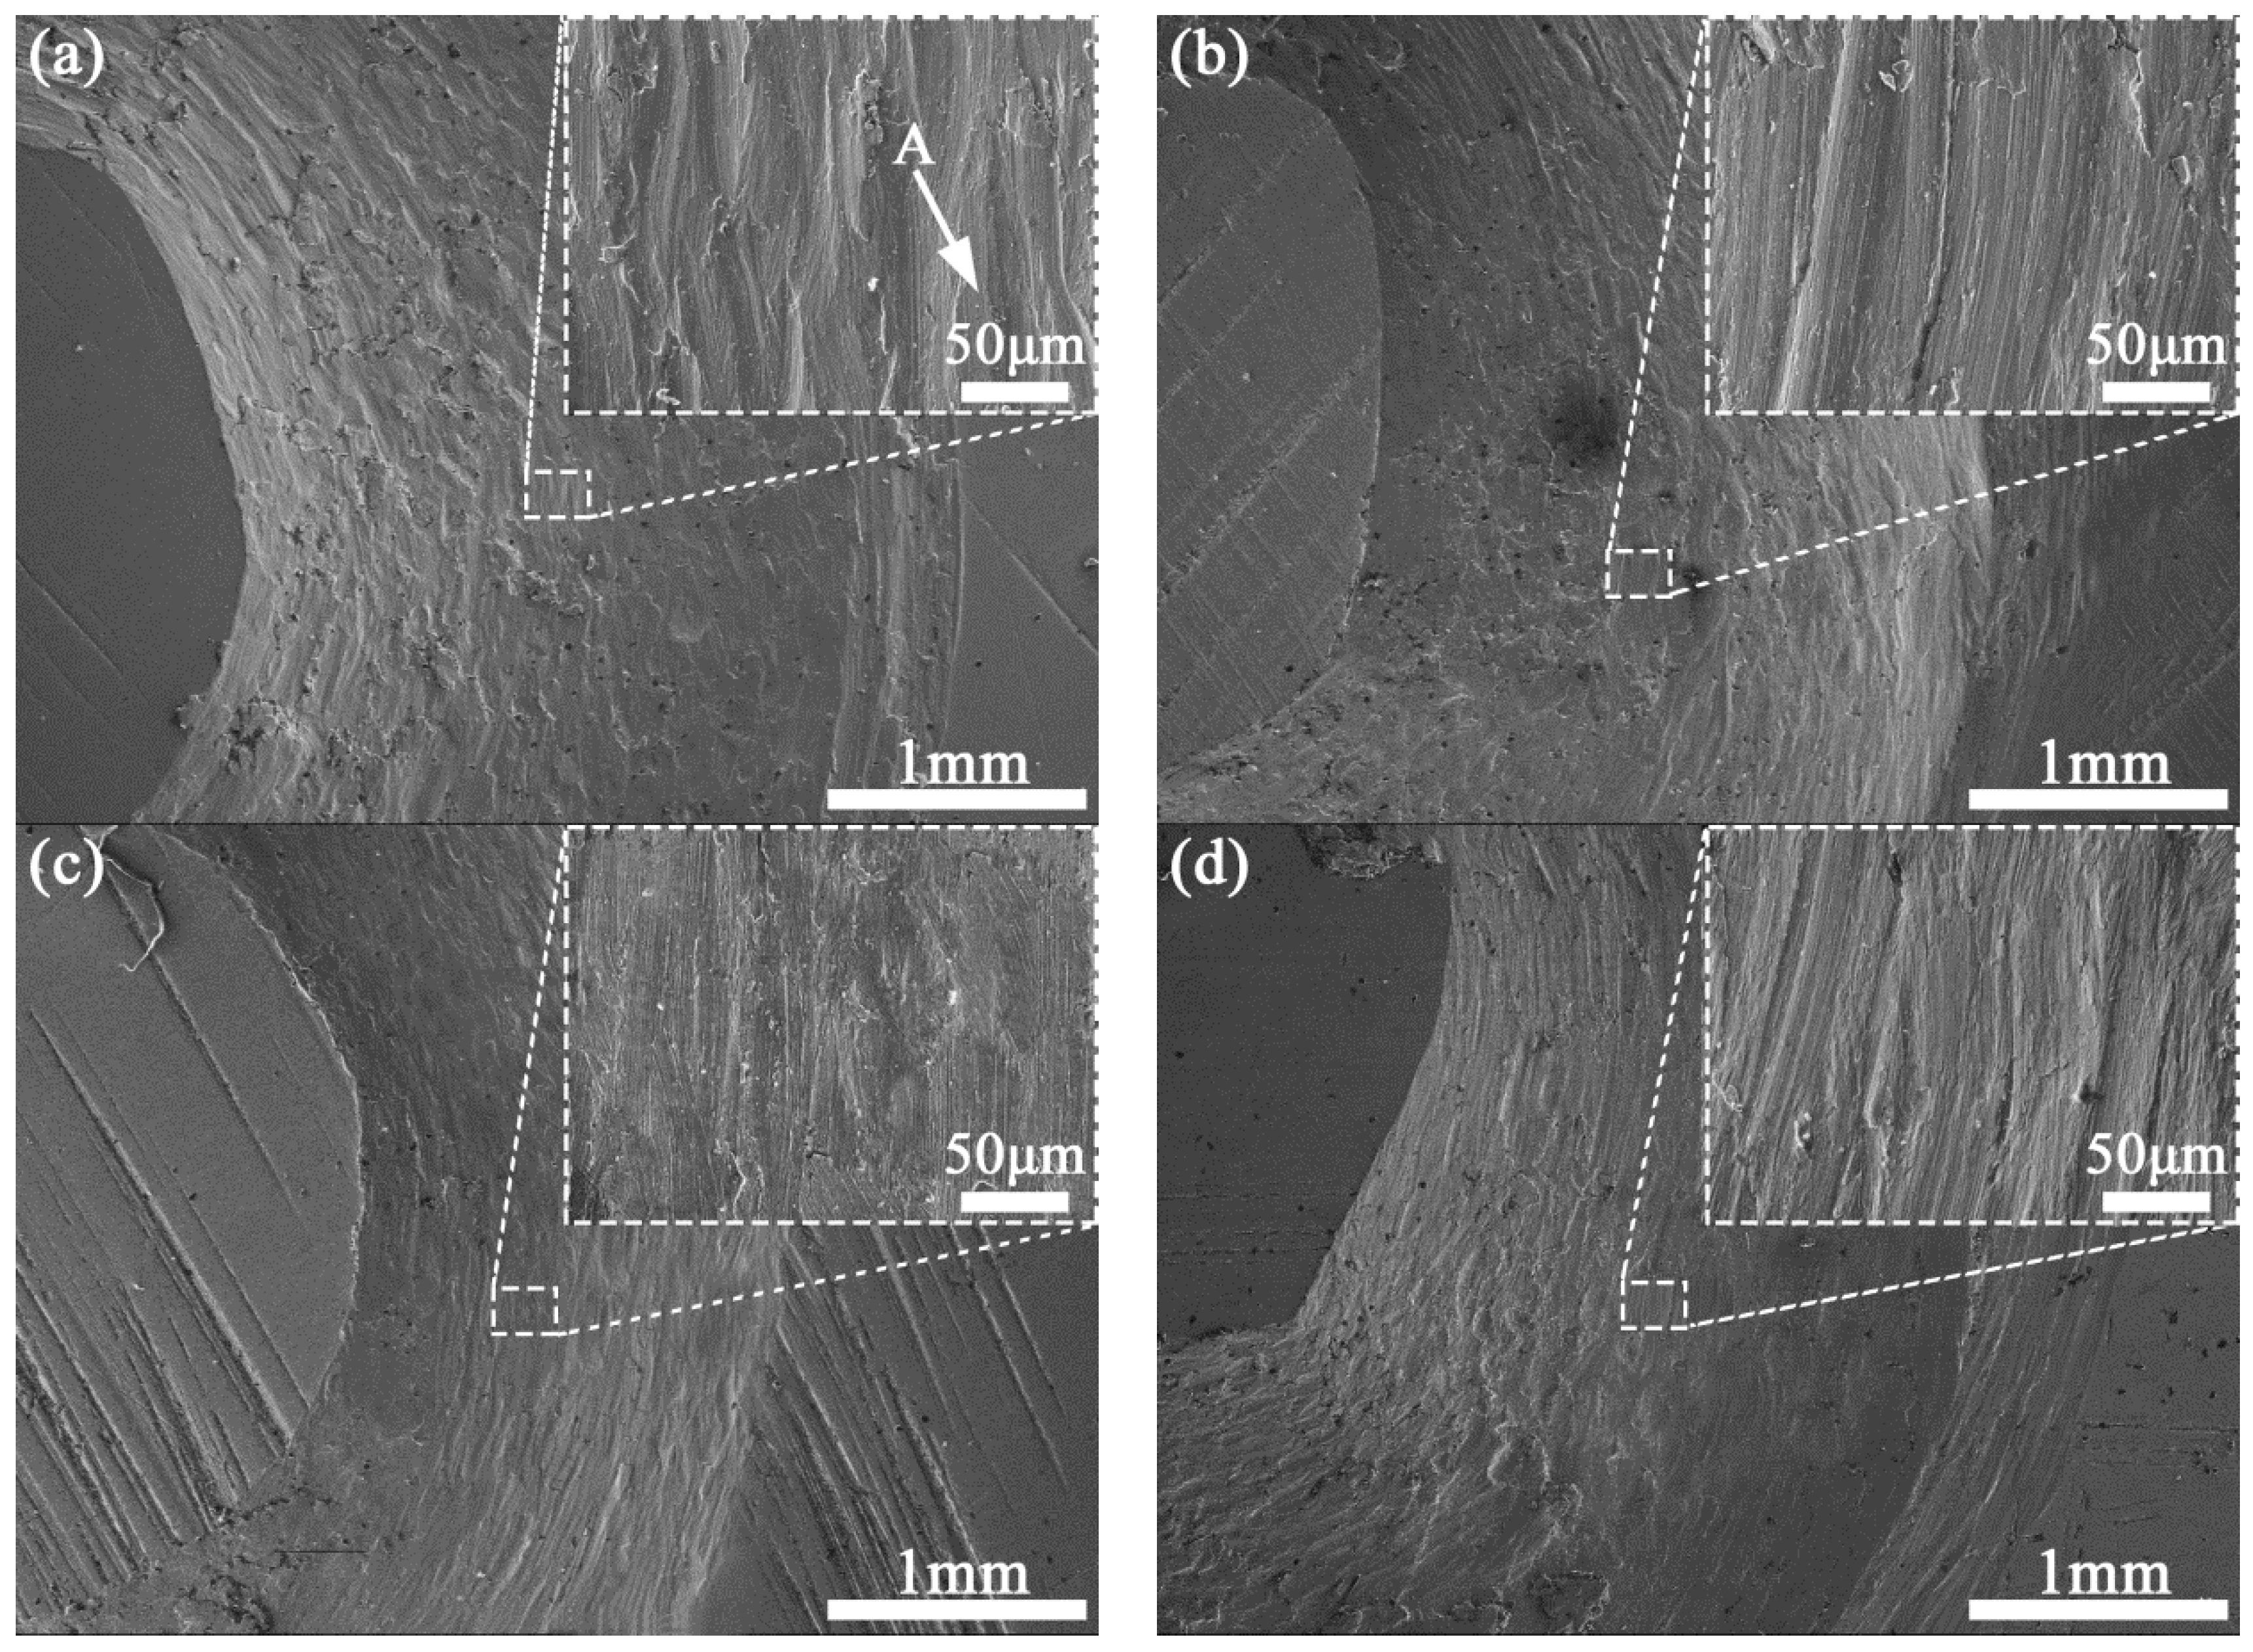
At the high energy input of 200.00 J/mm, the worn surface of coating 1# is quite wide (2.74 mm) and rough for the low microhardness and poor resistance ability against the micro-cutting of GCr15 steel ball, where exists many spalling pits, deep furrows and serious plastic deformation (
Figure 15a). The high content Laves phases with the form of continuous long chains in coating 1# provide places for the nucleation and expansion of the cracks, which increases the crack sensitivity and decreases the toughness, and easily result in the peeling off of large wear debris which in turn results in three-body abrasive wear. Under the repeated rolling of hard GCr15 steel ball, the wear debris tended to adhere to the worn surfaces, which is the typical characteristic of the adhesive wear. From the EDS analysis of region A (
Table 5), it can be seen that the contents of O and Fe are 34.07 wt.% and 32.01 wt.%, respectively, higher than the content of Ni (18.48 wt.%), which indicates the worn surface was oxidized for the friction heat. Therefore, the wear mechanism of coating 1# is serious multiple-plastic wear, adhesive wear and oxidative wear. As the energy input decreases to 158.33 J/mm, coating 3# shows a smoother and narrower worn surface (2.36 mm) compared with coating 1# for the increase of the microhardness and the decrease of the Laves content (
Figure 15b). However, there still exists some plastic deformation zones and scratches caused by the action of GCr15 steel ball and wear debris, which suggests the main wear mechanism of coating 3# concludes multiple-plastic wear and abrasive wear.
When the energy input is 133.33 J/mm, due to the high microhardness, the worn surface of coating 4# becomes quite narrow (1.84 mm) and smooth which is free of serious spalling pits, furrows and plastic deformation (
Figure 15c). In addition, the TiB
2 particles with homogeneous distribution could be acted as effective wear—resistant fulcrums, so there are only a few scratches on the worn surface, which indicates the wear mechanism of coating 5# is slight abrasive wear. However, as the energy input decreases to 80.00 J/mm, due to the decrease of microhardness and the increase of Laevs content, coating 7# shows a rougher and wider worn surface (2.03 mm) compared with coating 4#, where spalling pits, furrows and plastic deformation exist (
Figure 15d). Besides, for the difference between the thermal expansion coefficient and the elastic modulus of TiB
2 particles and Inconel 718 alloy matrix, the Inconel 718 alloy matrix shrinks faster than the TiB
2 particles during the solidification, which causes TiB
2 particles to undergo large compressive stress [
38]. So the cracks are prone to nucleate and expand in the TiB
2 particle aggregation region of coating 7#, which causes the peeling off of large wear debris. During the wear process, the large-sized TiB
2 particles with inhomogeneous distribution are easily separated from the coarse dendrites, which aggravates the three-body wear with wear debris. Therefore, the wear mechanism of coating 7# is multiple-plastic wear and abrasive wear.
Figure 16 shows the SEM images of wear debris of coating 1#, 3#, 4#, and 7#. It can be seen that the wear debris of the coating 1# is dense and adherent in the form of large-sized laminar mostly (
Figure 16a), which confirms the wear mechanism, including the multiple-plastic wear and adhesive wear. Compared with the wear debris of coating 1#, the wear debris of coating 3# becomes looser and grainier, and the content of large-sized laminar wear debris decreases (
Figure 16b), indicating the abrasive wear constitutes the main wear mechanism. The wear debris of coating 4#, which is in the form of dense granular debris, is the typical characteristic of the abrasive wear (
Figure 16c). The loose lamellar debris of coating 7# indicates the poor toughness and high brittleness, which is easy to cause the multiple-plastic wear (
Figure 16d). The EDS analyses of the wear debris above were carried out, and the results are shown in
Table 5. It can be noted that the content of O in the wear debris of coating 1# is 35.41 wt.%, which is higher than others, indicating the presence of the severe oxidative wear. And the content of O in other wear debris is relatively low, ranging from 12.2 wt.% wo 26.32 wt.%, where the content of O in the wear debris of coating 4# is the lowest. Besides, the high content of Ti (2.30 wt.%) and B (7.55 wt.%) in the wear debris of coating 7# prove the presence of TiB
2 particles, which indicates the large-sized TiB
2 particles with inhomogeneous distribution were separated from the coarse dendrites.


