Article

Study on the Measurement of Stress in the Surface of Selective Laser Melting Forming Parts Based on the Critical Refraction Longitudinal Wave

1
College of Material Science and Mechanical Engineering, Beijing Technology and Business University, Beijing 102488, China
2
School of Mechanical Engineering, Beijing Institute of Technology, Beijing 100081, China
*
Author to whom correspondence should be addressed.
Coatings 2020, 10(1), 5; https://doi.org/10.3390/coatings10010005
Submission received: 22 November 2019 / Revised: 15 December 2019 / Accepted: 18 December 2019 / Published: 19 December 2019
(This article belongs to the Section Bioactive Coatings and Biointerfaces)

Abstract

:
Measurement and control of stress in the metal forming layer is the basic problem of selective laser melting (SLM) forming parts. The critical refraction longitudinal (LCR) wave method to test stress in metallic materials has been extensively studied. However, when testing of stress in selective laser melting (SLM) forming parts using this method, some deep-seated regularities of this technology are still not clear. In order to reveal the mechanism of the LCR wave method to measure stress in SLM forming parts, specimens made of 316 L stainless steel were manufactured using meander, stripe, and chessboard scanning strategies. Static load tensile test were applied to SLM forming specimens, with the purpose to demonstrate the scanning strategy has important effect on the LCR wave method to test stress in SLM forming parts. The regularity of the LCR wave velocity on stress is obtained in this study. The anisotropic microstructure of SLM forming parts has an unneglectable effect on the LCR wave stress test. The essential principle of anisotropic microstructure effecting the LCR wave velocity in SLM forming parts were revealed in the experiments. The results of the experiment provide a basis for non-destructive and reliable test of stress in SLM forming parts and other inhomogeneous materials.

1. Introduction

Metal powder is melted directly by a high energy laser beam when selective laser melting (SLM) technology is used to form parts layer by layer. The main problem affecting the quality of SLM parts is the selection of process parameters. The process parameters mainly include scanning strategy, scanning speed, scanning interval, layer thickness, laser power and so on [1,2]. At present, in order to ensure the quality of SLM forming parts manufactured with 316 L stainless steel, usually, a large number of specimens are prepared by orthogonal experiments or single factor experiments with different process parameters, and the optimized process parameters are selected by measuring the mechanical properties of the specimens [2,3,4]. In the forming process, the rapid melting/solidification rate and repeated thermal cycle result in large temperature gradient, and residual stresses easily occurs [4,5]. Present studies [5,6,7] show that the magnitude and distribution of residual stresses are closely related to scanning path. Residual stress seriously affects the mechanical properties of SLM forming parts [8]. The critical refraction longitudinal (LCR) wave test for stress has been extensively studied [9,10,11], it has the advantages of safety, nondestructiveness, and on-line detections. The method utilizing ultrasonic velocity [12,13,14] to measure stress is the focus of current research. The mechanism of the microstructure effect on the ultrasonic test result is not clear. Therefore, it is necessary to reveal the variation mechanism of ultrasonic velocity in anisotropic SLM forming parts under stress, so the ultrasonic test for stress in SLM forming parts can be done nondestructively, quickly and accurately.
Classical acoustic-elasticity theory shows that the ultrasonic velocity in material will change under the action of stress. In recent years, scholars have carried out extensive research on this technology, and achieved some significant results [12,13,14]. Hughes and Kelly [15] proposed the expressions of ultrasonic velocity and stress in isotropic solids based on the finite deformation theory, which laid the foundation of acoustic–elasticity theory. Johnson [16,17] deduced the acoustic–elastic formula under elastic–plastic conditions based on the elastic–plastic continuum model of Green. However, due to the obvious anisotropic microstructure of SLM forming parts and the elastic–plastic deformation of materials in the process of parts preparation, the acoustic-elasticity theory needs to be developed further.
For developing more precise and efficient ultrasonic methods to measure stress in SLM forming parts, there are two kinds of research methods at present. Firstly, the acoustic-elastic formulas suitable for the testing objects are deduced based on the theory of elastic-plastic deformation [16,17,18]. Secondly, the acoustic-elastic formulas that can separate or weaken tissue effects are established by experiments using specific waveforms (such as shear horizontal (SH) wave) or combination of more than two waveforms [19,20,21]. For example, Iwashimizu et al. [21] assumed that ultrasonic wave propagates along the direction parallel to the symmetrical axis of orthogonal materials, the effect of anisotropy was retained in the second-order elastic constants, and the effect of isotropy in third-order elastic constants was neglected. Thompson et al. [22] separated the texture effect from the stress effect by plane SH waves, whose propagation directions were perpendicular to each other. Walaszek et al. [23] used LCR method to measure the longitudinal residual stress in butt plate welding, with the results being in good agreement with that of the small hole method. These studies are useful explorations for ultrasonic nondestructive tests of stress in anisotropic materials, and have certain reference significance, but their shortcomings are also obvious. For example, most of the acoustic–elastic formulas derived from theory contain parameters such as elastic strain, plastic strain, and principal tensile rate. These complex parameters can be determined by elastic–plastic experiments. Therefore, it is difficult to popularize and apply in practice. It is necessary to develop special ultrasonic transducers for stress detection by using specific waveforms or combinations of different types of waveforms, and most of them remain at the experimental observation level, lacking in deep theoretical analysis.
The objective of this research was to explore the stress measurement mechanism of laser forming parts based on LCR wave method. For this purpose, SLM forming specimens made of 316 L stainless steel were manufactured using meander, stripe, and chessboard scanning strategies. The LCR wave method was used to test stress on the surface of SLM forming specimens. The results show that the anisotropic microstructure of SLM forming parts has an unneglectable effect on the LCR wave stress test. Inhomogeneous deformation of anisotropic SLM forming layers result in the appearance of “wave-type” fluctuations in acoustic-elastic curve during plastic deformation stage. In addition, the acoustic-elastic coefficient varies with scanning strategy, and the acoustic-elasticity equations to measure stress in SLM forming parts made of 316 L stainless steel are given in this research.

2. Acoustic-elastic Equation of LCR Wave Under Plane Stress

The principle of the LCR wave test for stress in media is shown in Figure 1. When the longitudinal wave signal is emitted by the transmitting transducer, the longitudinal wave obliquely incidents on the surface of media at the first critical angle θ 1 , according to Snell’s law. The LCR wave can be generated inside the medium. It propagates along the medium surface at a certain depth, the LCR wave penetration depth is related to the center frequency of the transducer [18].
Based on the propagation characteristics of LCR wave in the medium, the definition of surface coordinates of the specimen is shown in Figure 2. LCR wave propagates on the shallow surface of the medium. On the shallow surface of the medium the restraint along its thickness direction (a3 direction) is small, and it is a free surface. Therefore, σ 3 on the surface of elastic medium in a3 direction is 0. The stresses along a1 and a2 directions are respectively σ 1 , σ 2 . Therefore, the surface stress state of specimen can be simplified to plane stress state.
When the LCR wave propagates along the a1 direction on the surface of isotropic medium in stress state, the plane composed of a1 and a3 vectors is defined as the displacement vector plane of the LCR wave. Based on the acoustic–elastic theory and the above coordinate definition, Husson [24] considered that the variation of ultrasonic velocity caused by stress in isotropic media can be expressed as:
v 1 v 0 v 0 = k 1 σ 1 + k 2 σ 2
v 2 v 0 v 0 = k 2 σ 1 + k 1 σ 2
where, v0 is the velocity of LCR wave propagates in the medium under stress-free conditions. v1 and v2 are the velocities of LCR wave propagate along the a1 and a2 directions in the medium under stress condition, respectively. k1, k2 are called the acoustic–elastic coefficient, which are respectively the functions of second-order elastic constants (λ, μ) and third-order elastic constants (l, m, n) of the medium [25].
It can be seen from Equations (1) and (2) that the value of stress can be calculated indirectly by measuring the variation of the LCR wave velocity propagates in the medium under stress conditions. However, it is not easy to measure the variation of the LCR wave velocity as the acoustic–elasticity effect is not obvious. Therefore, the difference in time of flight in the ultrasonic distance measurement is used to reflect the variation of the LCR wave velocity. If the distance between the transducers is l0, the LCR wave velocity is expressed as:
v 0 = l 0 t 0 , v 1 = l 0 t 1 , v 2 = l 0 t 2
where, t0 is the time of flight in ultrasonic distance measurement under stress-free conditions; and t1 and t2 are the times of flight in ultrasonic distance measurement along the a1 and a2 directions under stress conditions, respectively. Equation (3) is introduced into Equations (1) and (2) after simplification, whereby the expression between ultrasonic propagation time and stress is obtained as follows:
t 0 ( t 0 t 1 ) t 1 = k 1 σ 1 + k 2 σ 2
t 0 ( t 0 t 2 ) t 2 = k 1 σ 1 + k 2 σ 2
The propagation velocity of the LCR wave in the medium is little affected by the stress, that is, t1t2t0, but t0t1 ≠ 0 and t0t2 ≠ 0, Therefore, Equations (4) and (5) can be simplified as follows:
t 0 t 1 = k 1 σ 1 + k 2 σ 2
t 0 t 2 = k 2 σ 1 + k 1 σ 2
Due to the t0 being the reference signal, throughout the paper t1t0 and t2t0 will be used to replace t0t1 and t0t2 in Equations (6) and (7).

3. Experimental Procedure

3.1. Specimen Preparation

316L stainless steel spherical powder was used to prepare the specimen by SLM technology. The maximum particle size of the powder is 60 µm and the minimum particle size is 45 µm, the apparent density is 4.42 g/cm3. The chemical composition of the powder is shown in Table 1. An AM400 SLM (Renishaw, Gloucestershire, West London, UK) additive manufacturing system was used in the experiment. GB/T3075-2008 [26] was used for tensile specimens. The size of the specimen is shown in Figure 3. The optimized processing parameters were selected, as shown in Table 2.
Many scholars have studied the influence of the scanning strategy on residual stress distribution in SLM parts [3,4,27], so meander, stripe, and chessboard scanning strategies were used in the experiment for the study of stress in SLM forming parts. The scanning paths of the three scanning strategies are shown in Figure 4, Figure 5 and Figure 6. For the three scanning strategies, the divisional direction rotation mechanism is adopted. The scan vectors are rotated by 67° between sub-areas of the adjacent two layers.
When the meander scanning strategy is adopted, the cross section of the forming part is filled with a linear scanning vector, as shown in Figure 4a. The scanning lines belonging to the same layer are parallel to each other. The orientations of the two adjacent scan vectors are opposite. When the scanning interval is set to 0.065 mm, which is less than the spot diameter (0.08 mm), the compactness of the SLM forming part can be ensured.
For the stripe scanning strategy, the cross section is divided into isometrical rectangle sub-areas allowing a small amount of overlap between the two adjacent rectangle sub-areas in the same layer. The overlap area was 0.08 mm which was equal to the spot diameter in the experiment. The stripe scanning lines follow the rules that the orientations of the scan vectors in the same sub-areas are parallel to each other and are perpendicular to the boundaries of the two adjacent sub-areas. The length of the scan vector is limited by the width of the rectangle sub-area. As shown in Figure 5a, the sub-areas are scanned successively in the order of down to top, left to right.
For the chessboard scanning strategy, a literal chessboard style is followed, the cross section is divided into the isometrically square sub-areas, and the scan vectors in two adjacent sub-areas are orthogonal. As shown in Figure 6a, the sub-areas are scanned line by line, according to their order of arrangement in the same layer, and the sub-areas with the same scan vectors are successively scanned first before the sub-areas with different scan vectors in the same line. The length of the scan vector is equal to the width of the square sub-area. The width of the sub-area is suitable for the choice of 5–7 mm [28]. Therefore, the area width selected in the experiment is 5 mm. Three kinds of specimens manufactured using meander, stripe, and chessboard scanning strategies are manufactured. Five specimens for each scanning strategy are manufactured, and the processing parameters shown in Table 2 are used during specimen preparation.

3.2. Experimental System

The ultrasonic test system is shown in Figure 7. The Panametrics-NDT 5800PR ultrasonic pulse transmitting instrument (Waltham, MA, USA), and the TDS5000B oscilloscope with 2.5 GHz sampling frequency (Tektronix, Beaverton, OR, USA) were used in the experiment. A transmitting transducer and a receiving transducer (SIUI, Shantou, China) with diameter of 6 mm and 5 MHZ center frequency were used for transmitting and receiving signals. The distance between the two transducers was 25 mm. The bandwidth of the transducer was 2.5–7.5 MHz. The transducer and the acoustic wedge were fixed together. Prior to applying the TM-100 medical ultrasonic couplant (Xiyuan temple, Tianjin, China) to the acoustic wedge and the surface of the specimen, the surface of the specimen was wiped to keep the contact surface completely clean. Then the specimen and the transducer were wound with an elastic band, to ensure the fixed position of the transducer was stable during the experiment. The testing temperature was 25 °C. The computer worked with the ultrasonic test set-up for signal acquisition and processing.
The specimens were annealed for acquiring the zero-stress state. The time of flight ti0 (i = 1, 2, represents the LCR wave propagation direction) in ultrasonic distance measurement (25 mm) in the surface of the specimen were recorded as reference signals. The received time domain signals for the specimens (manufactured using meander scanning strategy) under the zero-stress state are shown in Figure 8. In order to measure the time of flight ti (i = 1, 2) in ultrasonic distance measurement in the surface of the specimen under different stress states, the tensile testing of the specimen was carried out on the WDW-200E universal testing machine (Youdao Material Testing Machine Co., Ltd., Jinan, China). Five specimens for each scanning strategy were tested. During the experiment, the specimens were tested under the load from zero to fracture. The load interval was 2 KN, and it was slowly loaded to the predetermined load at the loading speed of 1KN/s. The loading direction and the LCR wave propagation direction are shown in Figure 9. Five times of data were collected along the a1 and a2 directions under each load.

4. Experimental Results

4.1. Calibration of the Acoustic–Elastic Coefficient

Three kinds of specimens were tested according to the configuration described above. The signal collected under the zero-stress state was used as reference signal, and the signal collected under different stress states was used as the testing signal. Acoustic time difference (Δti = titi0, i = 1, 2) between the testing signal and the reference signal was determined by the cross correlation method [29]. The test results are shown in Figure 10, Figure 11 and Figure 12. As can been seen from the figures, the acoustic-elastic curves in the a1 and a2 directions can be divided into two parts: linear and non-linear. The stresses at the turning point of the curves are called critical stress. The specimens were being elastic deformation when the stress was less than the critical stress. The acoustic time difference varied linearly with the stress, which is consistent with the results expressed by Equations (6) and (7). There was a positive linear relation in the a1 direction, and a negative linear relation in the a2 direction. The specimens were being plastic deformation when the stress was greater than the critical stress. In practical applications, when the stress damage of the SLM forming parts reaches the plastic deformation level, which are no longer met the basic requirements of servicing conditions, it is not necessary to fit the acoustic–elastic curves at this stage. The linear part of acoustic-elastic curves in the a1 and a2 directions were fitted by the least square method [30] based on the criterion of a high correlation coefficient and small standard deviation [30,31]. Figure 13a,b show the Linear fitting results, and Equations (8)–(10) show the fitting results. Figure 13a,b are plotted according to the average value of the test results, where the critical stress values of the three kinds of specimens are 371 MPa, 474 MPa, and 492 MPa. The relevant statistical data is shown in Table 3. k1 and k2 are the linear fitting coefficients in a1 and a2 directions, respectively. As shown in Table 3, the standard deviations are very small; therefore the test results are reliable.
(8) Meander scanning : { Δ t 1 = 0.0781 σ 1 2.559 Δ t 2 = 0.0258 σ 1 0.912 (9) Stripe scanning : { Δ t 1 = 0.0566 σ 1 0.885 Δ t 2 = 0.0206 σ 1 0.523 (10) Chess board scanning : { Δ t 1 = 0.0544 σ 1 + 1.783 Δ t 2 = 0.0191 σ 1 + 0.505

4.2. Analysis of Linear Part in Acoustic-Elastic Curves

As shown in Figure 13, when the stress is less than the critical stress, the acoustic time difference varied linearly with the stress. According to Equations (8)–(10), the elastic coefficients in a1 direction are 0.0781 ns MPa−1, 0.0566 ns MPa−1, and 0.0544 ns MPa−1. The acoustic-elastic coefficients in a2 direction are −0.0258 ns MPa−1, −0.0206 ns MPa−1, and −0.0191 ns MPa−1. Thus, it can be seen that in the same specimen, the acoustic-elastic coefficient parallel to the LCR wave propagation direction is about three times that than perpendicular to LCR wave propagation direction. The acoustic–elastic coefficients and constant terms vary with the specimens manufactured using different scanning strategies, as the mechanical properties and microstructures of the specimens are different. The stress-strain curves of the three kinds of specimens are shown in Figure 14, Figure 15 and Figure 16, and tensile properties parameters of the specimens manufactured using meander, stripe, and chessboard scanning strategies are shown in Table 4 (the three kinds of specimens are marked as A, B, C). This indicates that tensile strength, yield strength, elastic modulus, and the maximum strain of the SLM forming parts vary with the scanning strategy, and the differences of tensile properties of the same type of specimen are small. Reasonable sub-area and staggered scanning sequences can significantly improve the tensile properties of the SLM specimens. The experiment results show that the better the tensile properties of the specimens are, the smaller the absolute values of the acoustic–elastic coefficients in the same direction are. As shown in Figure 17a–c, the variety of defects, such as inclusions and micro-holes, inevitably exist in the SLM forming specimens. Obviously, there are more defects existing in the specimen whose tensile properties are worse. Thus, under the action of stress, specimens with more defects are more likely to deform, therefore the change rate of the propagation velocity of the LCR wave is larger and the absolute value of the corresponding acoustic–elastic coefficients are also larger, which is consistent with the test results.
Figure 17 shows the microscopic fracture morphology of tensile specimens. As can be seen from the Figure 17, all the specimens exhibited ductile fracture with dimples. The fracture surfaces show obvious dimple characteristics and good plasticity macroscopically. As shown in Figure 17a–c, there are many micro-holes on the surface of the fracture, and many micro-holes are formed by inclusion fragmentation. Under the action of stress, these voids grow continuously, and aggregate to form dimples and large voids. 316 L stainless steel is sensitive to voids. Voids accumulate and eventually lead to the fracture of the specimen. Its fracture mechanism is dimple-micropore aggregation.
Stress-strain curves in Figure 14, Figure 15 and Figure 16 show that the tensile properties of the specimens vary with the scanning strategies, however, the tensile process can all be divided into elastic deformation and plastic deformation stages. The stress at the turning point of the acoustic-elastic curve is less than the yield stress at the stress-strain curve. Based on the acoustic-elastic theory and the microstructural analysis of the specimens, the causes of this phenomenon are analyzed. Figure 18 shows the microstructures of the specimens. Microstructures of 316 L stainless steel specimens manufactured by SLM technology mainly consists of columnar, cellular, and equiaxed crystals. Specimens were prepared by multi-channel overlapping and multi-layer stacking, therefore there are arc-shaped fusion interfaces within the microstructure. The formation of columnar and cellular crystals in the microstructure are due to the large temperature gradient during SLM forming, which is a process of rapid heating and cooling, and this rapid change of temperature promotes the formation of columnar and cellular crystals [32,33]. In the same molten pool, the growth direction of columnar and cellular crystals is perpendicular or at a certain angle to the fusion interface, which shows that 316 L stainless steel specimens manufactured by SLM technology have obvious anisotropic characteristics. Therefore, when the specimen is subjected to tensile loading, the fusion interfaces and anisotropic structure will lead to uneven deformation in different sub-areas of the specimen. When the stress is greater than critical stress, the deformation of some sub-areas (fusion interfaces, defects, columnar and cellular crystal boundaries, etc.) are larger than other sub-areas (equiaxed crystal areas). Therefore the areas with large deformations first enter the plastic deformation stage, and meanwhile the areas with small deformations are still in the elastic deformation stage, the higher the stress is, the larger the plastic deformation area is. The “average deformation” of the specimen in ultrasonic distance measurement has entered the plastic deformation stage, therefore the variation law of the LCR wave signal varies with stress no longer conforming to the linear law, however, the specimen hasn’t entered the plastic deformation stage. When the stress has increased to yield stress, the plastic deformation region is extended to the whole specimen, and the specimen enters the plastic deformation stage.

4.3. Analysis of Non-Linear Parts in Acoustic-Elastic Curves

As shown in Figure 13, when the stress is greater than the critical stress, the acoustic–elastic curves appear a style of wave trend. Experiment results show that the SLM forming specimens manufactured with 316 L stainless steel have a good plastic deformation ability in the static tension process. Plastic deformation is the main factor affecting the fluctuation of non-linear parts in acoustic–elastic curves. Therefore, the variation rule of the acoustic–elastic curves within this stress range is theoretically analyzed based on the theory of metal plastic deformation. Plastic deformation of metal is achieved by dislocation motion [34]. Dislocations include as-grown dislocations and induced dislocations. As-grown dislocations are defects in crystals. Induced dislocations are formed by the adjustment of lattice structure when crystals are subjected to stress. Under the action of stress, the dislocations move along the direction of Bernard vectors on the slip surface [35,36]. As shown in Figure 18, the microstructures of SLM specimens show obvious anisotropic characteristics. Directional growth of columnar, cellular grain boundaries, and fusion interfaces are obstacles to dislocation movement. When the force driving the forward movement of dislocations cannot overcome the resistance of the obstacles, dislocation pile-up group will occur. With the increase of the number of dislocations in the pile-up group, the stress in the local region increases gradually. As the fracture mechanism of the specimen is dimple-micropore aggregation, the stress concentration produced by dislocation pile-up cannot be released by plastic deformation. When the dislocation pile-up stress reaches the crystal fracture strength, cracks will appear in the crystals. With the increase of the stress, the cracks formed in SLM specimens gradually expand and the size gradually increases. The theory of crack propagation [37] shows that the crack propagation depends mainly on the relationship between the stress value at the crack tip and the fracture strength of the material. Generally speaking, the parameter K which characterizes the stress field intensity factor at the crack tip in the material can be expressed as [37,38]:
K = Y σ a
where Y is the shape factor of the crack, which is a dimensionless coefficient; σ is the mean stress (MPa); and a is half-length of crack (mm). Equation (11) shows that when the crack is in the critical state of propagation, the stress field intensity factor can be expressed as Kc:
K c = Y σ c a c
where σc is the mean stress in critical state (MPa); and ac is the half-length of crack in critical state (mm).
According to the theory of crack propagation, K > Kc is the necessary condition for the unstable propagation of crack. The crack size expands continuously through the propagation. The aggregation of adjacent microcracks results in visible microvoids. Under the action of continuous stress, the microvoids grow and proliferate gradually until the specimen breaks. For 316 L stainless steel SLM specimens, when the LCR wave propagates along the direction parallel to the tensile load and the stress σ < σc, the crack does not propagate, the stress at the crack tip increases gradually with the increase of stress, and thus the propagation velocity of the LCR wave in the surface of SLM specimen decreases gradually. Therefore the acoustic time difference increases and the non-linear part of acoustic-elastic curves in Figure 10a fluctuate upward. When the stress σ > σc, the crack begins to propagate and the stress is released with the propagation of cracks, and the propagation velocity of the LCR wave in the surface of SLM specimen increases gradually, so the acoustic time difference decreases and the acoustic-elastic curves in Figure 10a fluctuates downward. Similarly, when the LCR wave propagates along the direction perpendicular to the tensile load, with the concentration–release-concentration of the stress in specimen, the non-linear part of the acoustic-elastic curves in Figure 10b fluctuates downward–upward–downward. When the crack extends to a new length, according to Equation (12), with the increase of crack size, only the new critical state is satisfied can the crack reach the condition of unstable propagation, and the crack is in a temporary stable state. With the increase of stress, the new critical state of crack propagation is satisfied, and the crack continues to expand. With the instability of crack propagation in the specimen, the stress concentration–release–concentration process occurs. Therefore, when the stress reaches critical value, with the increase of stress, the acoustic–elastic curves in SLM specimens appear a style of wave trend.
The above theoretical analysis was validated by the ultrasonic microscopic imaging method [39]. The defects imaging was realized by analyzing and comparing the intensity of reflected signal, and the imaging results have the characteristics of high definition and strong contrast [40]. As shown in Figure 19, the ultrasonic microscope testing equipment VUE 250-P (OKOS, Manassas, VA, USA) was used in the experiment. The SLM specimens manufactured using stripe scanning strategy were imaged. The stress states of the tested specimens were 20 MPa and 400 MPa. The central frequency of the longitudinal wave signal was chosen as 100 MHz, and the sampling rate recording the receiving signals was set to 110 MHz. According to the loading mode of the specimen, the specimens were scanned globally along the path parallel to the loading direction. The scanning path and results are shown in Figure 20.
It can be seen from Figure 20 that the imaging results of specimen (stress state is 20 MPa) are basically uniform in color distribution, and that “stripe” areas with uneven color appear in the imaging results of the specimen (stress state is 400 MPa). According to the principle of ultrasonic microscopic imaging, the large difference of color brightness in imaging results indicates a large defect size in the tested specimen, and vice versa. The imaging results show that there were several small cracks that had emerged in the specimen (stress state is 400 MPa), however, there were few cracks in the specimen (stress state is 20 MPa), which is basically consistent with the results of the aforementioned mentioned theory analysis.

4.4. Acoustic-Elastic Equations for Testing Stress in 316 L Stainless Steel SLM Parts

When the LCR wave method is used to test stress in SLM forming parts, the time of flight t in ultrasonic distance measurement in the surface of the part can be expressed as [41,42]:
t = t 0 + Δ t T + Δ t M + Δ t S + Δ t R + Δ t C
where t0 is the time of flight in ultrasonic distance measurement when the part is homogeneous, isotropic and stress-free; and ΔtT, ΔtM, ΔtS, ΔtR, and ΔtC are the influences of temperature, microstructure, stress, surface roughness, and coupling mode, on the time of flight, respectively.
In the actual testing process, when the temperature, surface roughness and coupling mode remain unchanged, the acoustic time difference is Δti = titi0 = ΔtM + ΔtS, so as shown in Equations (8)–(10), the acoustic time difference varied linearly with the stress. The constant terms in Equations (8)–(10) indicate the acoustic time difference is caused by the microstructure of material. As shown in Figure 18, 316 L stainless steel specimens manufactured by SLM technology have obvious anisotropic characteristics, and the microstructures vary with the change of the fixed positions of the transducers in the specimen manufactured using the same scanning strategy. According to the ultrasonic propagation theory, due to the influence of the anisotropic tissue effect, the ultrasonic longitudinal wave appears to be a complex physical phenomenon such as beam deflection and focusing in the process of propagation [43,44]. In order to evaluate the effect of anisotropic structures on testing results objectively, the SLM specimen was prepared with the same process parameters (meander scanning strategy was adopted), and the specimen was annealed. Using the same detection method as described above, the LCR wave signals at four different positions on the surface of the specimen were collected, and the results are shown in Figure 21. When the specimen is in stress-free state, the time of flight of the LCR wave signal propagating along the same direction in the fixed ultrasonic path (25 mm) is not the same, the average variation is 2.43 ns, the constant term in acoustic–elastic Equation (8) is 2.559, and there is no significant difference between them. Therefore, it can be considered that the constant terms in Equations (8)–(10) indicate the acoustic time difference is caused by the microstructure of material.
Therefore, the acoustic–elastic equations for testing stress in 316 L stainless steel SLM parts are as follows:
( 14 ) Meander scanning : { Δ t 1 = 0.0781 σ 1 0.0258 σ 2 2.559 Δ t 2 = 0.0258 σ 1 + 0.0781 σ 2 0.912 ( 15 ) Stripe scanning : { Δ t 1 = 0.0566 σ 1 0.0206 σ 1 0.885 Δ t 2 = 0.0206 σ 1 + 0.0566 σ 2 0.523 ( 16 ) Chess board scanning : { Δ t 1 = 0.0544 σ 1 0.0191 σ 2 + 1.783 Δ t 2 = 0.0191 σ 1 + 0.0544 σ 2 + 0.505
where Δt1 and Δt2 are the acoustic time difference in ultrasonic distance measurement along the directions perpendicular to each other; and σ1 and σ2 are the stresses corresponding to the detection directions.

5. Discussion

The experimental results reported in this paper enable us to understand more accurately the mechanism of the LCR wave method to measure stress in selective laser melting forming parts According to the change rule of acoustic-elastic curve, the fracture mechanism of SLM forming parts under stress can be analyzed. The acoustic–elastic equations obtained in the experiments can be used to test stress in 316 L stainless steel SLM parts.
For SLM forming parts manufactured with 316 L stainless steel, the acoustic-elastic coefficient varies with the scanning strategy used in the forming process. For the same SLM forming parts, the acoustic-elastic coefficient parallel to the LCR wave propagation direction is about three times that of perpendicular to the LCR wave propagation direction, which is consistent with existing research [10]. Figure 10, Figure 11 and Figure 12 show the ultrasonic testing results of the three kinds of specimens manufactured using meander, stripe, and chess board scanning strategies respectively. The change rules of acoustic–elastic curves are closely related to the stress-strain characteristics of the specimen. The stress-strain characteristics of the specimen are determined by the mechanical properties and microstructure of the material. To further confirm the scanning strategy has an important effect on the mechanical properties of SLM forming specimens, the microstructure and properties of the specimens are characterized by SEM and static tensile tests. Figure 14, Figure 15 and Figure 16 show that the scanning strategy can significantly affect the mechanical properties of the SLM forming parts. Reasonable sub-area and staggered scanning sequences can improve the mechanical properties of the SLM specimens. Figure 18 shows 316 L stainless steel specimens manufactured by SLM technology have obvious anisotropic characteristics. Therefore, when the specimen is subjected to tensile loading, the deformation of the specimen is not uniform. This leads to the stress at the turning point of acoustic–elastic curve being less than the yield stress at the stress-strain curve. Figure 17 shows there are more defects existing in the specimen whose mechanical properties are worse, so the specimens with more defects are more likely to deform under the action of stress, therefore the absolute values of the corresponding acoustic-elastic coefficients are also larger.
We also analyzed the variation law of the acoustic–elastic curve combined with acoustic–elasticity theory and the microstructure of the specimens. It can be observed (Figure 20) that when the stress is 400 MPa, many small cracks emerge inside the specimen. The crack size expands continuously through the propagation, which results in the acoustic-elastic curves appearing a style of wave trend.

6. Conclusions

In this paper, the LCR wave method was used to explore the regularity of the dependence of acoustic time difference in ultrasonic distance measurement on the stress in SLM forming parts. For the purpose, an effective testing system was established and the corresponding tests were carried out in this study.
  • It demonstrates that the absolute values of the acoustic–elastic coefficients show a significant dependence on the scanning strategies used in the SLM forming process, and the mechanical properties of the specimen vary with the scanning strategy [27,45]. For the specimen whose mechanical properties are better, the absolute values of the corresponding acoustic-elastic coefficients were less.
  • The test results reveal that when the stress in an anisotropic SLM specimen is greater than critical stress and less than yield stress, many small cracks emerge inside the specimen. This indicates the specimen has entered the failure stage. This phenomenon reflects the sensibility of this method.
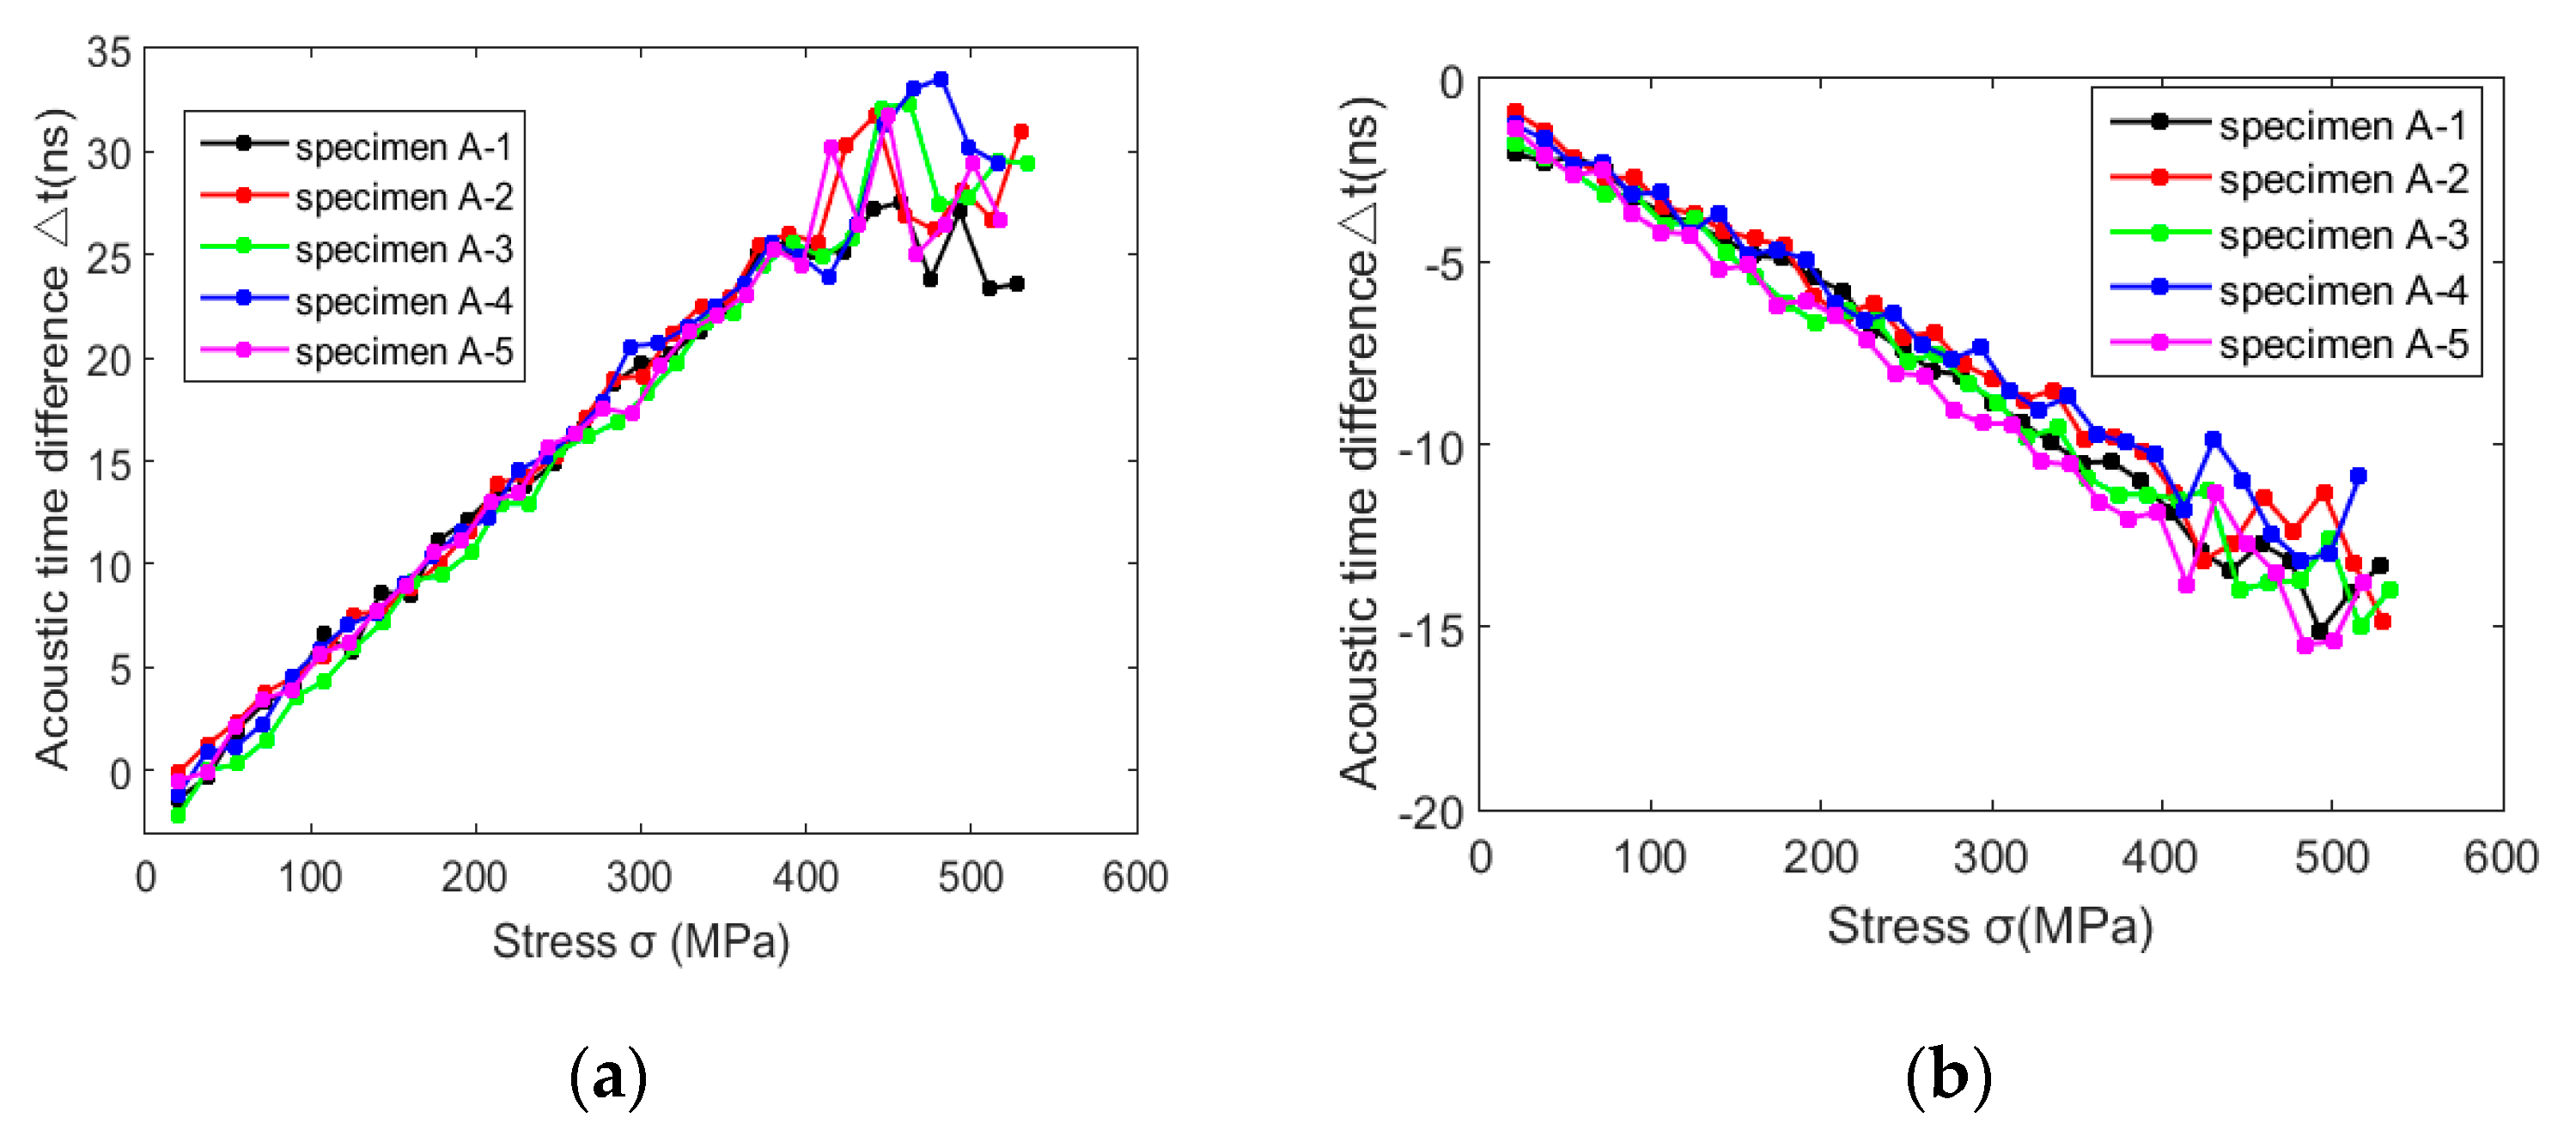
  • As the 316 L stainless steel specimens manufactured by SLM technology present obvious anisotropic characteristics, the time of flight in ultrasonic distance measurement along the detection direction will be influenced by the anisotropic tissue. Generally, acoustic time difference in ultrasonic distance measurement keeps at nanosecond level, even if the influence of the anisotropic tissue on the acoustic time difference is very small, the influence on the reliability of stress detection results cannot be ignored. As shown in Equations (14)–(16), due to the acoustic-elastic coefficient being very small, the small fluctuation of acoustic time difference can lead to remarkable change in stress testing results. The test results indicate that the influence of anisotropic tissue on the test results can be characterized by the constant term in the linear acoustic-elastic formula, when other influencing factors in the experiment are excluded. Therefore when the LCR wave method is used to test stress, the influence of anisotropic tissue should be considered in characterizing stress in SLM forming parts.
  • In any case, the sensibility of the LCR wave method to test stress has been widely proven and the robustness and stability will be particularity important in further research.

Author Contributions

Methodology, Formal Analysis, Writing-Original Draft Preparation: X.Y.; Experiments, X.X.; Data Curation: Q.P. All authors have read and agreed to the published version of the manuscript.

Funding

This research was funded by General Project of Scientific Research Plan of Beijing Municipal Commission of Education (Grant No. KM201810011001), National Natural Science Foundation of China (Grant No.51375493).

Acknowledgments

Special thanks to the administration team of General Project of Scientific Research Plan of Beijing Municipal Commission of Education.

Conflicts of Interest

The authors declare no conflict of interest.

References

  1. Fu, L.D.; Shi, Y.S.; Zhang, W.X.; Liu, J.H.; Lu, Z.L. The process research of 316 L stainless steel in selective laser melting. Appl. Laser 2008, 28, 108–111. [Google Scholar]
  2. AlMangour, B.; Grzesiak, D.; Yang, J.M. In-situ formation of novel TiC-particle-reinforced 316L stainless steel bulk-form composites by selective laser melting. J. Alloy. Compd. 2017, 706, 409–418. [Google Scholar] [CrossRef]
  3. Ali, H.; Ma, L.; Ghadbeigi, H.; Mumtaz, K. In-situ residual stress reduction, martensitic decomposition and mechanical properties enhancement through high temperature powder bed pre-heating of selective laser melted Ti6Al4V. Mater. Sci. Eng. 2017, 695, 211–220. [Google Scholar] [CrossRef]
  4. Lu, Y.J.; Wu, S.Q.; Gan, Y.L.; Huang, T.T.; Yang, C.G.; Lin, J.J.; Lin, J.X. Study on the microstructure, mechanical property and residual stress of SLM Inconel-718 alloy manufactured by differing island scanning strategy. Opt. Laser Technol. 2015, 75, 197–206. [Google Scholar] [CrossRef]
  5. Yan, X.L.; Pang, J.C.; Jing, Y.L. Ultrasonic measurement of stress in SLM 316 Lstainless steel forming parts manufactured using different scanning strategies. Materials 2019, 12, 2719. [Google Scholar] [CrossRef] [Green Version]
  6. Mugwawa, L.; Dimitrov, D.; Matope, S.; Yadroitsev, I. Evaluation of the impact of scanning strategies on residual stresses in selective laser melting. Int. J. Adv. Manuf. Technol. 2019, 102, 2441–2450. [Google Scholar] [CrossRef]
  7. Wang, D.; Wu, S.B.; Yang, Y.Q.; Dou, W.H.; Deng, S.S.; Wang, Z.; Li, S. The Effect of a scanning strategy on the residual stress of 316 L steel parts fabricated by selective laser melting (SLM). Materials 2018, 11, 1821. [Google Scholar] [CrossRef] [Green Version]
  8. Yadroitsev, I.; Yadroitsava, I. Evaluation of residual stress in stainless steel 316L and Ti6Al4V samples produced by selective laser melting. Virtual Phys. Prototyp. 2015, 10, 67–76. [Google Scholar] [CrossRef]
  9. Yan, X.L.; Dong, S.Y.; Xu, B.S.; Cao, Y. Progress and challenges of ultrasonic testing for stress in remanufacturing laser cladding coating. Materials 2018, 11, 293. [Google Scholar] [CrossRef] [Green Version]
  10. Wang, W.; Zhang, Y.M.; Zhou, Y.F.; Meng, S.H.; Chen, D.K.K. Plane stress measurement of orthotropic materials using critically refracted longitudinal waves. Ultrasonics 2019, 94, 430–437. [Google Scholar] [CrossRef]
  11. Liu, H.B.; Li, Y.P.; Li, T.; Zhang, X.; Liu, Y.K.; Liu, K.; Wang, Y.Q. Influence factors analysis and accuracy improvement for stress measurement using ultrasonic longitudinal critically refracted (LCR) wave. Appl. Acoust. 2018, 141, 178–187. [Google Scholar] [CrossRef]
  12. Zhu, Q.M.; Chen, J.; Gou, G.Q.; Chen, H.; Li, P. Ameliorated longitudinal critically refracted-attenuation velocity method for welding residual stress measurement. J. Mater. Process. Technol. 2017, 246, 267–275. [Google Scholar] [CrossRef]
  13. Kwaśniewki, J.; Dominik, I.; Lalik, K.; Holewa, K. Influence of acoustoelastic coefficient on wave time of flight in stress measurement in piezoelectric self-excited system. Mech. Syst. Signal Process. 2016, 78, 143–146. [Google Scholar] [CrossRef]
  14. El-Hadek, M.A. Dynamic equivalence of ultrasonic stress wave propagation in solids. Ultrasonics 2018, 83, 214–221. [Google Scholar] [CrossRef]
  15. Hughes, D.S.; Kelly, J.L. Second-order elastic deformation of solids. Phys. Rev. 1953, 92, 1145. [Google Scholar] [CrossRef]
  16. Johnson, G.C. Acoustoelastic theory for elastic-plastic materials. J. Acoust. Soc. Am. 1981, 70, 591–595. [Google Scholar] [CrossRef]
  17. Johson, G.C. The effect of plastic deformation on the acoustoelastic response of metals. J. Appl. Mech. 1983, 50, 689–691. [Google Scholar] [CrossRef]
  18. Rose, J.L. Ultrasonic Waves in Solid Media; Cambridge University Press: Cambridge, UK, 2004. [Google Scholar]
  19. King, R.B.; Fortunko, C.M. Determination of in-plane residual stress states in plates using horizontally polarized shear waves. J. Appl. Phys. 1983, 54, 3027–3035. [Google Scholar] [CrossRef]
  20. Allen, D.R.; Sayeres, C.M. The measurement of residual stress in textured steel using an ultrasonic velocity combinations technique. Ultrasonics 1984, 7, 179–188. [Google Scholar] [CrossRef]
  21. Iwashimizu, Y.; Kubomura, K. Stress-induced rotation of polarization directions of elastic waves in slightly anisotropic material. Solids Struct. 1973, 9, 99–114. [Google Scholar] [CrossRef]
  22. Thompson, R.B.; Smith, J.F.; Lee, S.S. Microstructure-independent acoustoelastic measurement of stress. Appl. Phys. Lett. 1984, 44, 296–298. [Google Scholar] [CrossRef]
  23. Walaszek, H.; Hoblos, J.; Bourse, G.; Robin, C. Effect of microstructure on ultrasonic measurement of residual stress in welded joints. Mater. Sci. Forum 2002, 404–407, 875–880. [Google Scholar] [CrossRef]
  24. Husson, D. A perturbation theory for the acoustoelastic effect of surface waves. Am. Inst. Phys. 1985, 57, 1562–1568. [Google Scholar] [CrossRef]
  25. Castellano, A.; Fraddosio, A.; Marzano, S.; Piccioni, M.D. Some advancements in the ultrasonic evaluation of initial stress states by the analysis of the acoustoelastic effect. Procedia Eng. 2017, 1999, 1519–1526. [Google Scholar] [CrossRef]
  26. The Standardization Administration of China. GB/T3075-2008 Control Method of Axial Force in Fatigue Test of Metallic Materials; The Standardization Administration of China: Beijing, China, 2008.
  27. Parry, L.; Ashcroft, I.A.; Wildman, R.D. Understanding the effect of laser scan strategy on residual stress in selective laser melting through thermo-mechanical simulation. Addit. Manuf. 2016, 12, 1–15. [Google Scholar] [CrossRef] [Green Version]
  28. Bo, C.; Shrestha, S.; Chou, K. Stress and deformation evaluations of scanning strategy effect in selective laser melting. Addit. Manuf. 2016, 12, 240–251. [Google Scholar]
  29. Yan, X.L.; Dong, S.Y.; Xu, B.S.; Liu, B.; Wang, W.L. Cepstrum analysis method in surface acoustic wave signals time delay estimation. Vib. Shock. 2013, 32, 159–162. [Google Scholar]
  30. Owen, M. Practical Signal Processing; Cambridge University Press: Cambridge, UK, 2007. [Google Scholar]
  31. Liu, C.; Zhang, Z.; Tang, X. Sign normalised spline adaptive filtering algorithms against impulsive noise. Signal Process. 2018, 148, 234–240. [Google Scholar] [CrossRef]
  32. AlMangour, B.; Grzesiak, D.; Yang, J. Scanning strategies for texture and anisotropy tailoring during selective laser melting of TiC/316 L stainless steel nanocomposites. J. Alloys Compd. 2017, 728, 424–435. [Google Scholar] [CrossRef]
  33. Dai, D.H.; Gu, D.D.; Zhang, H.; Xiong, J.P.; Ma, C.L.; Hong, C.; Poprawe, R. Influence of scan strategy and molten pool configuration on microstructures and tensile properties of selective laser melting additive manufactured aluminum based parts. Opt. Laser Technol. 2018, 99, 91–100. [Google Scholar] [CrossRef]
  34. Helwany, S. Elasticity and Plasticity; John Wiley & Sons, Inc.: Hoboken, NJ, USA, 2007. [Google Scholar]
  35. Hibbeler, R.C. Mechanics of Materials, 10th ed.; Pearson: London, UK, 2016. [Google Scholar]
  36. Zhang, H.H.; Li, L.X.; An, X.M.; Ma, G.W. Numerical analysis of 2-D crack propagation problems using the numerical manifold method. Eng. Anal. Bound. Elem. 2010, 34, 41–50. [Google Scholar] [CrossRef]
  37. Riemer, A.; Leuders, S.; Thöne, M.; Richard, H.A.; Tröster, T.; Niendorf, T. On the fatigue crack growth behavior in 316L stainless steel manufactured by selective laser melting. Eng. Fract. Mech. 2014, 120, 15–25. [Google Scholar] [CrossRef]
  38. Mishra, R.K. A review on fracture mechanics in piezoelectric structures. Mater. Today Proc. 2018, 5, 5407–5413. [Google Scholar] [CrossRef]
  39. Wu, S.H.; Chen, Y.; He, S.Q. Application of scanning acoustic microscope for coat testing. Aerosp. Mater. Technol. 2005, 35, 55–57. [Google Scholar]
  40. Shaw, A.; Liu, J.F.; Yoon, S.W.; Declercq, N.F. Characterization of the geometry of microscale periodic structures using acoustic microscopy. Ultrasonics 2016, 70, 258–265. [Google Scholar] [CrossRef] [PubMed]
  41. Burkov, S.I.; Zolotova, O.P.; Sorokin, B.P.; Turchin, P.P. The analysis of the effect of homogeneous mechanical stress on the acoustic wave propagation in the La3Ga5SiO14/fused silica piezoelectric layered structure. Ultrasonics 2015, 55, 104–112. [Google Scholar] [CrossRef]
  42. Qozam, H.; Chaki, S.; Bourse, G.; Robin, C.; Walaszek, H.; Bouteille, P. Microstructure effect on the Lcr elastic wave for welding residual stress measurement. Exp. Mech. 2010, 50, 179–185. [Google Scholar] [CrossRef]
  43. Mizukami, K.; Ikeda, T.; Ogi, K. Measurement of velocity and attenuation of ultrasonic guided wave for real-time estimation of cure-dependent anisotropic viscoelastic properties of carbon fiber-reinforced plastics. Ultrasonics 2019, 99, 105952. [Google Scholar] [CrossRef]
  44. Liu, X.C.; Wu, B.; Qin, F.; He, C.F.; Han, Q. Observation of ultrasonic guided wave propagation behaviors in pre-stressed multi-wire structures. Ultrasonics 2017, 73, 196–205. [Google Scholar] [CrossRef]
  45. He, X.; Kong, D.J.; Song, R.G. Microstructures and properties of laser cladding Al-TiC-CeO2 composite coatings. Materials 2018, 11, 198. [Google Scholar] [CrossRef] [Green Version]
Figure 1. Schematic diagram of propagation of critical refraction longitudinal (LCR) wave.
Coatings 10 00005 g001
Figure 2. Surface coordinates of the medium.
Coatings 10 00005 g002
Figure 3. Schematic of tensile specimen (mm).
Coatings 10 00005 g003
Figure 4. Schematic of meander scanning strategy. (a) Scanning paths of layer N; (b) Scanning paths of layer N+1.
Coatings 10 00005 g004
Figure 5. Schematic of stripe scanning strategy. (a) Scanning paths of layer N; (b) Scanning paths of layer N + 1.
Coatings 10 00005 g005
Figure 6. Schematic of chessboard scanning strategy. (a) Scanning paths of layer N; (b) Scanning paths of layer N + 1. (c) Scanning sequence.
Coatings 10 00005 g006
Figure 7. Ultrasonic test system for signal generation and acquisition.
Coatings 10 00005 g007
Figure 8. The received time domain signal. (a) a1 direction; (b) a2 direction.
Coatings 10 00005 g008
Figure 9. Schematic of loading direction and LCR wave propagation direction.
Coatings 10 00005 g009
Figure 10. Ultrasonic testing results of the specimens manufactured using meander scanning strategy. (a) a1 direction; (b) a2 direction.
Coatings 10 00005 g010
Figure 11. Ultrasonic testing results of the specimens manufactured using stripe scanning strategy. (a) a1 direction; (b) a2 direction.
Coatings 10 00005 g011
Figure 12. Ultrasonic testing results of the specimens manufactured using chessboard scanning strategy. (a) a1 direction; (b) a2 direction.
Coatings 10 00005 g012
Figure 13. Linear fitting results of linear part of acoustic–elastic curves in a1 and a2 directions. (a) a1 direction. (b) a2 direction.
Coatings 10 00005 g013
Figure 14. Stress-strain curves of the specimens manufactured using meander scanning strategy. (a) Stress-strain curves. (b) Local enlarged drawing of stress-strain curves.
Coatings 10 00005 g014
Figure 15. Stress-strain curves of the specimens manufactured using stripe scanning strategy. (a) Stress-strain curves. (b) Local enlarged drawing of stress-strain curves.
Coatings 10 00005 g015
Figure 16. Stress-strain curves of the specimens manufactured using chessboard scanning strategies. (a) Stress-strain curves. (b) Local enlarged drawing of stress-strain curves.
Coatings 10 00005 g016
Figure 17. Microscopic fracture morphology of tensile specimens. (a) Meander scanning strategy. (b) Stripe scanning strategy. (c) Chess board scanning.
Coatings 10 00005 g017
Figure 18. Microstructures of SLM specimens. (a) Meander scanning strategy. (b) Stripe scanning strategy. (c) Chess board scanning strategy.
Coatings 10 00005 g018
Figure 19. VUE250-P Ultrasonic microscope testing equipment.
Coatings 10 00005 g019
Figure 20. The scanning path and ultrasonic microscopic imaging results of the specimens. (a) Scanning path of ultrasonic microscopic imaging. (b) Scanning imaging result of specimen (20 MPa). (c) Scanning imaging result of specimen (400 MPa).
Coatings 10 00005 g020
Figure 21. The received time domain signals corresponding to different detection positions. (a) Detection positions. (b) The received time domain signals.
Coatings 10 00005 g021
Table 1. Chemical compositions of 316L stainless steel spherical powder (mass fraction, %).
ElementCCrNiMoSiMnOPFe
Content0.0317.512.062.060.860.30.10.04Bal
Table 2. Main processing parameters.
Laser Power (W)Scanning Speed (mm/s)Layer Thickness (μm)Scanning Interval (mm)Spot Diameter (μm)Volume Fraction of Oxygen (%)
250750300.065800.03
Table 3. Linear fitting coefficients of selective laser melting (SLM) specimens.
Specimen NumberK1 (ns /MPa)K2 (ns /MPa)Critical Stress (MPa)
A-10.0801−0.0258373
A-20.0765−0.0246381
A-30.0776−0.0267377
A-40.0774−0.0236366
A-50.0789−0.0283359
Mean0.0781−0.0258371
Standard deviation0.00140.00188.78
B-10.0574−0.0206475
B-20.0546−0.0220479
B-30.0558−0.0195467
B-40.0550−0.0194486
B-50.0566−0.0215463
Mean0.0566−0.0206474
Standard deviation0.00130.00129.22
C-10.0543−0.0191481
C-20.0518−0.0177496
C-30.0542−0.0206501
C-40.0563−0.0199486
C-50.0560−0.0182498
Mean0.0544−0.0191492
Standard deviation0.00180.00128.50
Table 4. Tensile properties of SLM specimens under different scanning strategies.
Specimen NumberTensile Strength (MPa)Yield Strength (MPa)Elastic Modulus (N/mm2)The Maximum Strain (%)
A-1528465114,00717.4
A-2530470115,09218.4
A-3534472116,48917.6
A-4516450114,02318.0
A-5518453114,14317.0
Mean525.20462.00114,75017.68
Standard deviation7.829.981071.200.54
B-1620532151,06429.5
B-2611528151,79228.5
B-3590522154,26627.3
B-4595513154,76428.4
B-5604520151,35727.8
Mean604.00520.80152,65028.30
Standard deviation12.065.631732.300.82
C-1629532177,89633.2
C-2635534177,66535.6
C-3646550176,95334.6
C-4620526177,56235.0
C-5640528176,35632.8
Mean634.00534.00177,29034.24
Standard deviation10.029.48626.041.19

